

Frequency response of sound
Without application/computational tests, graphics card tests would be incomplete. Therefore, we will focus on this area outside of gaming that most hardware magazines neglect. We understand the reasons, there are several of them, but even so, it is possible with a little effort to make at least a few measurements. So hopefully they will also help multimedia creators in choosing the right graphics card.
Frequency response of sound
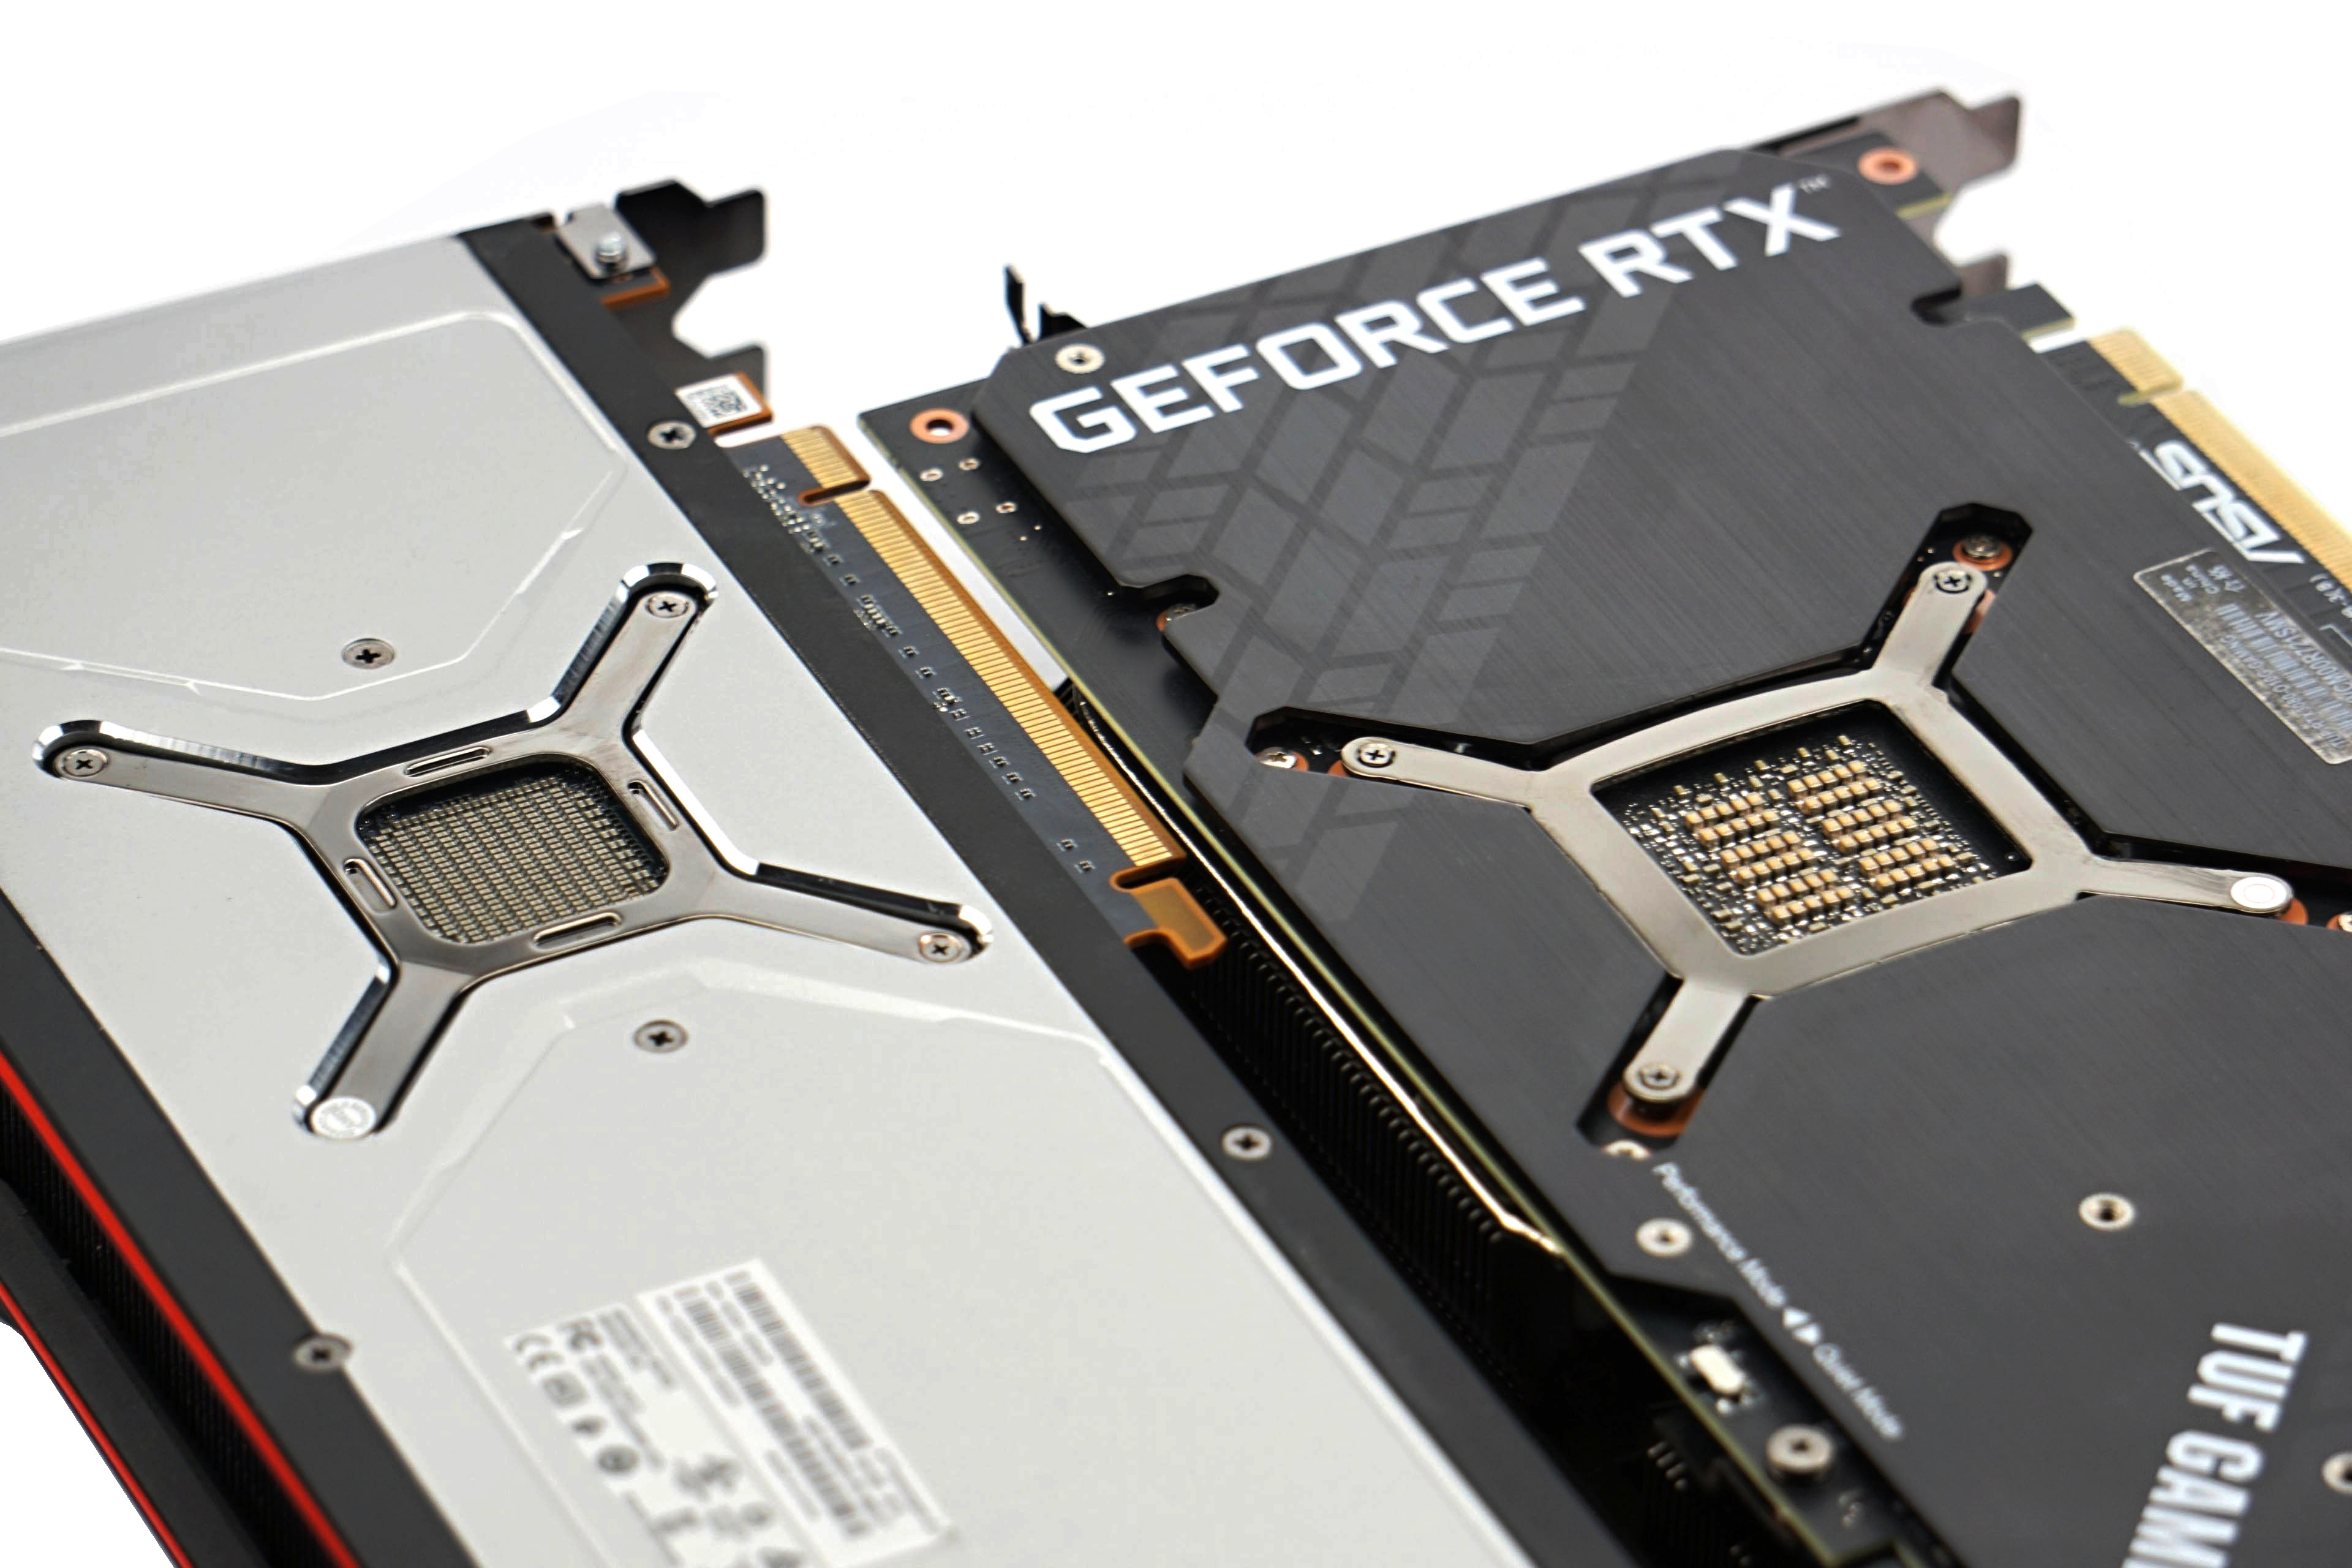
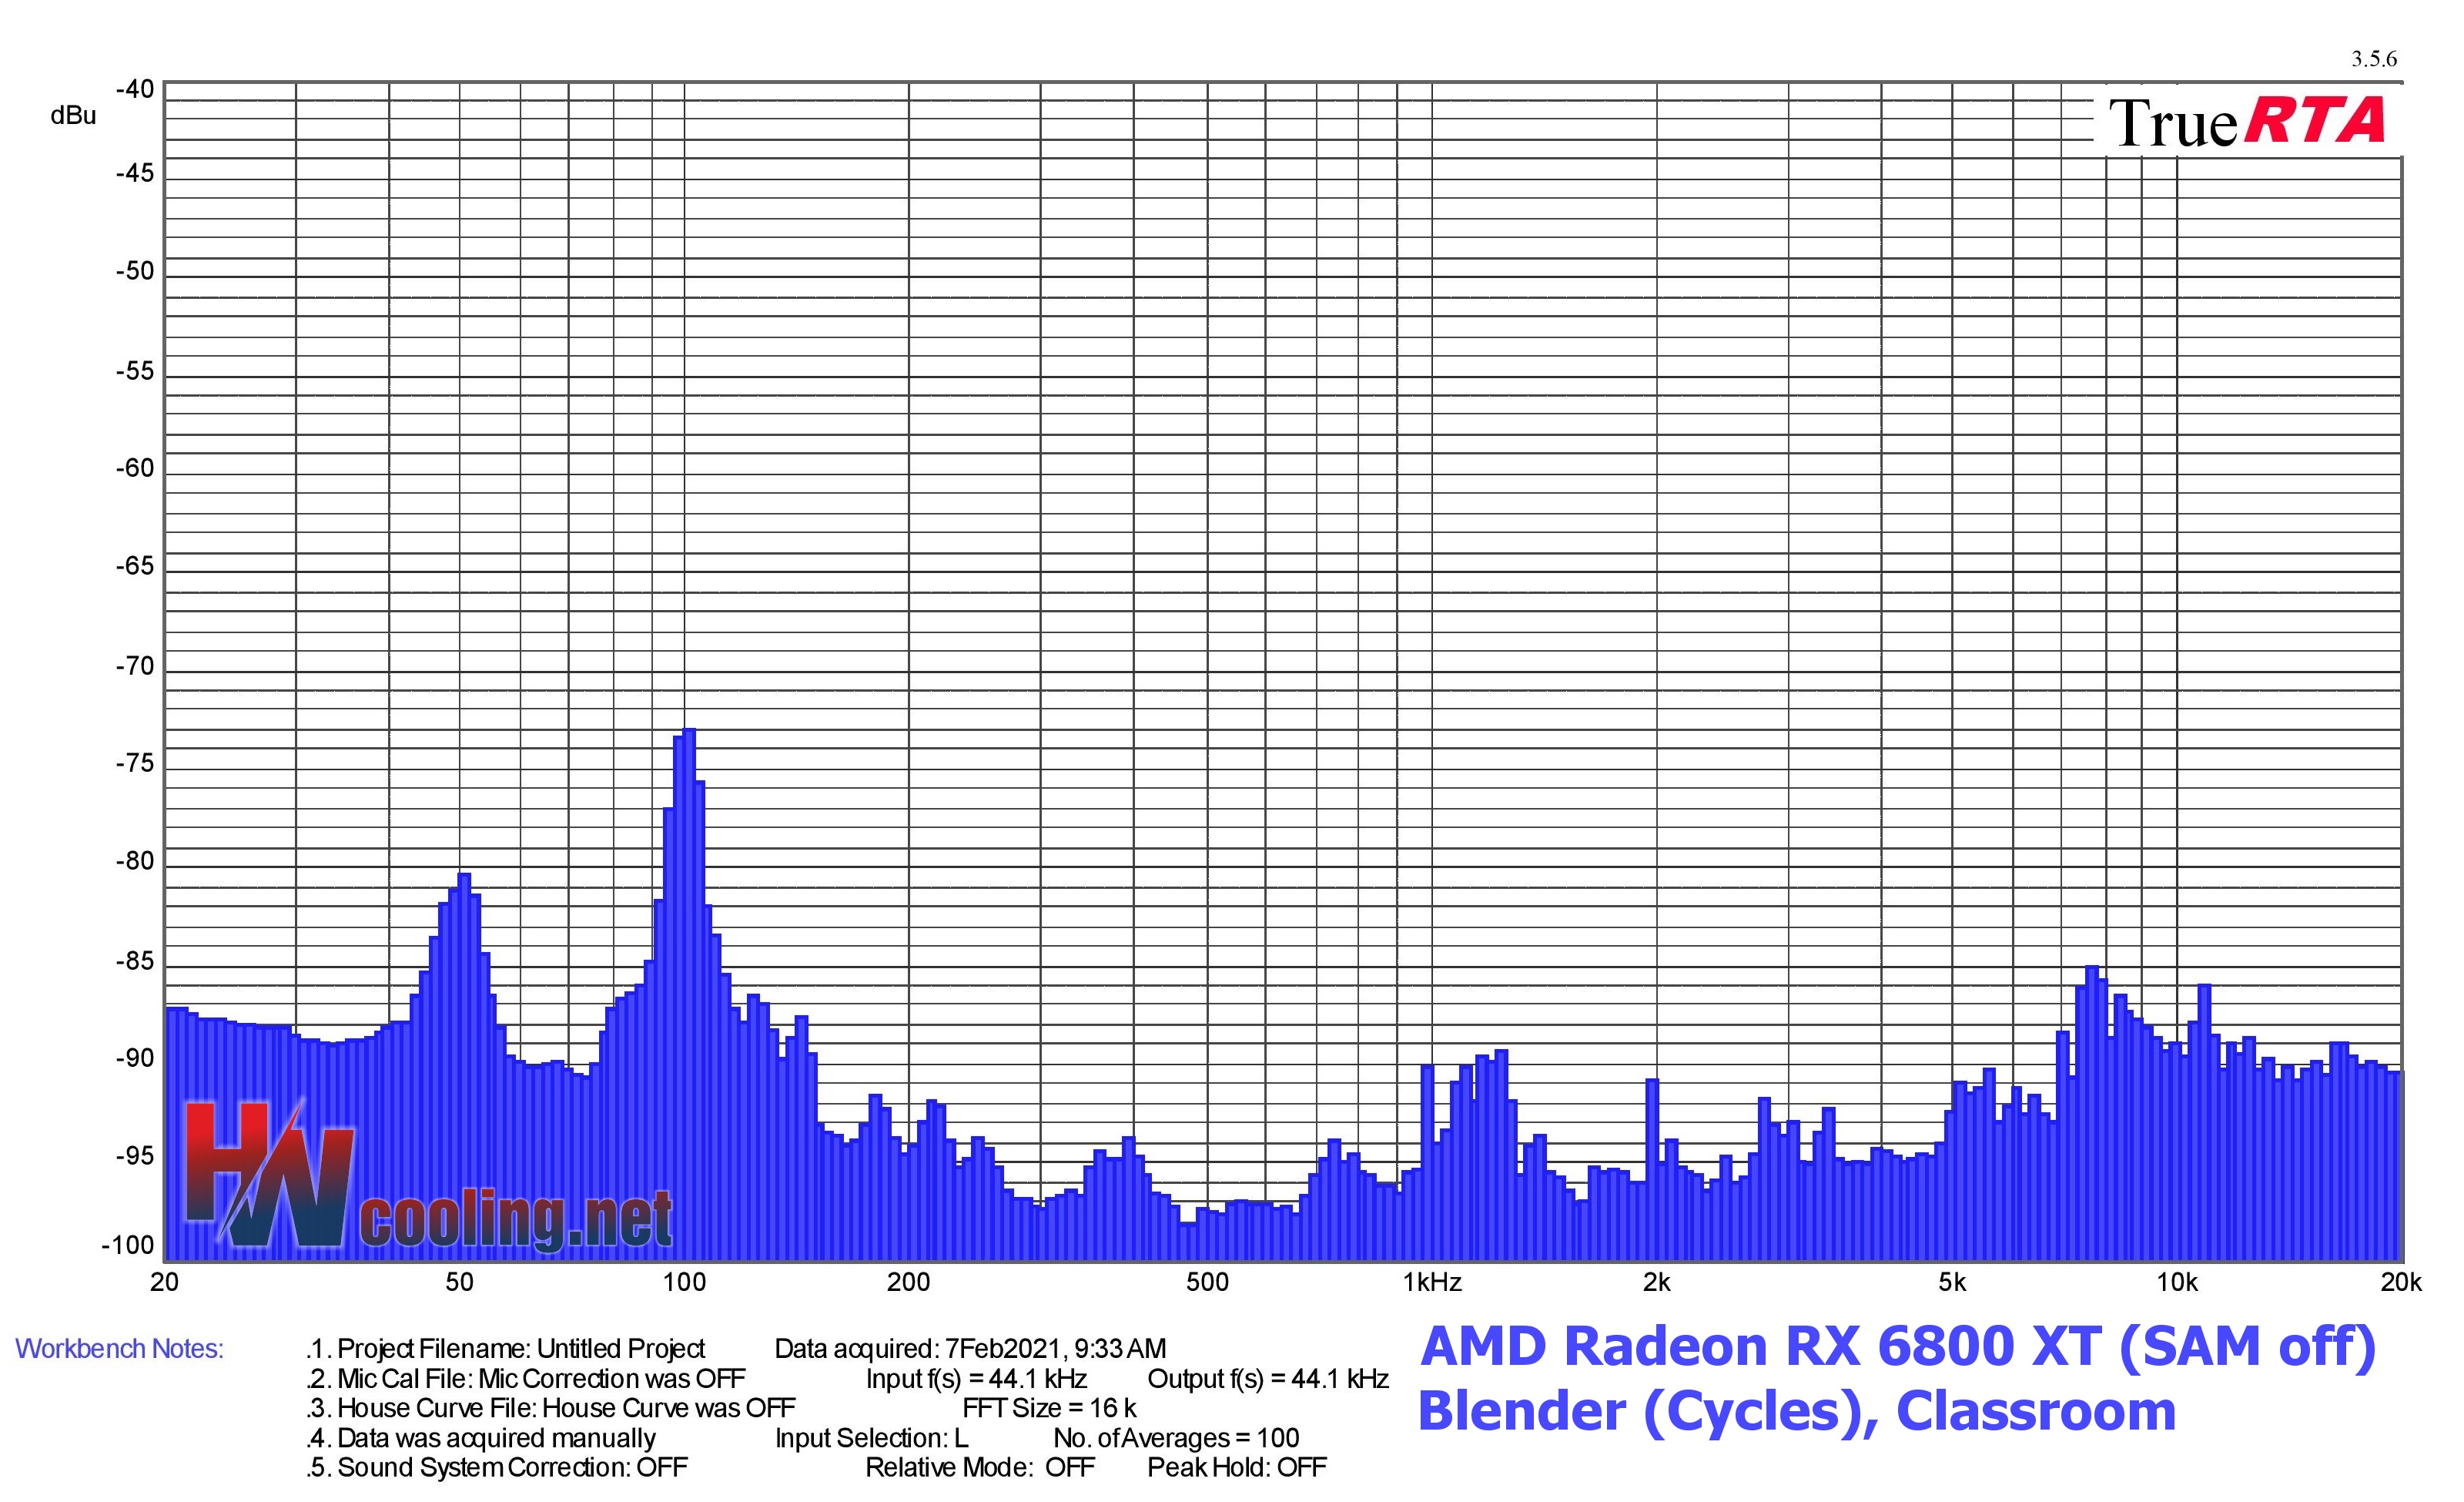
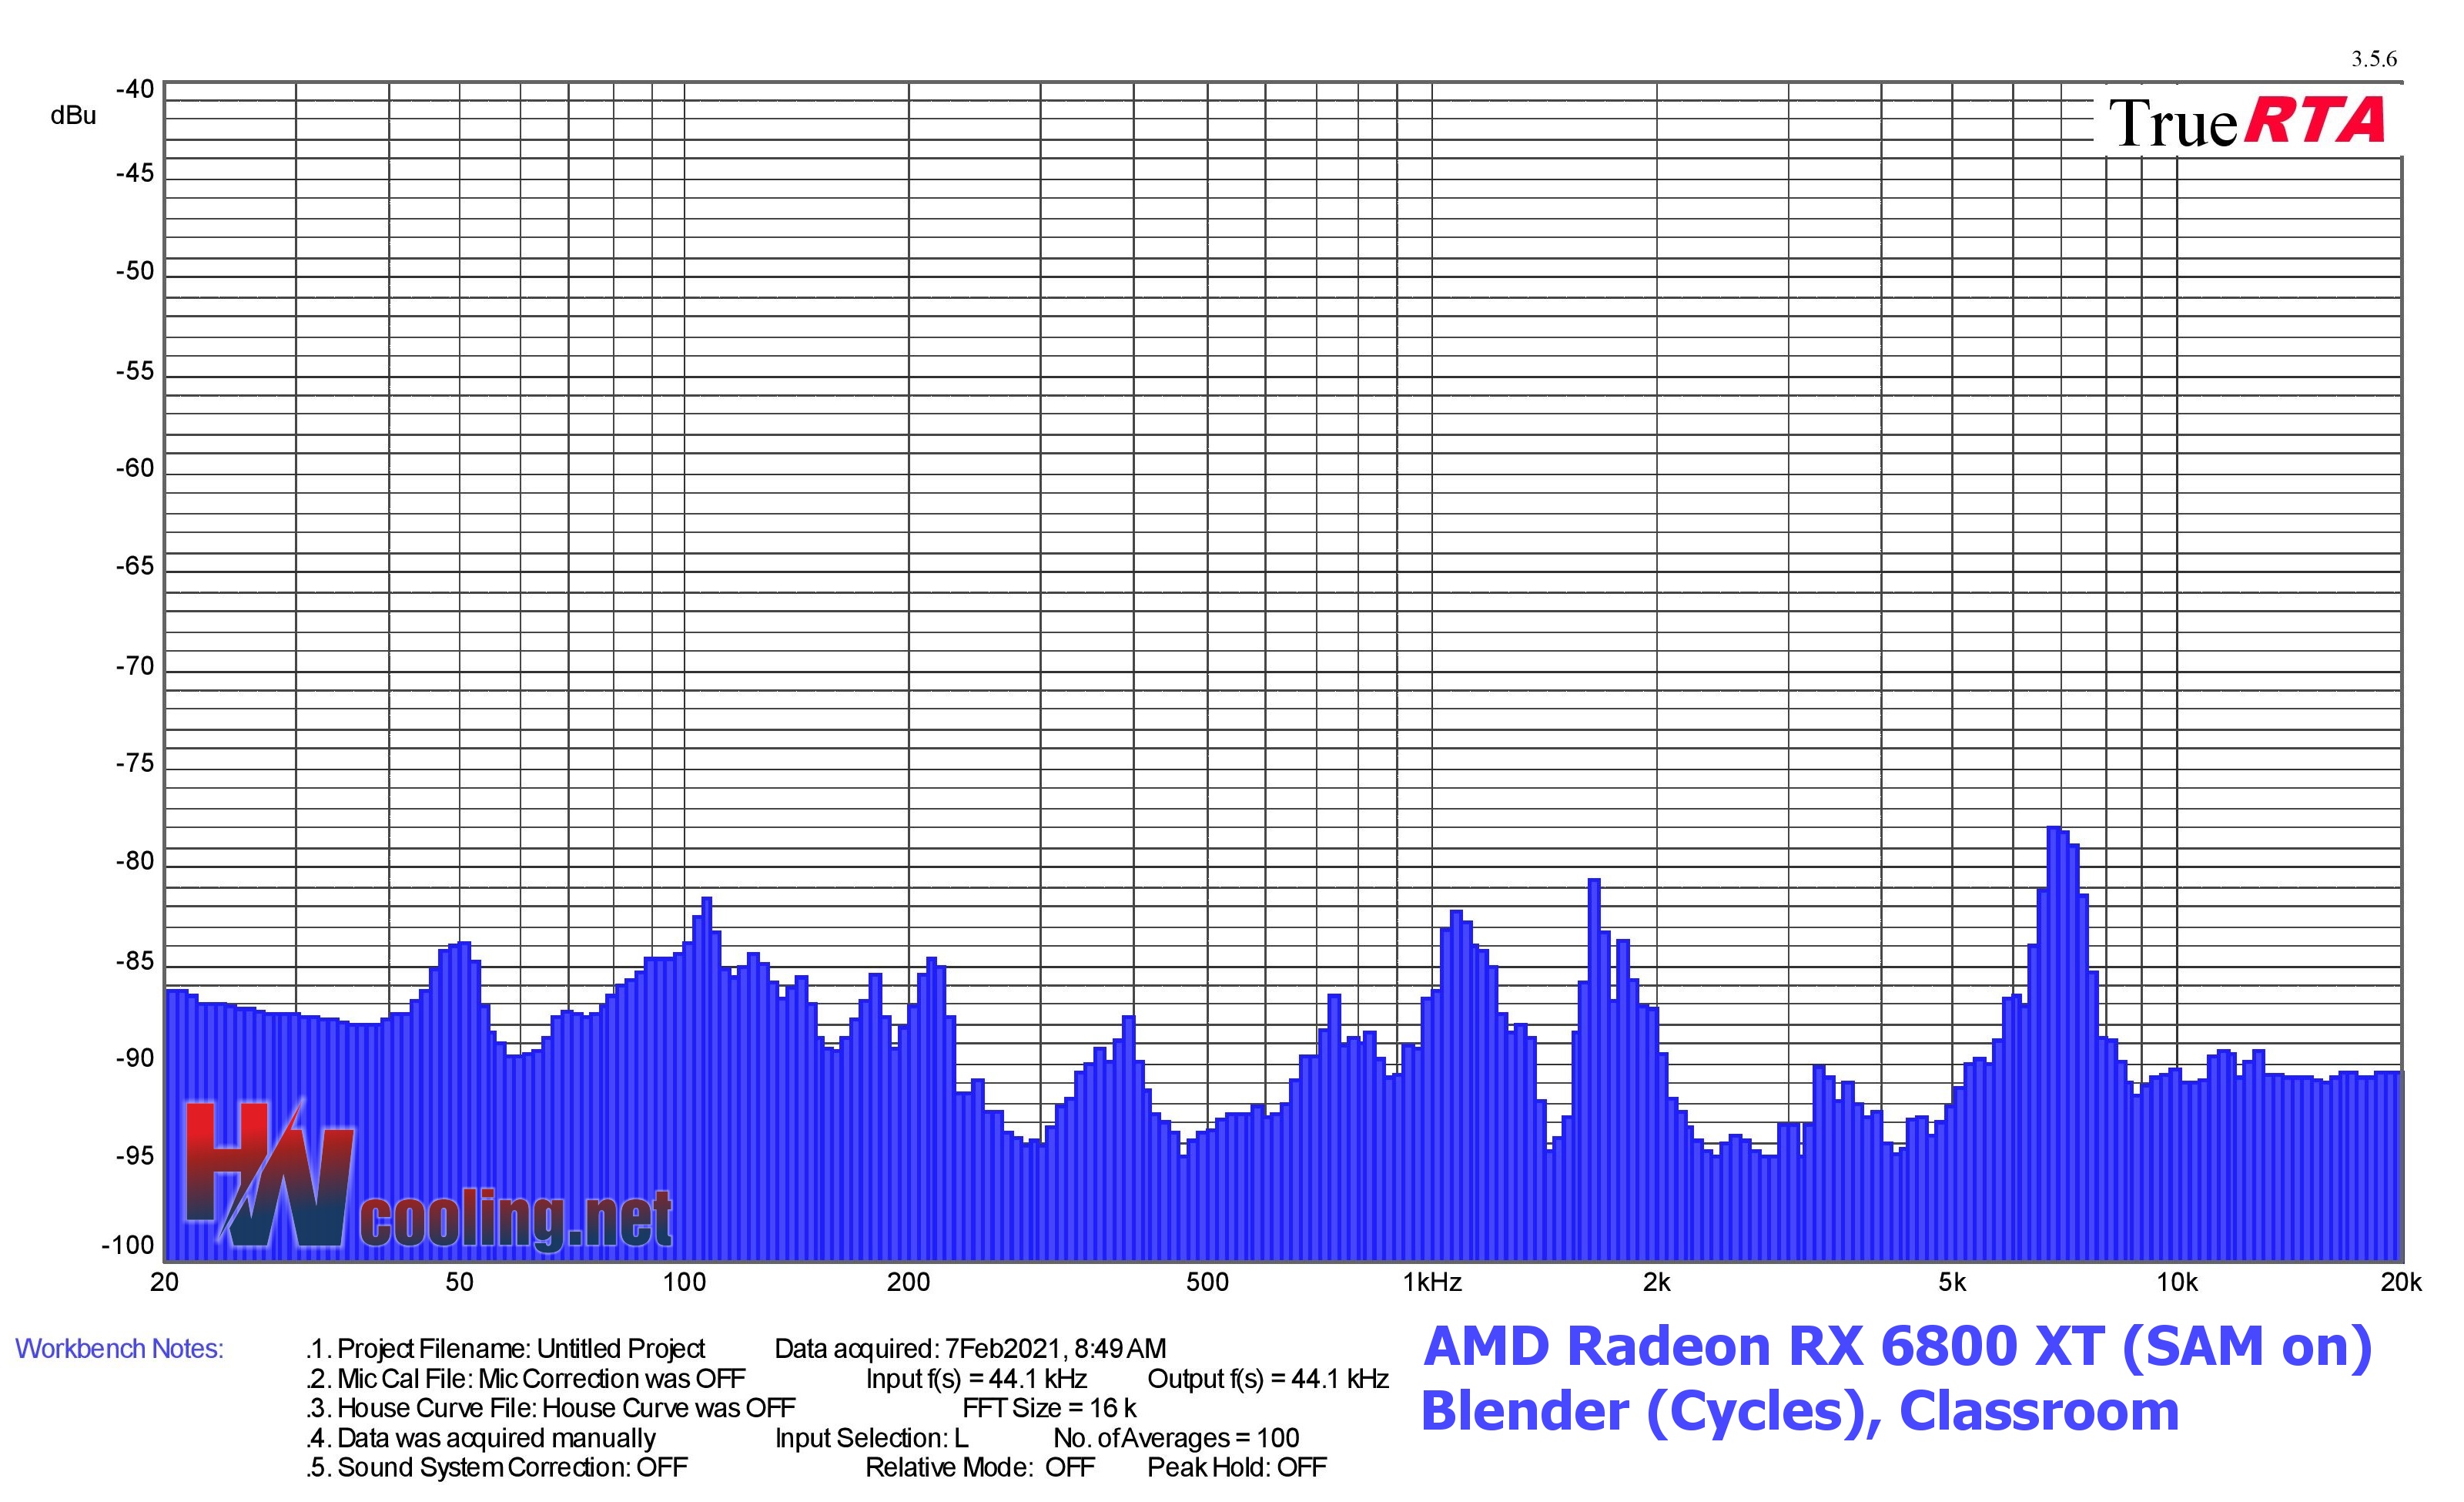
Measurements are performed in the TrueRTA application, which records sound in a range of 240 frequencies in the recorded range of 20–20,000 Hz. For the possibility of comparison across articles, we export the dominant frequency from the low (20–200 Hz), medium (201–2000 Hz) and high (2001–20,000 Hz) range to standard bar graphs. However, for an even more detailed analysis of the sound expression, it is important to perceive the overall shape of the graph and the intensity of all frequencies/tones.

- Contents
- Methodology: performance tests
- Methodology: how we measure power draw
- Methodology: noise and sound measurement
- Methodology: heat tests
- Test rig
- ComputeBench (OpenCL)
- ComputeBench (CUDA)
- SPECviewperf 2020 and SPECworkstation 3
- FLOPS, IOPS and memory speed tests
- 3D rendering 1/2 (LuxMark and Blender@Cycles)
- 3D rendering 2/2 (Blender@Radeon ProRender a Eevee)
- Photo editing
- Broadcasting
- Password cracking
- GPU clock speed
- GPU and VRAM heating
- Net graphics power draw
- Analysis of 12 V subcircuit power supply
- Analysis of 3.3 V subcircuit power supply
- Noise level
- Frequency response of sound
- Conclusion