
Conclusion
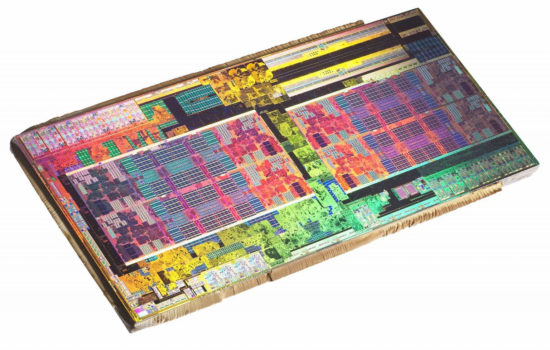
Without application/computational tests, graphics card tests would be incomplete. Therefore, we will focus on this area outside of gaming that most hardware magazines neglect. We understand the reasons, there are several of them, but even so, it is possible with a little effort to make at least a few measurements. So hopefully they will also help multimedia creators in choosing the right graphics card.
Conclusion
The choice of tests for the second part was half fight with licenses and half with AMD optimizations. The aim, of course, was to choose tests so that there was a meaningful comparison across the competing cards. This is a relatively difficult task due to the fact that GeForce supports the progressive frameworks CUDA and OptiX. In addition, Radeon often gets the shorter end of the stick even under OpenCL. Not only in performance (as evidenced by the weaker results of LuxCoreRender/LuxMark), but also, for example, (no longer) supported Folding@home. Where OpenCL works well (and this behavior is also represented in our Blender tests), the analysis and results of the RX 6800 XT are remarkable.
With the Cycles renderer, the RX 6800 XT is significantly slower than the RTX 3080 with CUDA, but there’s also the 90-watt energy savings in AMD’s favor. The efficiency, at least with the current version of Blender (2.92) with the implementation of Intel Embree in Cycles, is at least remarkable. Thus, even though the RTX 3080 still has the upper hand, significantly in terms of performance and also is a hair better at efficiency (power per watt). With OptiX, of course, the gap in favor of Nvidia is getting bigger. The RX 6800 XT delivers better results with the Radeon Pro Render, but this was to be expected and there is probably no special reason why GeForce owners should worry. With the Eevee, the RTX 3080 is significantly/70% faster. However, it does not benefit from OptiX, quite the contrary – we’ve even seen a slight performance decrease. A similar statement is made for AMD SAM. You also don’t usually improve the results with it, and most of the time, with it being turned on, it’s a performance decrease without any additional benefits. This is true across all non-gaming tests, not just 3D rendering. So at business use, it is almost always better to turn it off.
If Radeon delivers a really attractive performance somewhere, it’s broadcasting. The RX 6800 XT’s decrease in fps in OBS compared to the RTX 3080 is one third. In Xsplit, the situation settles (so a nice comparison across applications came out of it), but it should be noted that OBS (unlike Xsplit) can be fully used in the free version. We recommend that Xsplit users turn off SAM, which has a dramatic impact on recording performance. Although it increases the game’s fps, the end result is dramatically lower encoding performance. The RTX 3080 dominates in hashing, but it should be noted that with some ciphers (SHA1/SHA2-256) the RX 6800 XT will handle better. However, Nvidia never has a big shortage, but at the same time, it can really impress, whether in AES-256 or when cracking the NTLMv2. network protocol.
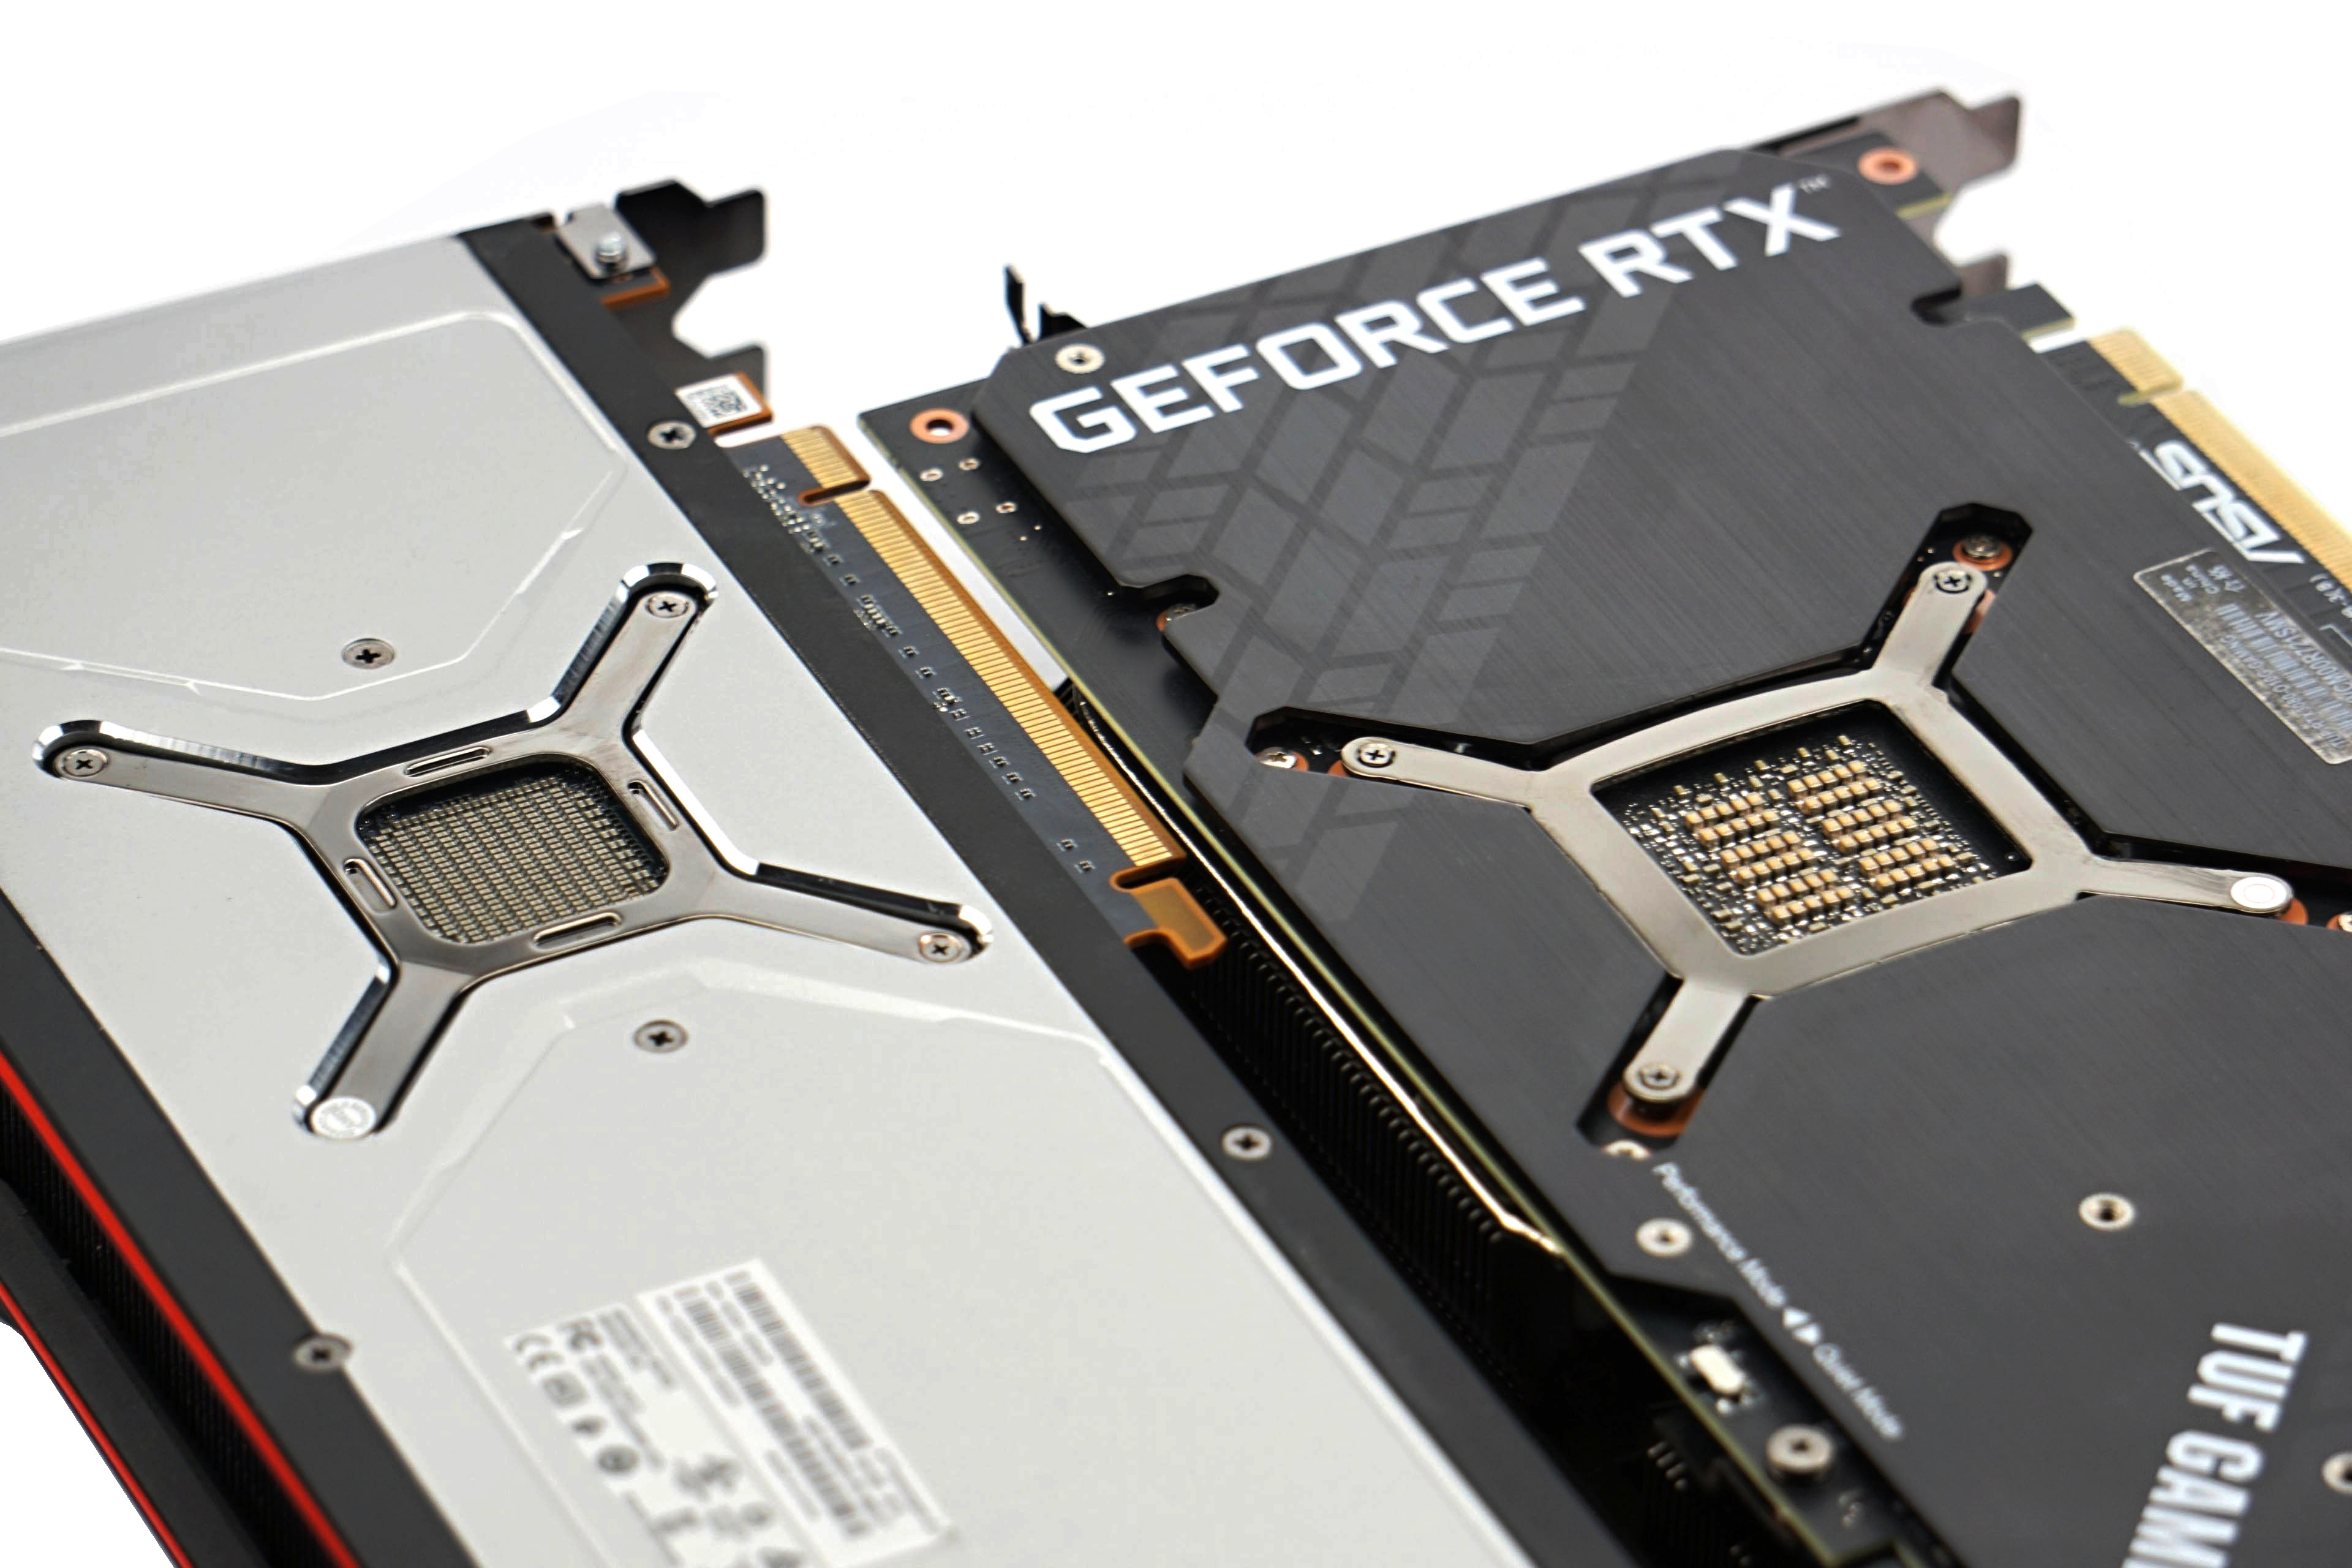
The RTX 3080, i.e. Asus TUF RTX 3080 O10G Gaming (although it will probably not be very different from card to card) is more energy-saving when playing multimedia (tested on H.265/HEVC video) or after connecting a second monitor with high resolution. With it, the power draw on all graphics cards always increases, but in the case of the RX 6800 XT it is very significant compared to the state with a single monitor. In terms of idle, it’s more than 5 times (7.5 vs. 41 W). This is due to the transition from minimum to maximum VRAM clock speed. For lower resolution monitors (up to 2x QHD@60 Hz), this may not bother you because the memory remains underclocked. With the RTX 3080, the increase in power consumption after connecting a second monitor is minimal (from 22 to 27 W), but again, compared to the RX 6800 XT, the initial power consumption with a single monitor is relatively high.
- Contents
- Methodology: performance tests
- Methodology: how we measure power draw
- Methodology: noise and sound measurement
- Methodology: heat tests
- Test rig
- ComputeBench (OpenCL)
- ComputeBench (CUDA)
- SPECviewperf 2020 and SPECworkstation 3
- FLOPS, IOPS and memory speed tests
- 3D rendering 1/2 (LuxMark and Blender@Cycles)
- 3D rendering 2/2 (Blender@Radeon ProRender a Eevee)
- Photo editing
- Broadcasting
- Password cracking
- GPU clock speed
- GPU and VRAM heating
- Net graphics power draw
- Analysis of 12 V subcircuit power supply
- Analysis of 3.3 V subcircuit power supply
- Noise level
- Frequency response of sound
- Conclusion