


Results: Static pressure w/o obstacles
The first and still the only Asus fan that is on sale individually may be a good choice. But you can also get burnt. It depends on what you want to use it for. In the right context, it gives attractive results, and the impression of a very decent fan is spoiled mainly by pointless design details or sugar-coating the specs. Anyway, you can see that compared to the more ordinary fans from the last test, the Strix is a bit of a different class.
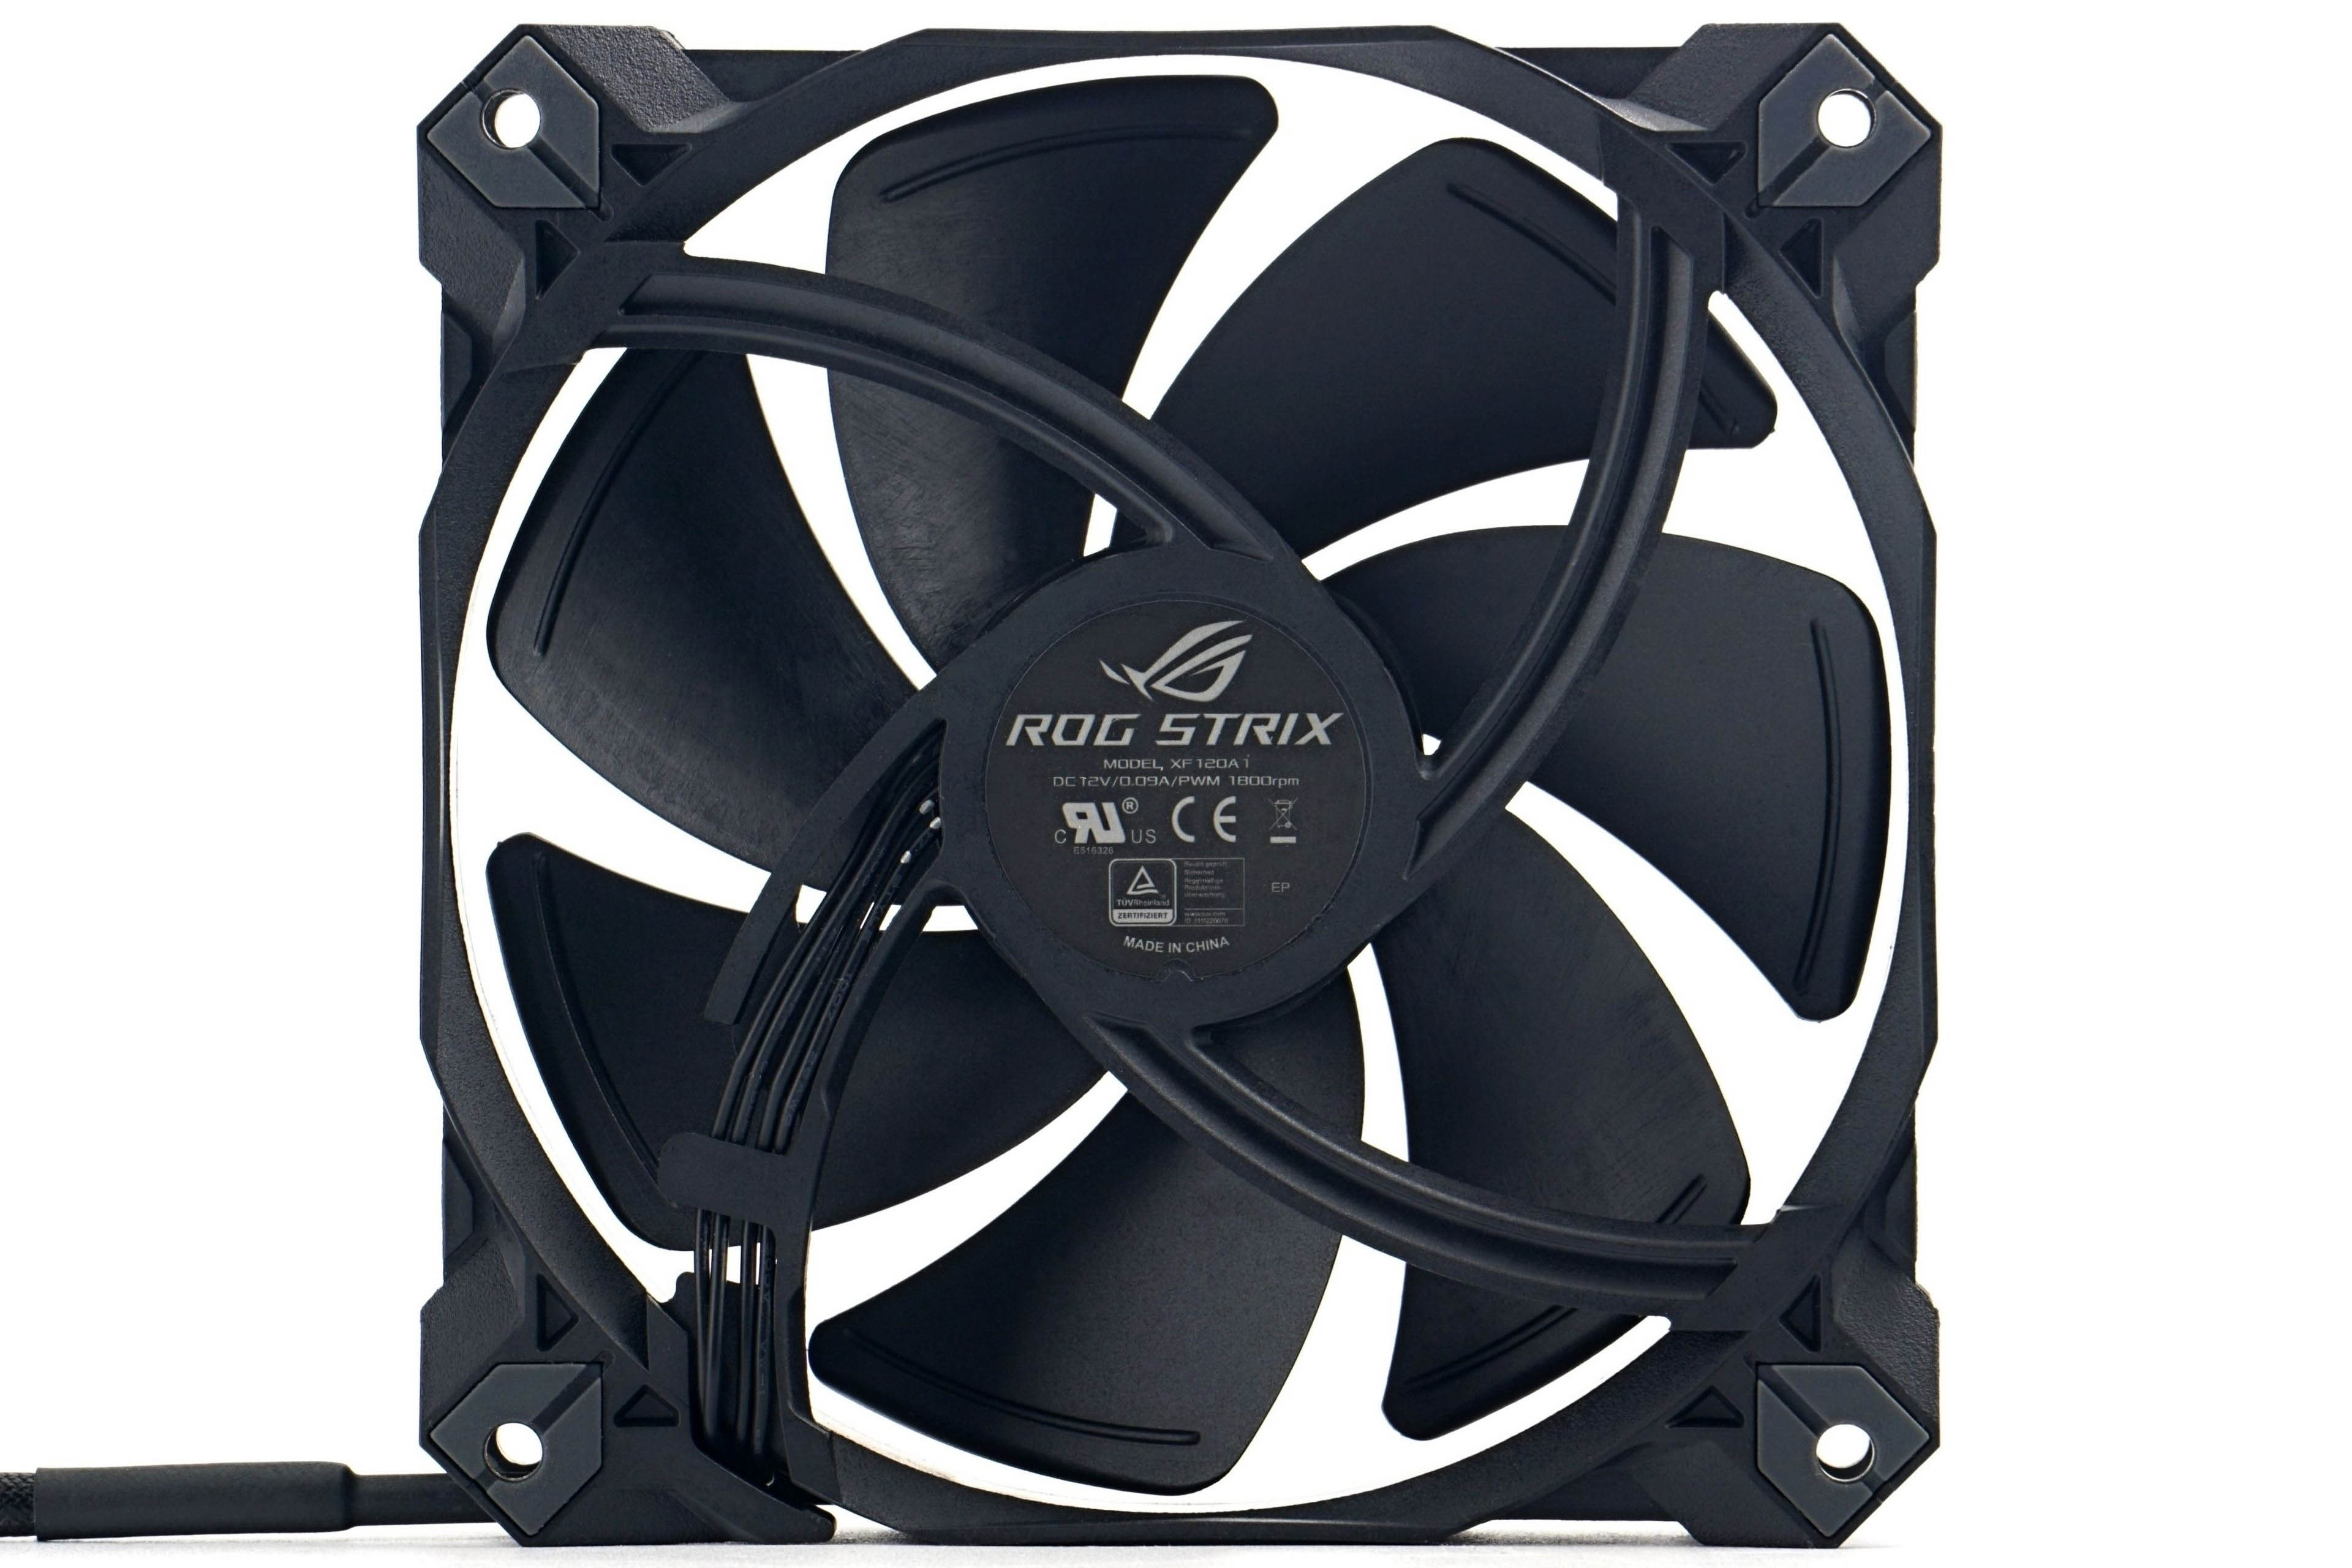
The XF120 fan falls categorically under ROG (Strix series), so it should be a more decent product that should stand out with high quality standards. However, this fan doesn’t break the price ceiling and it can be bought for some 23 euros, which is less than you pay for top models from competing manufacturers. However, Asus pretends to have a better fan up its sleeve overall despite the lower price. It claims that the XF120 is optimized for all types of applications (as a system fan or radiator fan), even reaching static pressures as high as 3.07 mm H2O, which is unheard of for 120 mm fans with speeds below 2000 rpm.
The key thing for the XF120 is also the contactless magnetic bearings, which are supposed to lower the noise level and make the fan last for a long time. The mean time between failures (MTBF) is quoted by Asus at up to 45 years. Too bad this longevity is not covered by a lifetime warranty, which is “only” five years.
| Brand and model of fan | Paper specicifations * | Price [EUR] | ||||||||
| Format (and thickness) in mm | Connecting | Speed [rpm] | Airflow [m3/h] | Static pressure [mm H2O] | Noise level [dBA] | Bearings | MTBF [h] | |||
| Motor | RGB LED | |||||||||
| Asus ROG Strix XF120 | 120 (25) | 4-pin (PWM) | N/A | 1800 | 106.19 | 3.07 | 22.5 | „MagLev“ | 400 000 | 23 |
| Akasa Vegas X7 | 120 (25) | 4-pin (PWM) | 4-pin (12 V) | 1200 | 71.19 | N/A | 23.2 | fluid | 40 000 | 11 |
| Reeven Coldwing 12 | 120 (25) | 4-pin (PWM) | N/A | 300–1500 | 37.54–112.64 | 0.17–1.65 | 6.5–30.4 | sleeve | 30 000 | 12 |
| Reeven Kiran | 120 (25) | 4-pin (PWM) | shared | 400–1500 | 110.10 | 2.95 | 33.6 | fluid | 120 000 | 17 |
| SilentiumPC Sigma Pro 120 PWM | 120 (25) | 4-pin (PWM) | N/A | 500–1600 | 79.00 | N/A | 15.0 | hydraulic | 50 000 | 7 |
| SilentiumPC Sigma Pro Corona RGB 120 | 120 (25) | 4-pin (PWM) | 4-pin (12 V) | 1500 | 56.58 | N/A | N/A | hydraulic | 50 000 | 12 |
| SilverStone SST-AP121 | 120 (25) | 3-pin (DC) | N/A | 1500 | 60.08 | 1.71 | 22.4 | fluid | 50 000 | 18 |
| SilverStone SST-FQ121 | 120 (25) | 7-pin (PWM) | N/A | 1000–1800 | 114.68 | 0.54–1.82 | 16.4–24.0 | PCF (fluid) | 150 000 | 20 |
| Xigmatek XLF-F1256 | 120 (25) | 3-pin (DC) | N/A | 1500 | 103.64 | N/A | 20.0 | „long-life“ | 50 000 | 16 |
* When reading performance values, a certain amount of tolerance must always be taken into account. For maximum speeds, ±10% is usually quoted, minimum speeds can vary considerably more from piece to piece, sometimes manufacturers will overlap by as much as ±50%. This must then also be adequately taken into account for air flow, static pressure and noise levels. If only one value is given in a table entry, this means that it always refers to the situation at maximum speed, which is achieved at 12 V or 100% PWM intensity. The manufacturer does not disclose the lower limit of the performance specifications in its materials in that case. The price in the last column is always approximate.
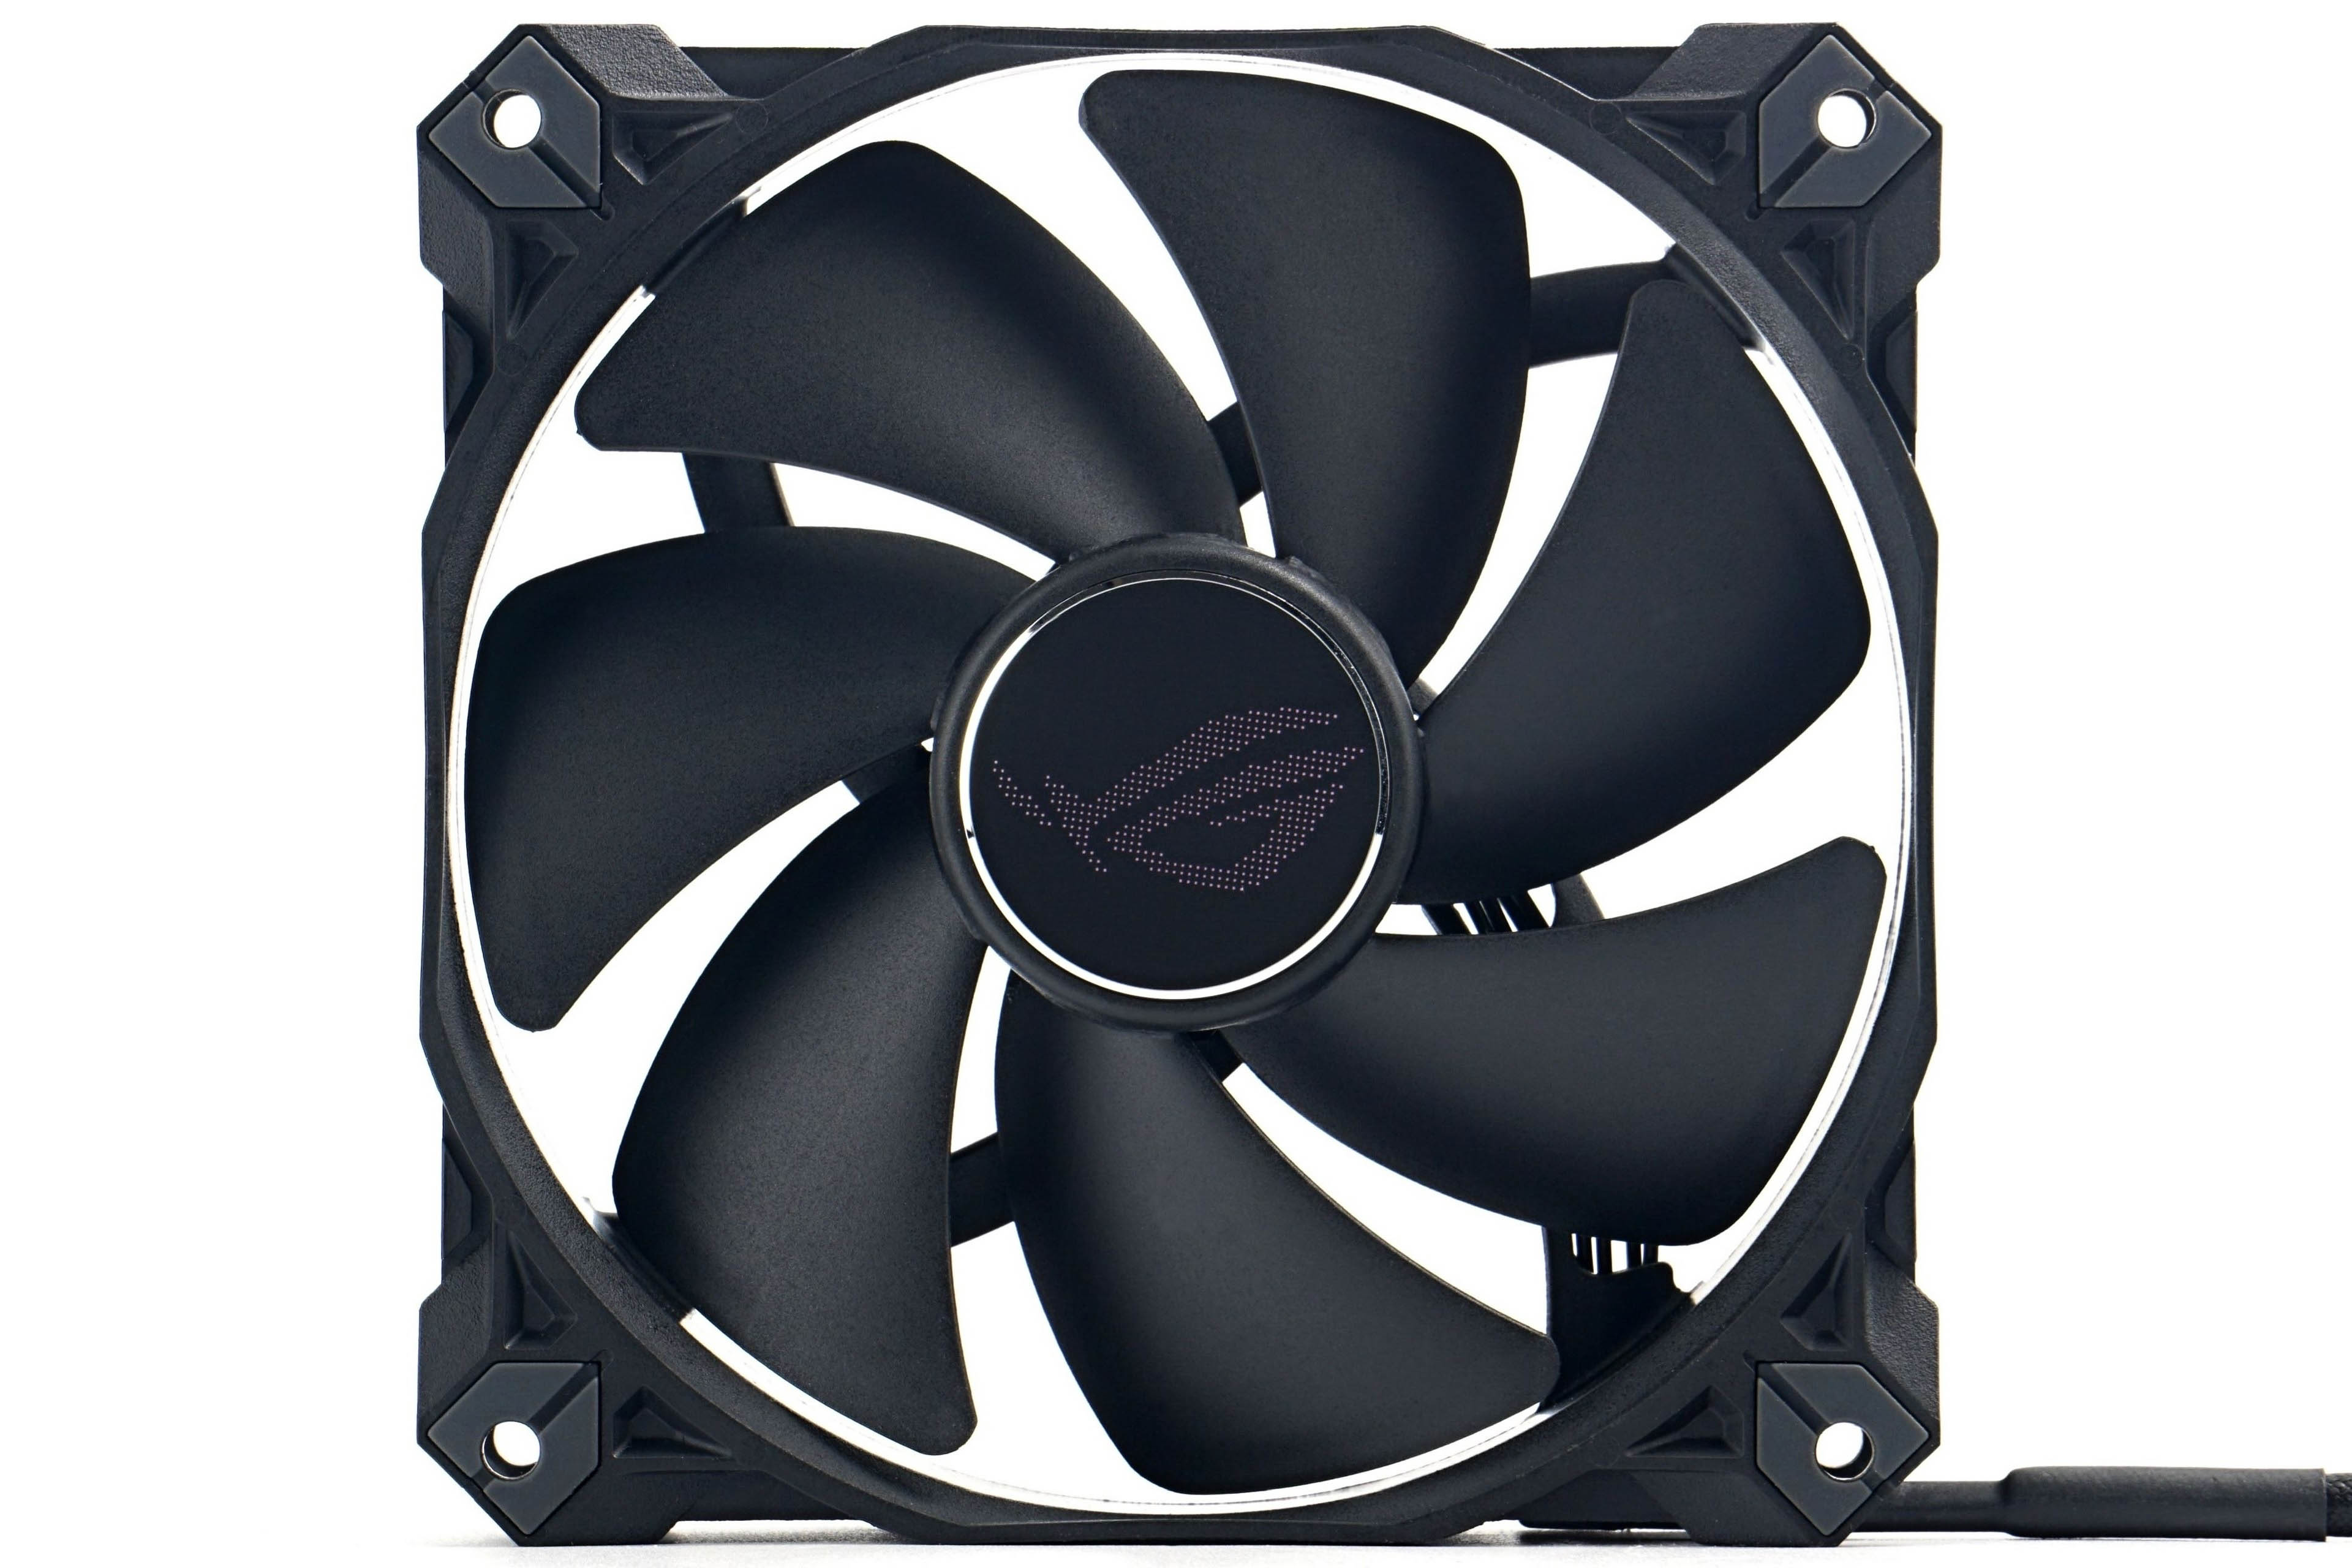
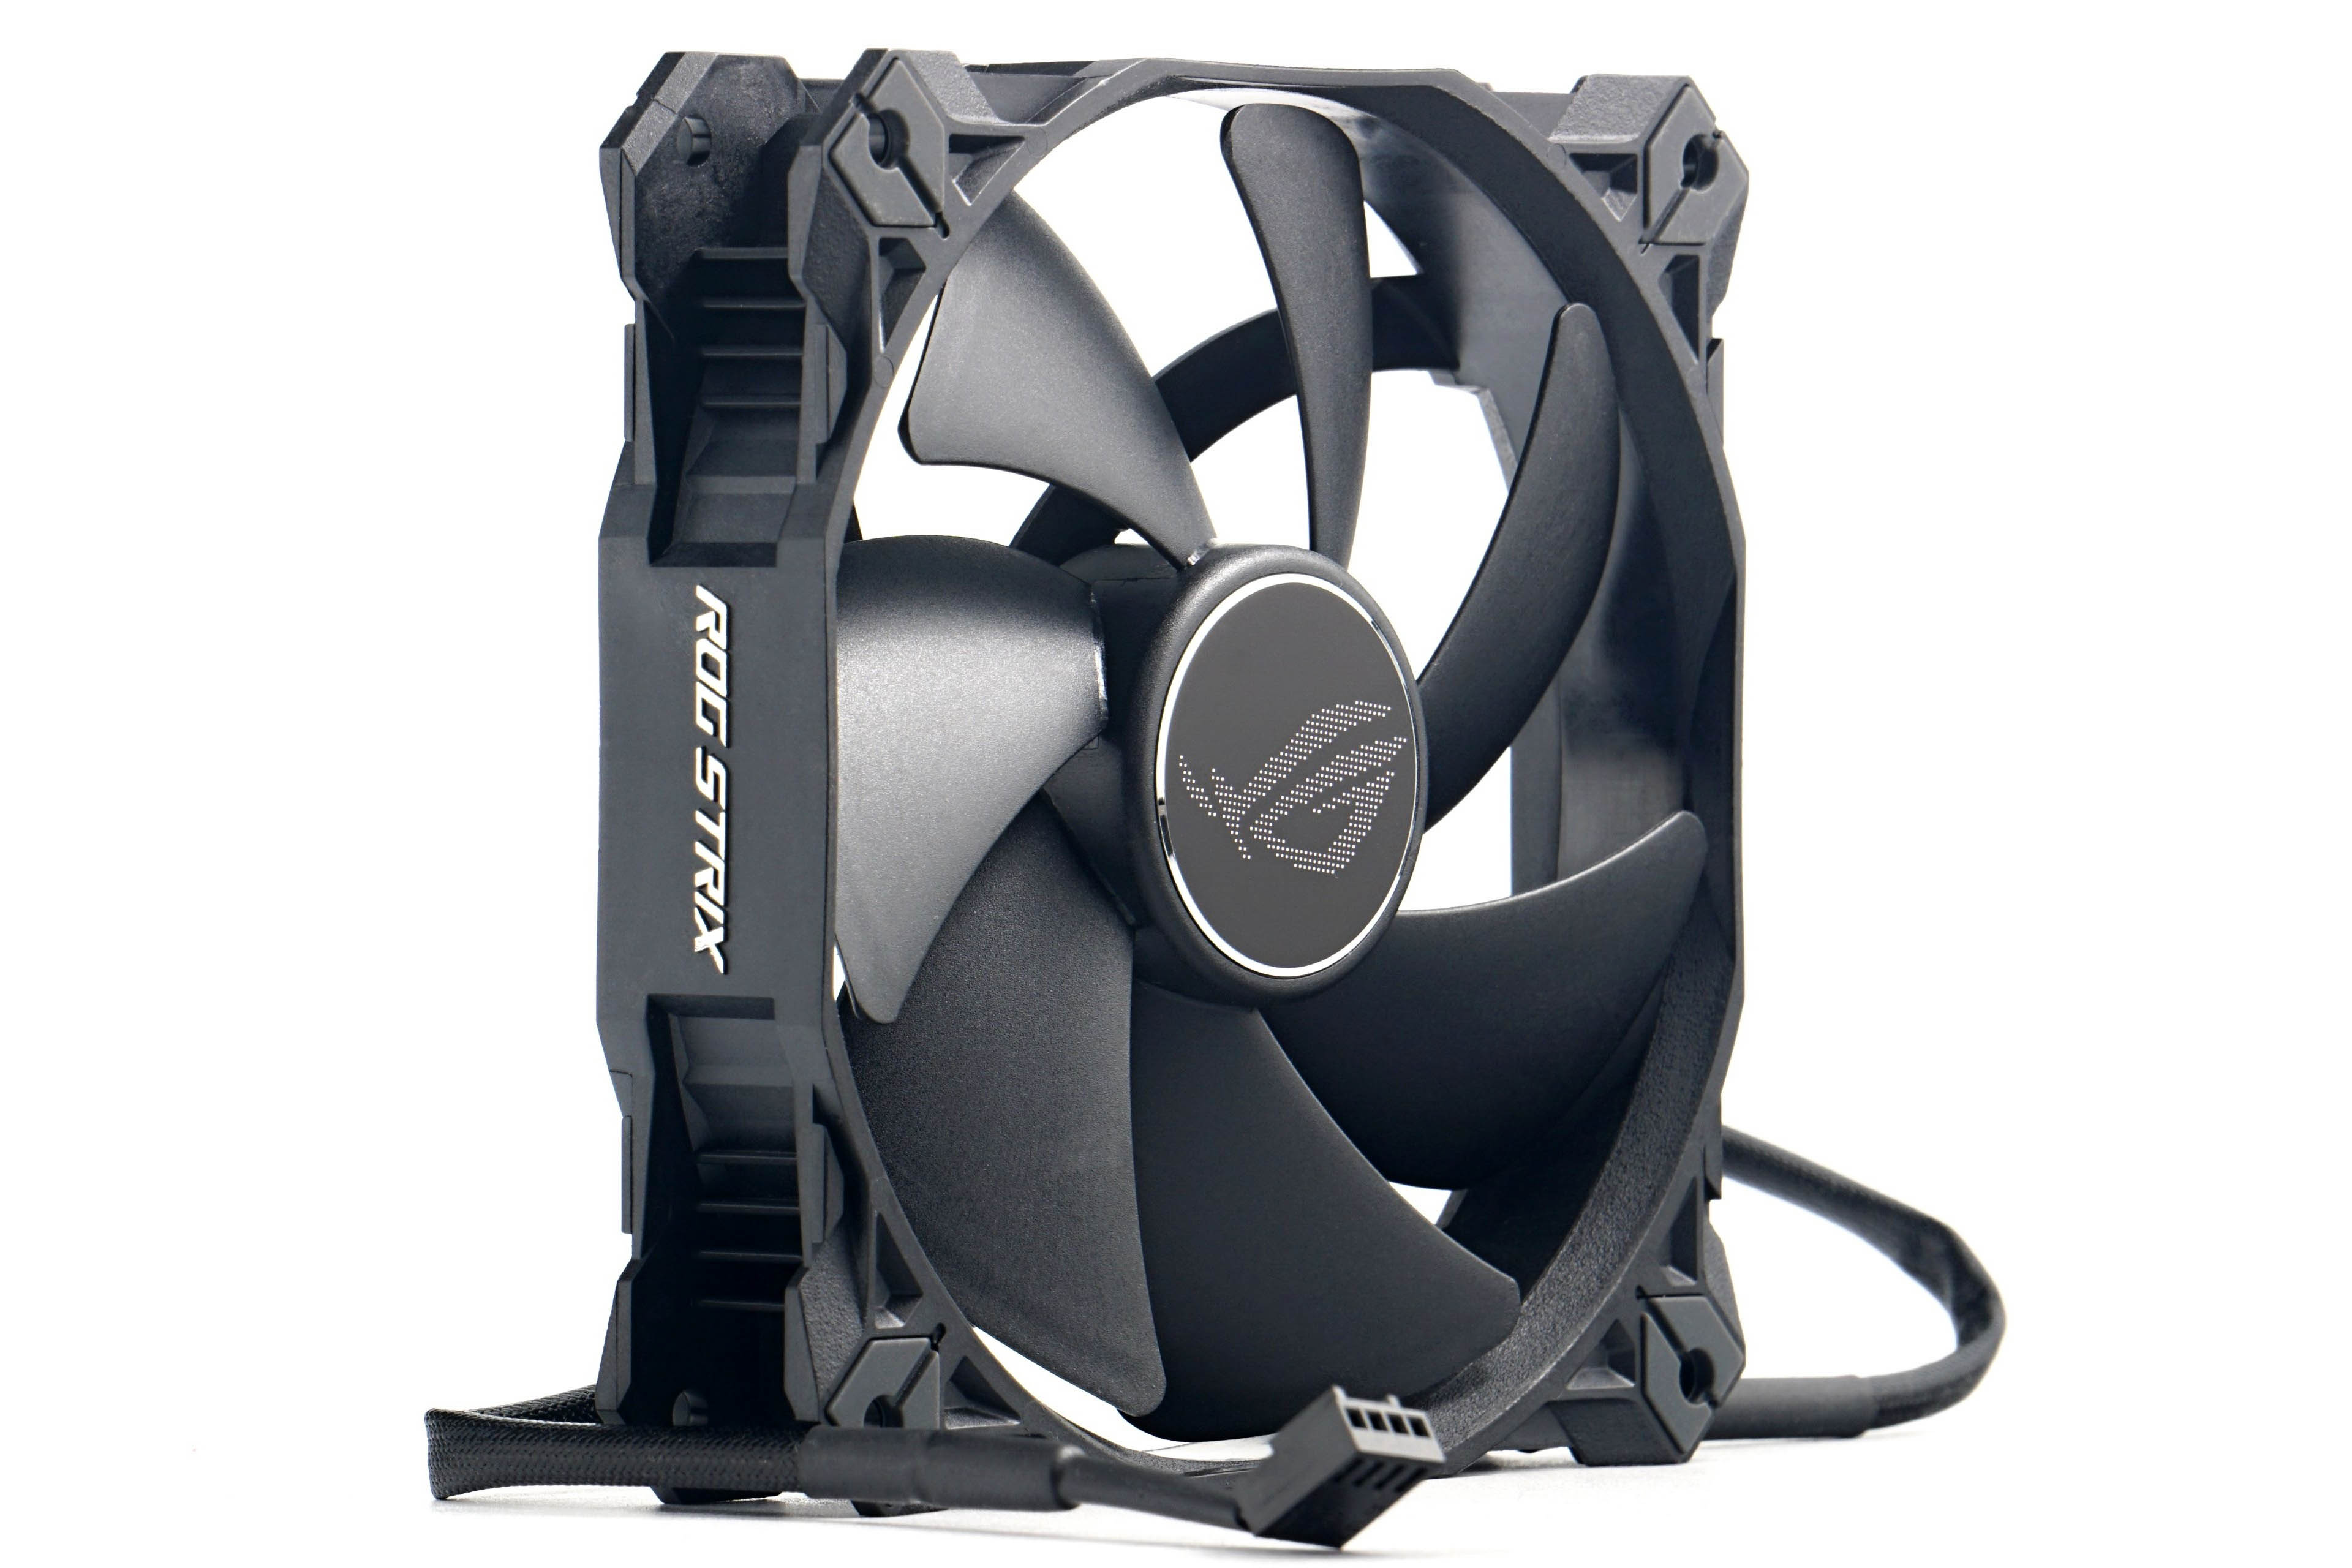
The rotor consists of seven larger blades with rounded corners. The circular centre of the rotor has a relatively small diameter (39 mm), which means that there is quite a large area/section per blade. The blades are quite massive, in all axes, so they are also quite wide. Apart from the rounded corners, you won’t discover much from the front.
However, after fitting the nylon dust filter, you’ll find that the rotor is quite tall and the frame only exceeds it by a hair. This causes the rotoe to brush against the screen of the nylon filter (you can still use a plastic one, as it holds its shape and doesn’t “cave in”) and thus can be described as incompatible.
However, as a system fan for a proper computer with a fine filter, the XF120 is not suitable for another reason, which we will gradually work our way to.
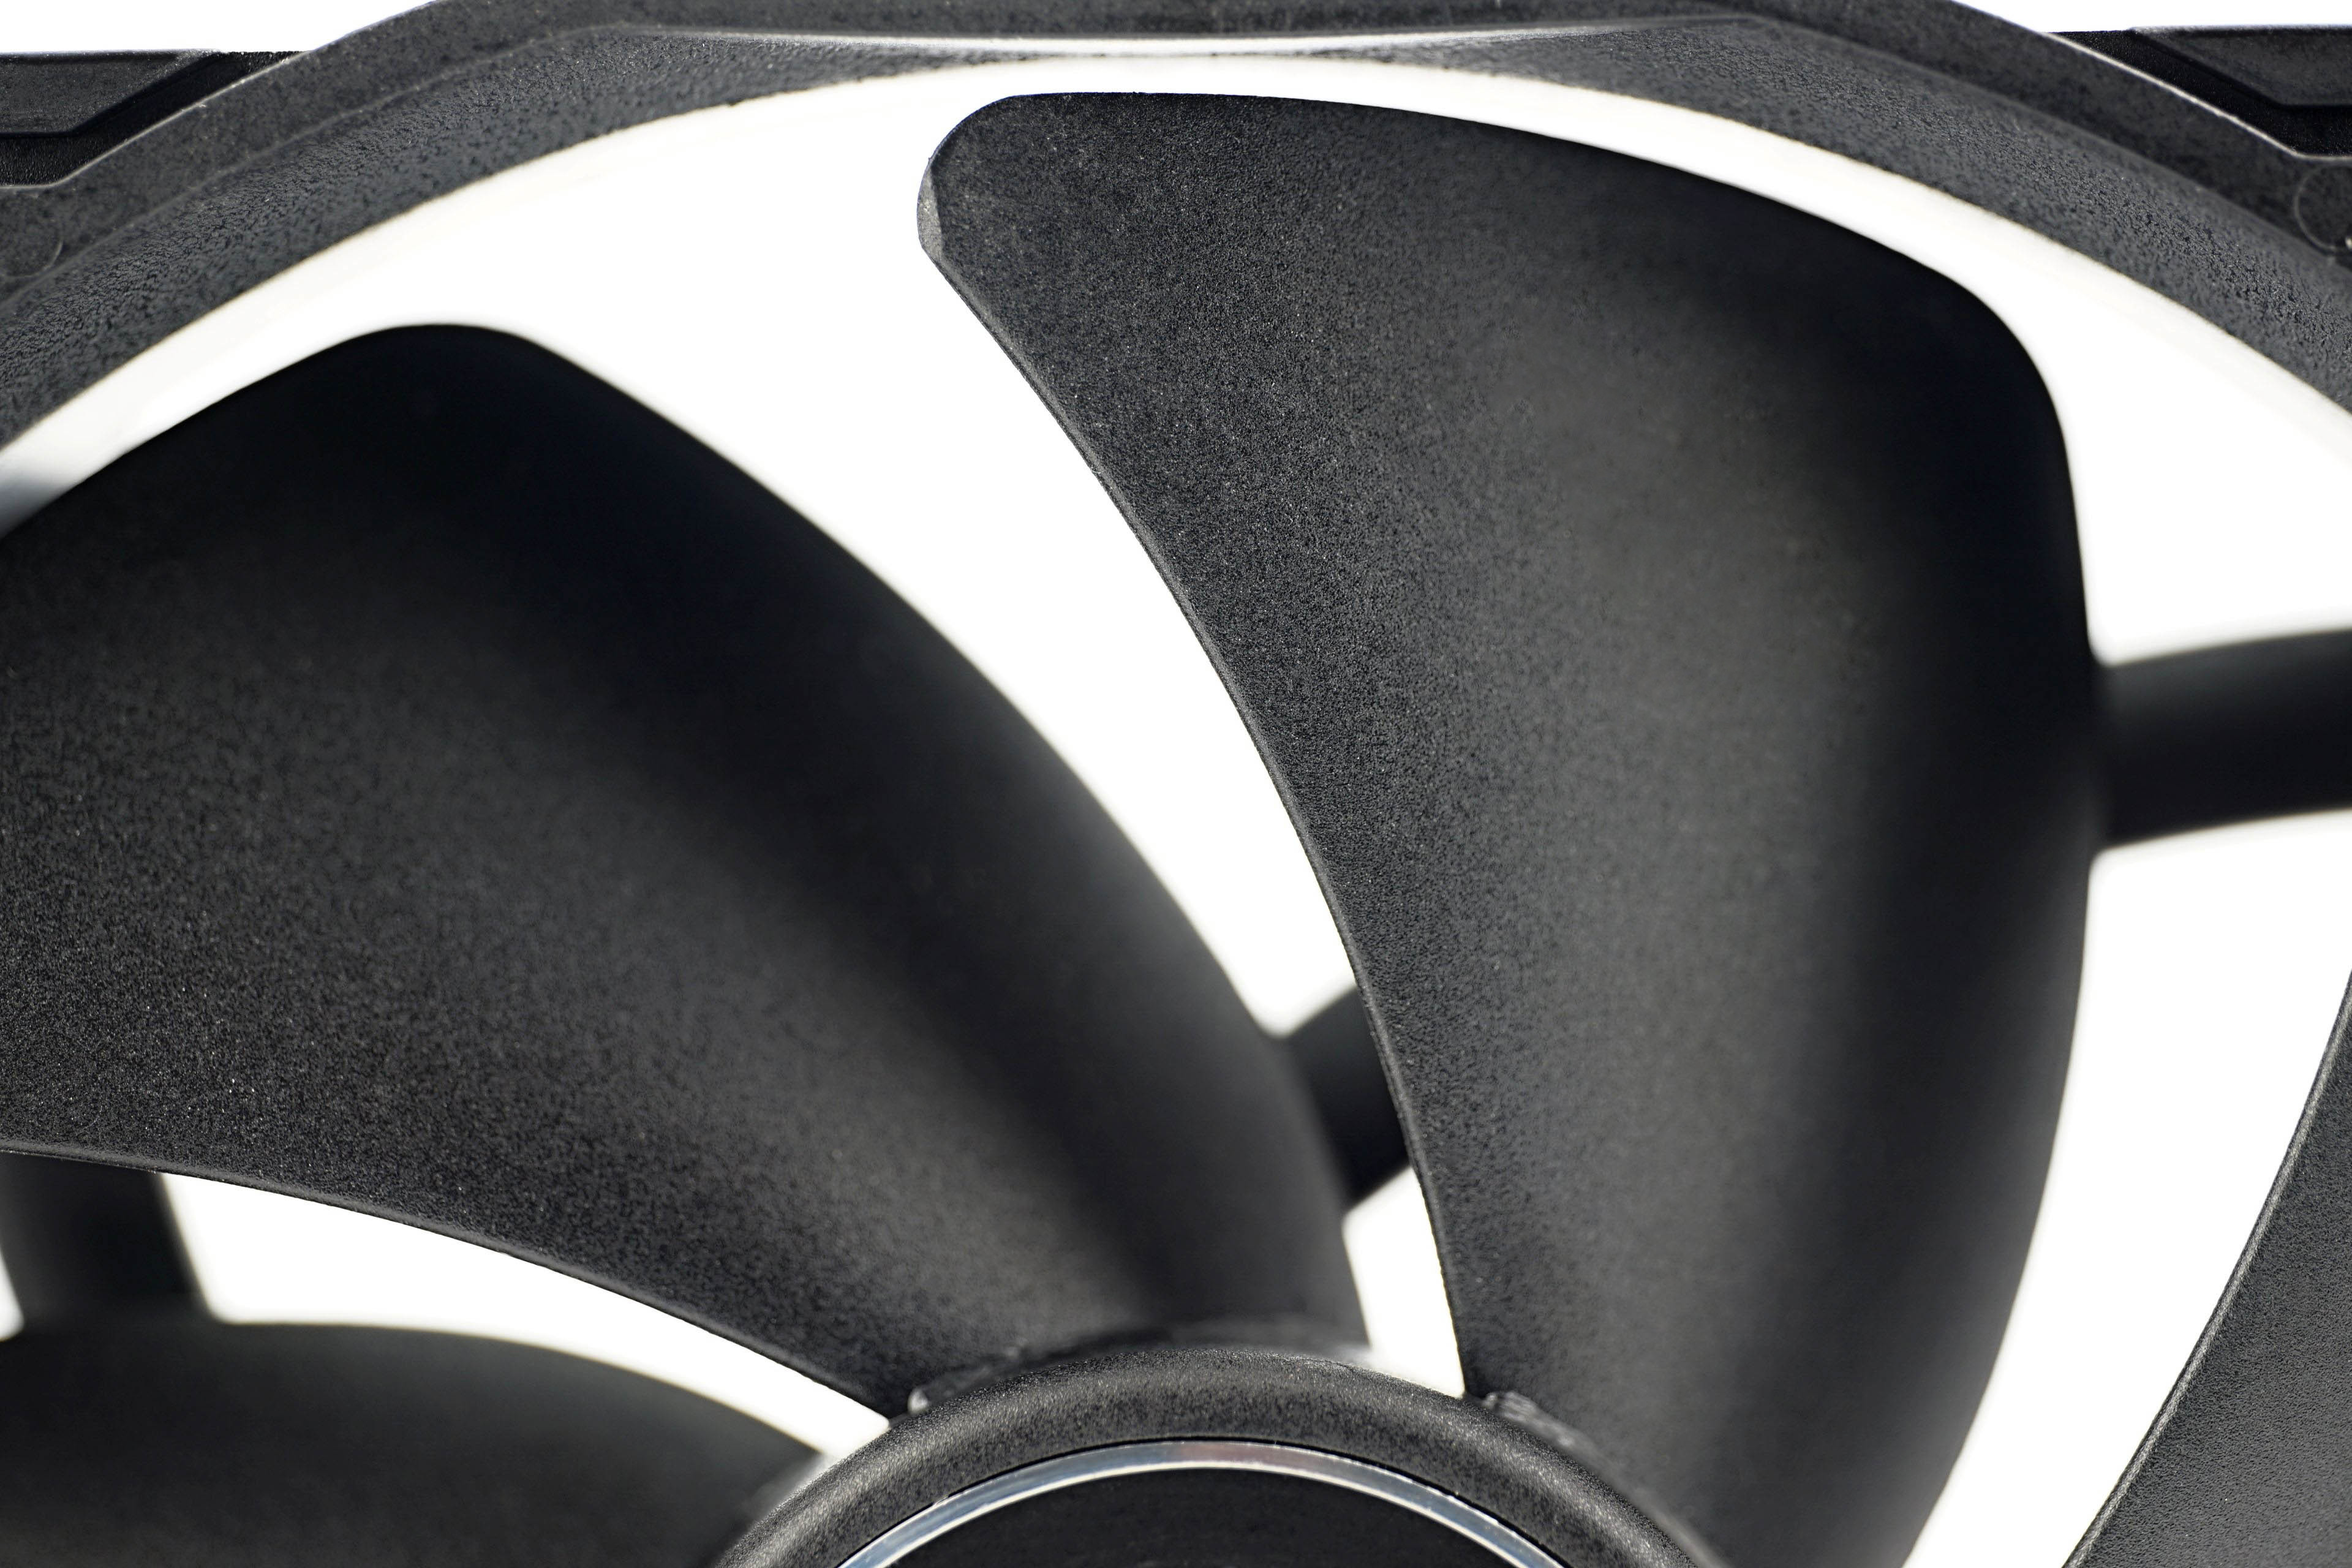
The grooves show on the back – the flared part at the ends is in each blade. These grooves are to direct the airflow and thus increase efficiency.
The finish of some of the blades is a bit striking. The blades all have a fine sandblasted finish from the front, from the back there are only four with it. The remaining four have polishing marks and it gives an unfinished, sloppy impression much like once the overly long screws on the Radeon RX 5700s. In this case it won’t affect functionality though, the rotor is balanced well, but it doesn’t leave a good impression. It was definitely not the intention, this applies to all retail samples.

The fan has rubber pads in the corners to reduce vibration, and you can also use rubber spikes to mount it in the cabinet. We’ll test these later in a big comparison test of anti-vibration mounts. The accessories are then just self-tapping screws and a Y fork. The extension cable is not supplied in the package, but you probably won’t miss it. The fan cable itself is quite long, exceeding half a meter.
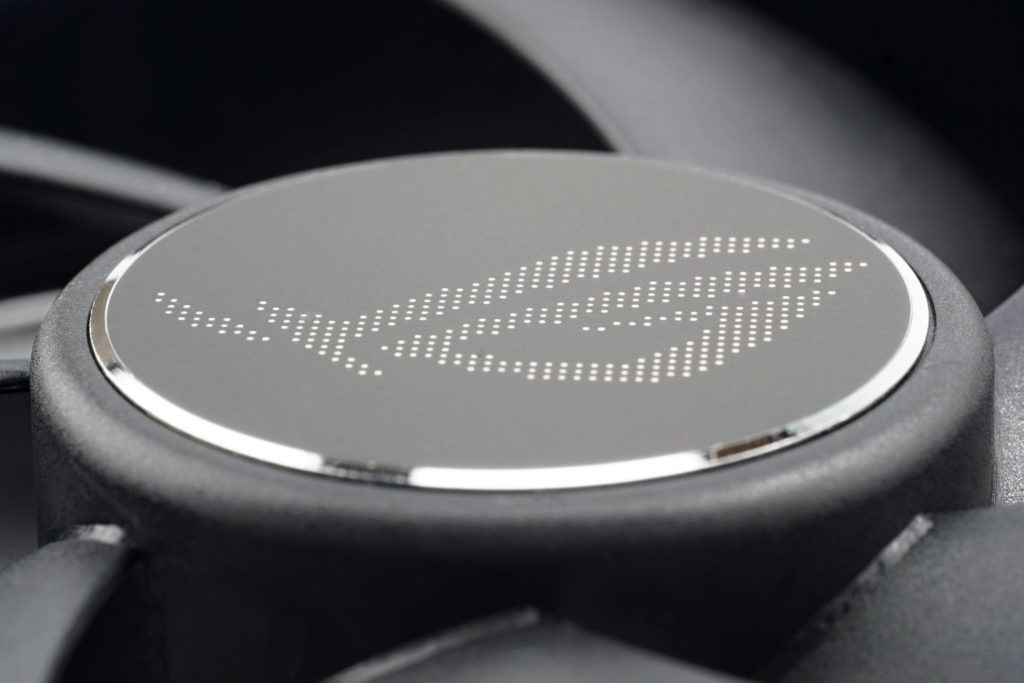
The decorative touches have not been forgotten either, which include prominent “ROG Strix” lettering on two sides of the fan. These, as well as the motor housing trim on the rotor have a shiny metallic finish.

We can also add that the weight of the fan is average (155 g). That would be all of the design details, there is no need to dissect them more, the important stuff are the test results, which can be found in the following chapters of the article. Study them thoroughly and save the final chapter with our interpretation and evaluation for the end.
To write that we have something mapped out to the last detail is perhaps too bold, but after proper preparation, few pieces of hardware are as easy to evaluate as fans. Of course, this had to be preceded by long preparations, developing a methodology, but you already know the story. What you don’t know yet is the first fruit, or rather the results of Akasa, SilentiumPC, SilverStone, Xigmatek or more exotic Reeven fans.
The basis of the methodology, the wind tunnel
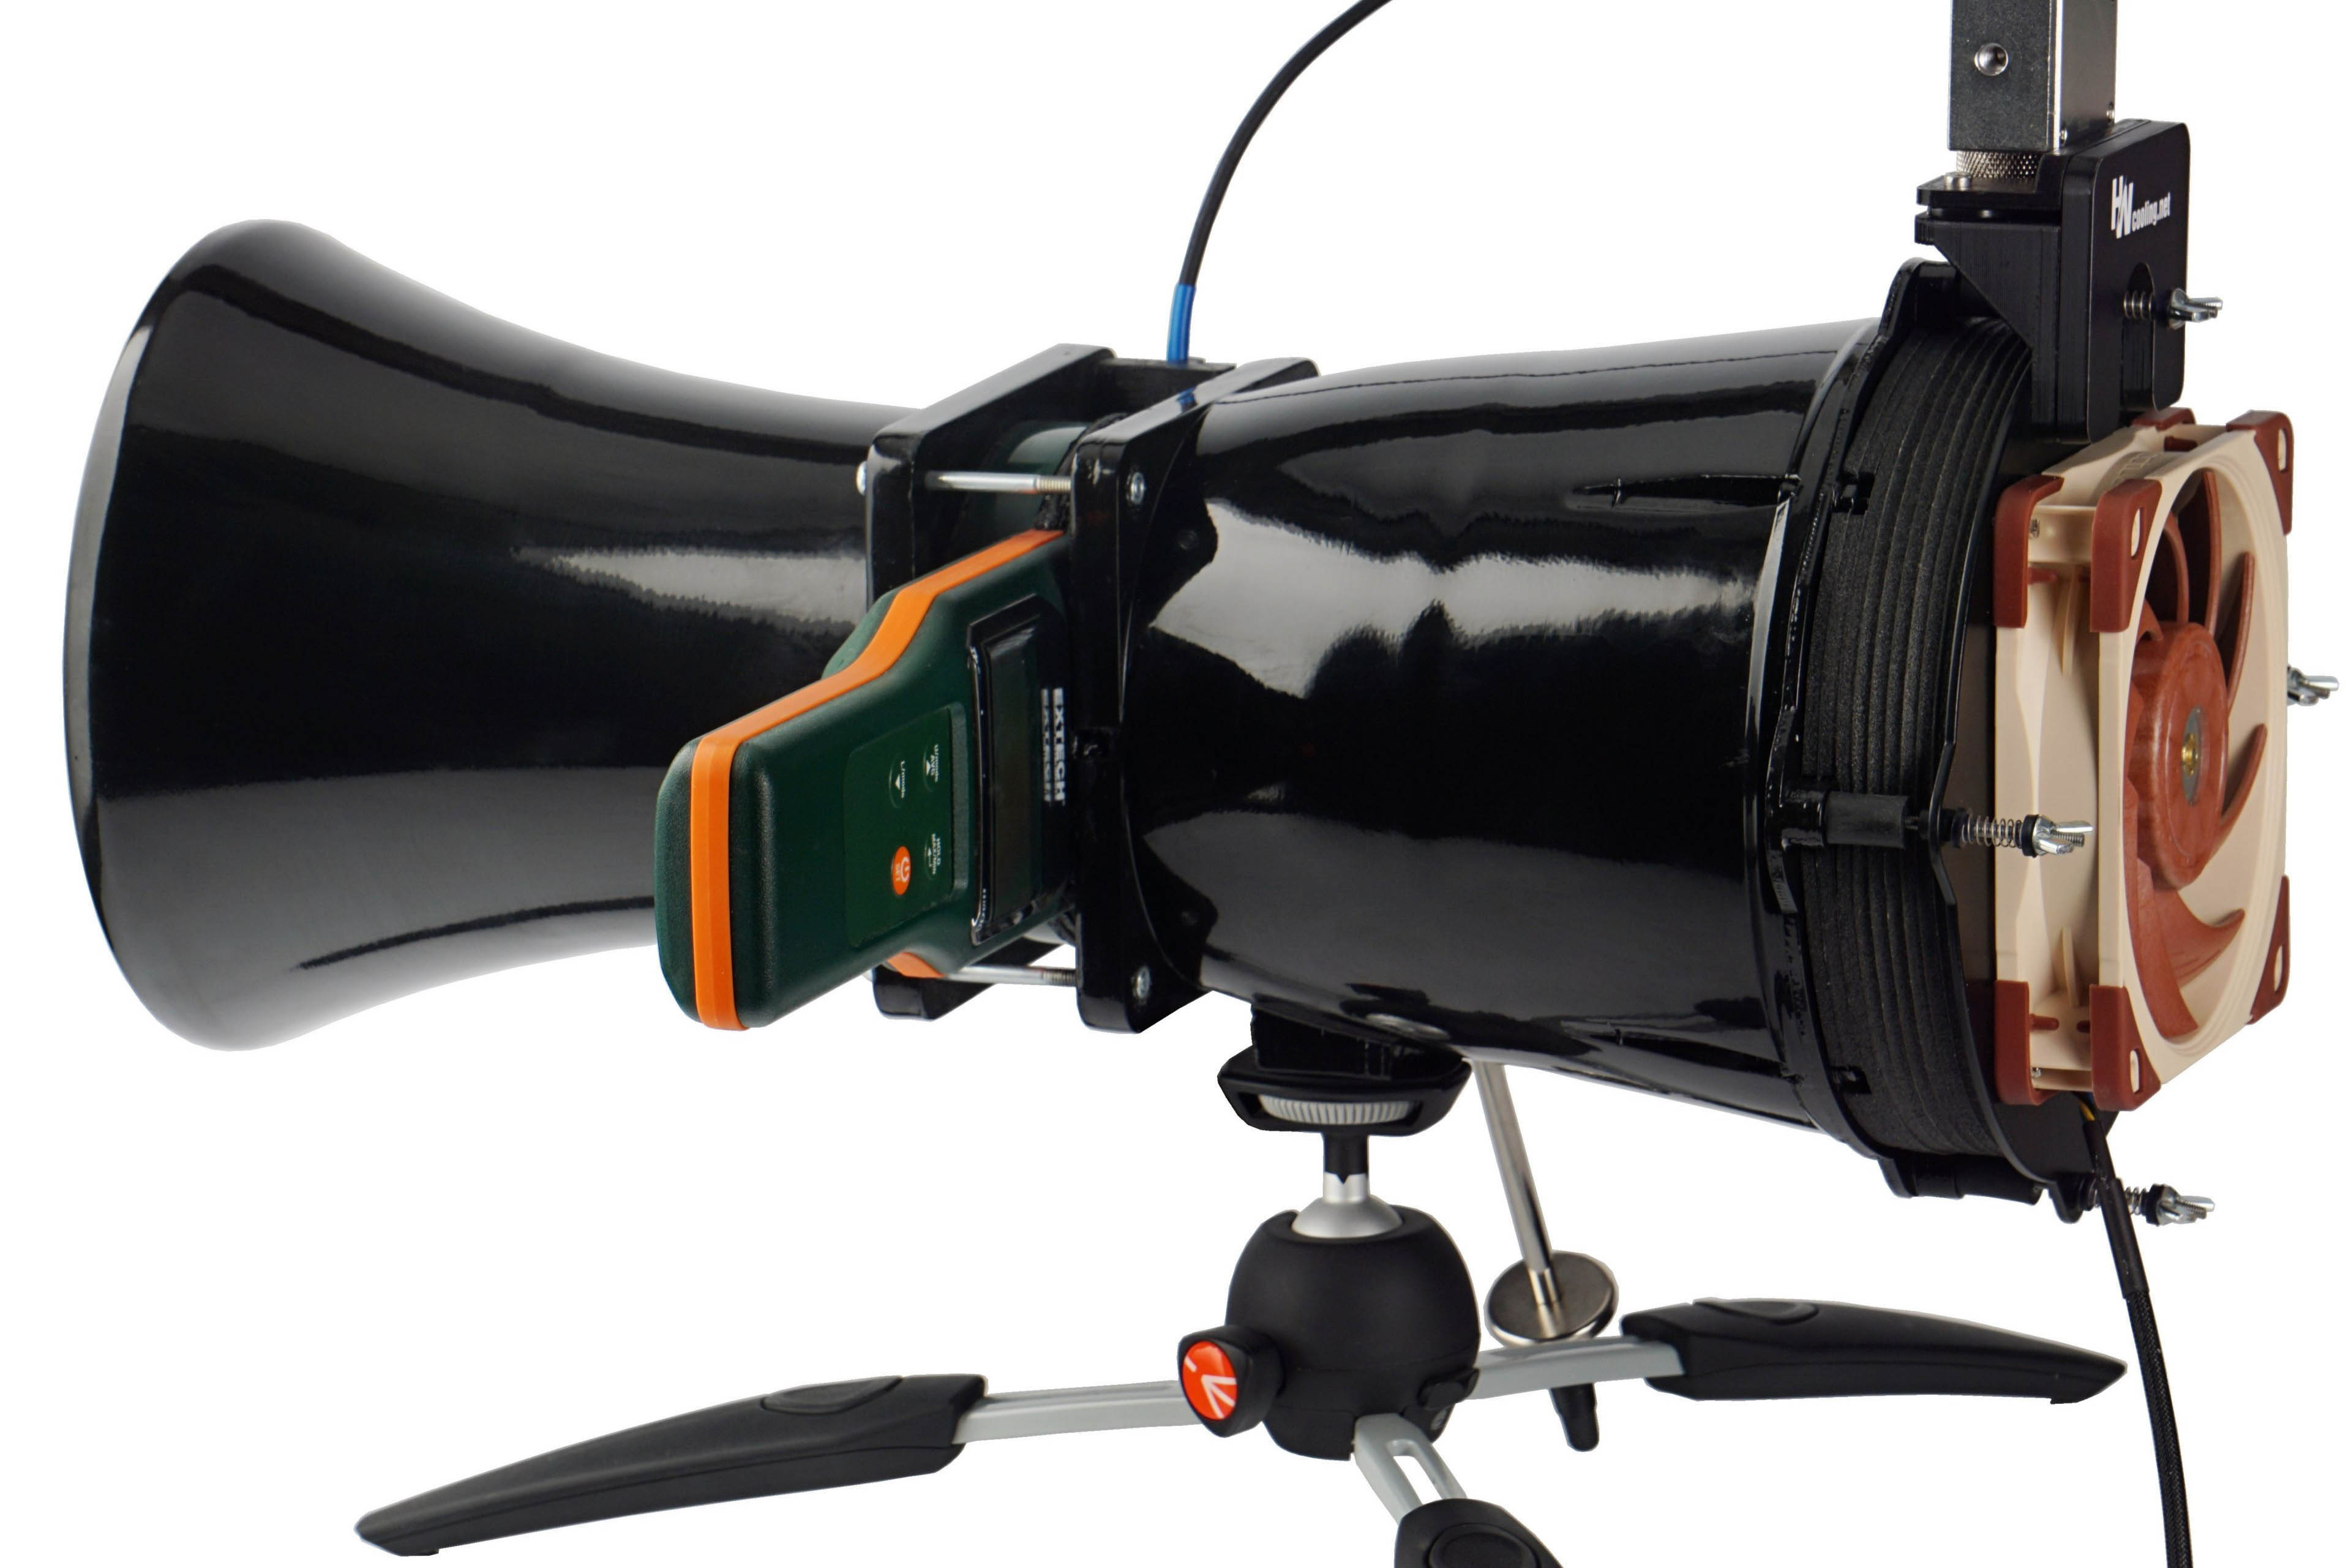
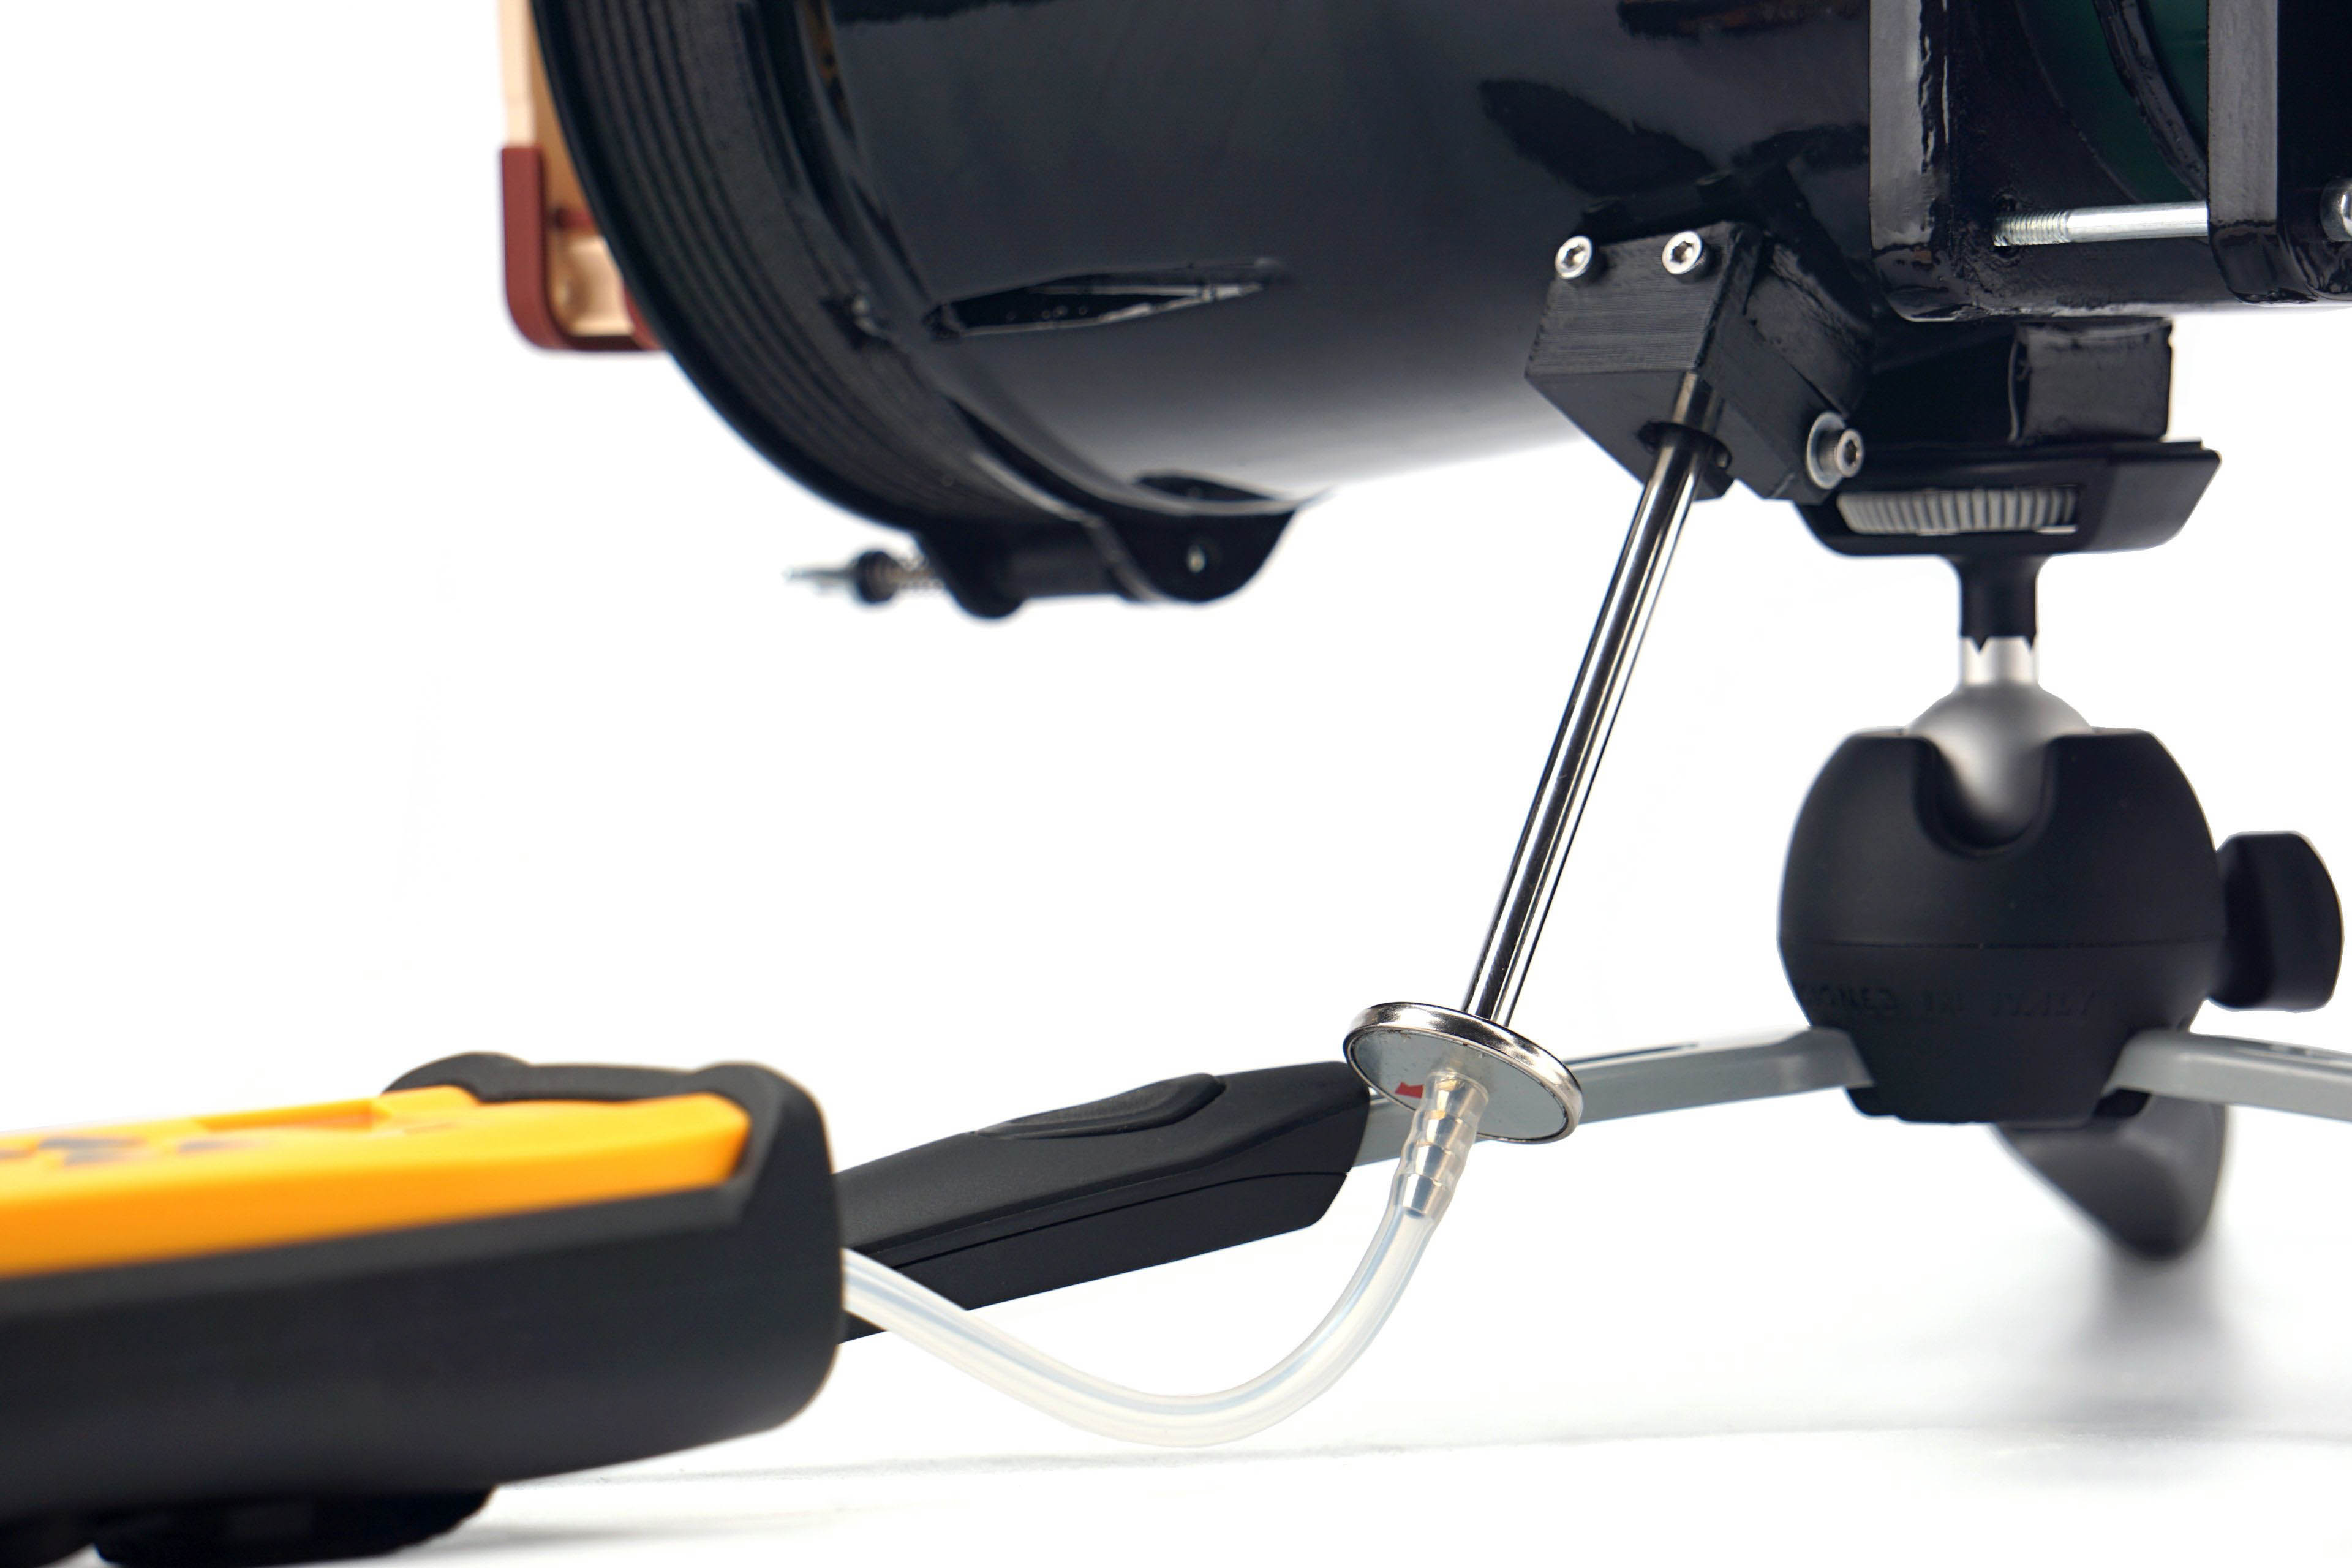
Before you start reading the methodology with all the details, take a look at the test tunnel as a whole. This is the heart of the whole system, to which other arteries are connected (manometer, vibrometer, powermeter, …). The only solid part of the tunnel from the measuring instruments is the anemometer.
The shape of the wind tunnel is inspired by the Venturi tube, which has long been used to measure the flow of liquids and gasses. The Venturi effect for wind speed measuring is also known from the aerospace industry. However, the design for measuring computer fans has its own specificities, which this proposal of ours reflects.
The individual parameters of the HWC wind tunnel for fan tests are the result of physical simulations and practical debugging. All the details (folds, material or finish used) have a rationale behind them and are designed this way for a specific reason. We will discuss the individual design details in turn in the description of the sub-variable measurements.
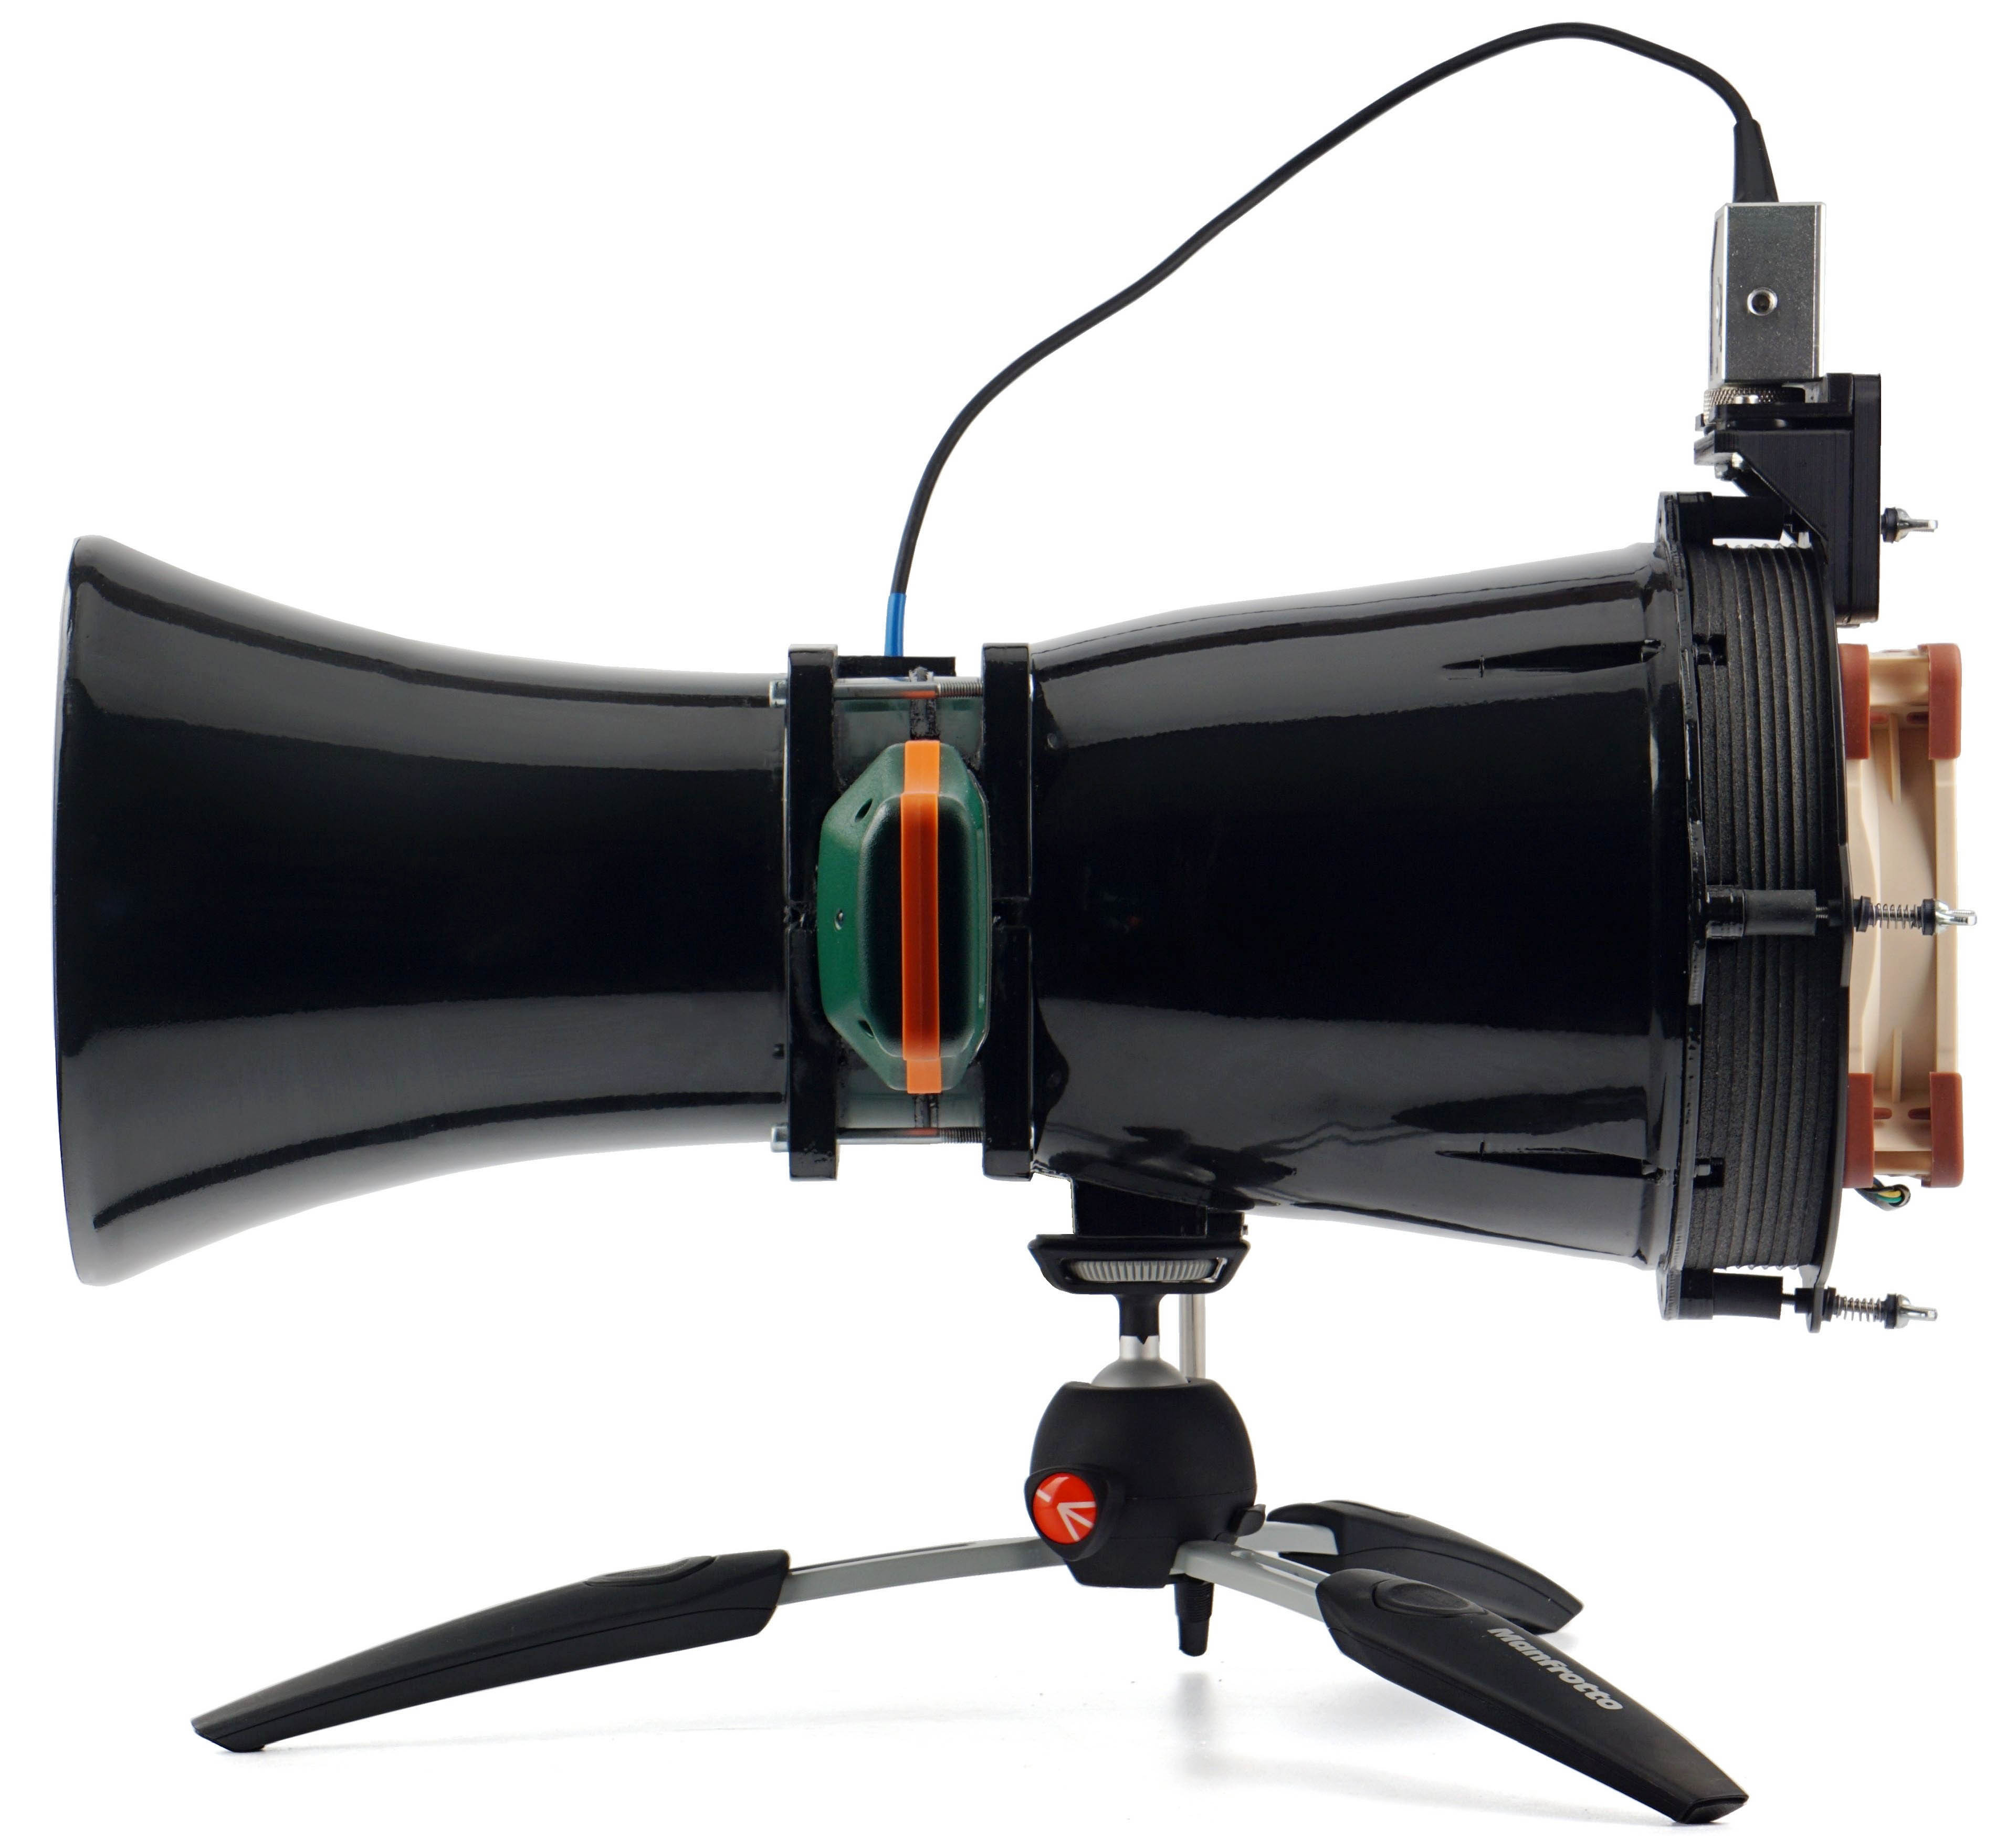
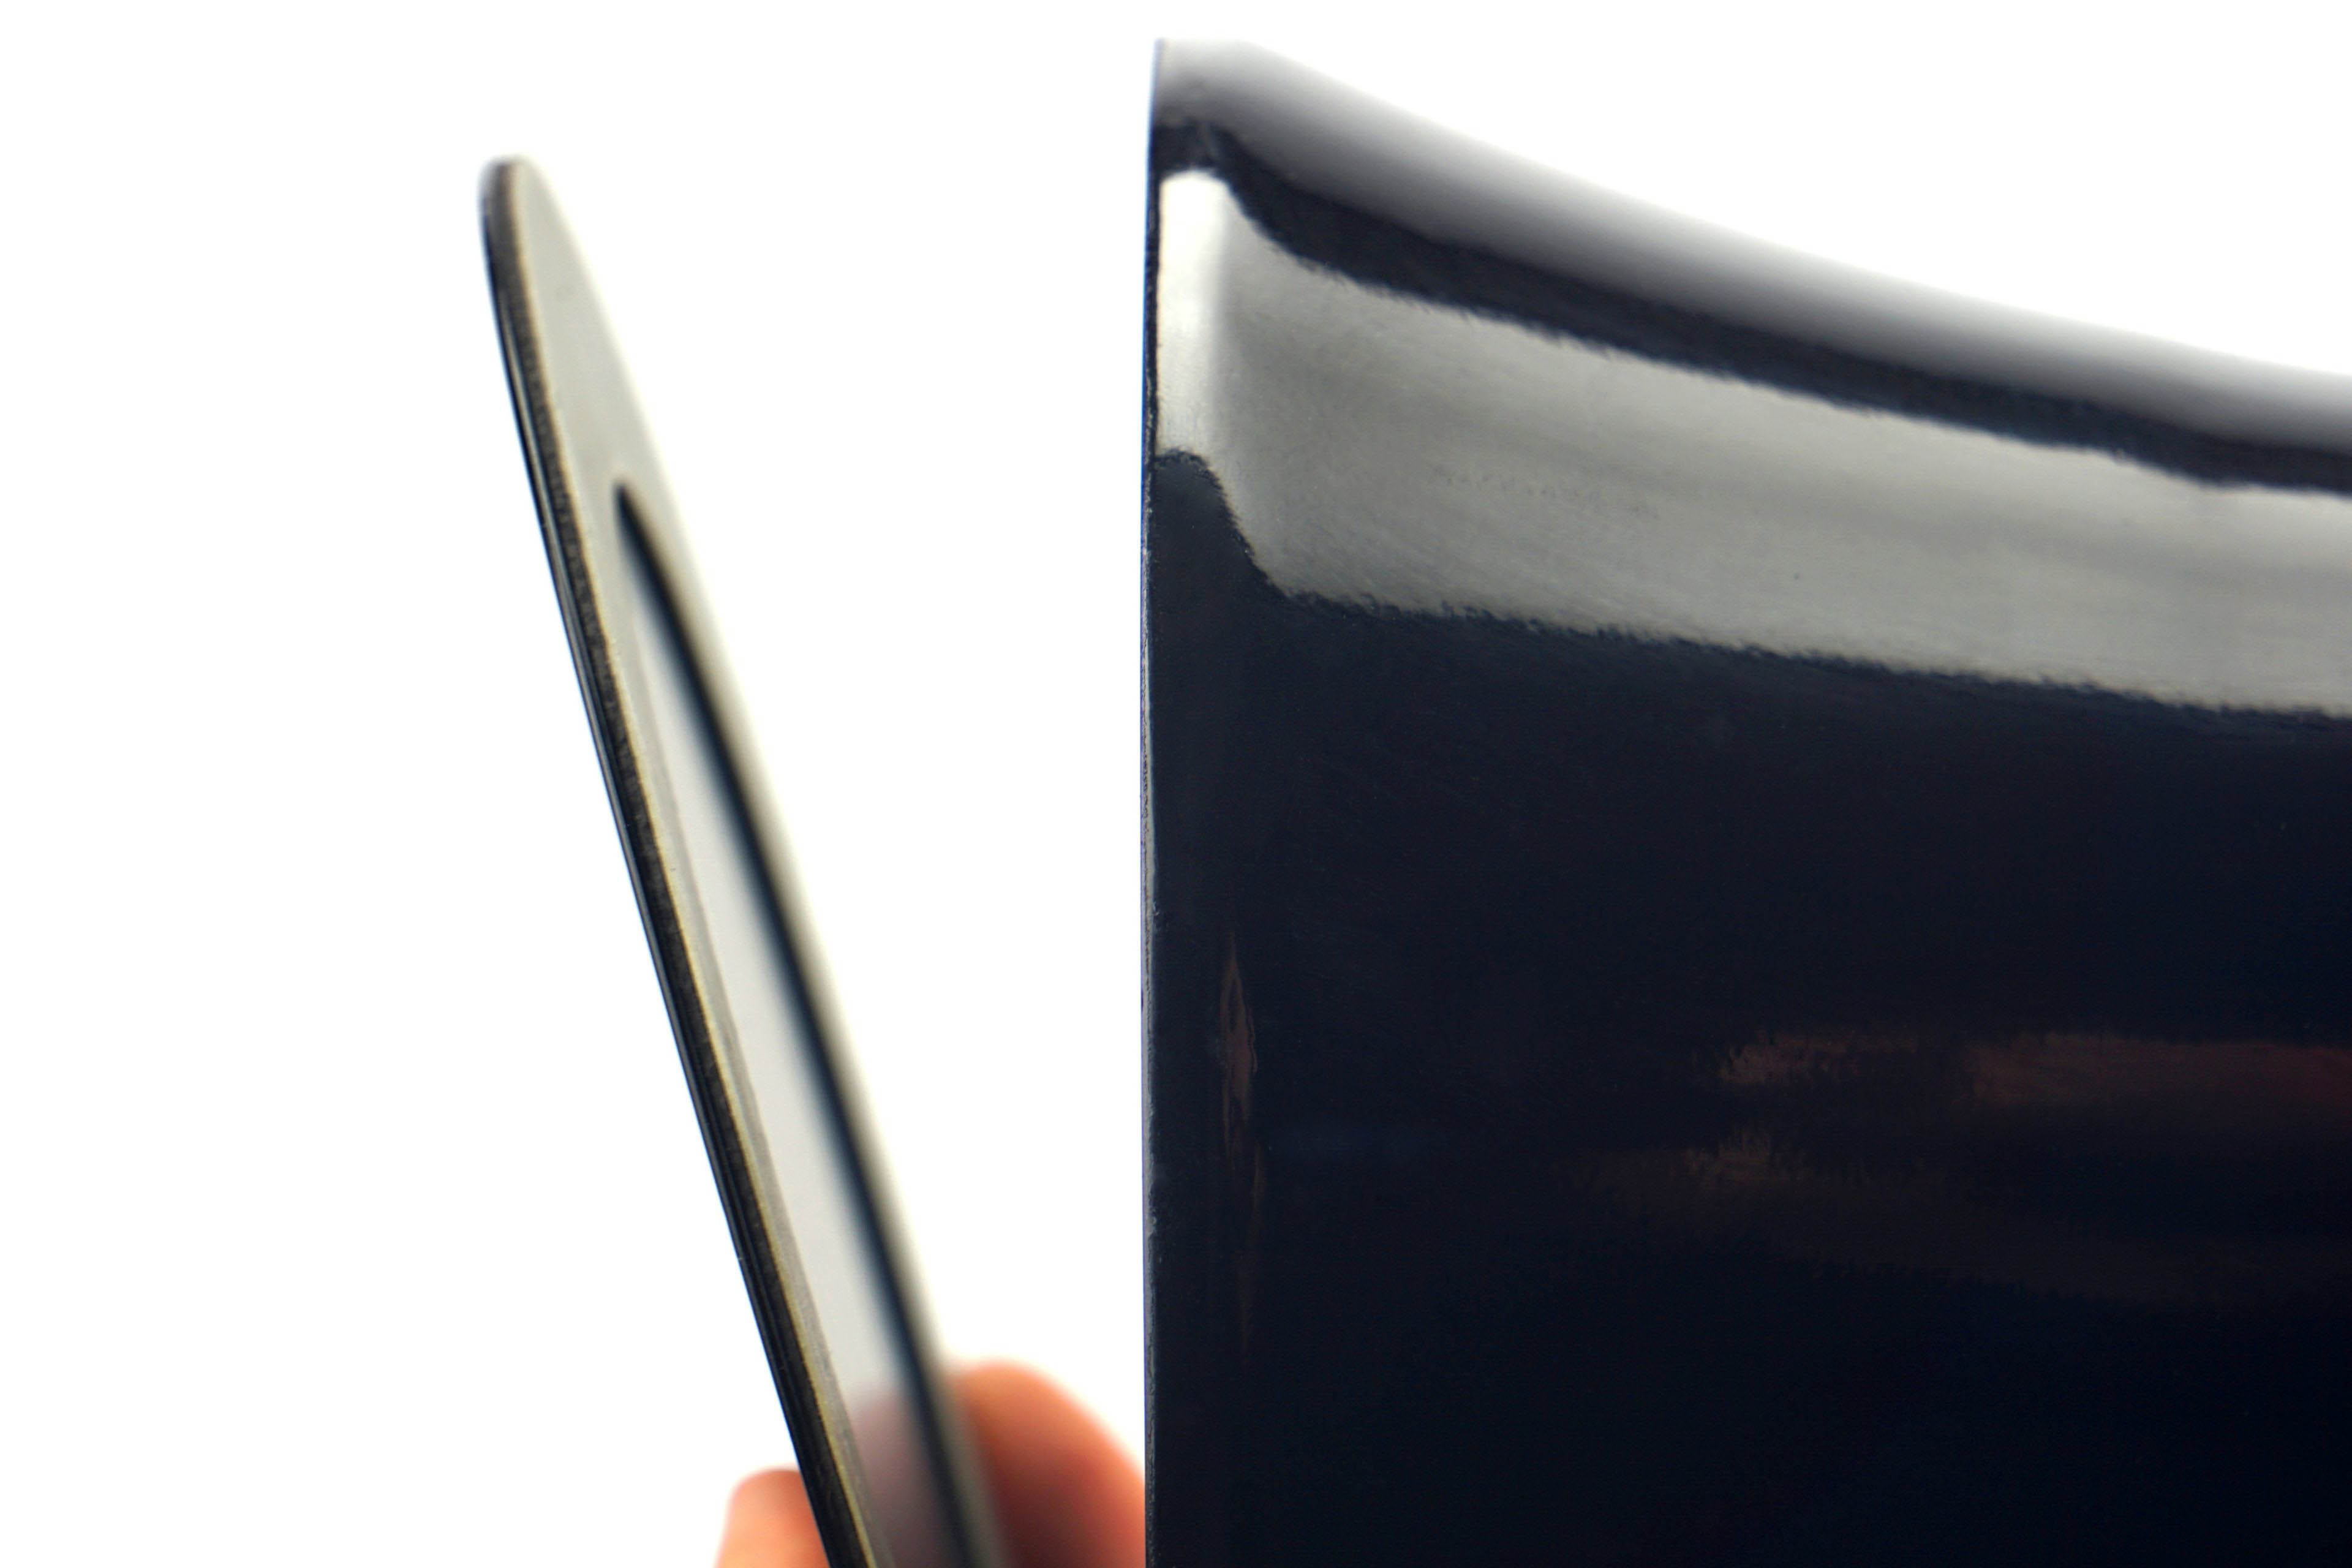
Now we will briefly elaborate on some things that do not fit thematically into the text of the following chapters. Namely, for example, that the skeleton of the wind tunnel is the work of a 3D printer (PLA). The rough print was, of course, then thoroughly machined by grinding, fusing, polishing and varnishing. Especially important is the smooth finish of the interior walls.
When joining the individual parts, the emphasis was on making sure that they fit together flawlessly, that they were sealed flawlessly (we will come back to this when we describe the test procedures for pressure measurement), but also that the joints were not loosened by use. Everything is disassemblable for servicing purposes, but it is ensured that the properties are maintained during use and, for example, even under the stress of vibration. The threads are secured with either lock nuts or thread-locking fluid. It depends on which is more suitable in which place.
When the wind tunnel is not in use, it is enclosed in a dust-tight chamber. In addition to the technical equipment and its correct storage, it is also important for objective outputs that all measuring instruments are calibrated according to the standard. Without this, it would be impossible to stand behind your results and rely on the manufacturers’ specifications. Calibration protocols are therefore an important part of the methodology. Testing is carried out at an ambient air temperature of 21–21.3 °C, humidity is approximately 45 % (± 2 %).
Fans come to us for testing in at least two pieces of the same model. If the deviations of any of the measured values are greater than 5 %, we also work with a third or fourth sample and the average value is formed by the results of the fans that came out the most similar and the differences between them fit under 5 %.
The introduction to this article has been rewritten several times. The original versions resorted to describing the adverse events that caused the long-announced fan testing to be so dramatically delayed. But the text was always dreadfully boring… the important thing is that everything managed to make it to the start. But before the starting gun, come take a thorough walk around the track where the measurements will take place.
Mounting and vibration measurement
Naturally, each tested fan must first be properly mounted. With all that we want to measure, and with the kind of precision that is required for relevant measurements, even the smallest details matter. The whole mounting system is quite complex and we are happy to have fine-tuned it to maximum satisfaction. Even if it meant hundreds of hours of tinkering. What’s so complicated about it? There’s more.
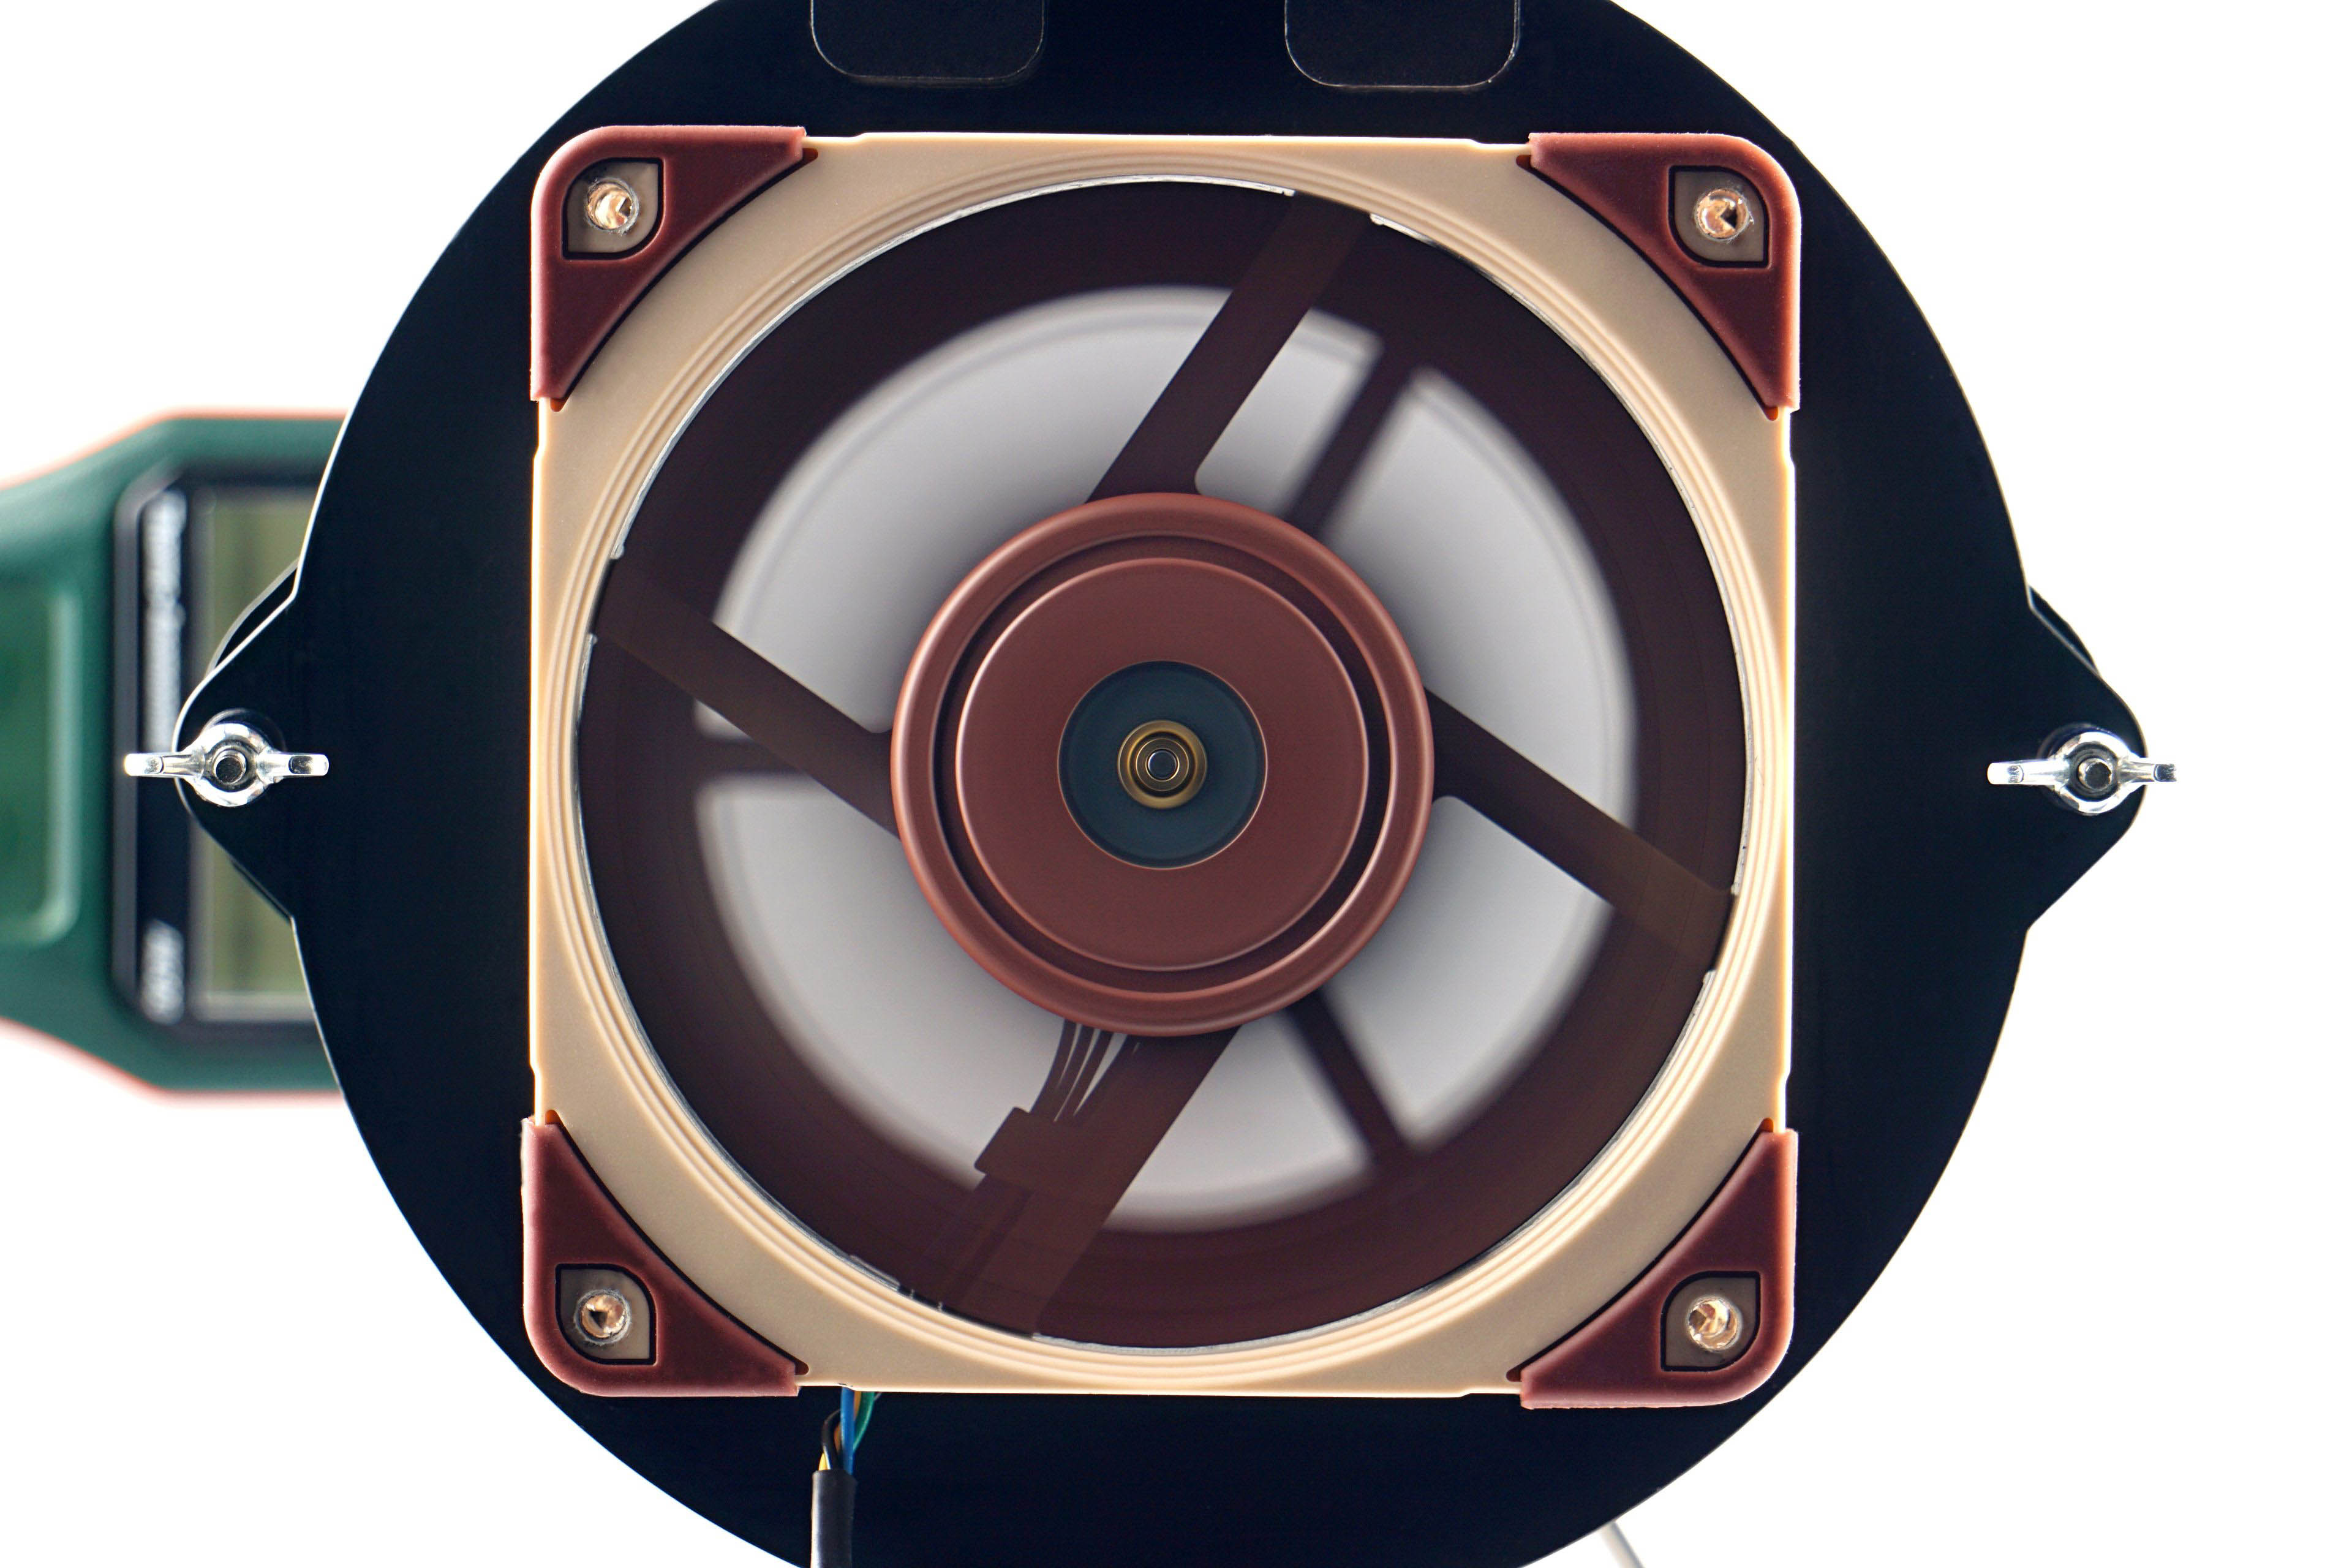
The fans are installed to the multi-purpose bracket. The substrate is a 2 mm thick metal plate to which the fan is attached, or the fan is attached together with an obstacle (e.g. a filter, hexagonal grille or liquid cooler radiator).
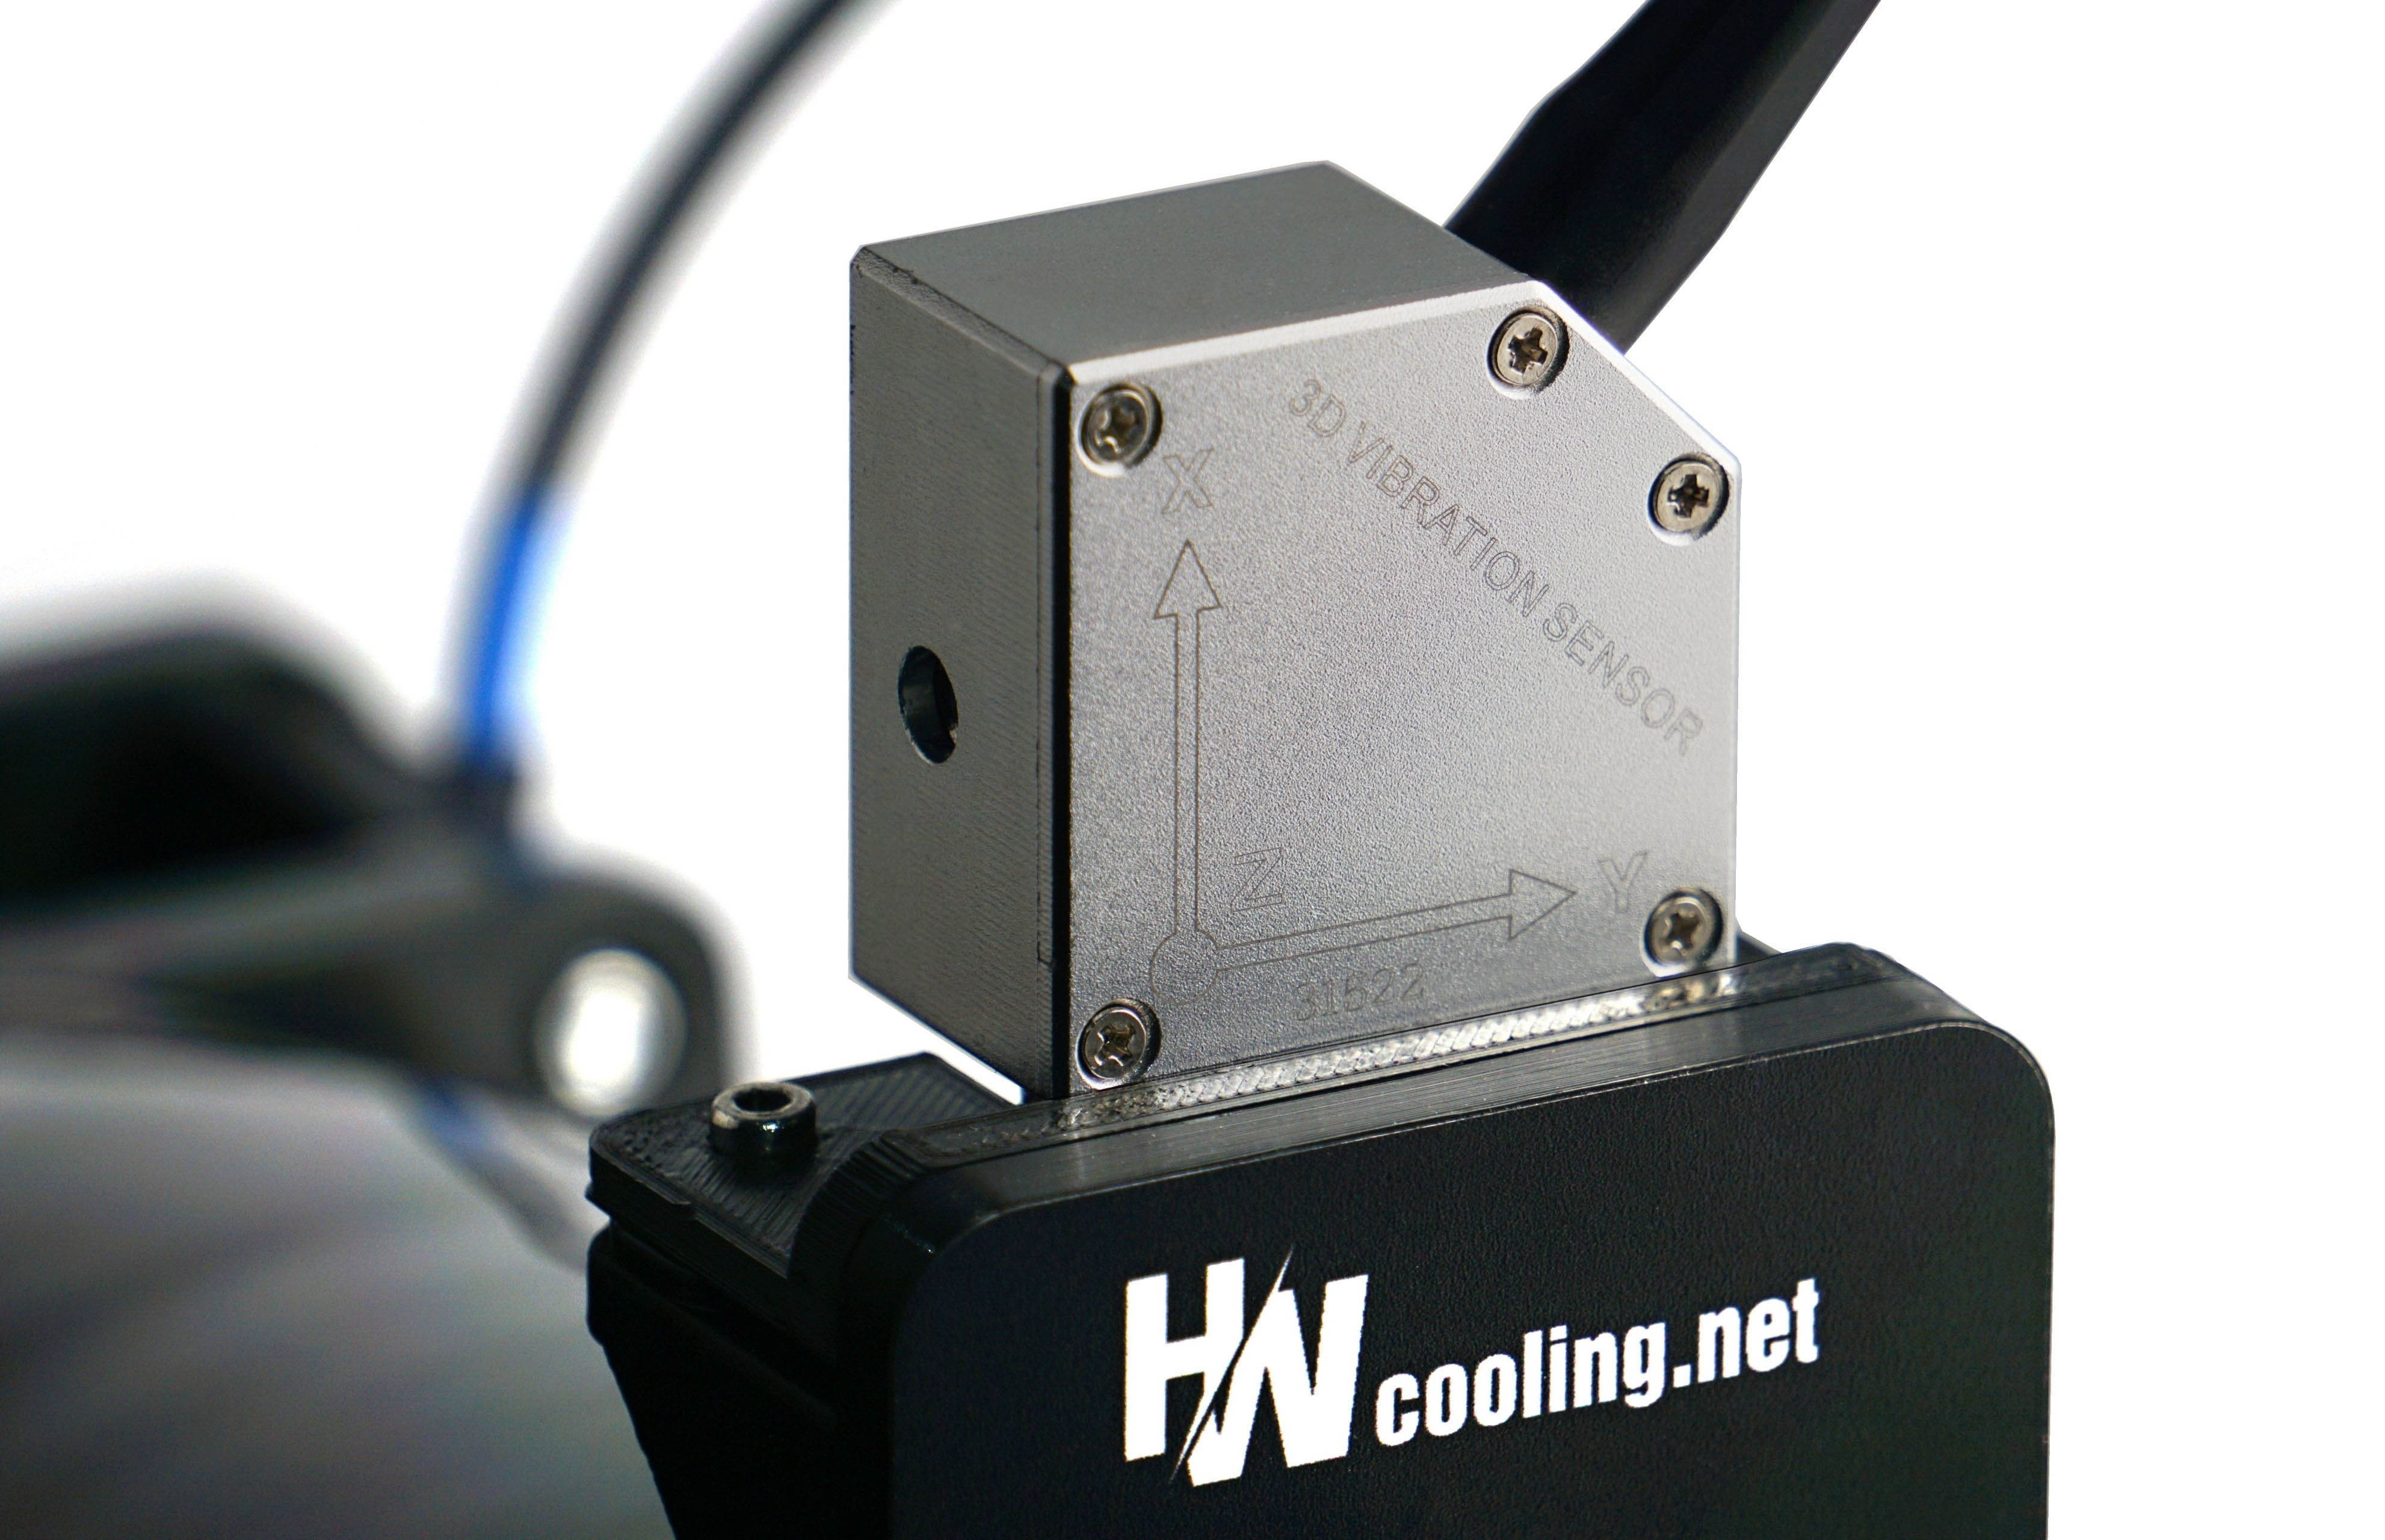
For correct and always equal pressure, the fans are always tightened with the same force with a torque screwdriver. If this were not the case, joints and clearances in the assembly could arise, in short, uneven conditions with undesirable distortion. For example, also for vibration measurement. On top of the fan mount there is also a bracket for the three-axis vibrometer sensor. The latter is magnetically attached via a steel insert, on which the sensor exerts a force of one kilogram and, thanks to the stop, is also always in the same place and in the same contact with the rest of the structure. These are the basics in terms of repeatability of measurements.
In order to capture the intensity at the highest possible resolution, the tray of the holder cannot be too heavy and at the same time it must be strong enough not to twist. This would again cause various distortions. Therefore, we used a hard (H19) aluminium (AL99.5) plate for the construction of the holder, whose weight is just enough so that free movement is not significantly restricted.
To achieve the finest possible resolution for vibration measurement, soft rubber inserts are provided in the mounting holes through which the bracket is installed to the tunnel. And just behind these inserts are silent blocks with a very low hardness of 30 Shore. These are also used so that the vibrations of the fans don’t spread to the tunnel skeleton. If this were to happen, then for fans with more intense vibrations, this secondary noise component, which is not related to the aerodynamic sound of the fan, would also be reflected in the noise measurement results.

This is where it is good to have ideal conditions, even though they are unattainable in practice, because fan vibrations will always be transmitted to the case skeleton to some degree. But each cabinet will react differently to them, or rather the final noise level will depend on a number of factors, starting with the materials used. Therefore, it is a good idea to filter out this extra noise component in tests and in practice take into account the measured vibration intensities. The higher these vibrations are, the higher the noise addition has to be taken into account.
The silent blocks are naturally formatted to offset the bracket a bit from the rest of the tunnel, otherwise they wouldn’t make sense. This creates a gap that is sealed across the entire surface with a soft foam seal with closed cell structure (i.e., it’s airtight).
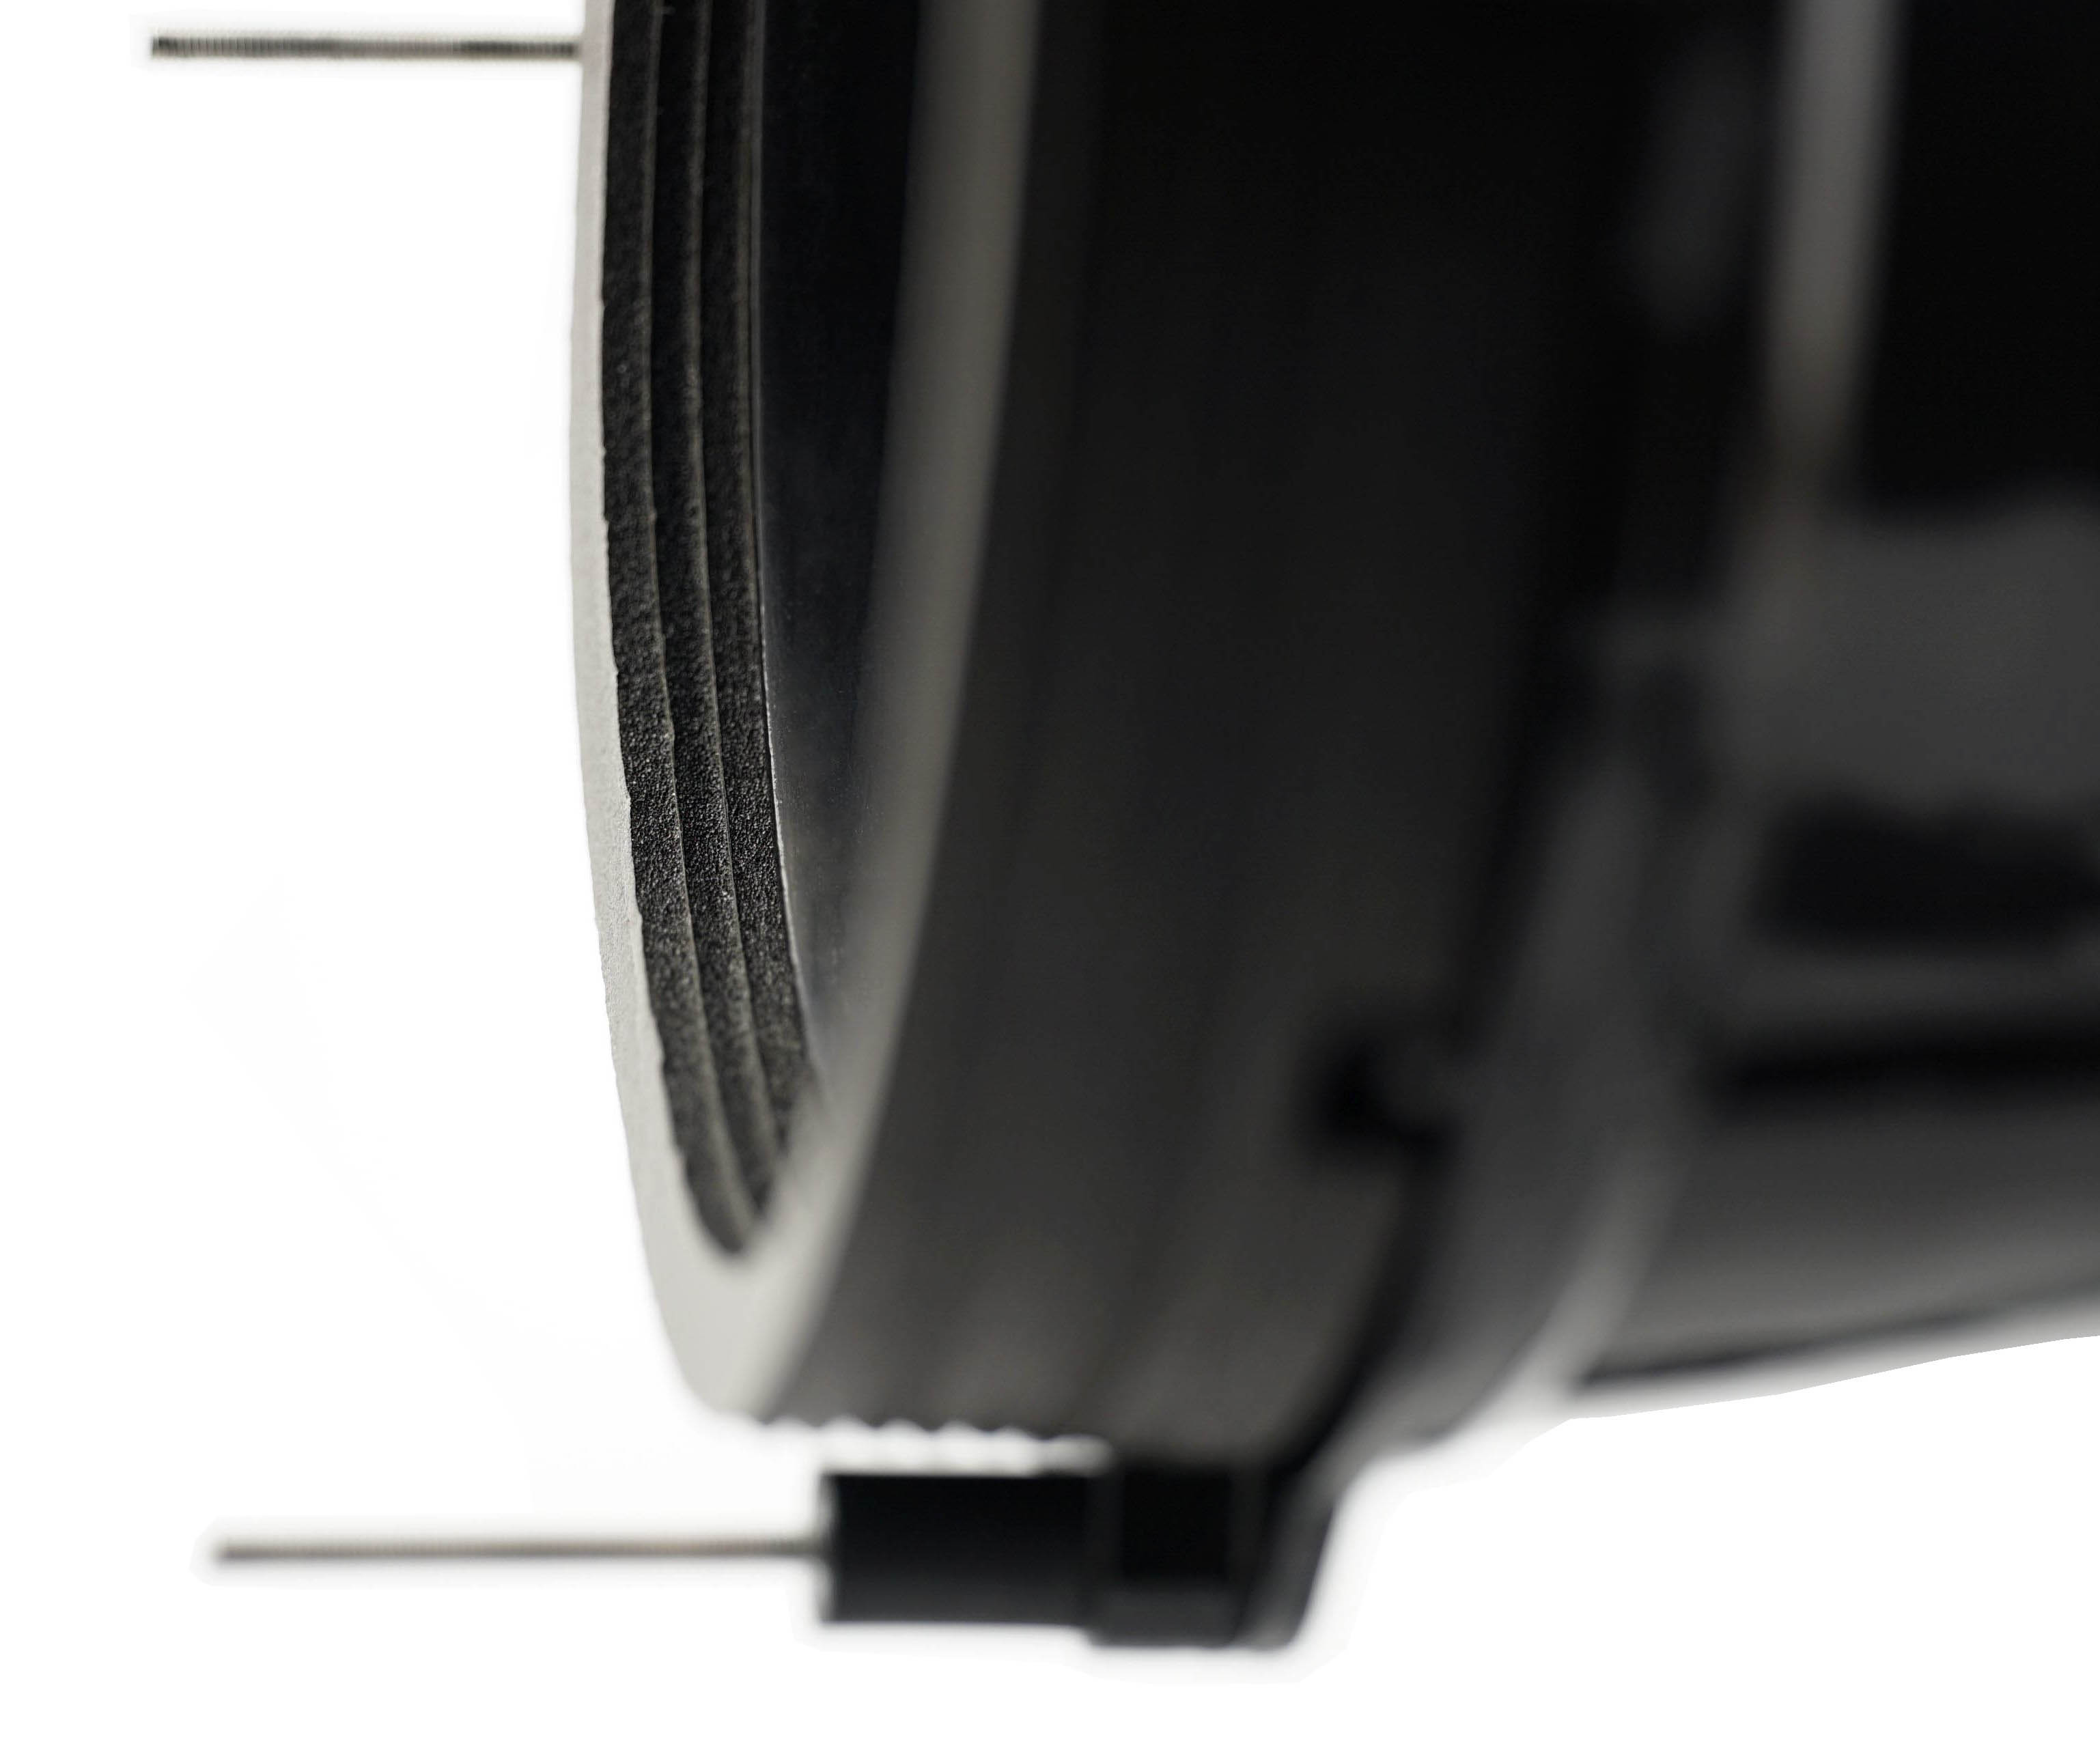
To properly center the fan rotor in relation to the other elements, the bracket includes a protruding frame that follows the inner contour of the seal. And to make matters even more complicated, the frame with the tested fan is pressed against this seal by a small force of compression springs, which in turn is set with the highest possible resolution for vibration measurement in mind and at the same time so that sufficient pressure is generated to maintain a flawless seal.
Vibration is measured with a Landtek VM-6380 vibration meter. It records the vibration speed (in mm) per second in all axes (X, Y, Z). For quick orientation, we calculate a 3D vector from the measured values and graph the “total” vibration intensity. But you can also find your results if you are only interested in a specific axis.
The most complicated part of the tunnel is behind us, and we’ll move on in the next chapter. But we will still stay at the beginning of the tunnel, we will just turn to the peripheries on the sides.
To write that we have something mapped out to the last detail is perhaps too bold, but after proper preparation, few pieces of hardware are as easy to evaluate as fans. Of course, this had to be preceded by long preparations, developing a methodology, but you already know the story. What you don’t know yet is the first fruit, or rather the results of Akasa, SilentiumPC, SilverStone, Xigmatek or more exotic Reeven fans.
Initial warm-up…
Before we even start measuring anything, we let the fans run “idle” for a few minutes after plugging them in. This is because immediately after a cold start the fans reach different parameters than after a certain amount of short-term operation.
Until the operating temperature of the lubricant is stabilized, a typically lower maximum performance is achieved. This is because at lower temperatures the lubricant is denser, which is associated with higher friction. Therefore, the fans do not reach maximum speed immediately, but only after the first few seconds. Before the first measurements, we therefore leave the fans running for at least 300 seconds at 12 V, or 100 % PWM intensity.
…and speed recording
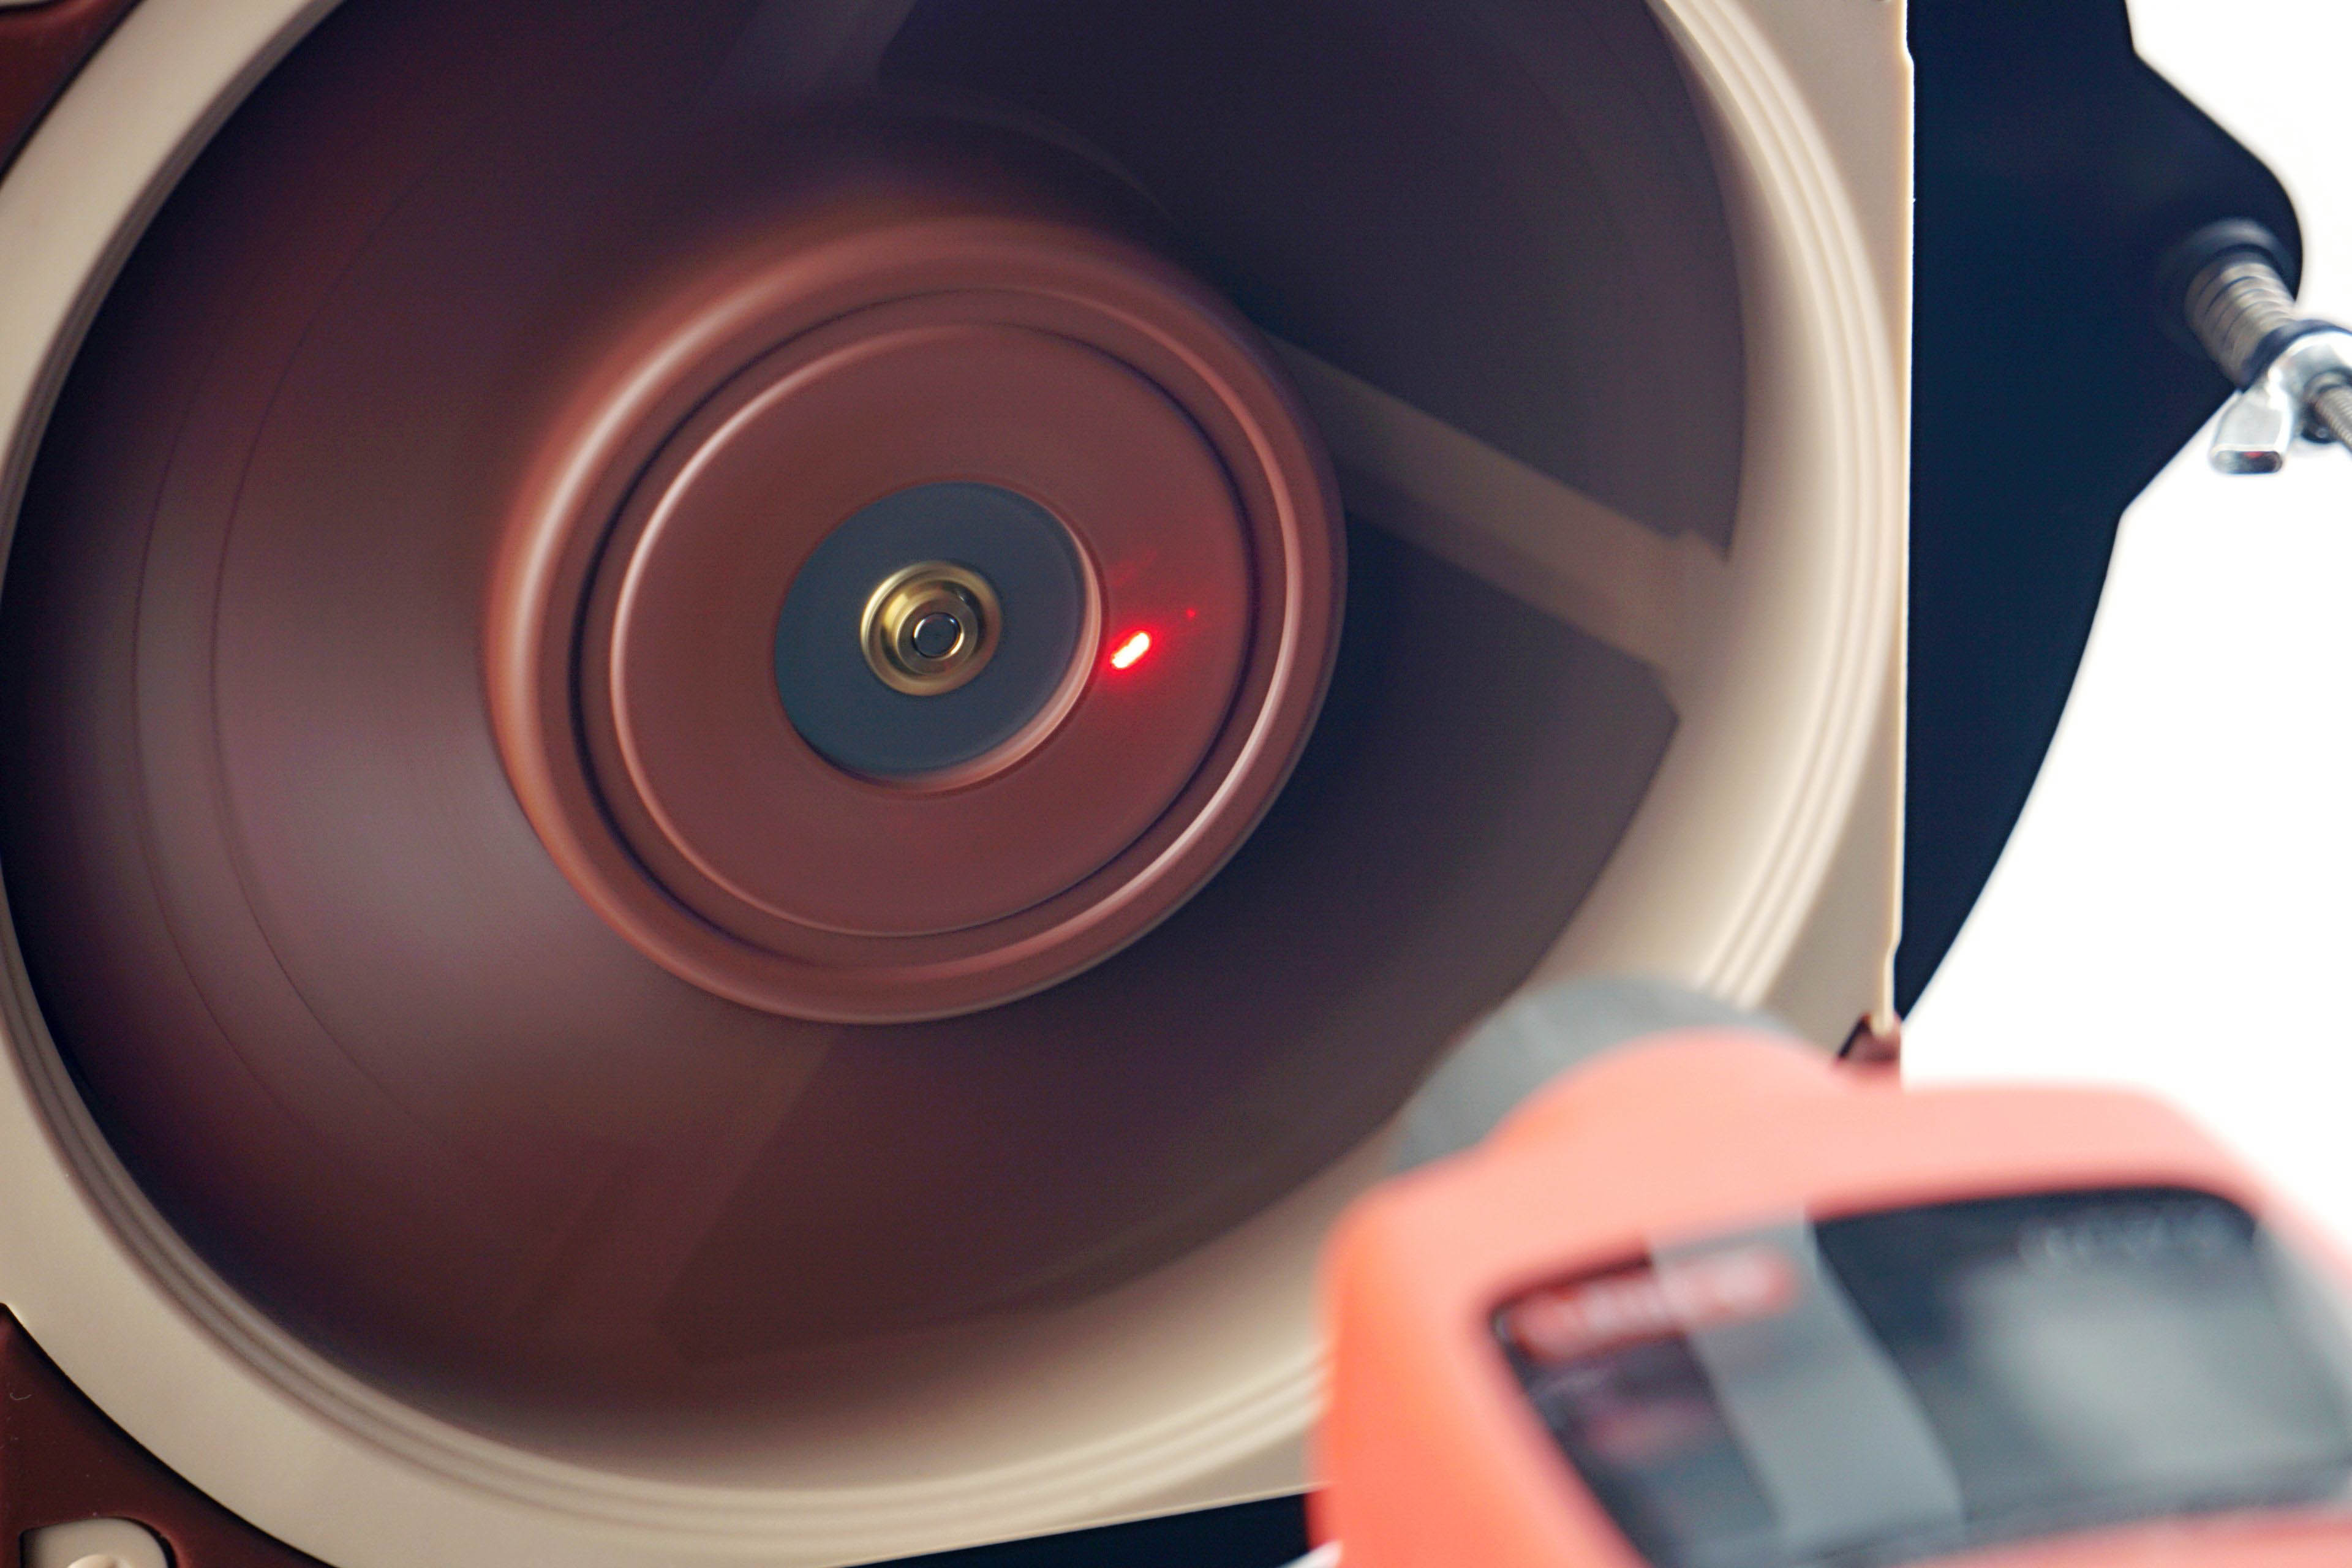
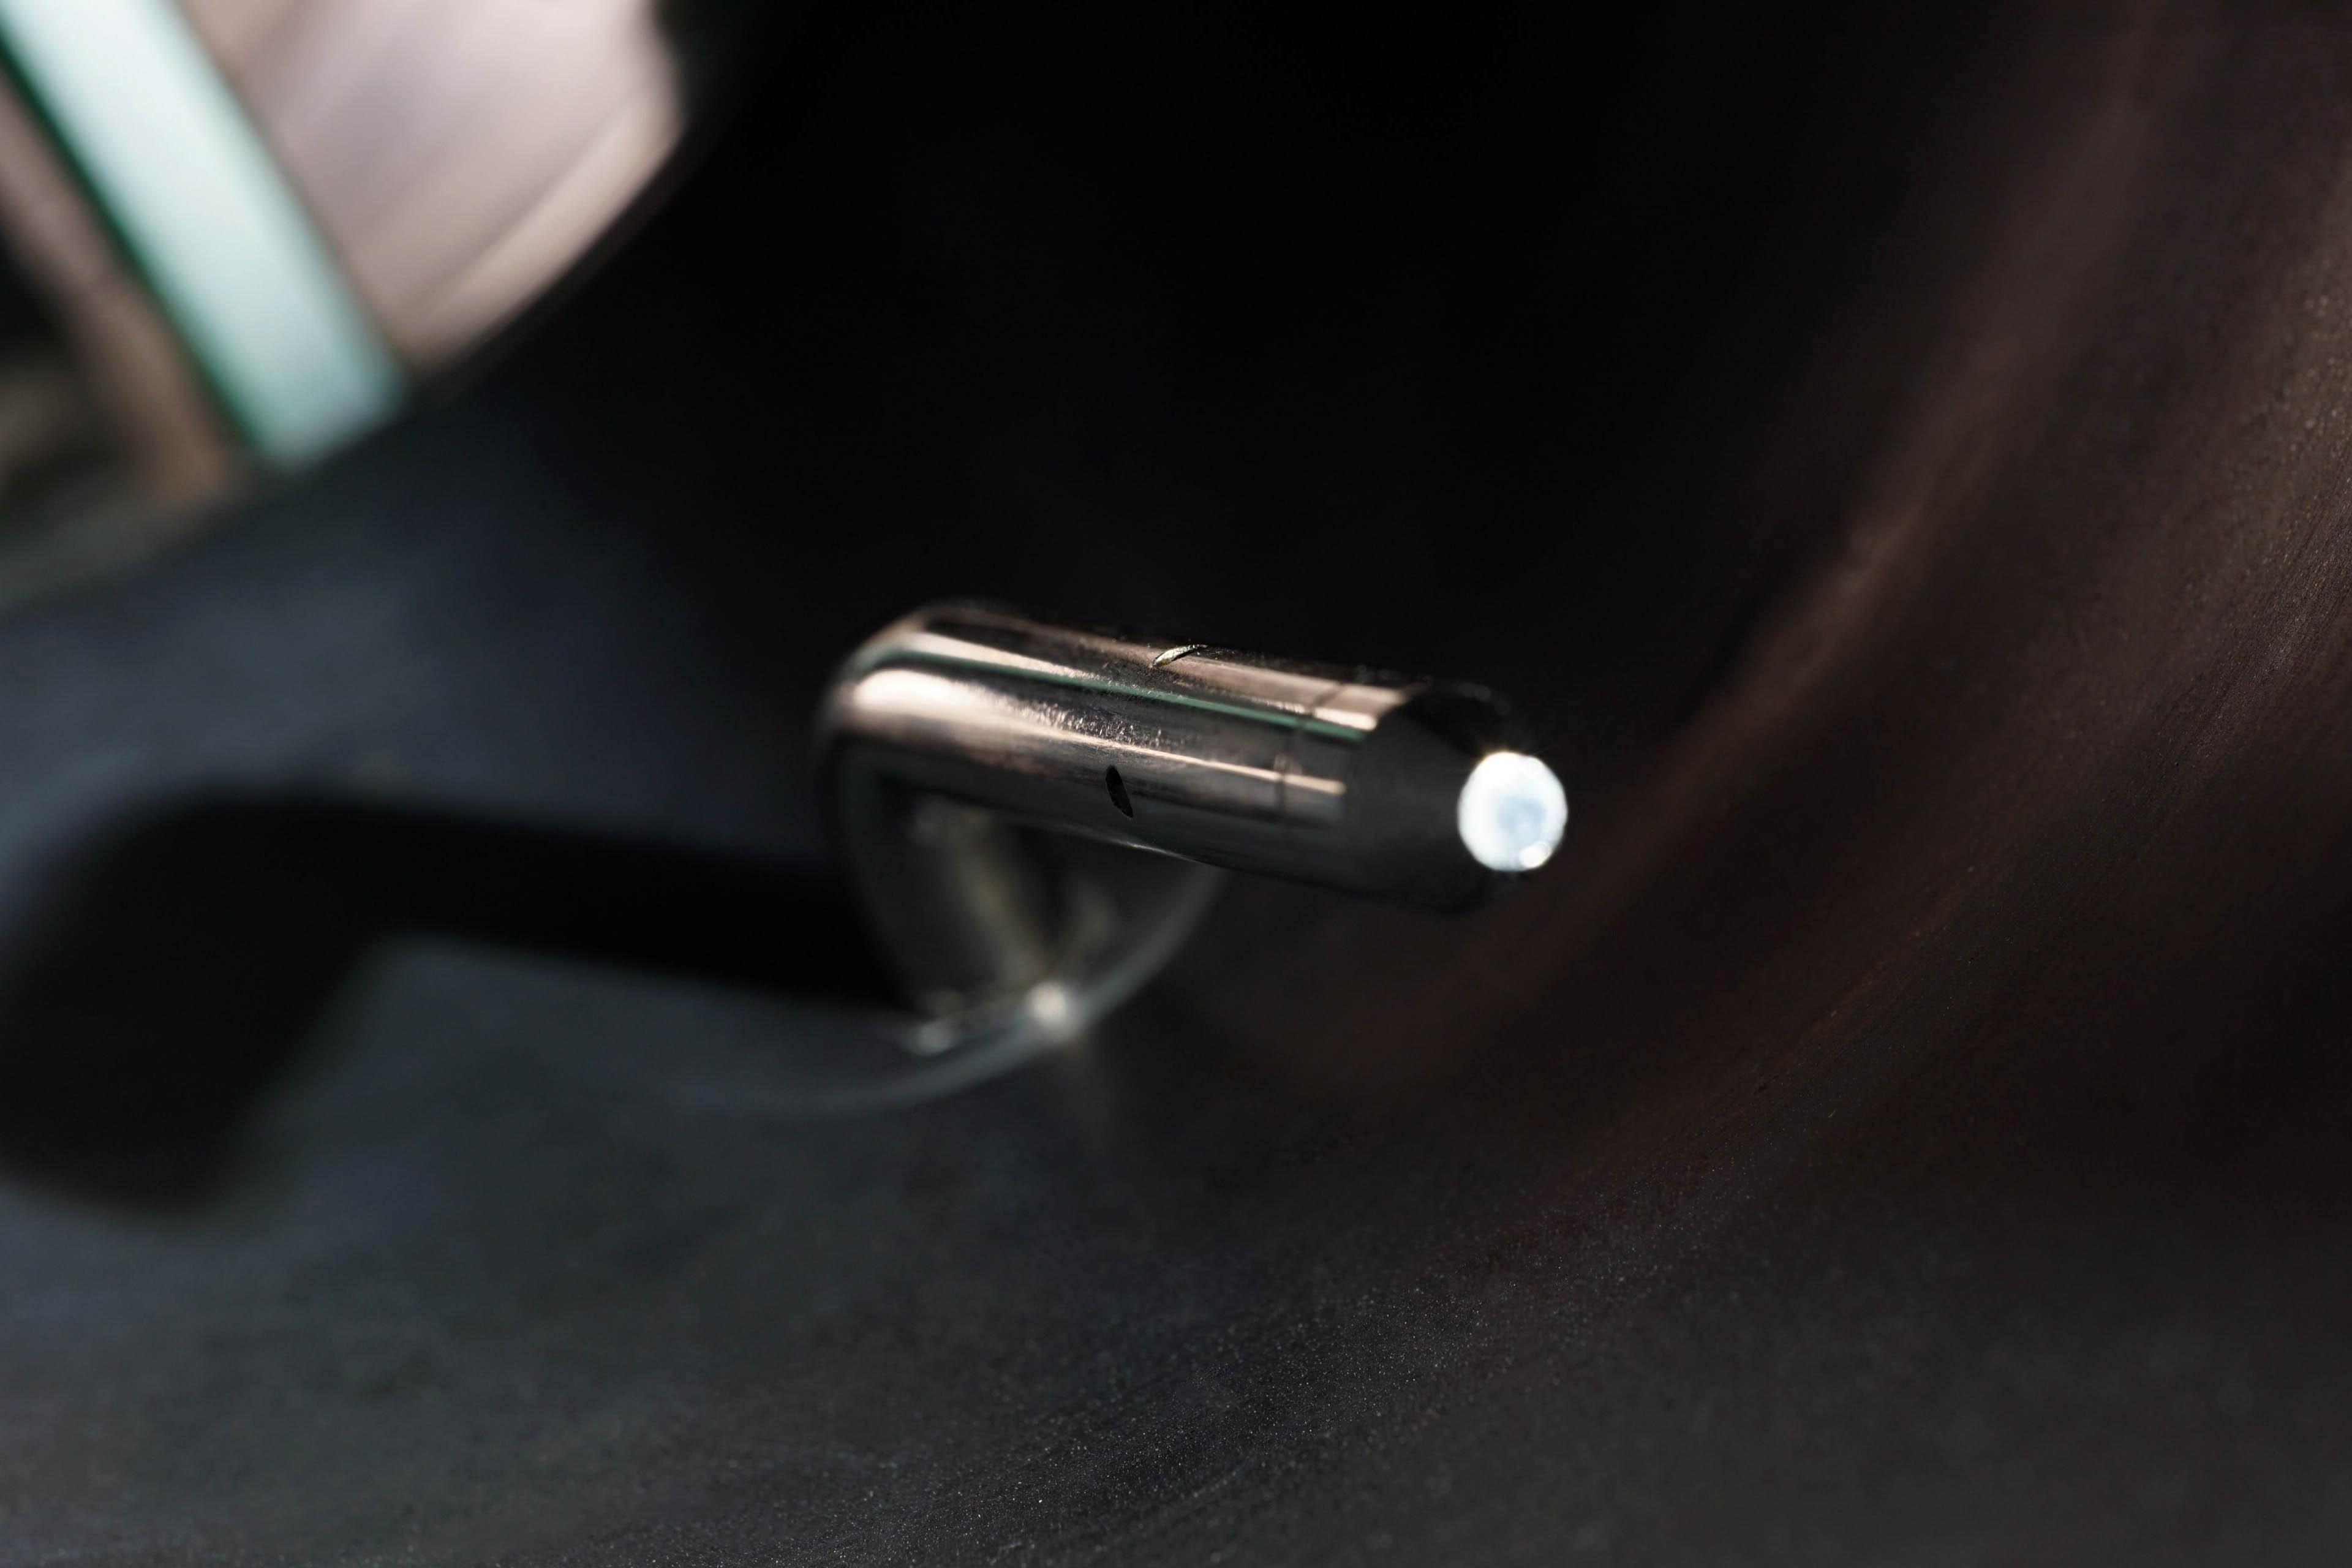
The speed of the fans is monitored using a laser tachometer, which reads the number of revolutions from a reflective sticker on the rotor. For this purpose, we use the UNI-T UT372 device, which also allows real-time averaging of samples. Thus, we do not record the peak value in the graphs, but the average speed value from a 30-second time period.
However, the speed itself is a relatively unimportant parameter that is often given more attention than is appropriate. This is the case even in many fan or cooler tests, where speed is used to normalize the different modes in which other variables are measured.
However, hyper-focusing on a specific speed is a rather unfortunate decision if only because the fans don’t gain any commonality. At the same speed all other variables are different, there is no intersection. It can be noted that a better normalization would have been by any other variable, whether it be static pressure, flow or noise level, which wins in our case. But more on that in the next chapter.
We only measure the speed so that you can associate a particular parameter (such as the amount of static pressure or some noise level) with something according to which you can adjust the fan yourself. Perhaps for that alone, the information about the achieved speed is useful. As part of the fan analysis, we will also indicate what the fans’ starting and minimum speeds are. Start-up speeds tend to be higher than minimum speeds because more force is required to get the rotor moving than once the fan rotor is spinning, and a minimum power intensity is sought at which the fan does not stall.
To write that we have something mapped out to the last detail is perhaps too bold, but after proper preparation, few pieces of hardware are as easy to evaluate as fans. Of course, this had to be preceded by long preparations, developing a methodology, but you already know the story. What you don’t know yet is the first fruit, or rather the results of Akasa, SilentiumPC, SilverStone, Xigmatek or more exotic Reeven fans.
Base 7 equal noise levels
There are several options by which to normalize the test modes for fans. In the previous chapter, we wrote that perhaps the least appropriate option is equal speed.
Settings according to the same static pressure or flow are for consideration, but we find it most sensible in the long term to normalize the measurement modes according to the same noise levels. Firstly because decibels are a logarithmic unit and all others scale linearly, but mainly because you can orientate fastest by the same noise levels. The easiest way to compare the efficiency of fans is just by how they perform at the same sound pressure level. Of all the options, this is the one that most people can best imagine and bounce off of when considering other variables.
The individual noise level modes are adjusted from low levels continuously to higher levels. All users will find their results in the tests, regardless of whether they prefer very quiet operation at the limit of audibility or whether high performance is paramount.
The quietest mode corresponds to 31.5 dBA, followed by 33 dBA, and for each additional mode we add 3 dBA, which always doubles the noise level (36, 39, 42 and 45 dBA). Finally, we measure the fans at maximum power. Here, each one already has a slightly different noise level, which we also report. If there are missing measurements between the results for any of the fans, this means that it was not possible to set the target noise level. Either because its minimum speed exceeds the quietest mode of 31.5 dBA or vice versa because the fan is quieter than 45 dBA at maximum power.
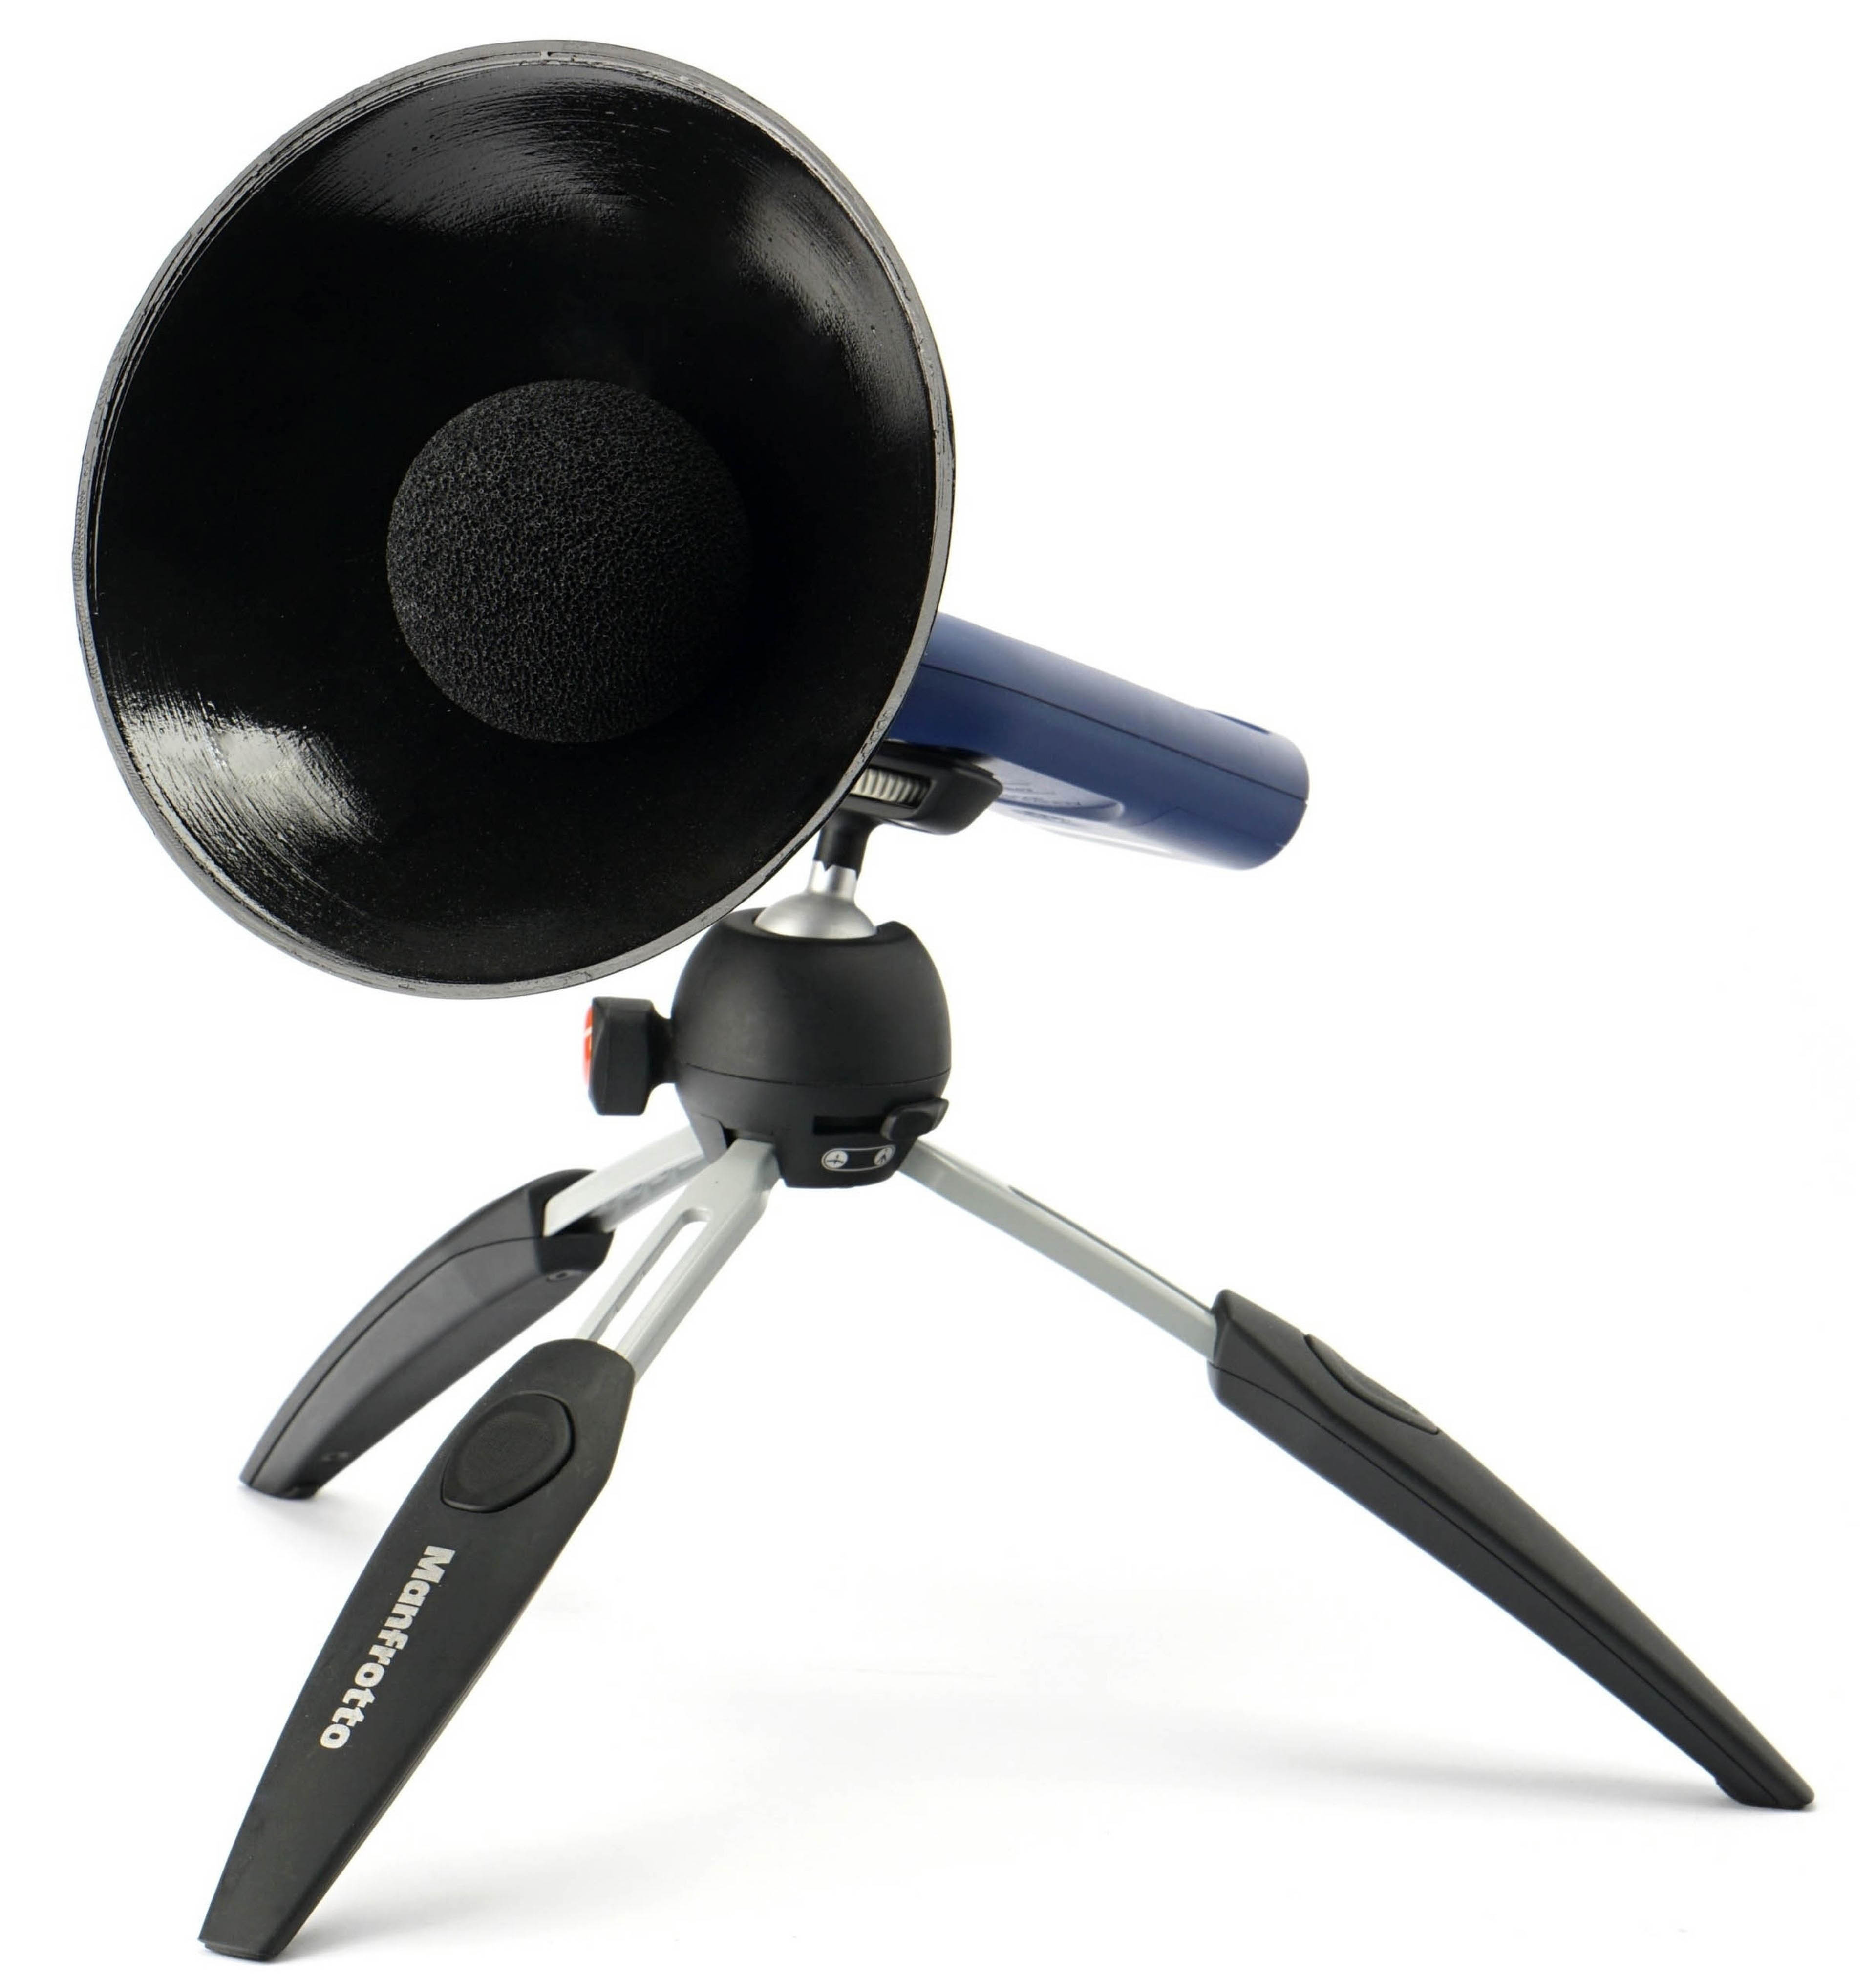
It is important to add that our noise level measurements are incomparable to the values quoted by the fan manufacturers in their specifications. One of the reasons is because we use a parabola-shaped collar around the sensor of the noise meter, which increases sensitivity. This is important in order to distinguish and set to the same noise level even modes at very low speeds, especially 31.5 dBA.
The noise meter next to the fan is quite close for sufficient resolution. The distance between the frame and the sensor is 15 centimeters. The sensor is positioned in such a way that there is no distortion or that the noise level measurements are not affected by airflow. Therefore, the noise meter is centered perpendicularly to the frame that defines the depth of the fan. Everything is always at the same angle and at the same distance. We use an inclinometer and markers to set the distances precisely and always the same.

We use a Reed R8080 noise meter to measure noise levels. This allows real-time averaging of samples, which is important for fine-tuning individual modes. We tune the fans until the specified noise level is reached to two decimal places, for example 31.50 dBA. The noise meter is the only instrument we calibrate inside our testlab. The other instruments have been calibrated by the relevant technical institutes. However, in the case of the noise meter, calibration is required before each test and we therefore have our own calibrator. This is already calibrated externally according to the standard.
To write that we have something mapped out to the last detail is perhaps too bold, but after proper preparation, few pieces of hardware are as easy to evaluate as fans. Of course, this had to be preceded by long preparations, developing a methodology, but you already know the story. What you don’t know yet is the first fruit, or rather the results of Akasa, SilentiumPC, SilverStone, Xigmatek or more exotic Reeven fans.
33 dBA or 33 dBA
The noise level, given as a single dBA value, is good for quick reference, but it doesn’t give you an idea of exactly what the sound sounds like. That’s because it averages a mix of noise levels of all frequencies of sound. One fan may disturb you more than the other, even though they both reach exactly the same dBA, yet each is characterized by different dominant (louder) frequencies. To analyze thoroughly with an idea of the “color” of the sound, it is essential to record and assess noise levels across the entire spectrum of frequencies that we perceive.

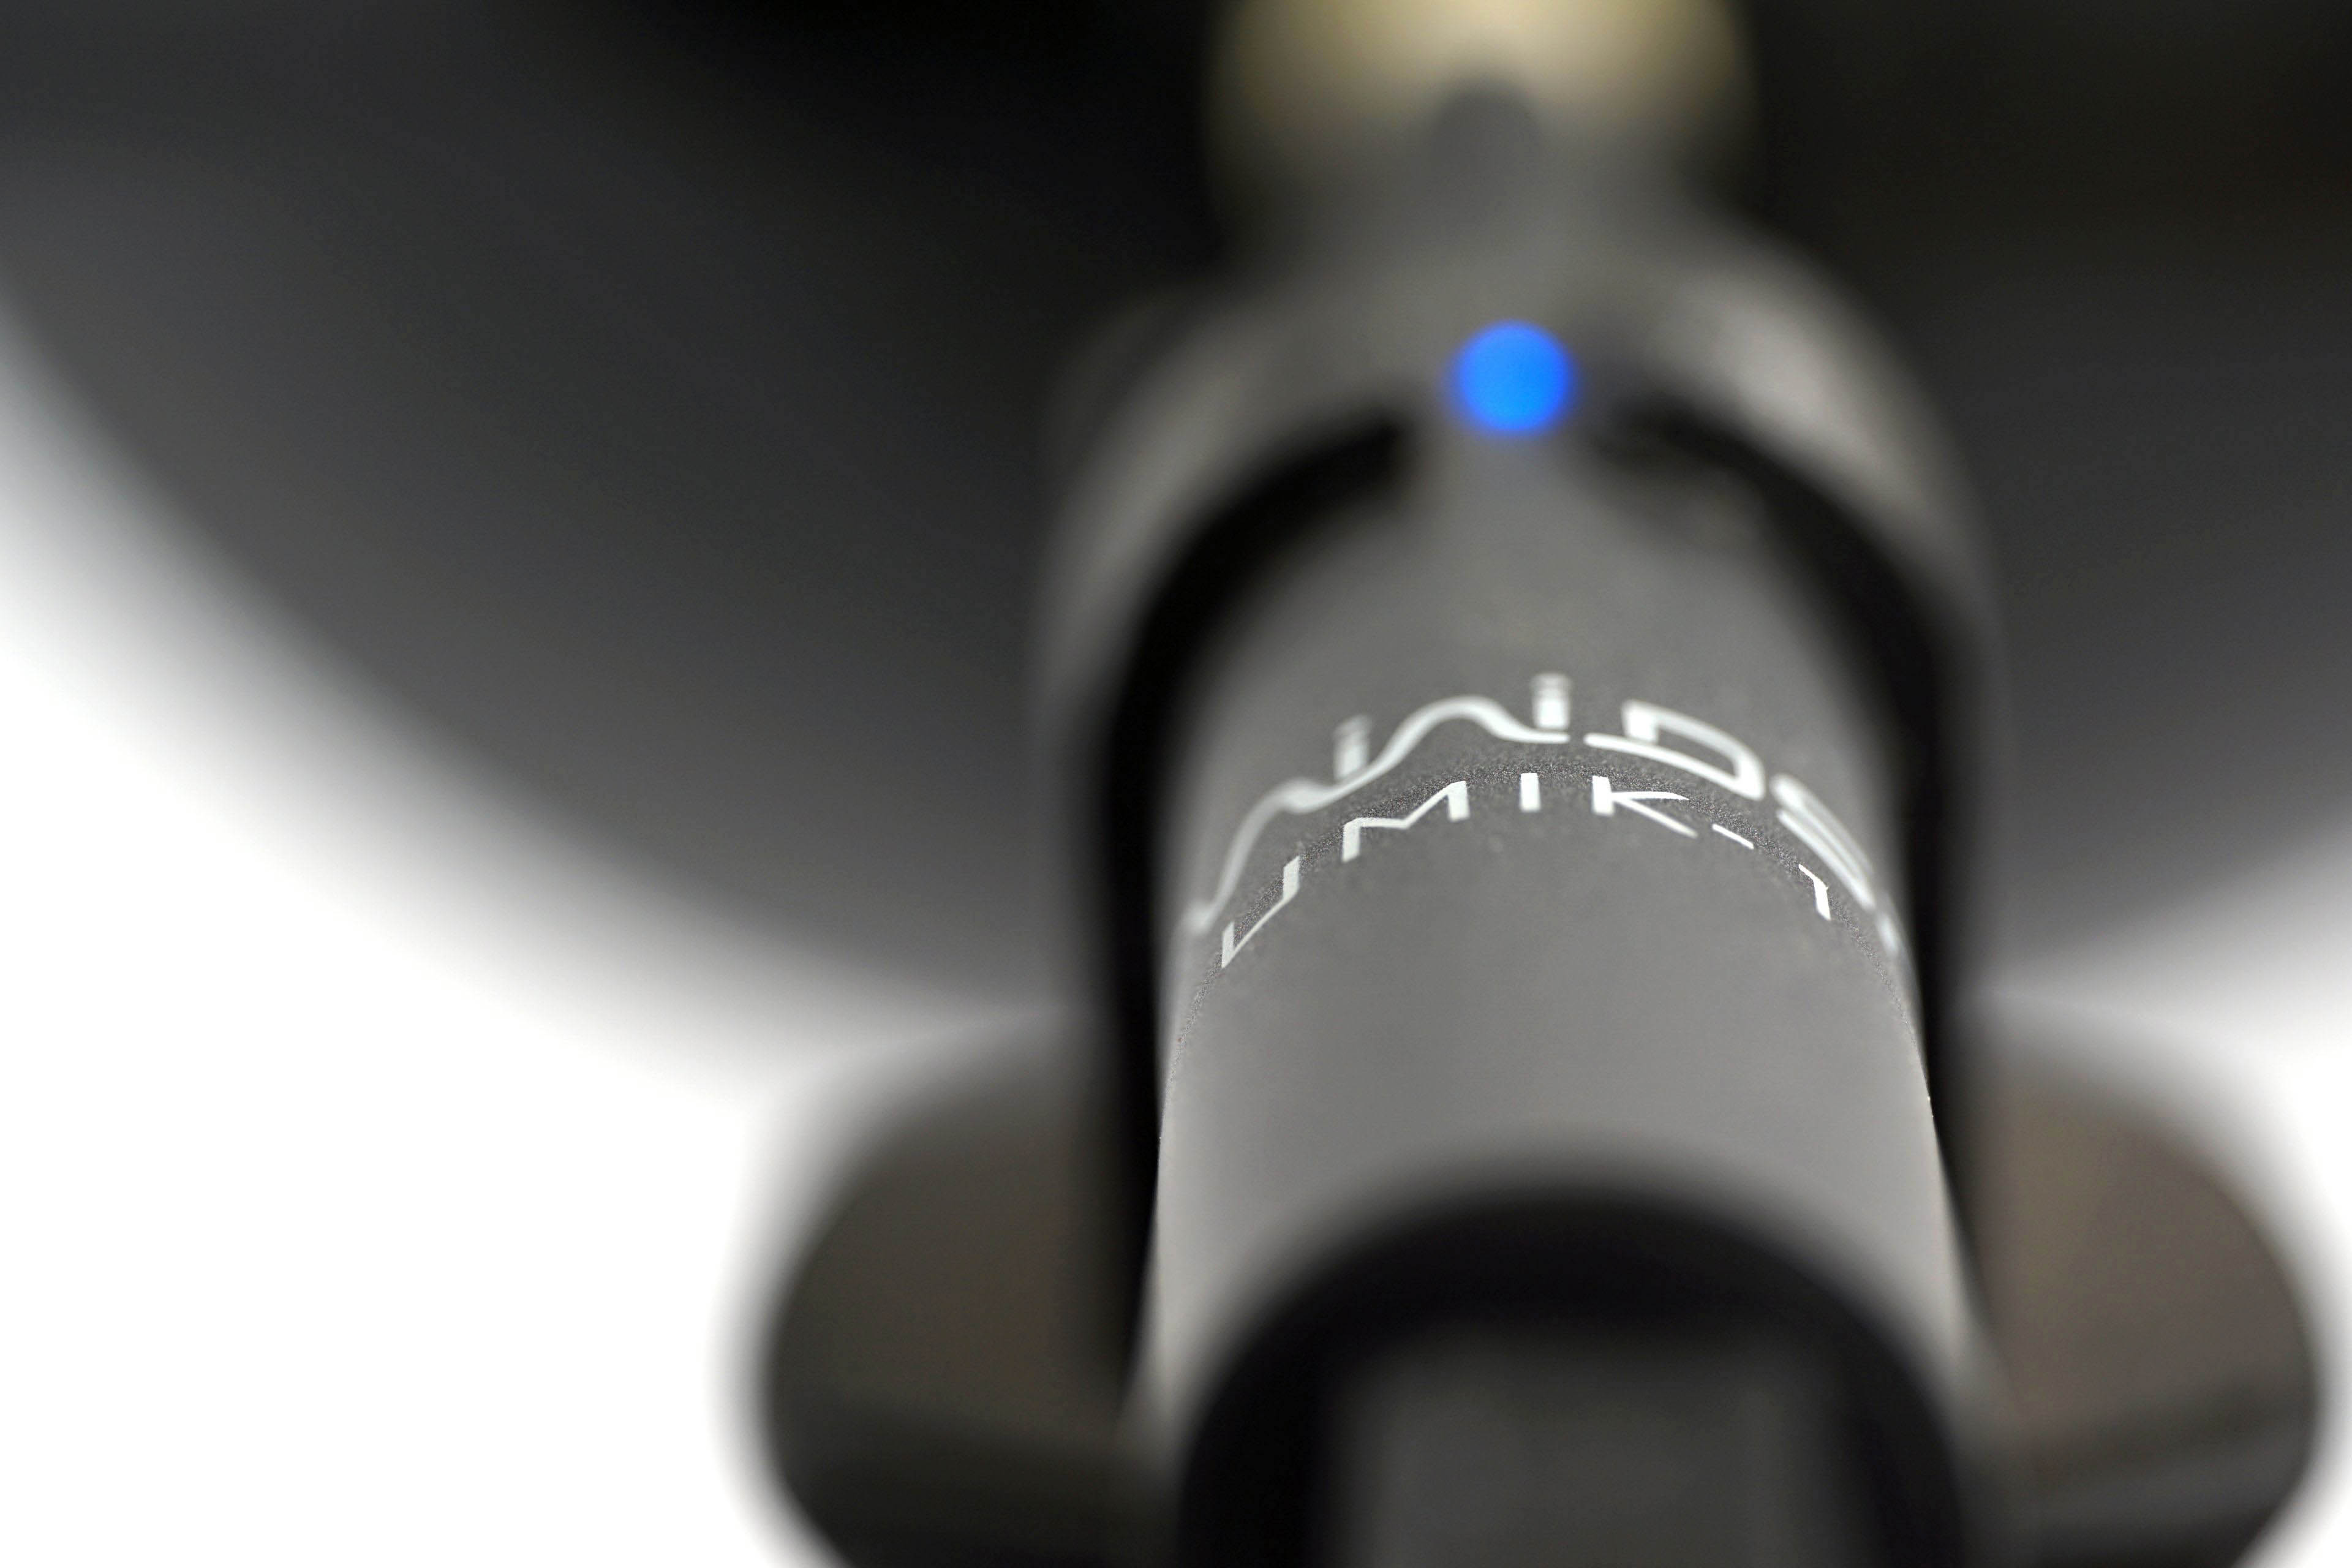
We already do this in graphics card tests, and we’ll do it for fans too, where it makes even more sense. Using the UMIK-1 miniDSP microphone and TrueRTA’s mode-specific, fixed dBA application, we also measure which frequencies contribute more and which contribute less to the sound. The monitored frequency range is 20-20,000 Hz, which we’ll work with at a fine resolution of 1/24 octave. In it, noise levels from 20 Hz to 20 000 Hz are captured at up to 240 frequencies.
The information captured in the spectrograph is a bit more than we will need for clear fan comparisons. While you’ll always find a complete spectrograph in the tests, we’ll only work with the dominant frequencies (and their noise intensities) in the low, mid, and high bands in the comparison tables and charts. The low frequency band is represented by 20–200 Hz, the medium by 201–2000 Hz and the high by 2001–20 000 Hz. From each of these three bands, we select the dominant frequency, i.e. the loudest one, which contributes most to the composition of the sound.
To the dominant frequency we also give the intensity of its noise. However, in this case it is in a different decibel scale than those you are used to from noise meter measurements. Instead of dBA, we have dBu. This is a finer scale, which is additionally expressed negatively. Be careful of this when studying the results – a noise intensity of -70 dBu is higher than -75 dBu. We discussed this in more detail in the article Get familiar with measuring the frequency response of sound.
Strict acoustic safeguards are required to ensure that these measurements can be carried out with satisfactory repeatability at all. We use acoustic panels to measure the same values at all frequencies across repeated measurements. These ensure that the sound is always reflected equally to the microphone regardless of the distribution of other objects we have in the testlab. The baseline noise level before each measurement is also naturally the same. The room in which we measure is soundproofed.
Like the noise meter, the microphone has a parabolic collar to increase resolution. The latter is specially in this case not only to amplify but also to filter out the noises that occur whether we want them or not behind the microphone. We are talking about the physical activity of the user (tester). Without this addition, human breathing, for example, would also be picked up by the spectrograph. However, this is successfully reflected off the microphone sensor by the back (convex) side of the collar. As a result, the spectrogram only contains information about the sound emitted by the fan itself.
To write that we have something mapped out to the last detail is perhaps too bold, but after proper preparation, few pieces of hardware are as easy to evaluate as fans. Of course, this had to be preceded by long preparations, developing a methodology, but you already know the story. What you don’t know yet is the first fruit, or rather the results of Akasa, SilentiumPC, SilverStone, Xigmatek or more exotic Reeven fans.
Static pressure measurement…
Finally, it is time to move further down the tunnel a bit. Just behind the fan is a static pressure sensing probe. Its position has been chosen with maximum measurement efficiency in mind. In other words, the sensors are placed at the points of highest pressure (although this is virtually the same everywhere in the unconstrained part of the tunnel).
The Fieldpiece ASP2, which is connected to the Fieldpiece SDMN5 manometer, is used to measure the static pressure in the tunnel. The latter also allows measurements in millimetres of water column, but we measure in millibars. This is a more finely resolved base unit for this meter. And only from there we convert the measured values into mm H2O to allow easy comparison with what the manufacturers state.
The difference in cross-section at the intake and exhaust (where the exhaust in this case is considered to be the anemometer) is related to the fact that the pressure increases in the narrowed part and with it the airflow. In order to avoid distortion at this level and to prevent the airflow from being stated as higher than it actually is, the Bernoulli equation must be applied to the measured values to compensate for the difference between the intake and exhaust cross-section (it also takes into account the motor housings). After this, it is again possible to confront our results with the paper parameters.
The greater the difference between the manufacturer’s claimed values and ours, the less the specifications correspond to reality. If the claimed values are significantly higher, it is certainly an intention to artificially give an advantage to the fans on the market. However, if the manufacturer quotes a lower pressure value than we do, it points to something else. Namely, a weaker tightness of the measuring environment. The less tight the tunnel is, the lower the pressure you naturally measure. This is one of the things we tuned for an extremely long time, but in the end we ironed out all the weak spots. Whether it’s the passage for the probe itself, the flanges around the anemometer, even the anemometer frame itself, which is made up of two parts, needed to be sealed in the middle. Finally, the flap at the tunnel outlet must also be perfectly tight. That’s because static pressure has to be measured in zero airflow.
But there is one thing that often lowers the pressure of the fans a bit. And that’s protruding anti-vibration pads in the corners or otherwise protruding corners. In other words, when the fan doesn’t fit perfectly to the mounting frame at the inlet, and there are small gaps around the perimeter, that also affects what you measure. But we have not gone into this because it is already a quality feature of the fan. In the same way, it will “stand out” and perform a bit weaker than it has the potential to do with better workmanship, even after application by the end user.
To write that we have something mapped out to the last detail is perhaps too bold, but after proper preparation, few pieces of hardware are as easy to evaluate as fans. Of course, this had to be preceded by long preparations, developing a methodology, but you already know the story. What you don’t know yet is the first fruit, or rather the results of Akasa, SilentiumPC, SilverStone, Xigmatek or more exotic Reeven fans.
… and airflow
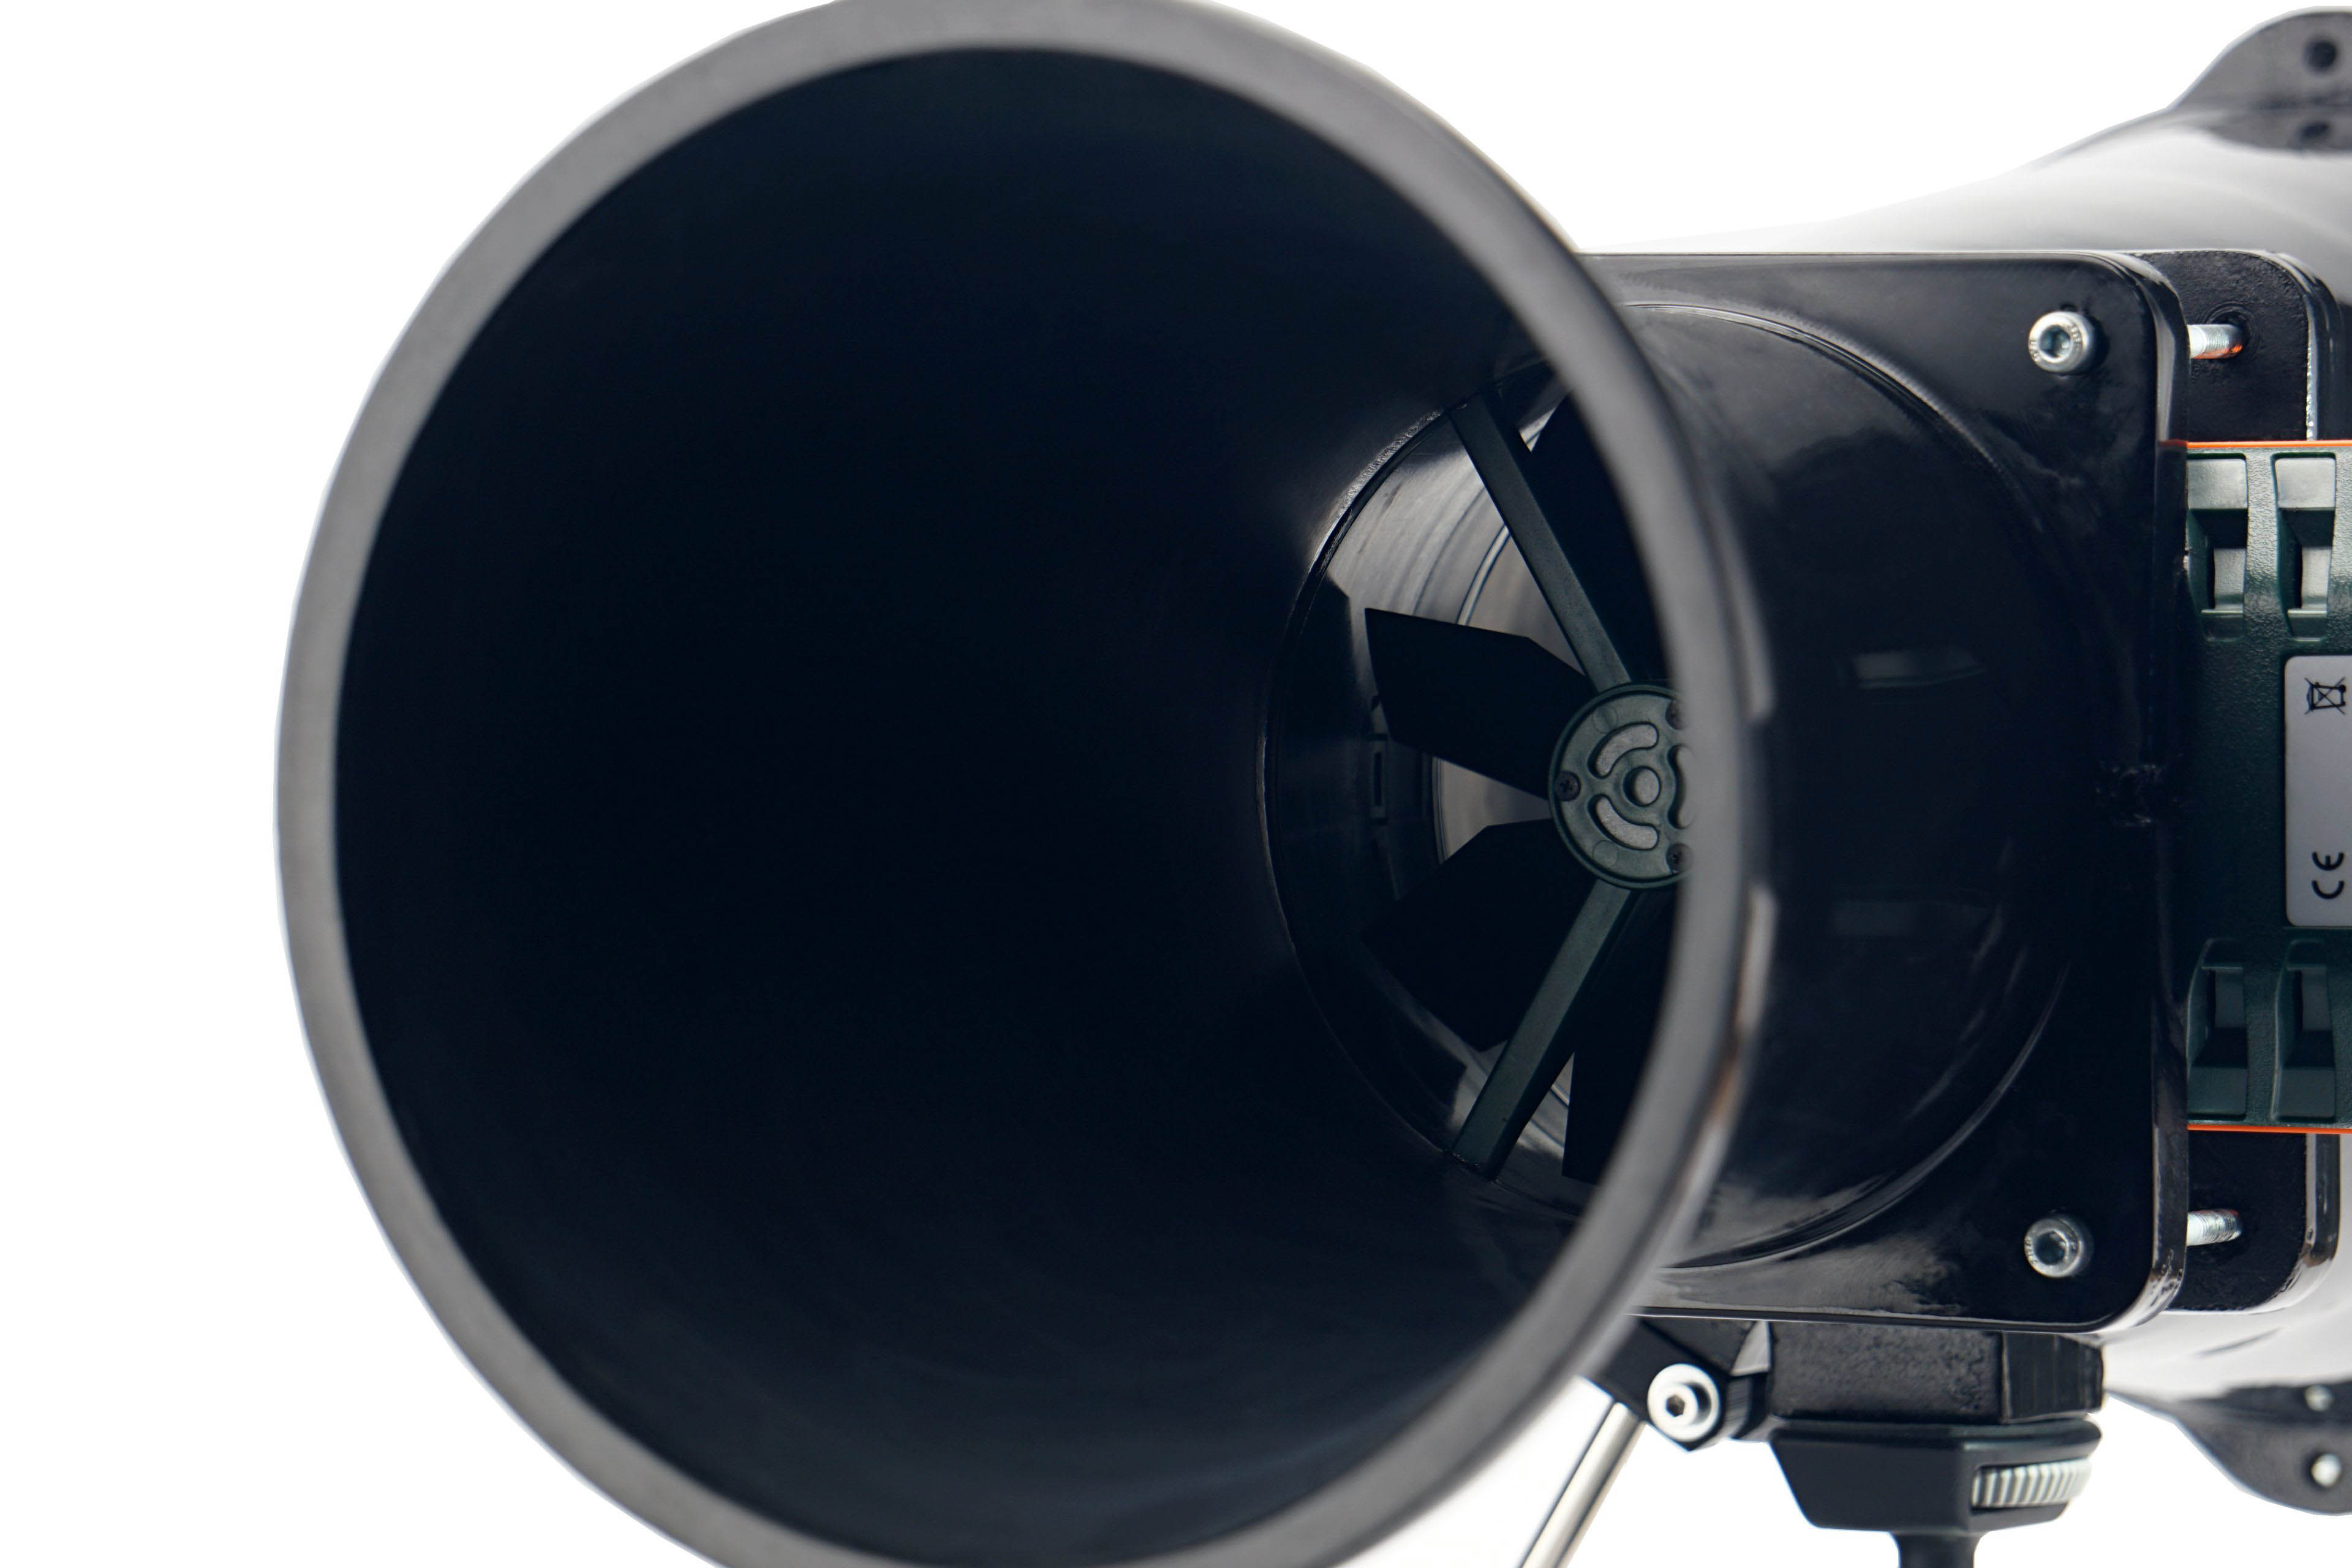
With airflow measurements, we can well explain why the test tunnel is shaped the way it is. It doesn’t consist of two parts just so that the “exhaust” can be conveniently clogged for pressure measurements. The anemometer (i.e. the wind speed measuring instrument) is held together by two parts, two formations, through the flanges.
The front part, at the beginning of which the fan is mounted, becomes steadily narrower and from about two thirds of the way through the cross-section is smaller than that of a 120 mm fan. The reason for this is that the cross-section of the anemometer is always smaller than that of the fans tested. The taper towards the anemometer fan is as smooth as could be chosen and the tunnel walls are smooth. This has minimized the occurrence of unnatural turbulence.
The difference between the cross section at the intake (fan under test) and at the constriction point (anemometer) also means a difference in dynamic pressure, the principles of the Venturi effect apply here. In order to avoid distortion at this level and to ensure that the fan airflow is not different from what it actually is, the Bernoulli equation must be applied to the measured values (for maximum accuracy, the calculation also takes into account the internal cross-sectional area of the anemometer, i.e. its inactive part ). After all this, it is again possible to confront our results with the paper parameters.
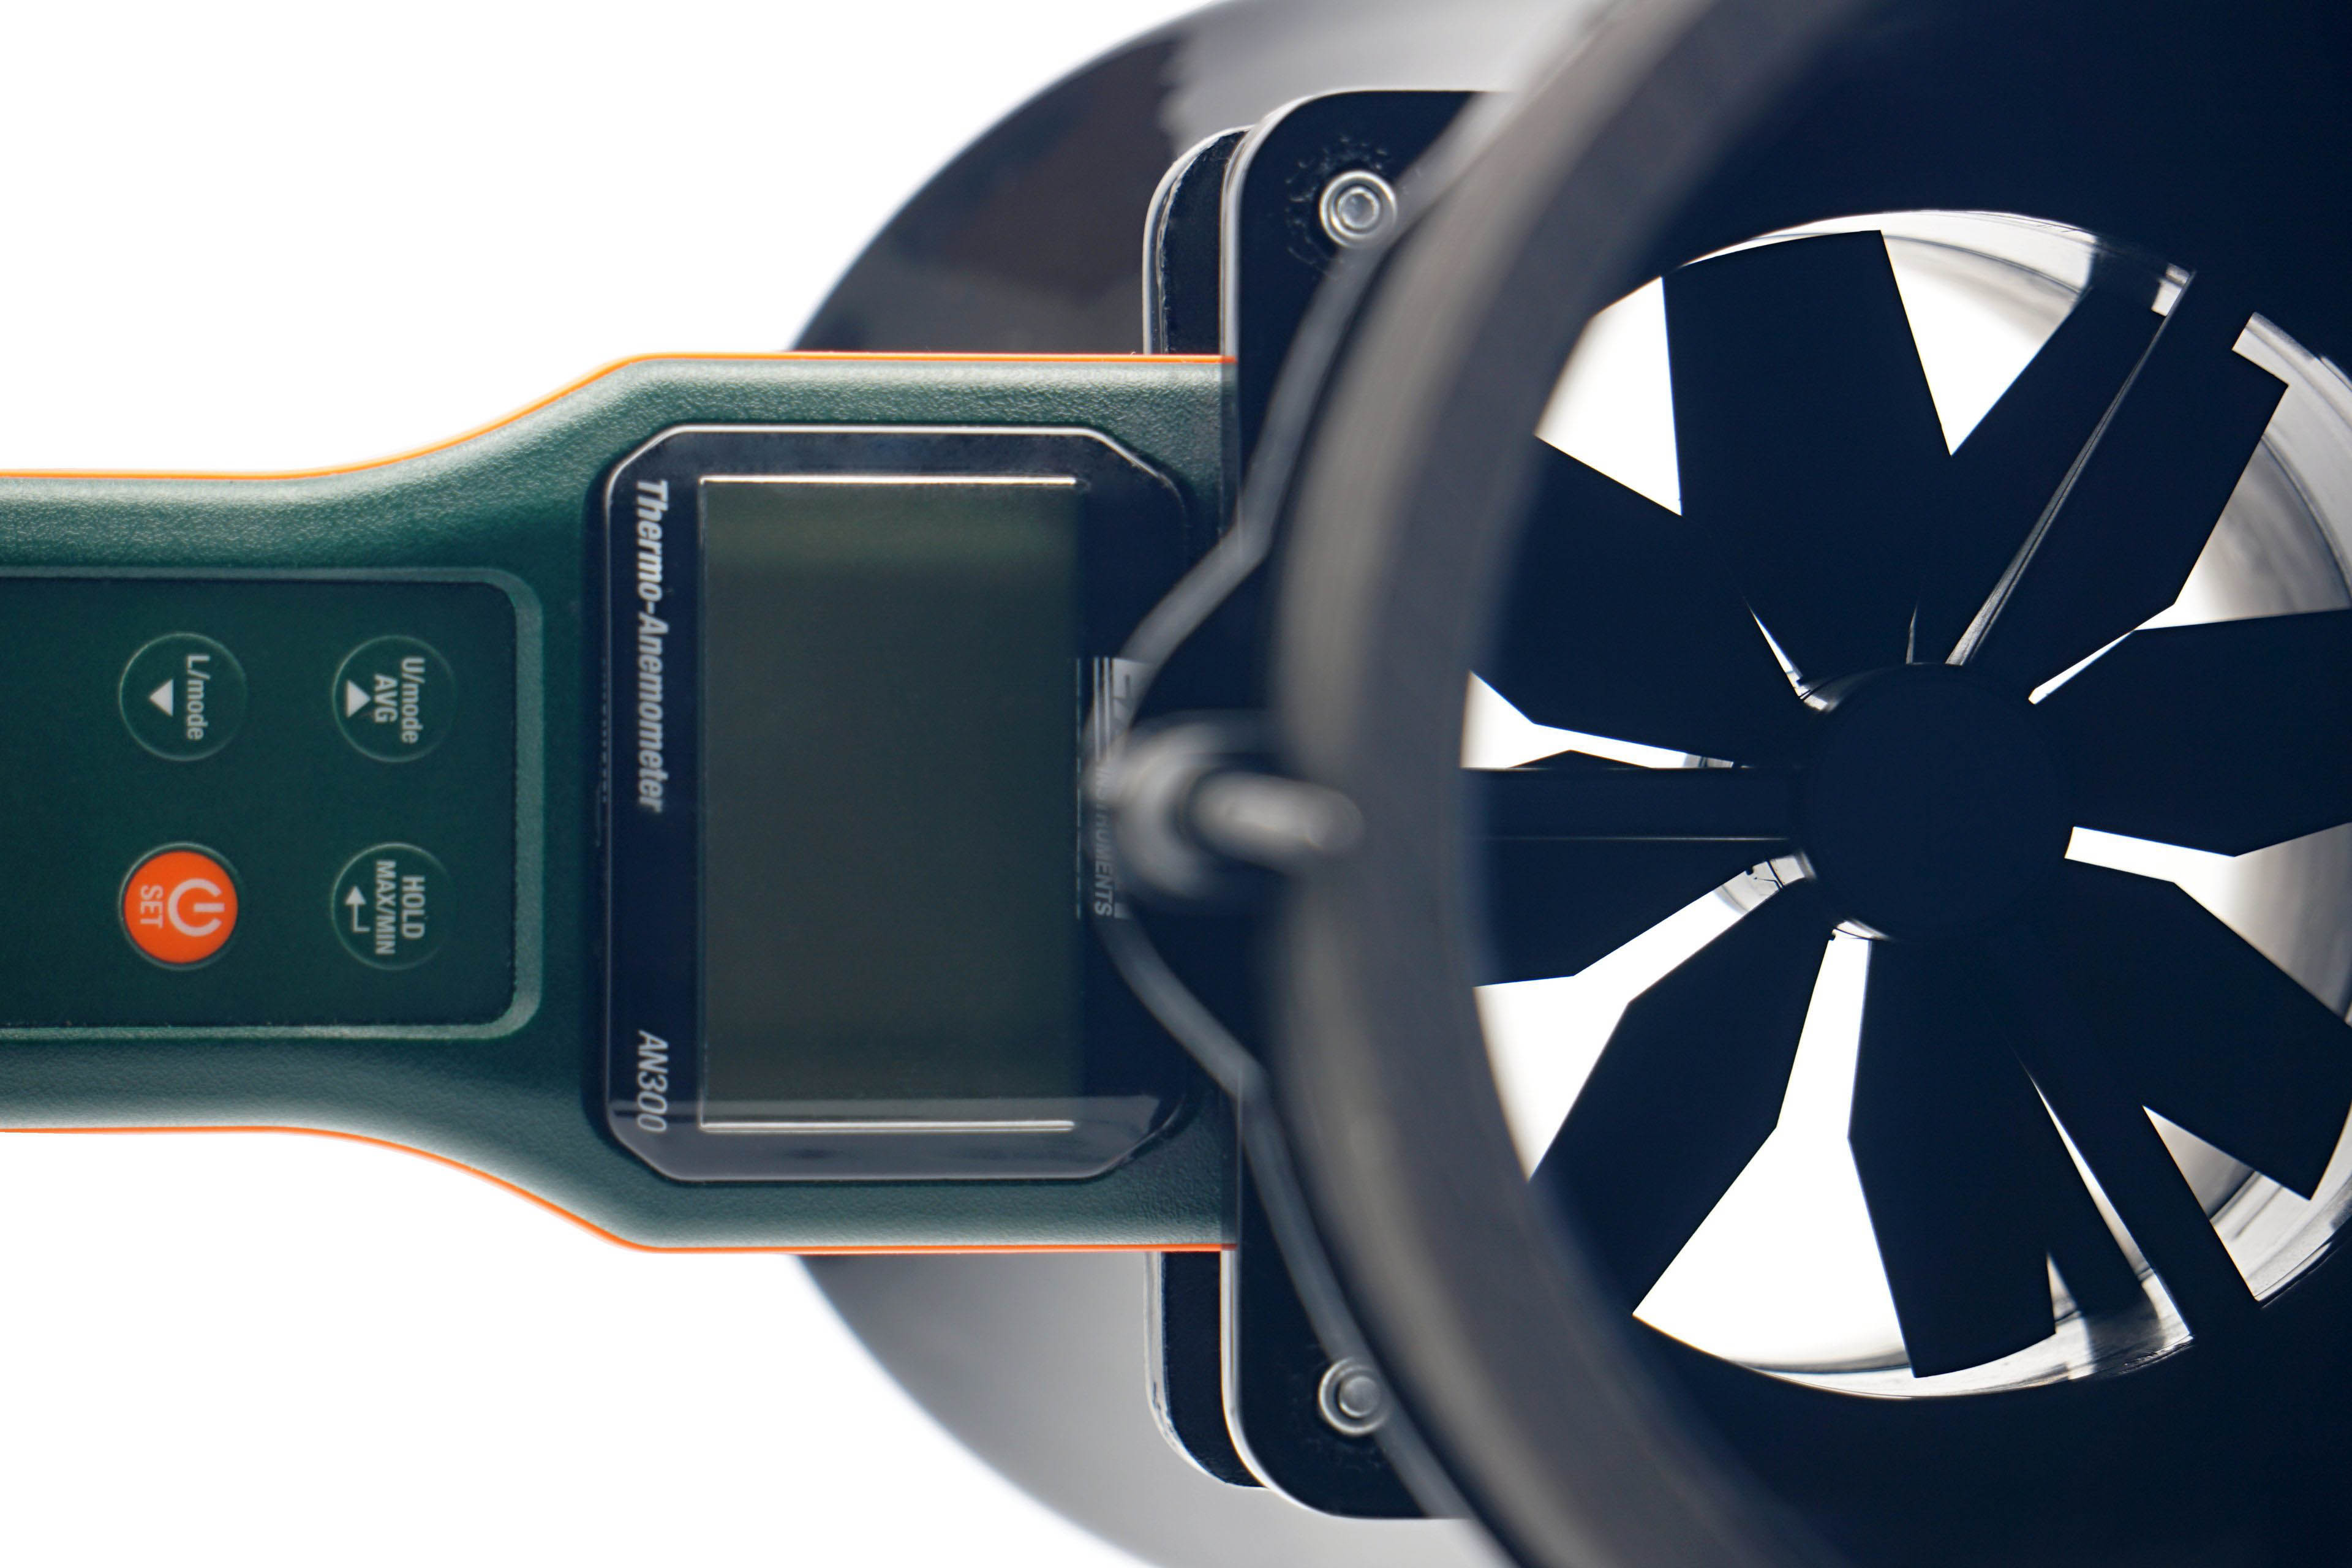
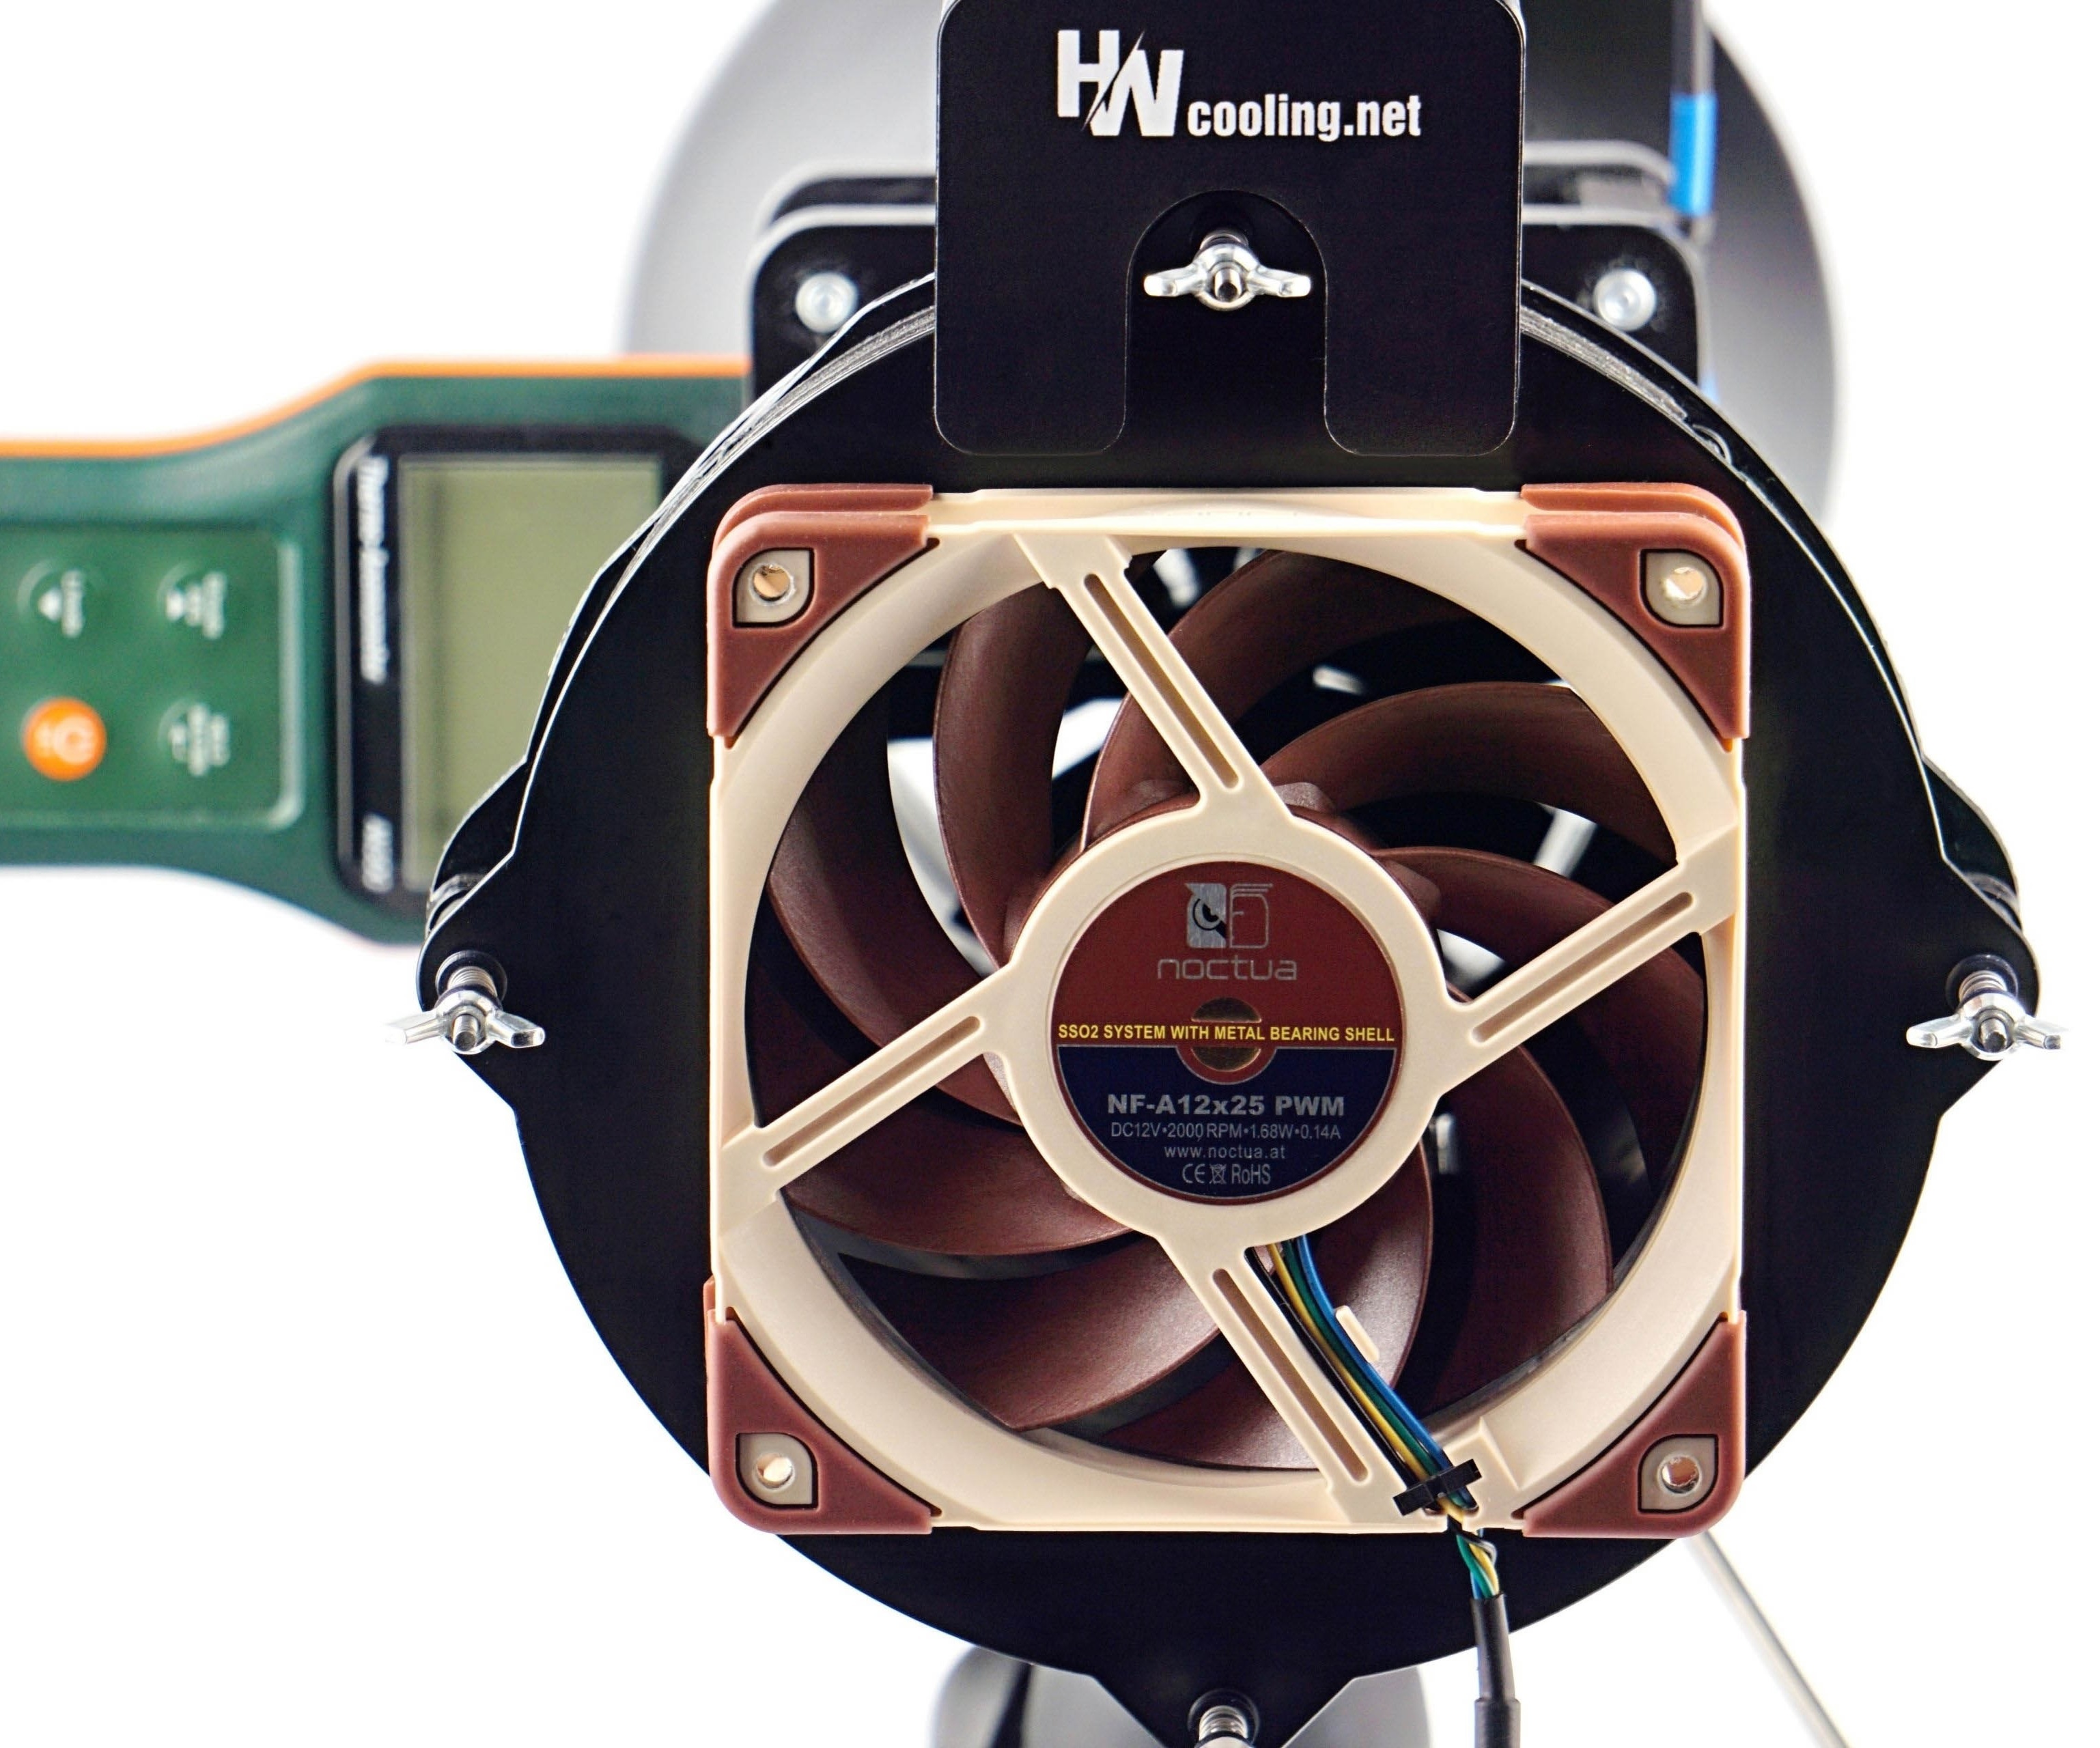
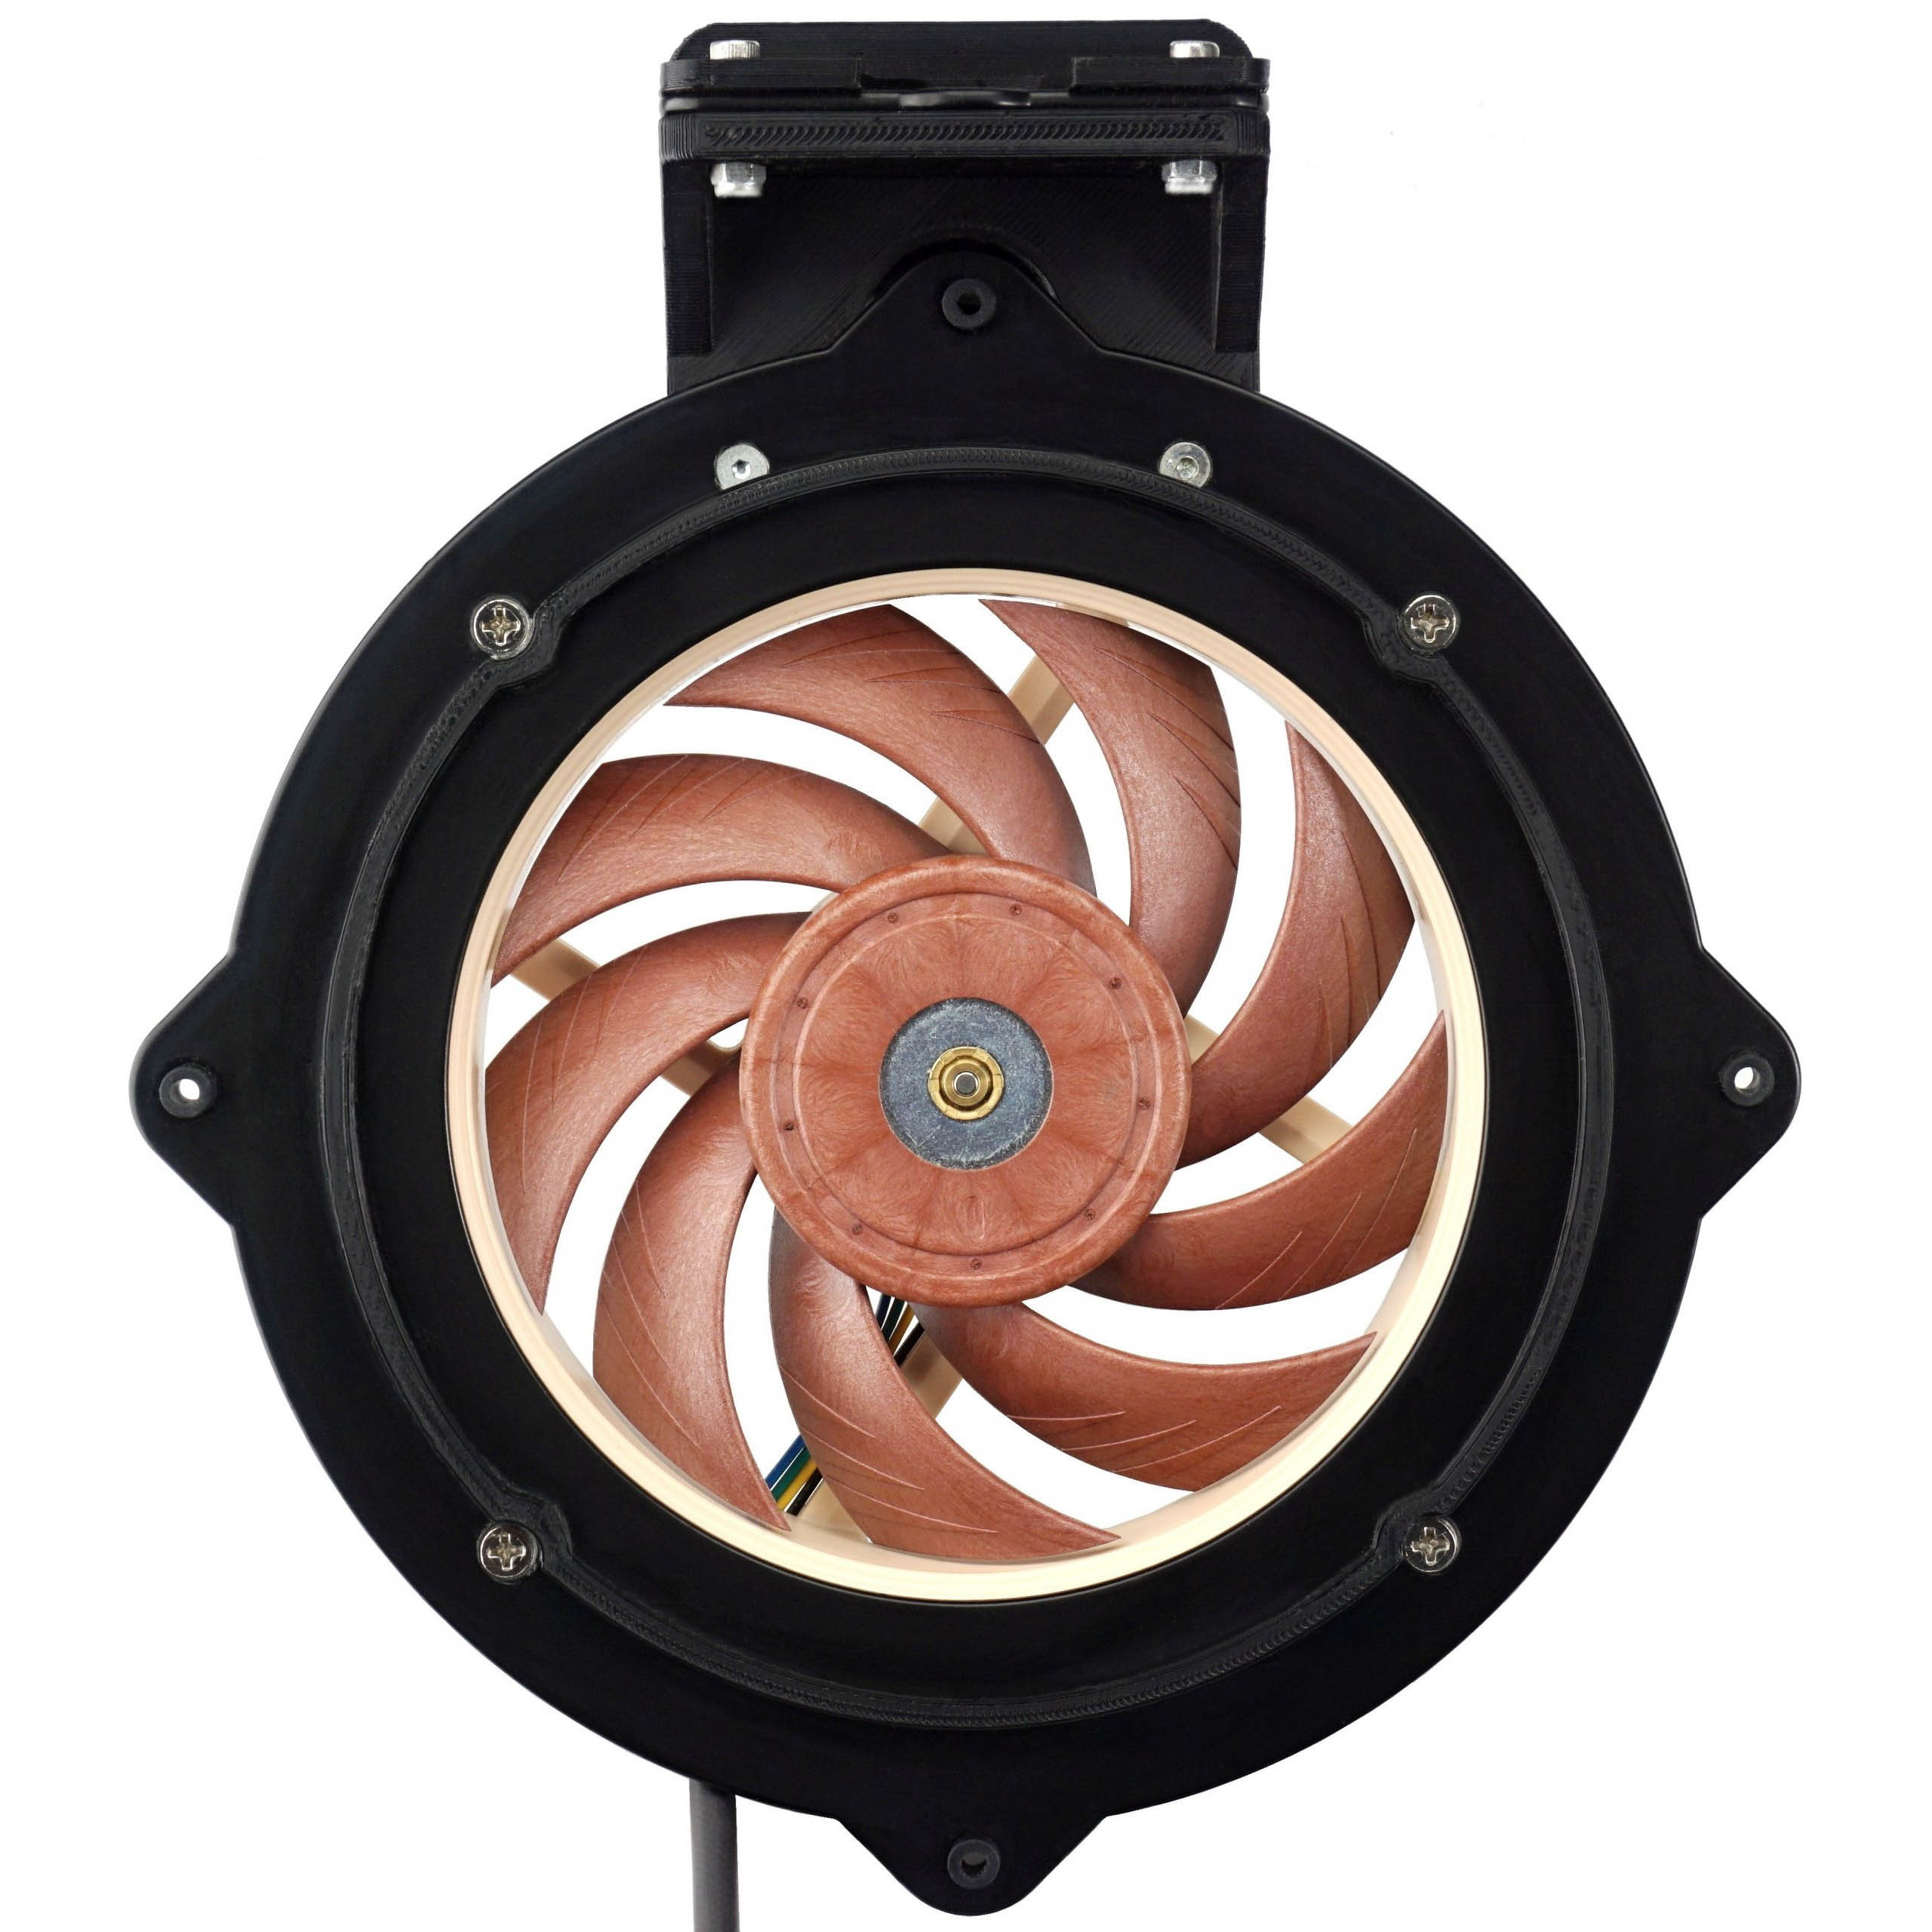
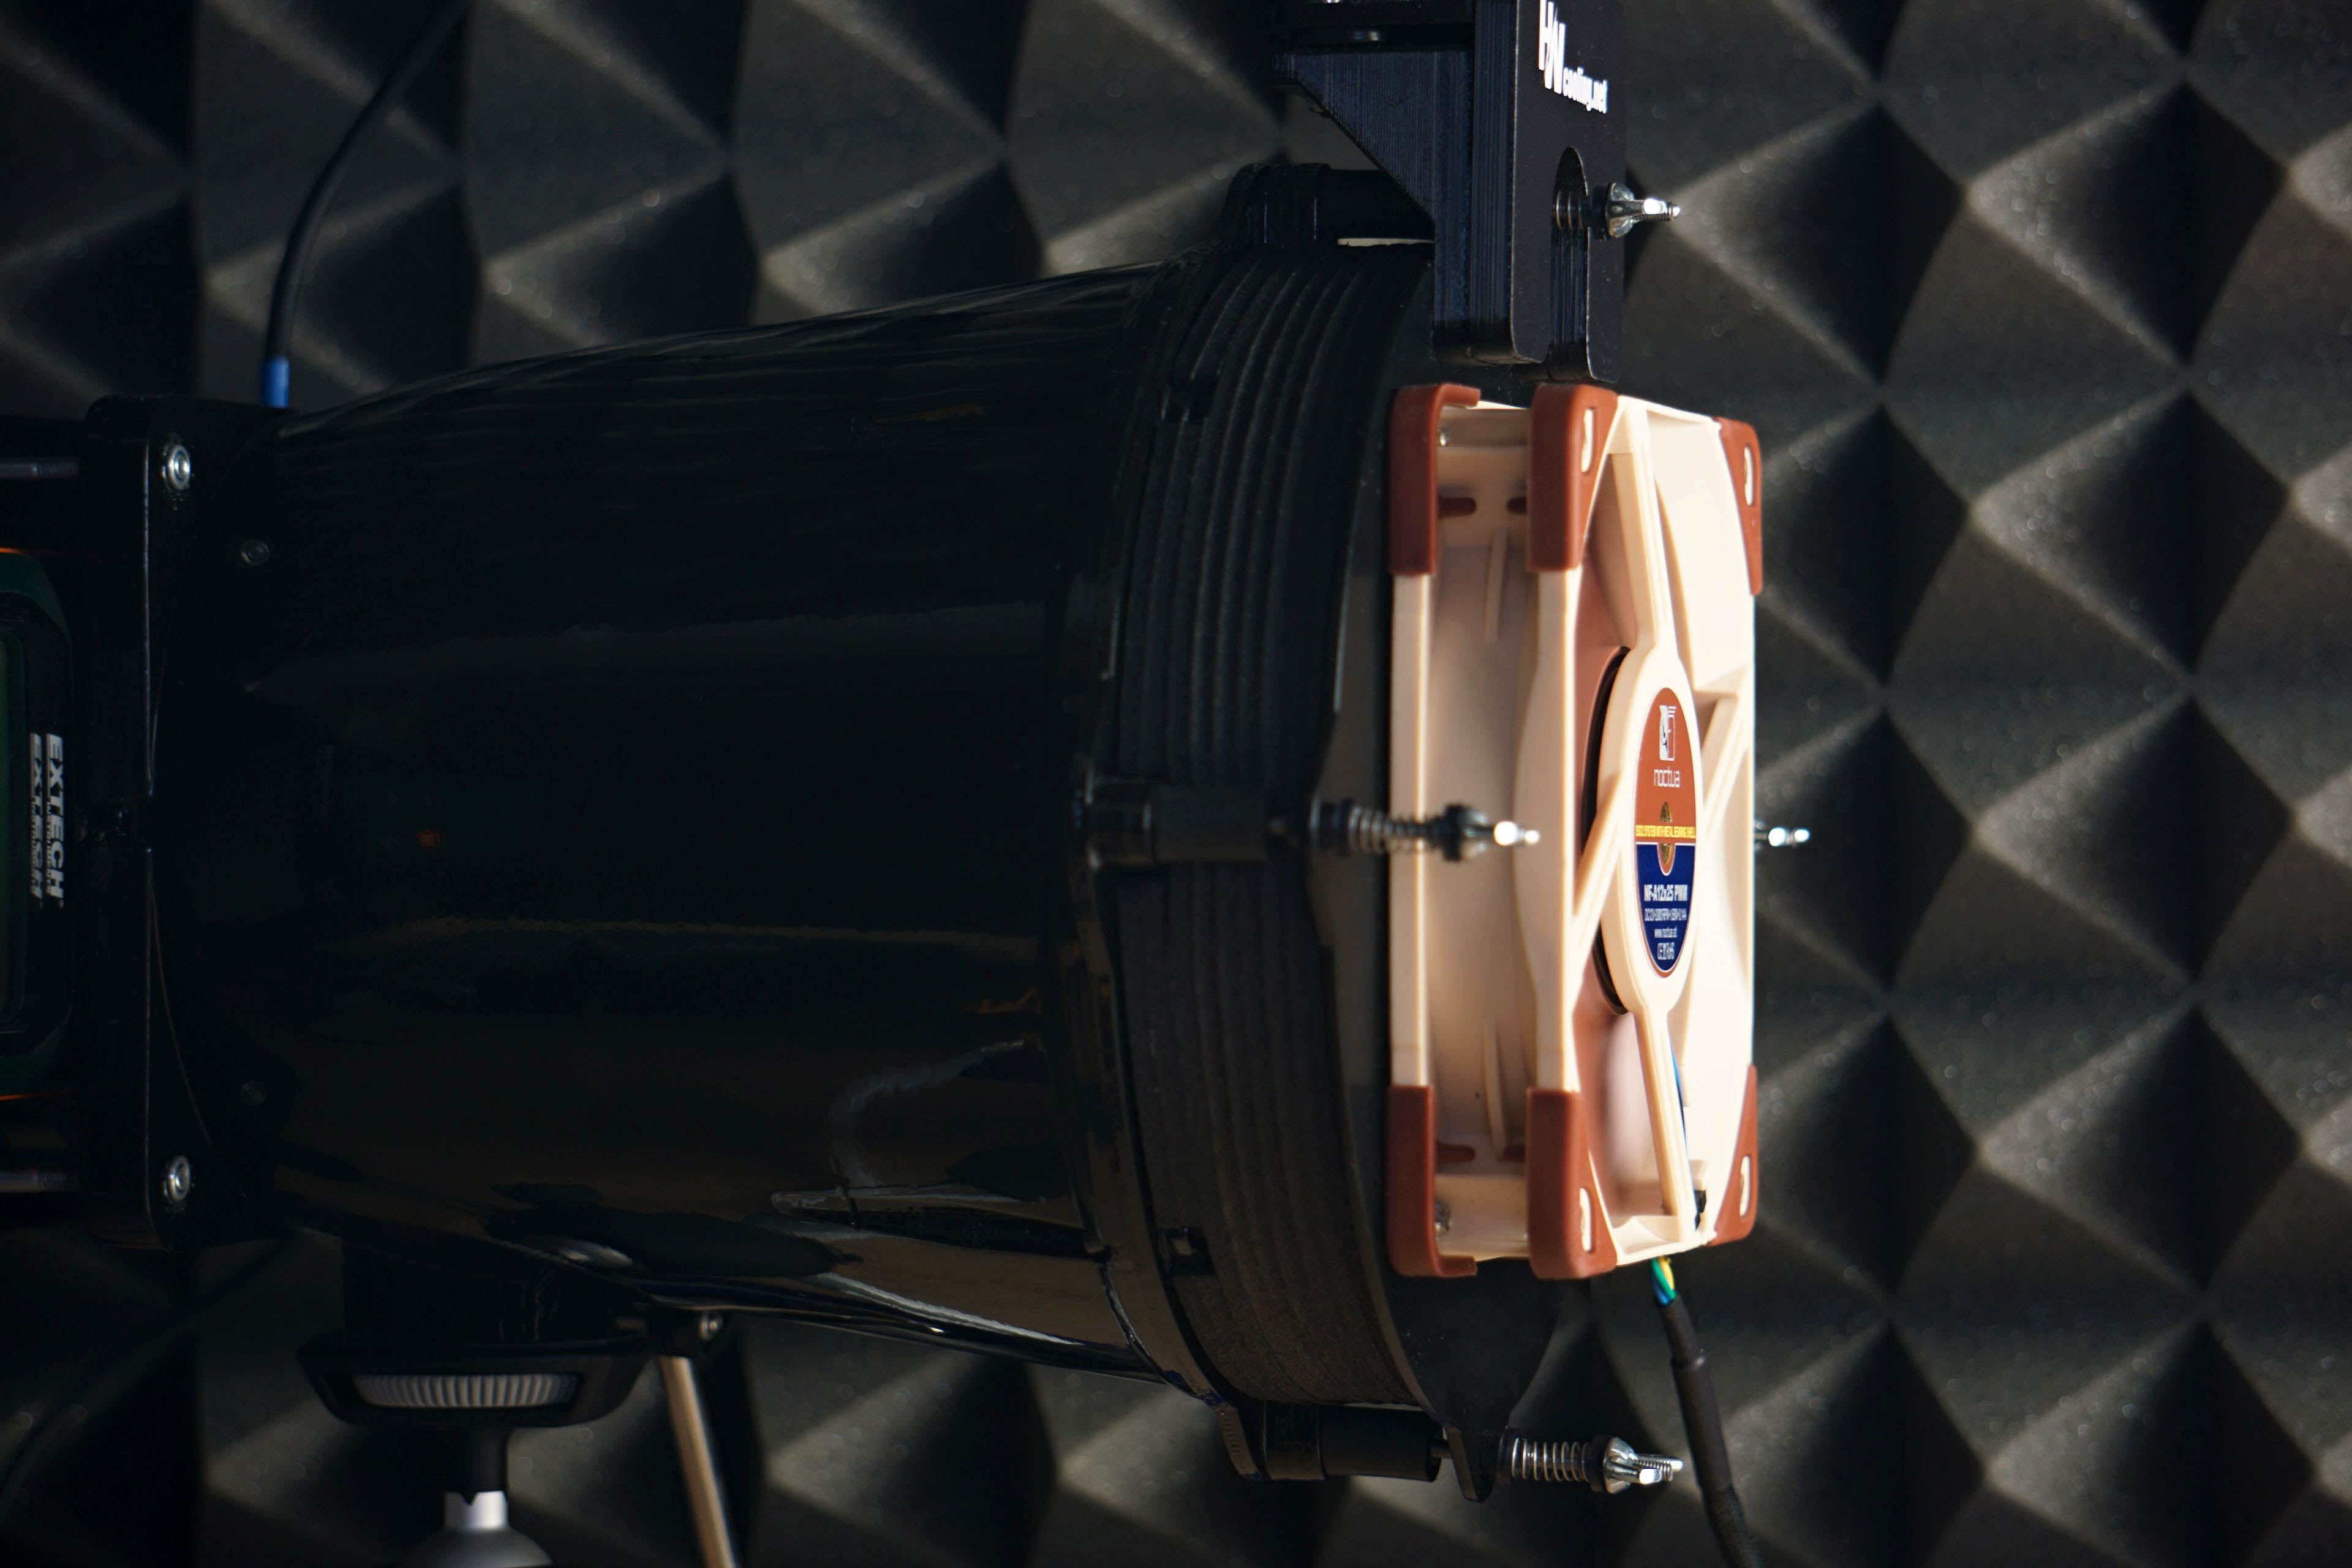
We use an Extech AN300 anemometer with a large 100 mm fan for the measurements. Its big advantage over other anemometers is that it is made for bidirectional sensing. This allows tests at different fan orientations. However, the “pull” position is more suitable or accurate for measurements, even though it may not seem so at first glance, but we’ll explain.
Here, we get to the second part of the tunnel, the part behind the anemometer. It is part of the whole device, mainly to allow a laminar flow of air to arrive at the rotor of the anemometer. Otherwise, uncontrolled side whirls would be reflected in the results, which are inconsistent with accurate measurements. Therefore, we will test the flow in the pull position. If anyone would like us to elaborate more on this topic, we can elaborate further at any time in the discussion below the article. Ask away. 🙂
In connection with the anemometer, we will return a little more to the noise measurements and to the setting of modes according to fixed noise levels. It may have occurred to you as you were reading that the anemometer fan is also a source of sound that needs to be filtered out when testing fans. For this reason, we insert a belay pad between the frame and the anemometer fan before each measurement and mode setting according to the fixed noise level.
To write that we have something mapped out to the last detail is perhaps too bold, but after proper preparation, few pieces of hardware are as easy to evaluate as fans. Of course, this had to be preceded by long preparations, developing a methodology, but you already know the story. What you don’t know yet is the first fruit, or rather the results of Akasa, SilentiumPC, SilverStone, Xigmatek or more exotic Reeven fans.
Everything changes with obstacles
So far, we have described how static pressure and airflow measurements are made under conditions where the fan has no obstacles in its path. In practice, however, fans do not usually blow into an empty space, but have a filter, grille or radiator in front of or behind them, the fins of which need to be pushed through as efficiently as possible.
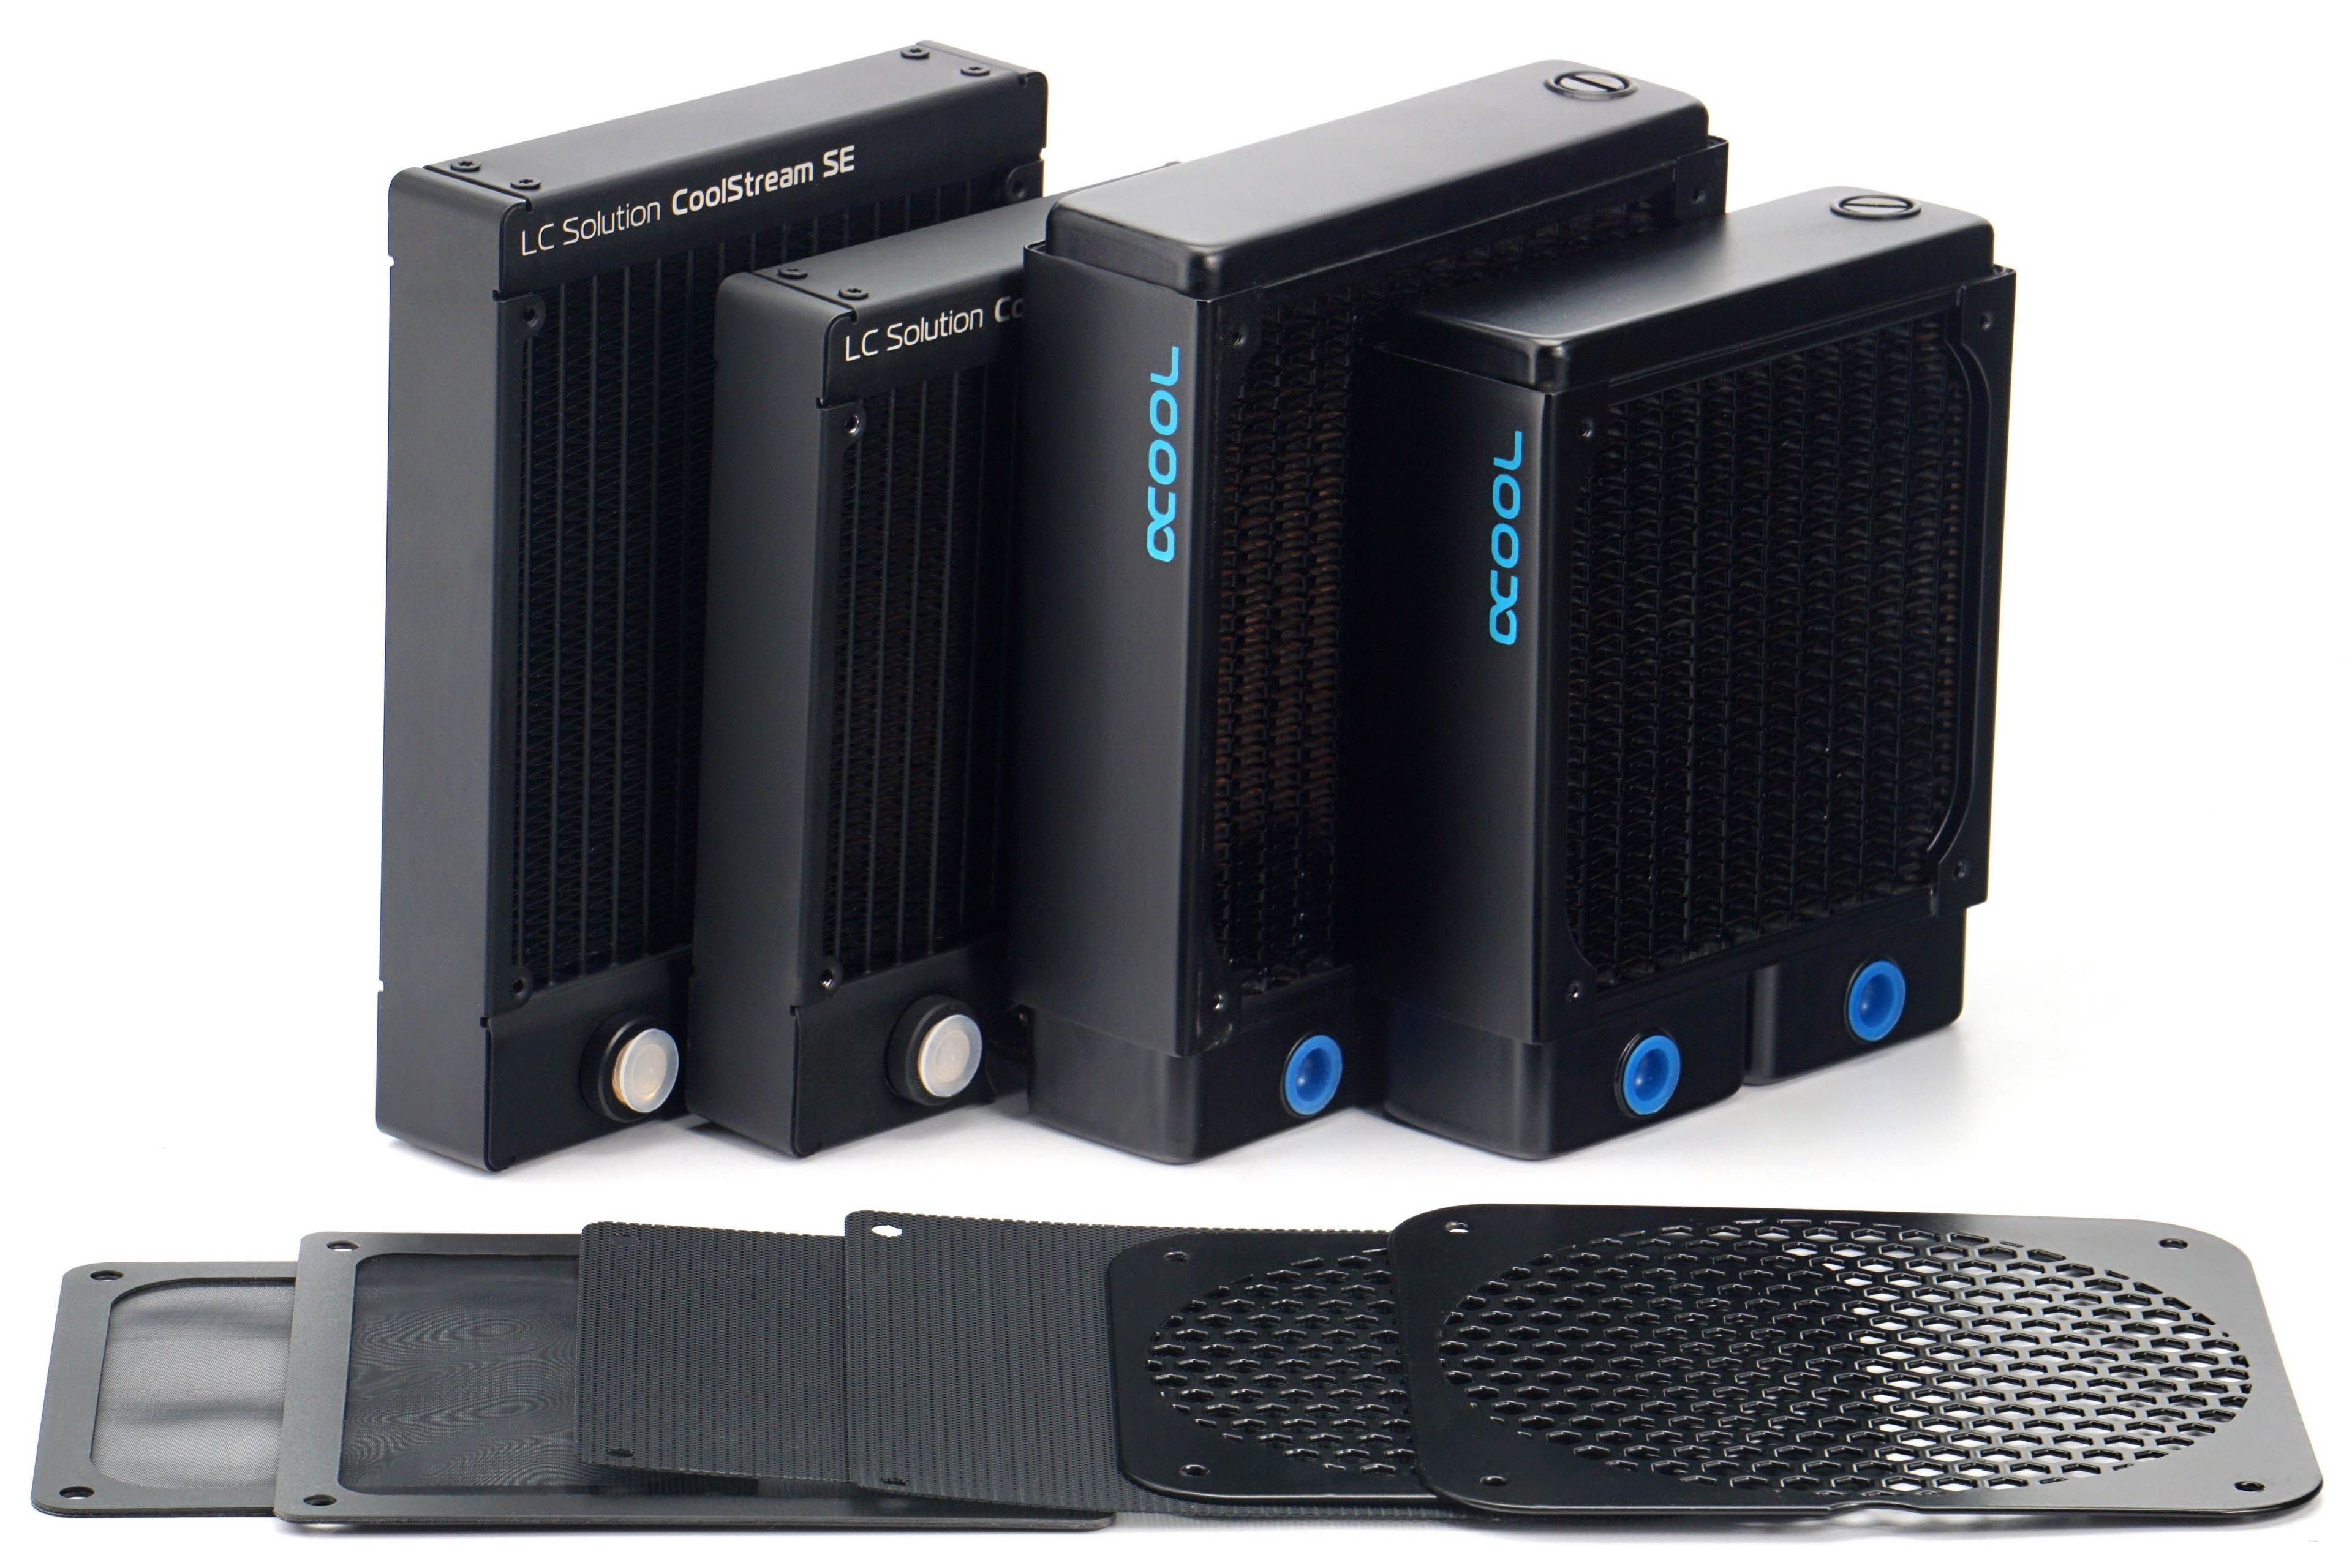
We will also measure both airflow and pressure through practical obstacles for the reasons stated above. These include two types of filters that are usually used in PC cases. One fine – nylon and the other plastic with a thinner mesh. One other obstacle is the hexagonal grille perforated at 50%, on which the vast majority of fans – intake and exhaust – are installed. In some cases, we measure the effect of the obstacles on the results at positions (behind or in front of the rotor) that are used in practice. All obstacles are both pushed through to detect pressure drops, but also pulled through, which in turn speaks to the impact on airflow.

We use two radiators that differ in thickness and fin density. The EK CoolStream SE120/140 is 28 mm thick and the FPI is 22, the Alphacool NexXxoS XT45 v2 is thicker (45 mm) but with less FPI. CoolStream’s fin disposition is also similar in parameters to AIOs. The results on the NexXxoS will again be attractive for those who build their own water cooling loops, where the fans should work well even at low speeds – hence the lower fin density.
These obstacles and especially the radiators, but also the grilles, increase the mechanical resistance in front of the fan, resulting in higher noise levels. However, we will still tune the fan speeds to the specified noise levels of 31.5 to 45 dBA. Naturally, the speeds will always be lower than when testing without obstructions, but we will maintain the noise levels for clarity. The different noise levels with and without obstacles will only be at maximum power. In this mode it will also be nice to see how the fan design works with the obstacle and in which case the noise level increases more and in which less.
To write that we have something mapped out to the last detail is perhaps too bold, but after proper preparation, few pieces of hardware are as easy to evaluate as fans. Of course, this had to be preceded by long preparations, developing a methodology, but you already know the story. What you don’t know yet is the first fruit, or rather the results of Akasa, SilentiumPC, SilverStone, Xigmatek or more exotic Reeven fans.
How we measure power draw…
Is it worth addressing the power draw of fans? If you have seven of them in your computer (three on the radiator of the cooler and four for system cooling in the case) and they are also backlit, the power draw starts at tens of watts. This makes it worth dealing with.
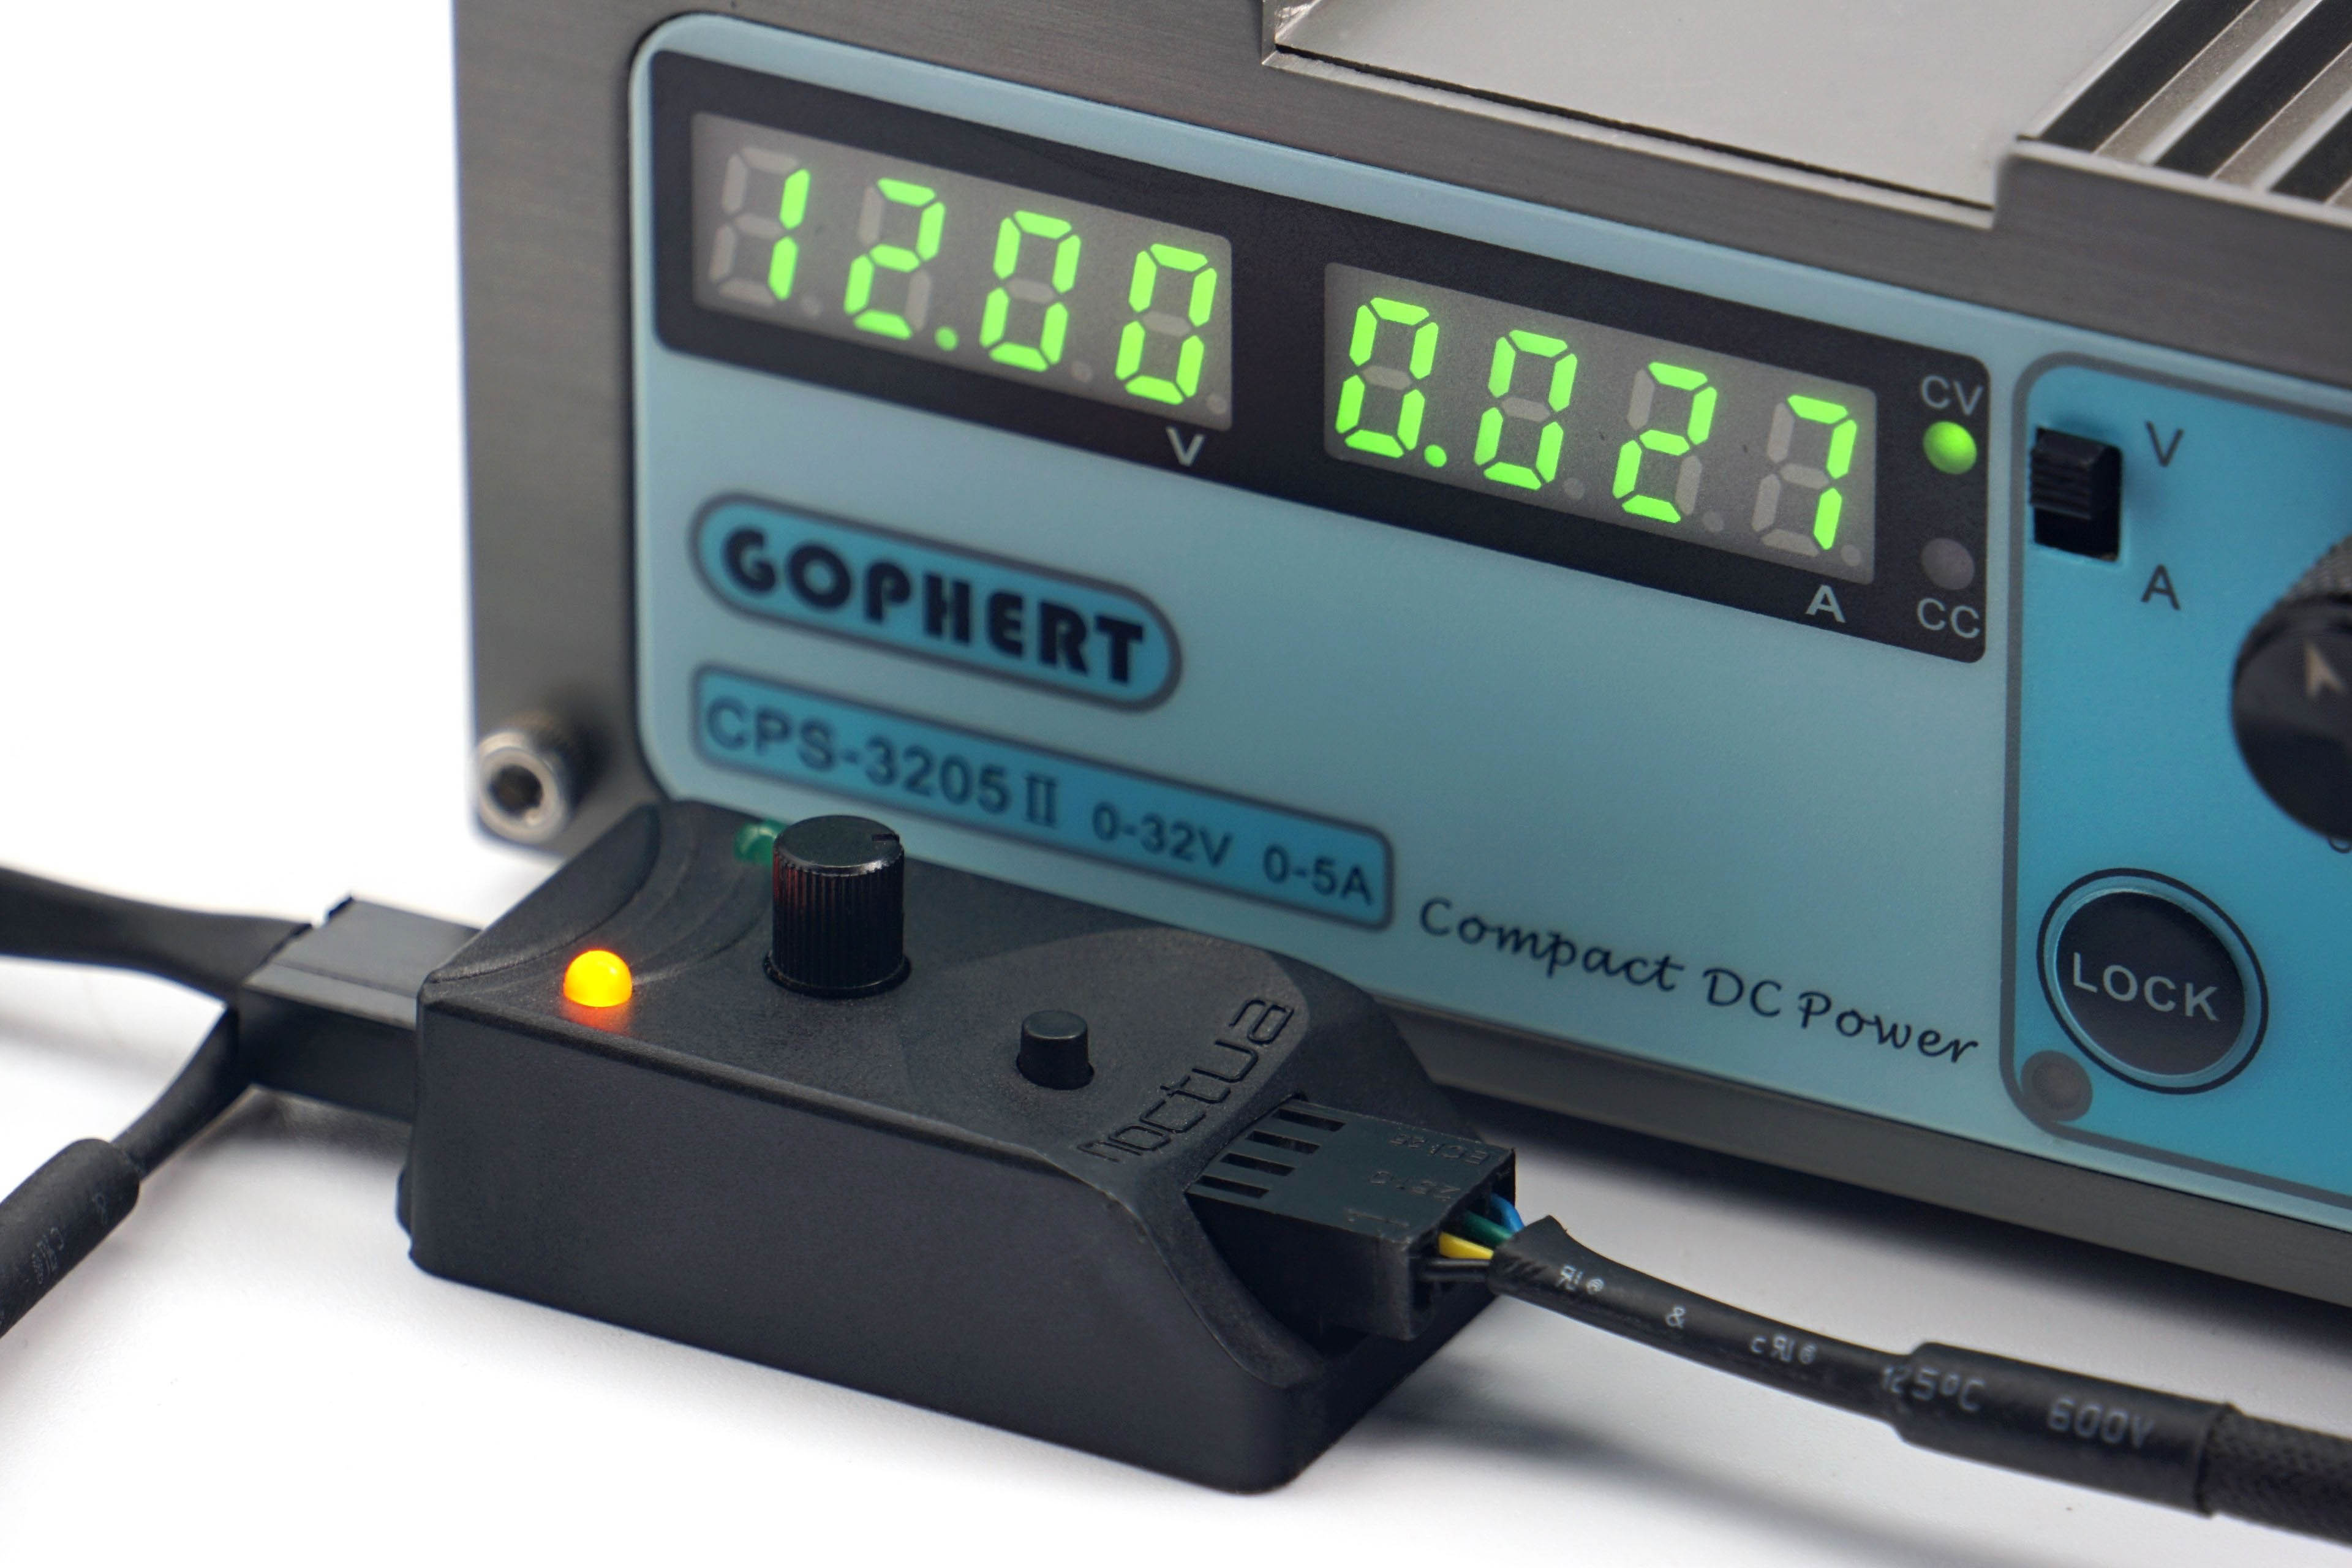
All fans are powered by Gophert CPS-3205 II laboratory power supply. It is passive and virtually noiseless, so it does not distort our noise level measurements. However, for the PWM fans, a Noctua NA-FC1 controller is connected through which the fans are regulated. We also have a shunt between the power supply and the Noctua controller. On it, we read the voltage drop, from which we then calculate the current. However, the voltage on the power supply is set so that 12 V goes to the Noctua NA-FC1. We then also set the exact 12 V to measure the maximum power of the 3-pin linear power supply fans.
In the power draw tests, we will be interested in the power draw in fixed noise level modes in addition to the maximum power consumption at 12 V or 100% PWM. That is, at those settings at which we also measure other parameters. Finally, in the graphs you will also find the power consumption corresponding to the start-up and minimum speeds. The difference between these two settings is that at start-up speed you need to overcome the frictional forces, so the power draw is always higher than at minimum speed. At these, the fan is already running and just reduces power to just before a level where it stops.

These start-up and minimum power draw data are a substitute for the start-up and minimum voltage information. You often encounter this when reading about fans, but with PWM fans there is no point in dealing with it. And although it is possible to power a PWM fan linearly, it will always perform better with PWM control – lower starting and minimum speeds. Therefore, it would be unfair to compare these parameters for all fans using linear control. That way, fans with PWM would be disadvantaged and the results distorted.
…and motor power
In addition to power draw, it is important to consider one more parameter that is related to the power supply – the power of the motor. This is usually listed on the back on a label and is often mistaken for power draw. However, the voltage and current indication here is usually not about power draw, but about the power of the motor. The latter must always be well above the operating power draw. The more, the longer the life expectancy of the fan.
Over time and with wear, fan friction increases (through loss, hardening of the lubricant, dust contamination or abrasion of the bearings, etc.). However, a more powerful motor will overcome the deteriorating condition of the fan to some extent, albeit at a higher power draw, but somehow it will cope. However, if the difference between the motor power and the operating power draw of the new fan is small, it may no longer be able to exert sufficient force to turn the rotor under increased friction due to adverse circumstances.

To test the power of the motor, we set the fan to full power (12 V/100 % PWM) and increase the mechanical resistance by braking the rotor in the middle. This is a higher load for the motor, with which the power draw naturally increases. But this is only up to a point, until the rotor stops. The power of the motor in our tests corresponds to the highest achieved power draw that we observed when the fan was being braked.
We use the Keysight U1231A high sample rate precision multimeters to analyse motor performance (as well as normal operating power draw). In addition, the individual samples are recorded in a spreadsheet, from which we then graph the maximum. The final value is the average of three measurements (three maximums).
To write that we have something mapped out to the last detail is perhaps too bold, but after proper preparation, few pieces of hardware are as easy to evaluate as fans. Of course, this had to be preceded by long preparations, developing a methodology, but you already know the story. What you don’t know yet is the first fruit, or rather the results of Akasa, SilentiumPC, SilverStone, Xigmatek or more exotic Reeven fans.
Measuring the intensity (and power draw) of lighting
Modern fans often include lighting. This is no longer a “cooling” parameter, but for some users the presence of (A)RGB LEDs is important. Therefore, we also measure how intense this lighting is in our tests. These tests are the only ones that take place externally, outside the wind tunnel.
We record the luminosity of the fans in a chamber with reflective walls. This internal arrangement is important to increase the resolution for us to measure anything at all with lower luminosity fans. But also so that the readings do not blend together and it is obvious which fan is emitting more light and which one less.
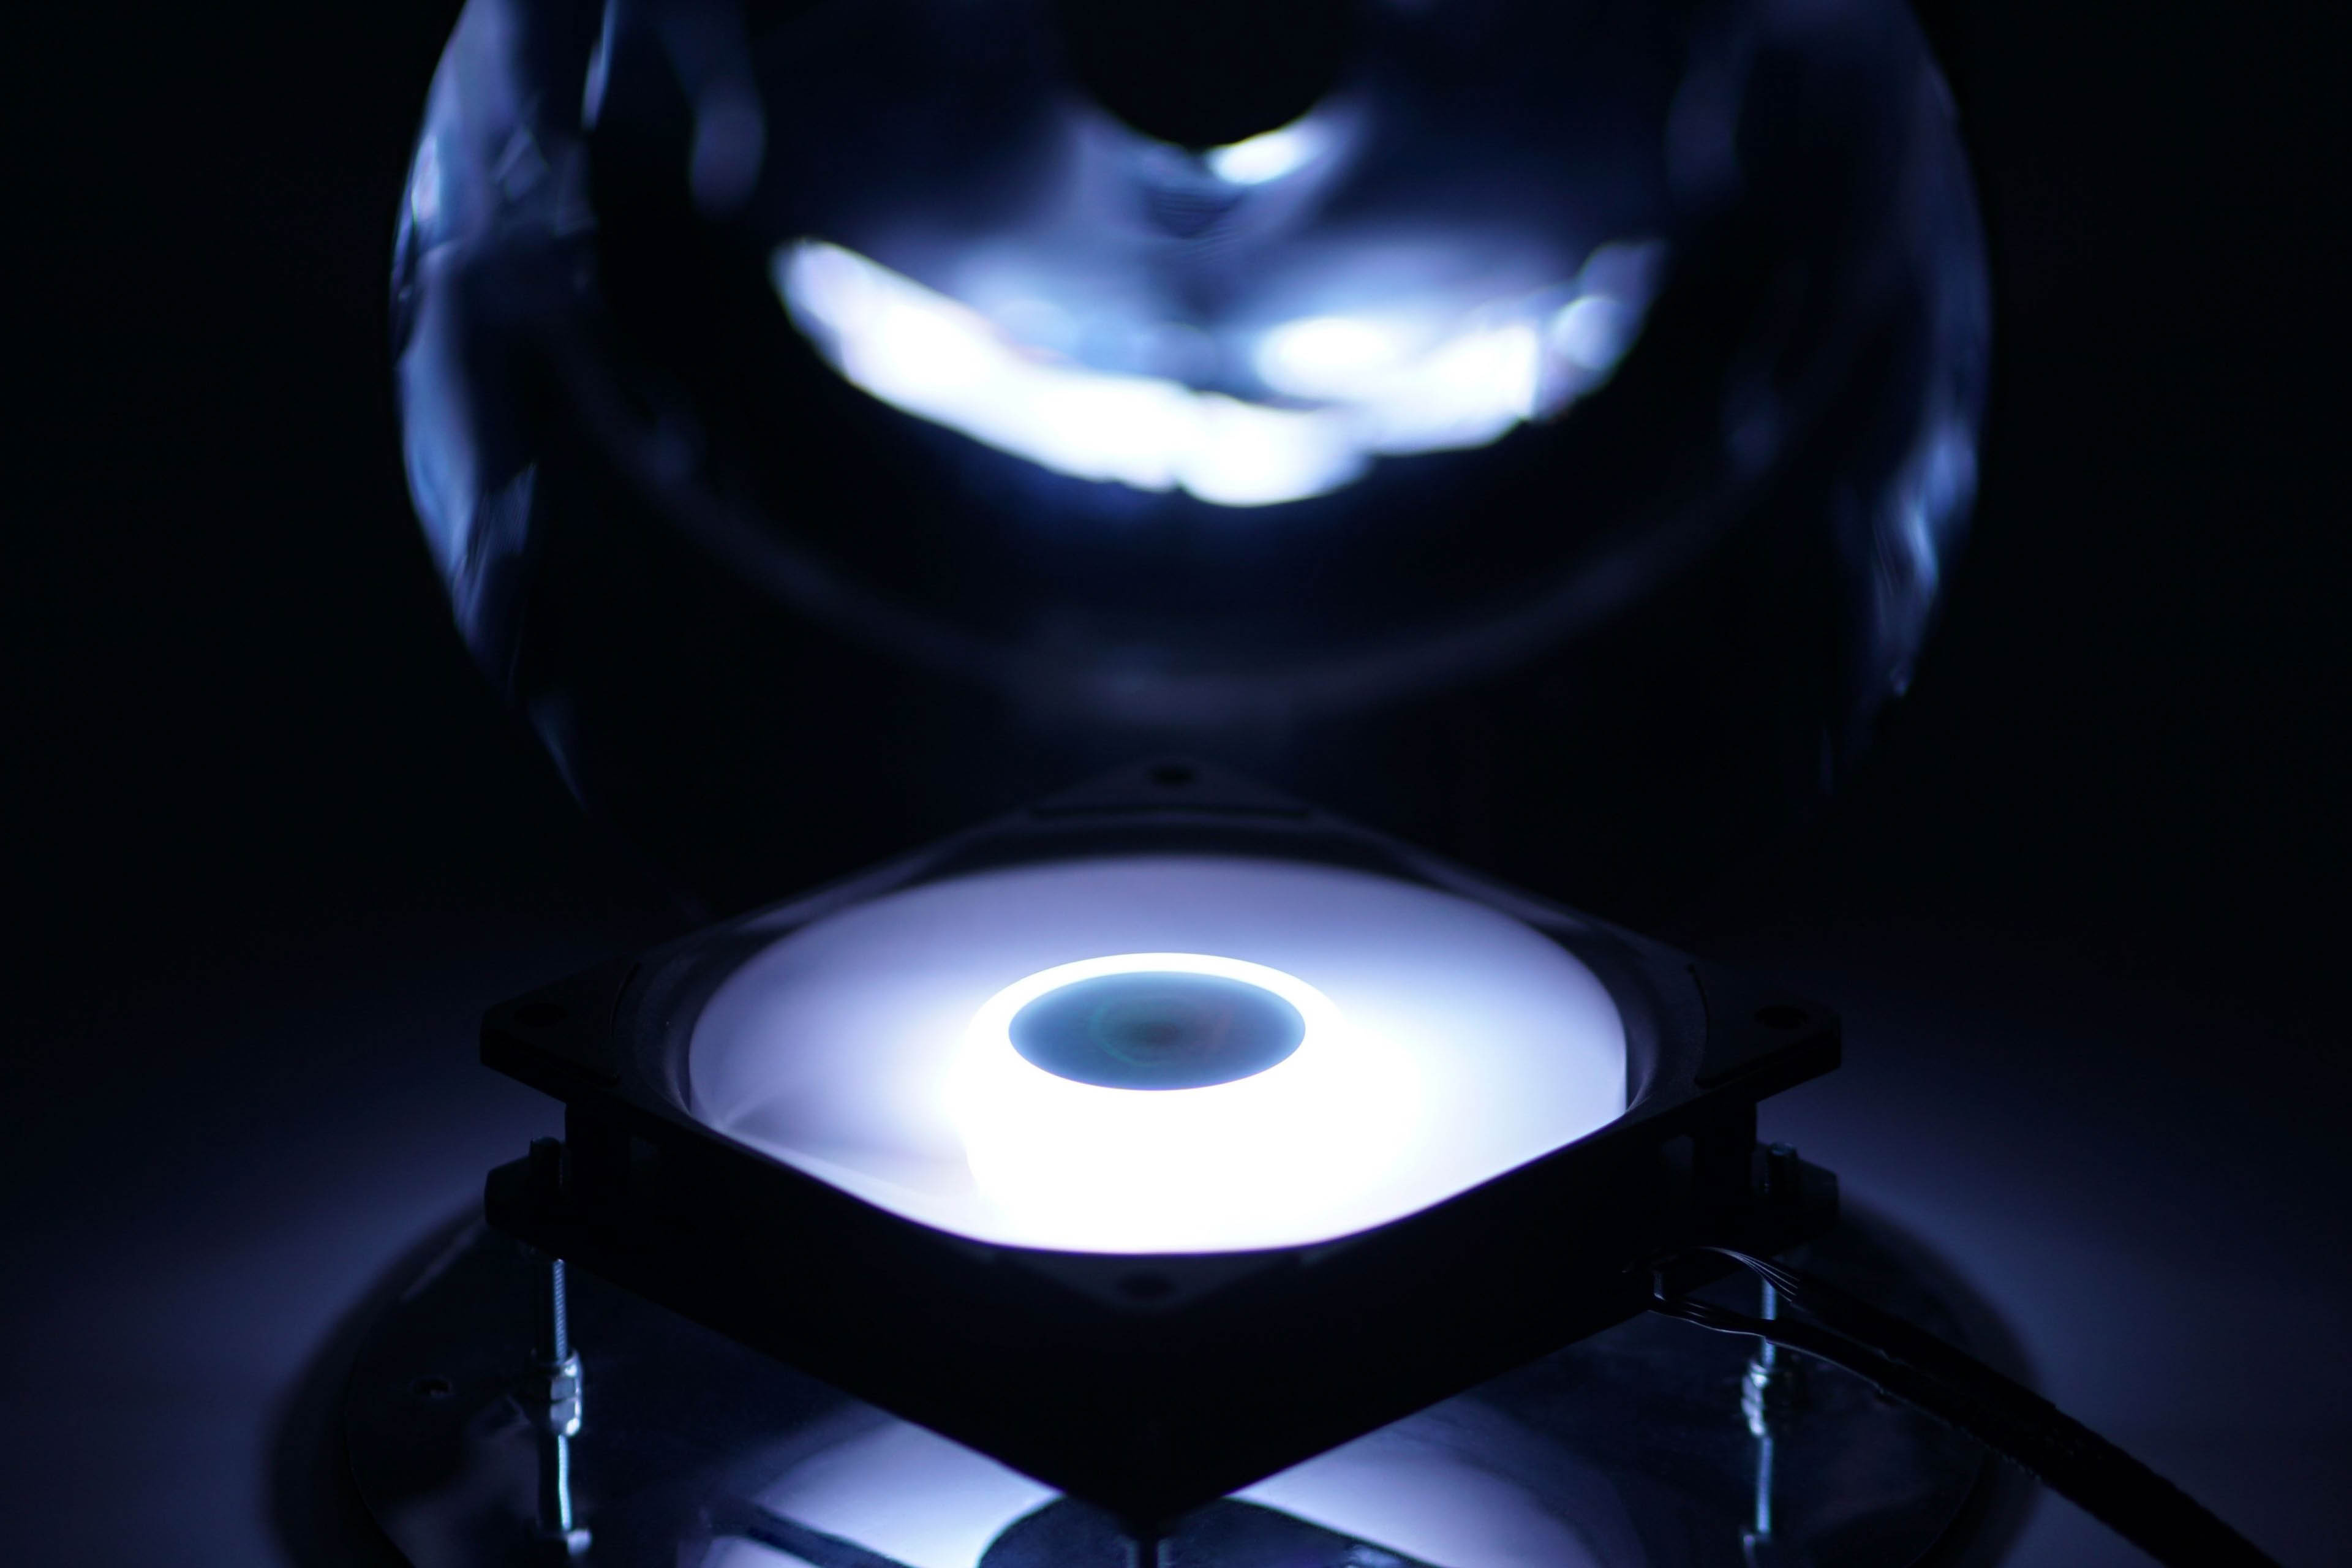
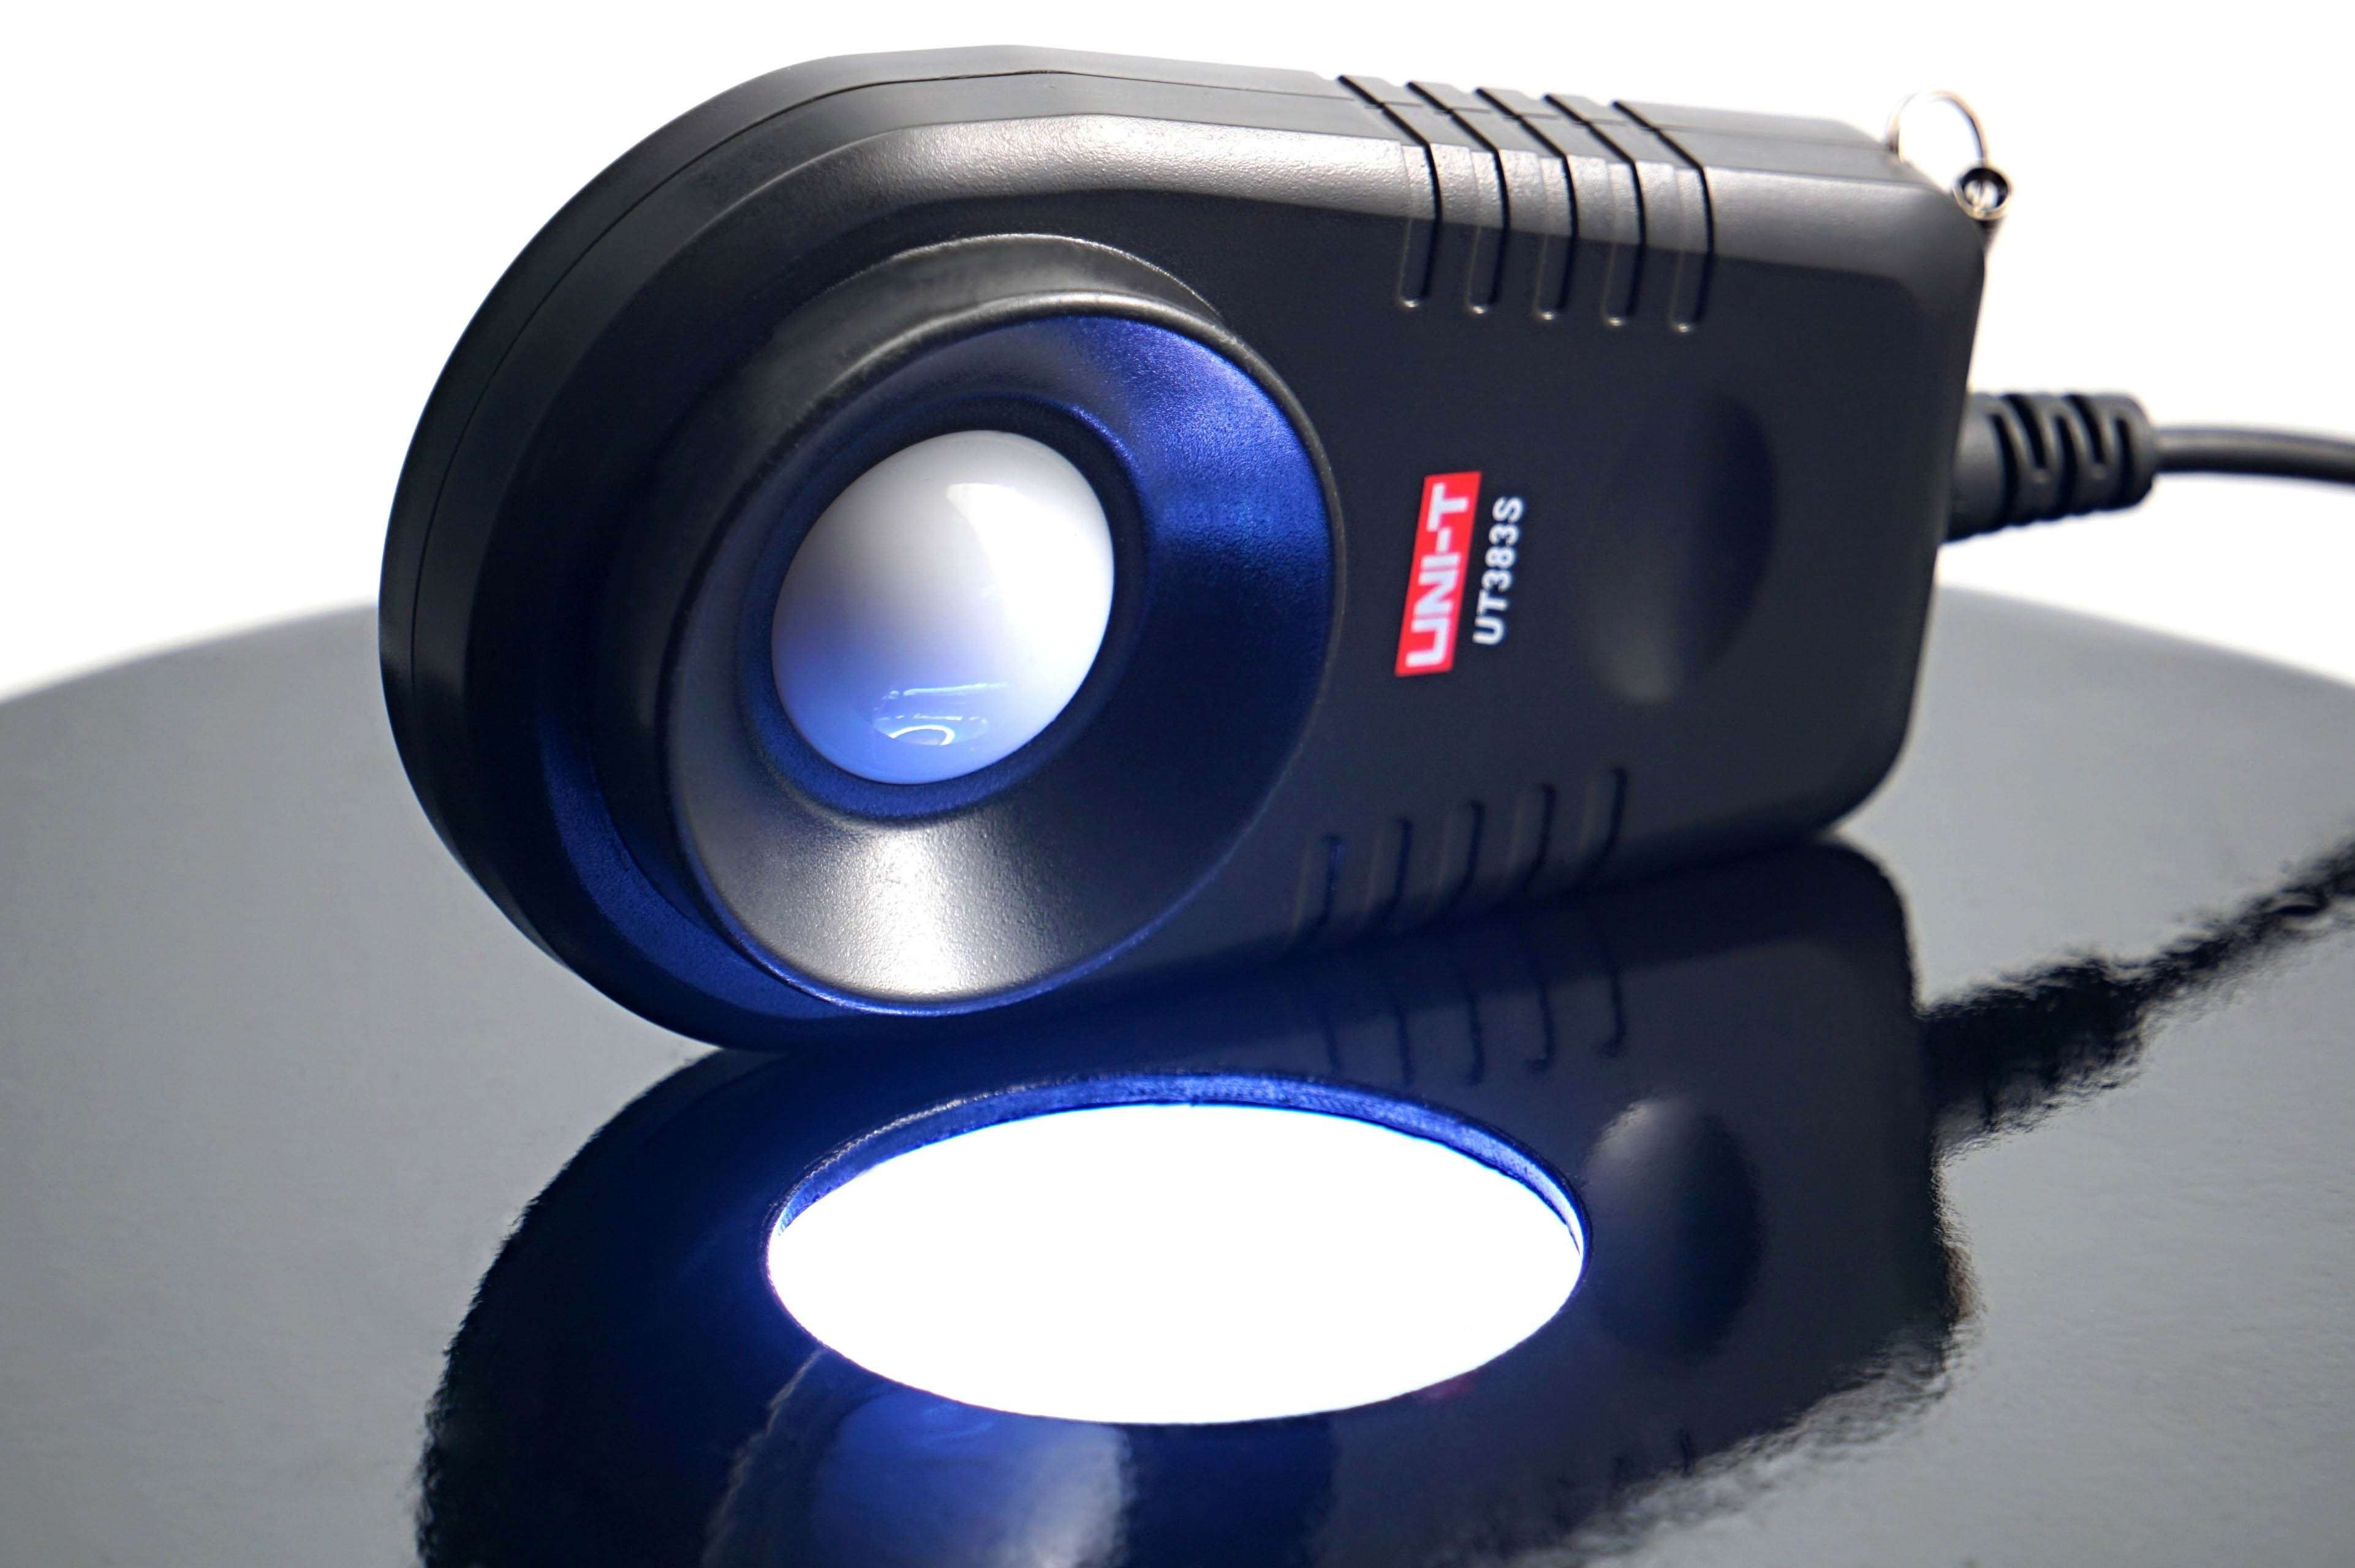
The illumination intensity is measured in the horizontal position of the fan, above which is the lux meter sensor (UNI-T UT383S). This is centered on the illumination intensity sensing chamber.
The illumination is controlled via an IR controller and the hue is set to RGB level 255, 255, 255 (white). We record the brightness at maximum and minimum intensity. According to this, you can easily see if the brightness is high enough, but conversely also if the lower level is low enough for you.
In addition to the brightness intensity, we also measure the power draw that it requires. This is again through the shunt, which is between the Gophert CPS-3205 power supply and the (A)RGB LED driver. After this we get a reading of the lighting power draw. In the graphs we show it separately, but also in sum with the motor power draw as the total maximum fan power.
The first and still the only Asus fan that is on sale individually may be a good choice. But you can also get burnt. It depends on what you want to use it for. In the right context, it gives attractive results, and the impression of a very decent fan is spoiled mainly by pointless design details or sugar-coating the specs. Anyway, you can see that compared to the more ordinary fans from the last test, the Strix is a bit of a different class.
Results: Speed

The first and still the only Asus fan that is on sale individually may be a good choice. But you can also get burnt. It depends on what you want to use it for. In the right context, it gives attractive results, and the impression of a very decent fan is spoiled mainly by pointless design details or sugar-coating the specs. Anyway, you can see that compared to the more ordinary fans from the last test, the Strix is a bit of a different class.
Results: Airflow w/o obstacles
The first and still the only Asus fan that is on sale individually may be a good choice. But you can also get burnt. It depends on what you want to use it for. In the right context, it gives attractive results, and the impression of a very decent fan is spoiled mainly by pointless design details or sugar-coating the specs. Anyway, you can see that compared to the more ordinary fans from the last test, the Strix is a bit of a different class.
Results: Airflow through a nylon filter
The first and still the only Asus fan that is on sale individually may be a good choice. But you can also get burnt. It depends on what you want to use it for. In the right context, it gives attractive results, and the impression of a very decent fan is spoiled mainly by pointless design details or sugar-coating the specs. Anyway, you can see that compared to the more ordinary fans from the last test, the Strix is a bit of a different class.
Results: Airflow through a plastic filter
The first and still the only Asus fan that is on sale individually may be a good choice. But you can also get burnt. It depends on what you want to use it for. In the right context, it gives attractive results, and the impression of a very decent fan is spoiled mainly by pointless design details or sugar-coating the specs. Anyway, you can see that compared to the more ordinary fans from the last test, the Strix is a bit of a different class.
Results: Airflow through a hexagonal grille
The first and still the only Asus fan that is on sale individually may be a good choice. But you can also get burnt. It depends on what you want to use it for. In the right context, it gives attractive results, and the impression of a very decent fan is spoiled mainly by pointless design details or sugar-coating the specs. Anyway, you can see that compared to the more ordinary fans from the last test, the Strix is a bit of a different class.
Results: Airflow through a thinner radiator
The first and still the only Asus fan that is on sale individually may be a good choice. But you can also get burnt. It depends on what you want to use it for. In the right context, it gives attractive results, and the impression of a very decent fan is spoiled mainly by pointless design details or sugar-coating the specs. Anyway, you can see that compared to the more ordinary fans from the last test, the Strix is a bit of a different class.
Results: Airflow through a thicker radiator
The first and still the only Asus fan that is on sale individually may be a good choice. But you can also get burnt. It depends on what you want to use it for. In the right context, it gives attractive results, and the impression of a very decent fan is spoiled mainly by pointless design details or sugar-coating the specs. Anyway, you can see that compared to the more ordinary fans from the last test, the Strix is a bit of a different class.
Results: Static pressure w/o obstacles
The first and still the only Asus fan that is on sale individually may be a good choice. But you can also get burnt. It depends on what you want to use it for. In the right context, it gives attractive results, and the impression of a very decent fan is spoiled mainly by pointless design details or sugar-coating the specs. Anyway, you can see that compared to the more ordinary fans from the last test, the Strix is a bit of a different class.
Results: Static pressure through a nylon filter
The first and still the only Asus fan that is on sale individually may be a good choice. But you can also get burnt. It depends on what you want to use it for. In the right context, it gives attractive results, and the impression of a very decent fan is spoiled mainly by pointless design details or sugar-coating the specs. Anyway, you can see that compared to the more ordinary fans from the last test, the Strix is a bit of a different class.
Results: Static pressure through a plastic filter
The first and still the only Asus fan that is on sale individually may be a good choice. But you can also get burnt. It depends on what you want to use it for. In the right context, it gives attractive results, and the impression of a very decent fan is spoiled mainly by pointless design details or sugar-coating the specs. Anyway, you can see that compared to the more ordinary fans from the last test, the Strix is a bit of a different class.
Results: Static pressure through a hexagonal grille
The first and still the only Asus fan that is on sale individually may be a good choice. But you can also get burnt. It depends on what you want to use it for. In the right context, it gives attractive results, and the impression of a very decent fan is spoiled mainly by pointless design details or sugar-coating the specs. Anyway, you can see that compared to the more ordinary fans from the last test, the Strix is a bit of a different class.
Results: Static pressure through a thinner radiator
The first and still the only Asus fan that is on sale individually may be a good choice. But you can also get burnt. It depends on what you want to use it for. In the right context, it gives attractive results, and the impression of a very decent fan is spoiled mainly by pointless design details or sugar-coating the specs. Anyway, you can see that compared to the more ordinary fans from the last test, the Strix is a bit of a different class.
Results: Static pressure through a thicker radiator
The first and still the only Asus fan that is on sale individually may be a good choice. But you can also get burnt. It depends on what you want to use it for. In the right context, it gives attractive results, and the impression of a very decent fan is spoiled mainly by pointless design details or sugar-coating the specs. Anyway, you can see that compared to the more ordinary fans from the last test, the Strix is a bit of a different class.
Results: Static pressure, efficiency by orientation
The first and still the only Asus fan that is on sale individually may be a good choice. But you can also get burnt. It depends on what you want to use it for. In the right context, it gives attractive results, and the impression of a very decent fan is spoiled mainly by pointless design details or sugar-coating the specs. Anyway, you can see that compared to the more ordinary fans from the last test, the Strix is a bit of a different class.
Reality vs. specifications
The first and still the only Asus fan that is on sale individually may be a good choice. But you can also get burnt. It depends on what you want to use it for. In the right context, it gives attractive results, and the impression of a very decent fan is spoiled mainly by pointless design details or sugar-coating the specs. Anyway, you can see that compared to the more ordinary fans from the last test, the Strix is a bit of a different class.
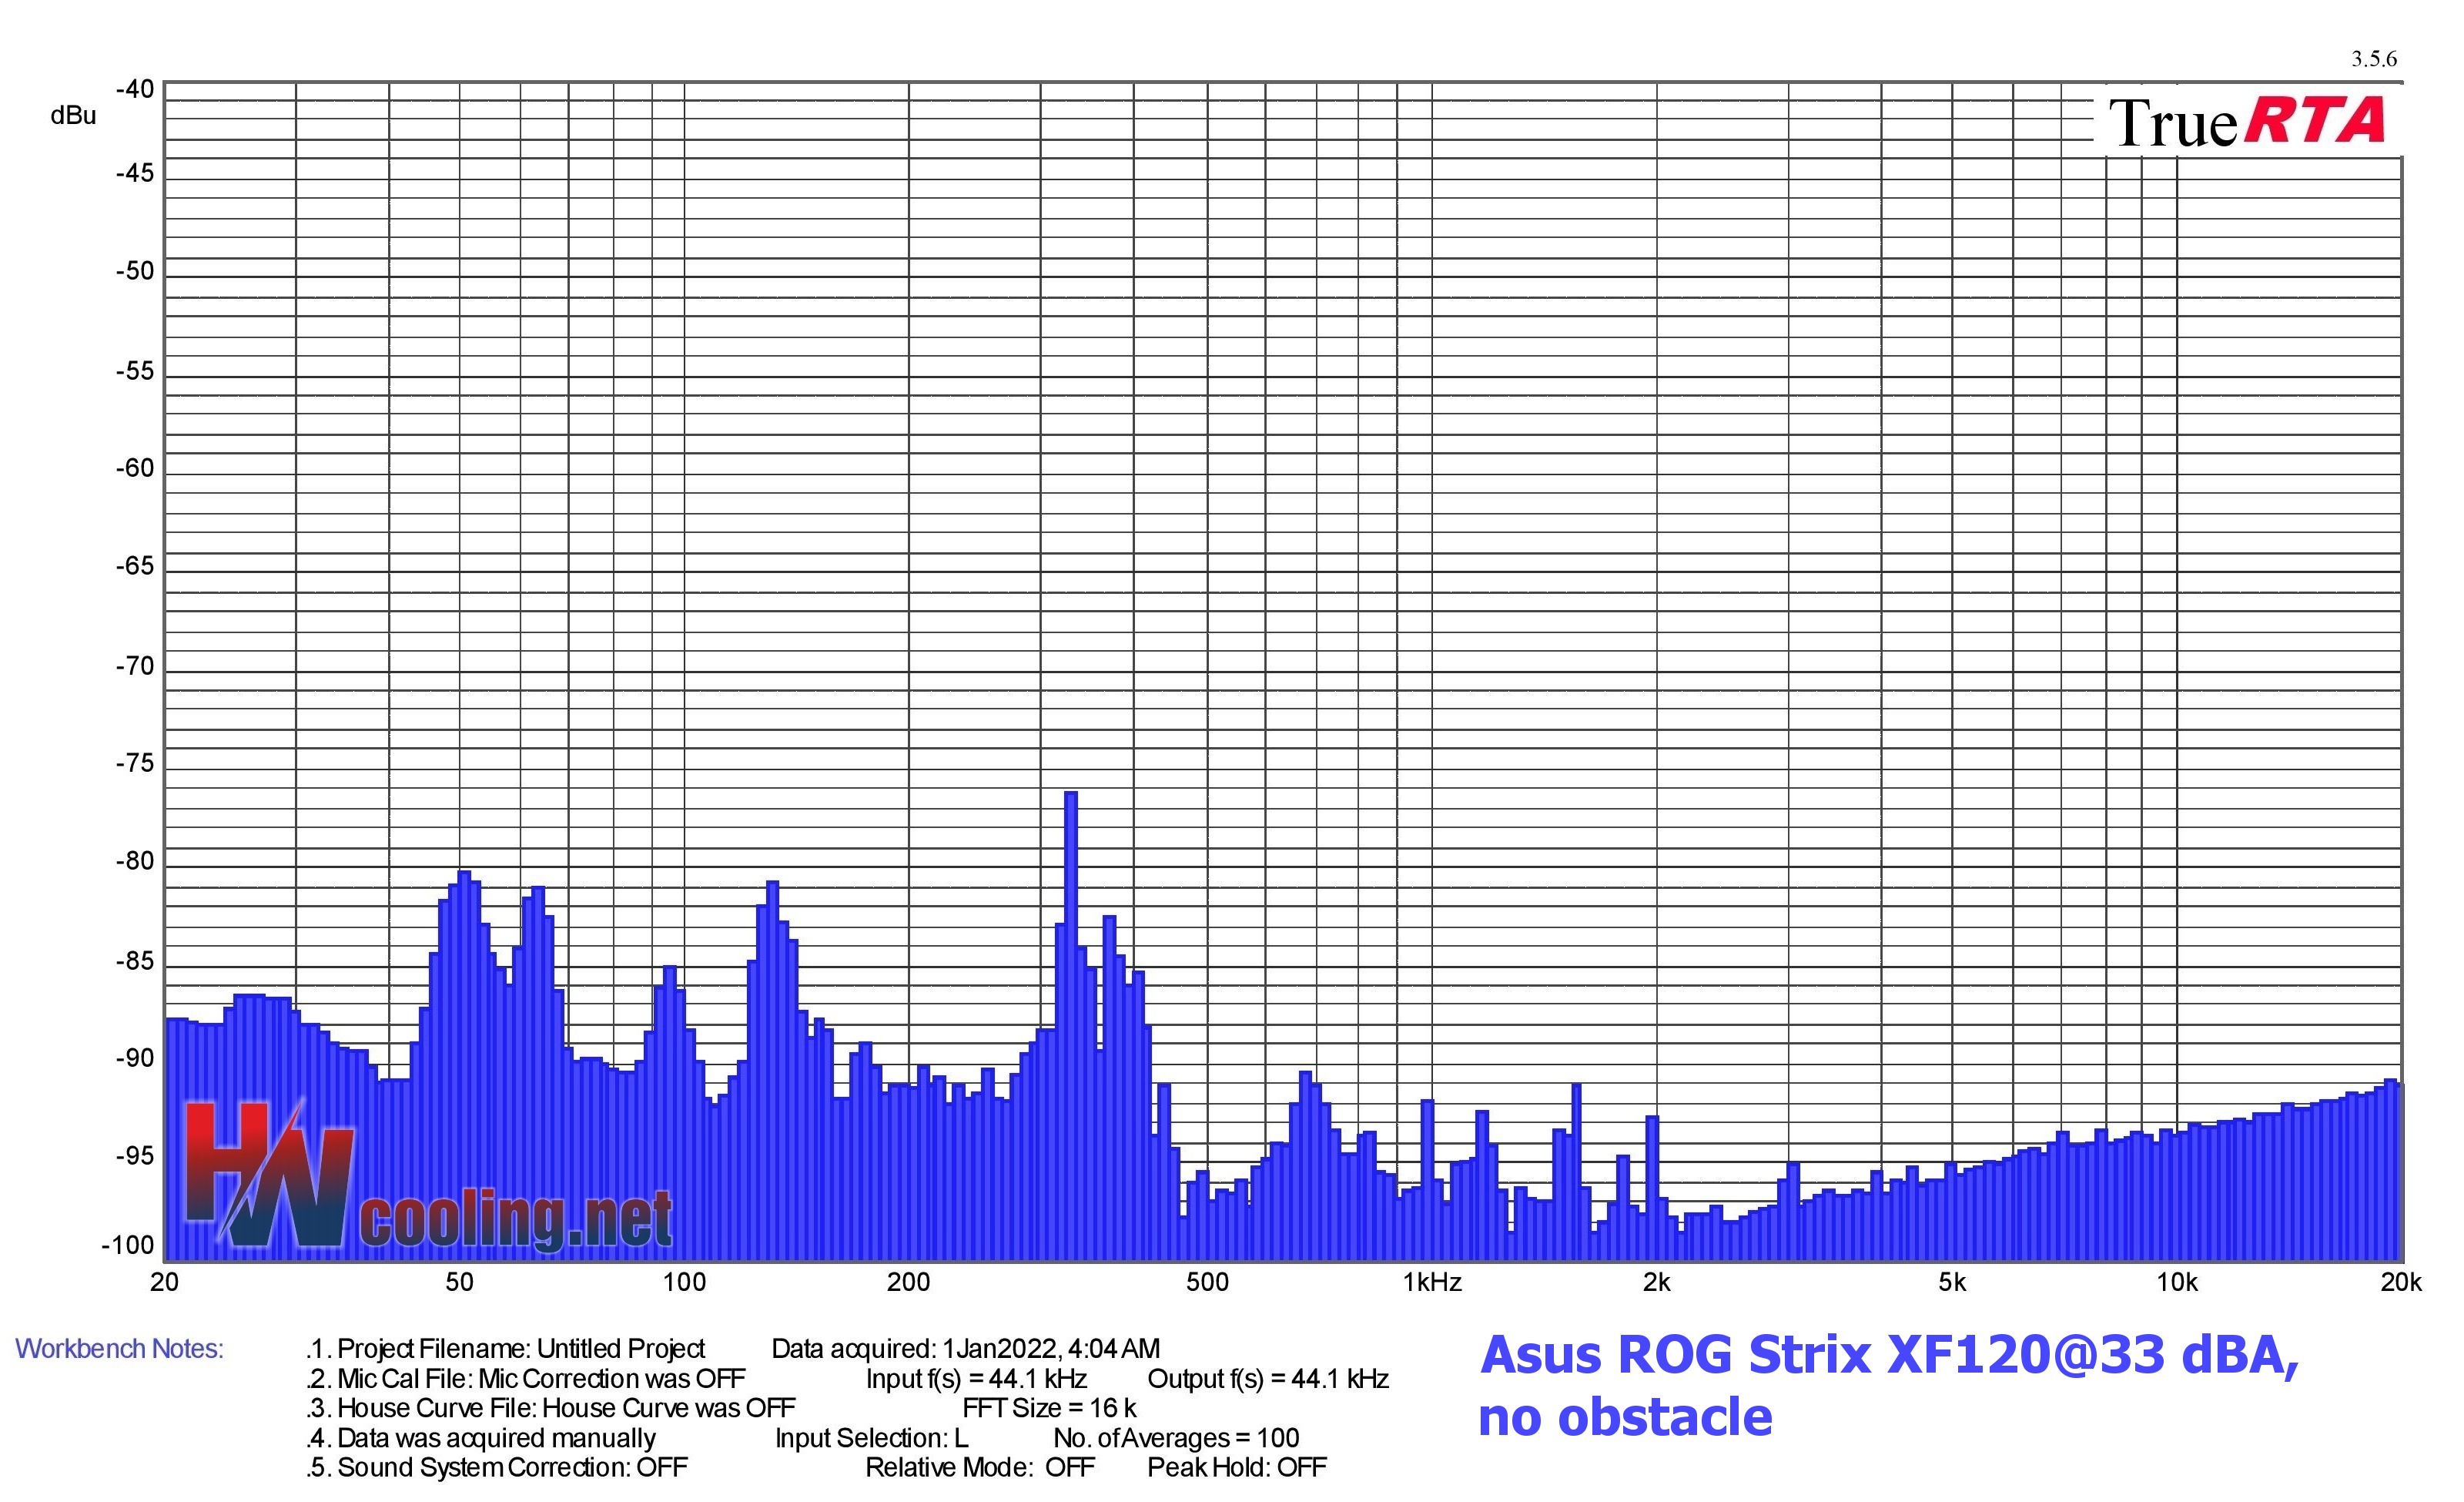
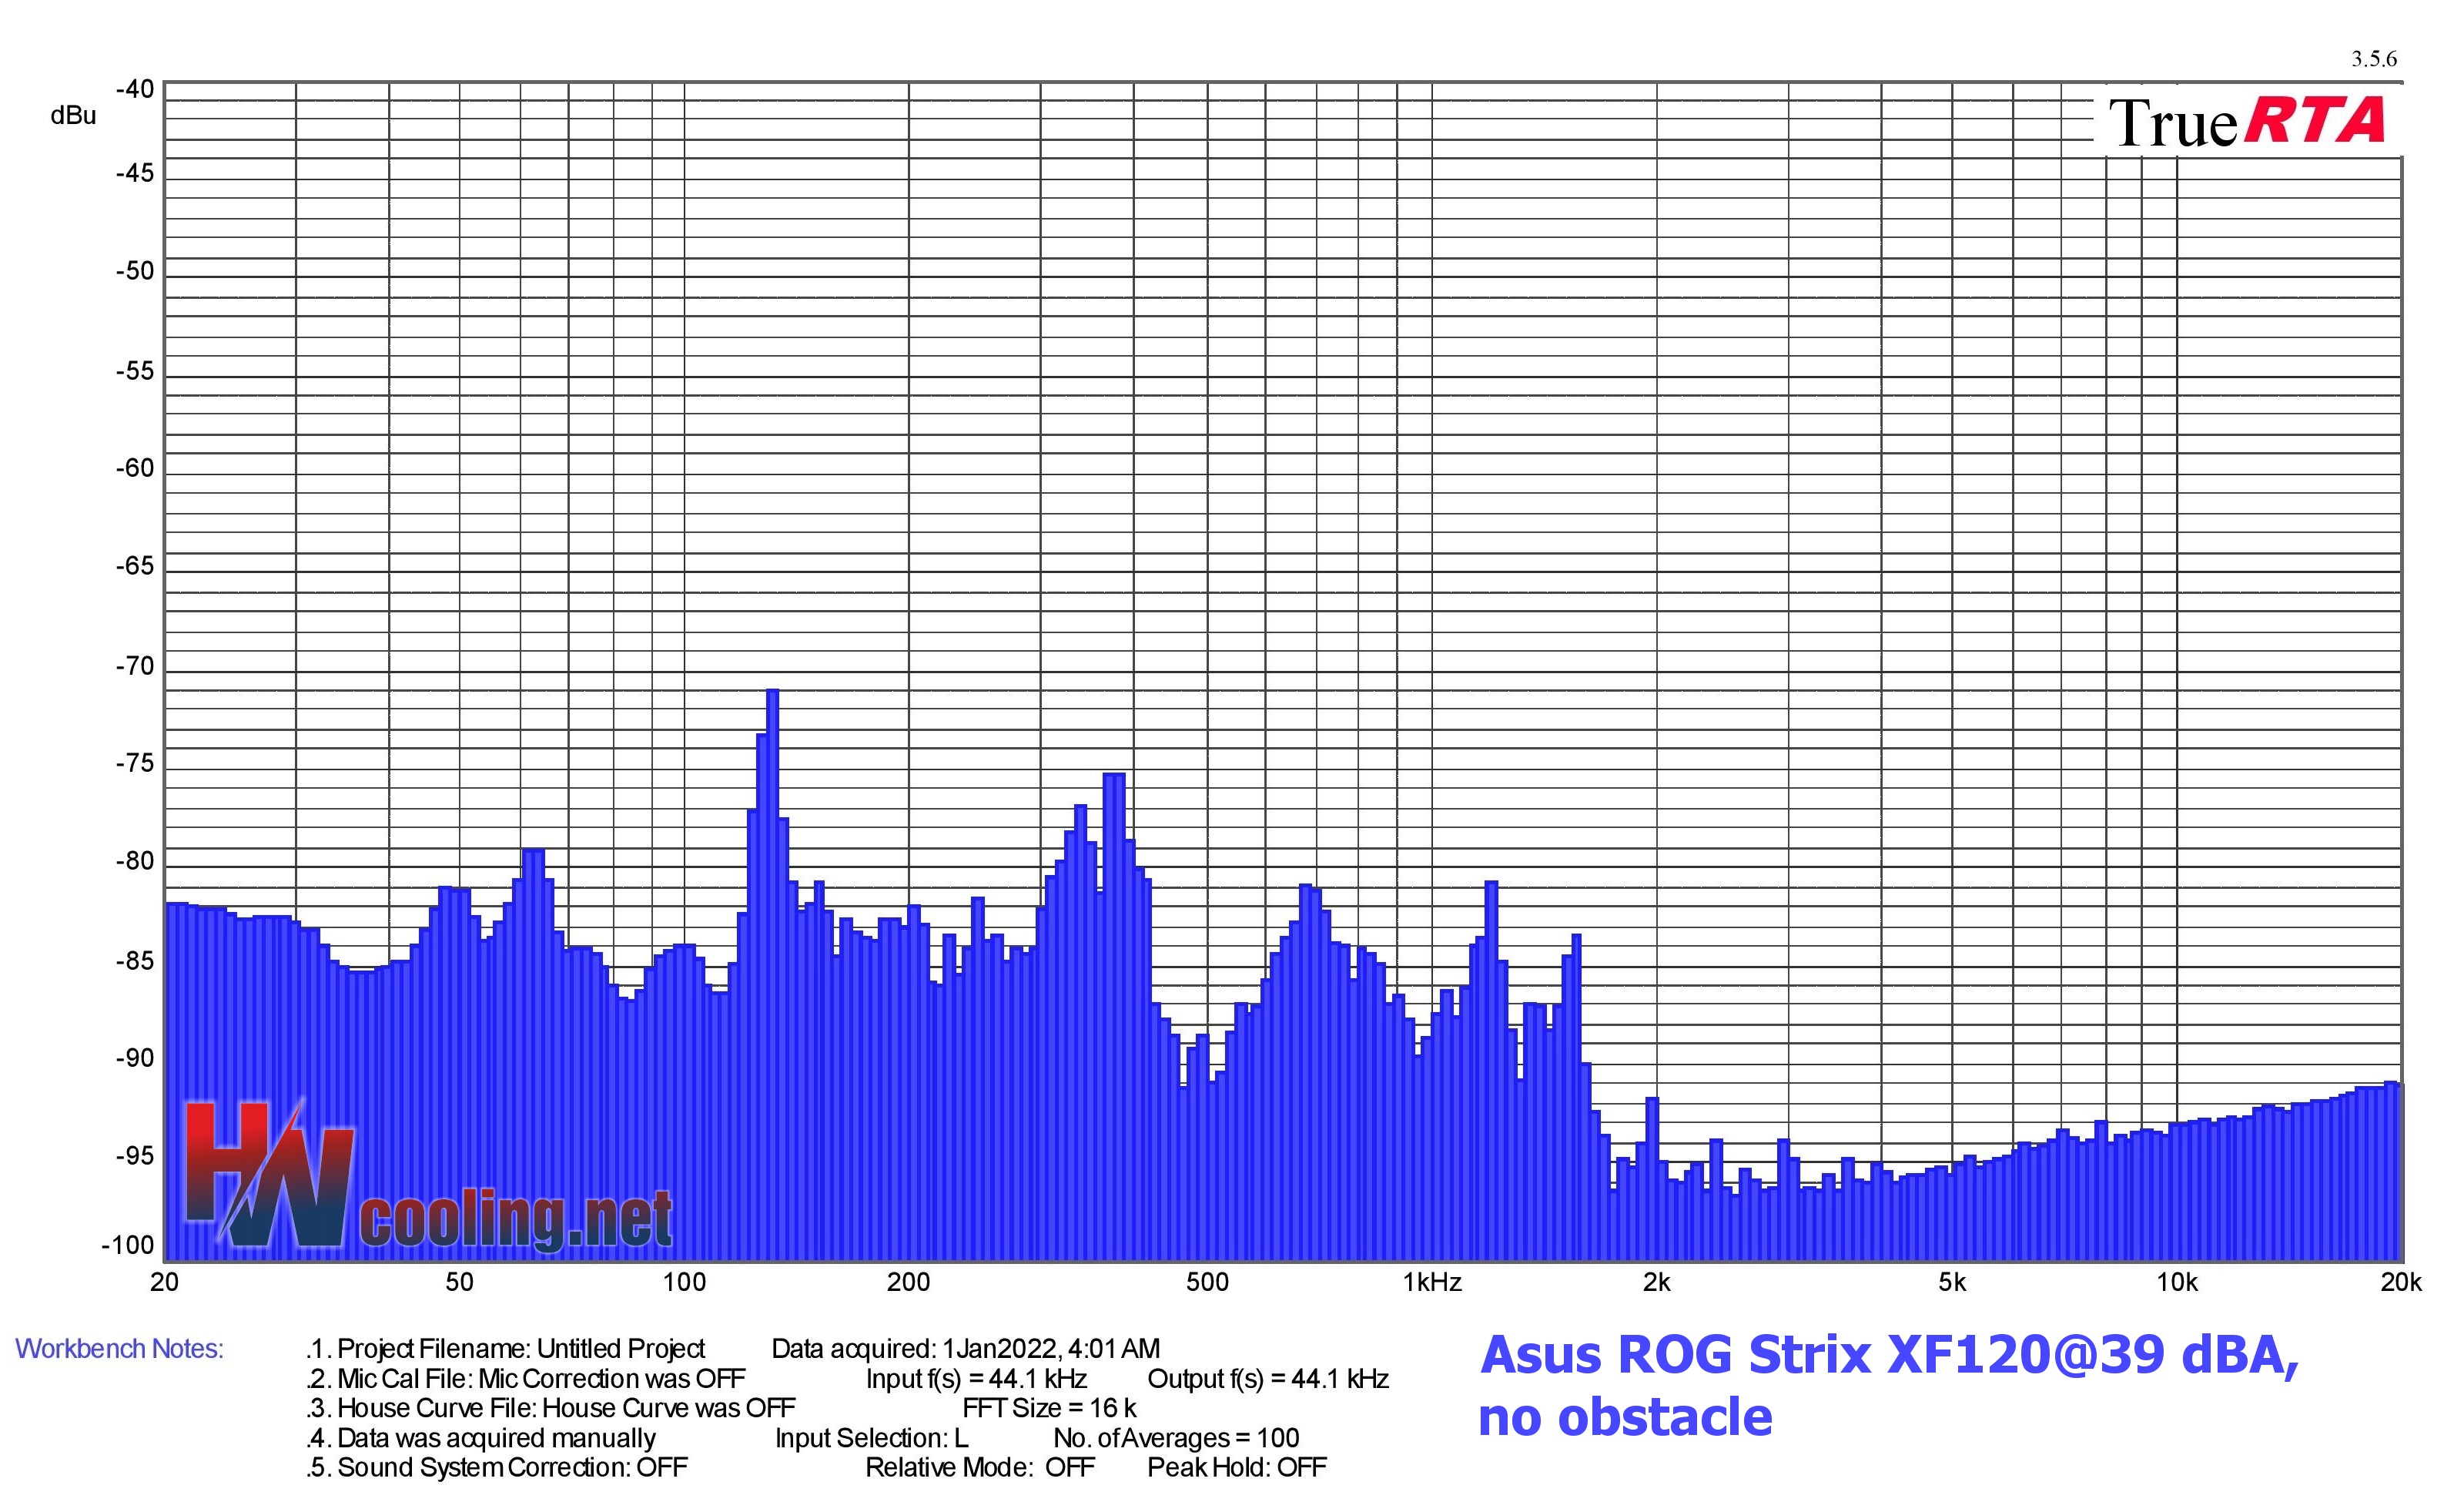
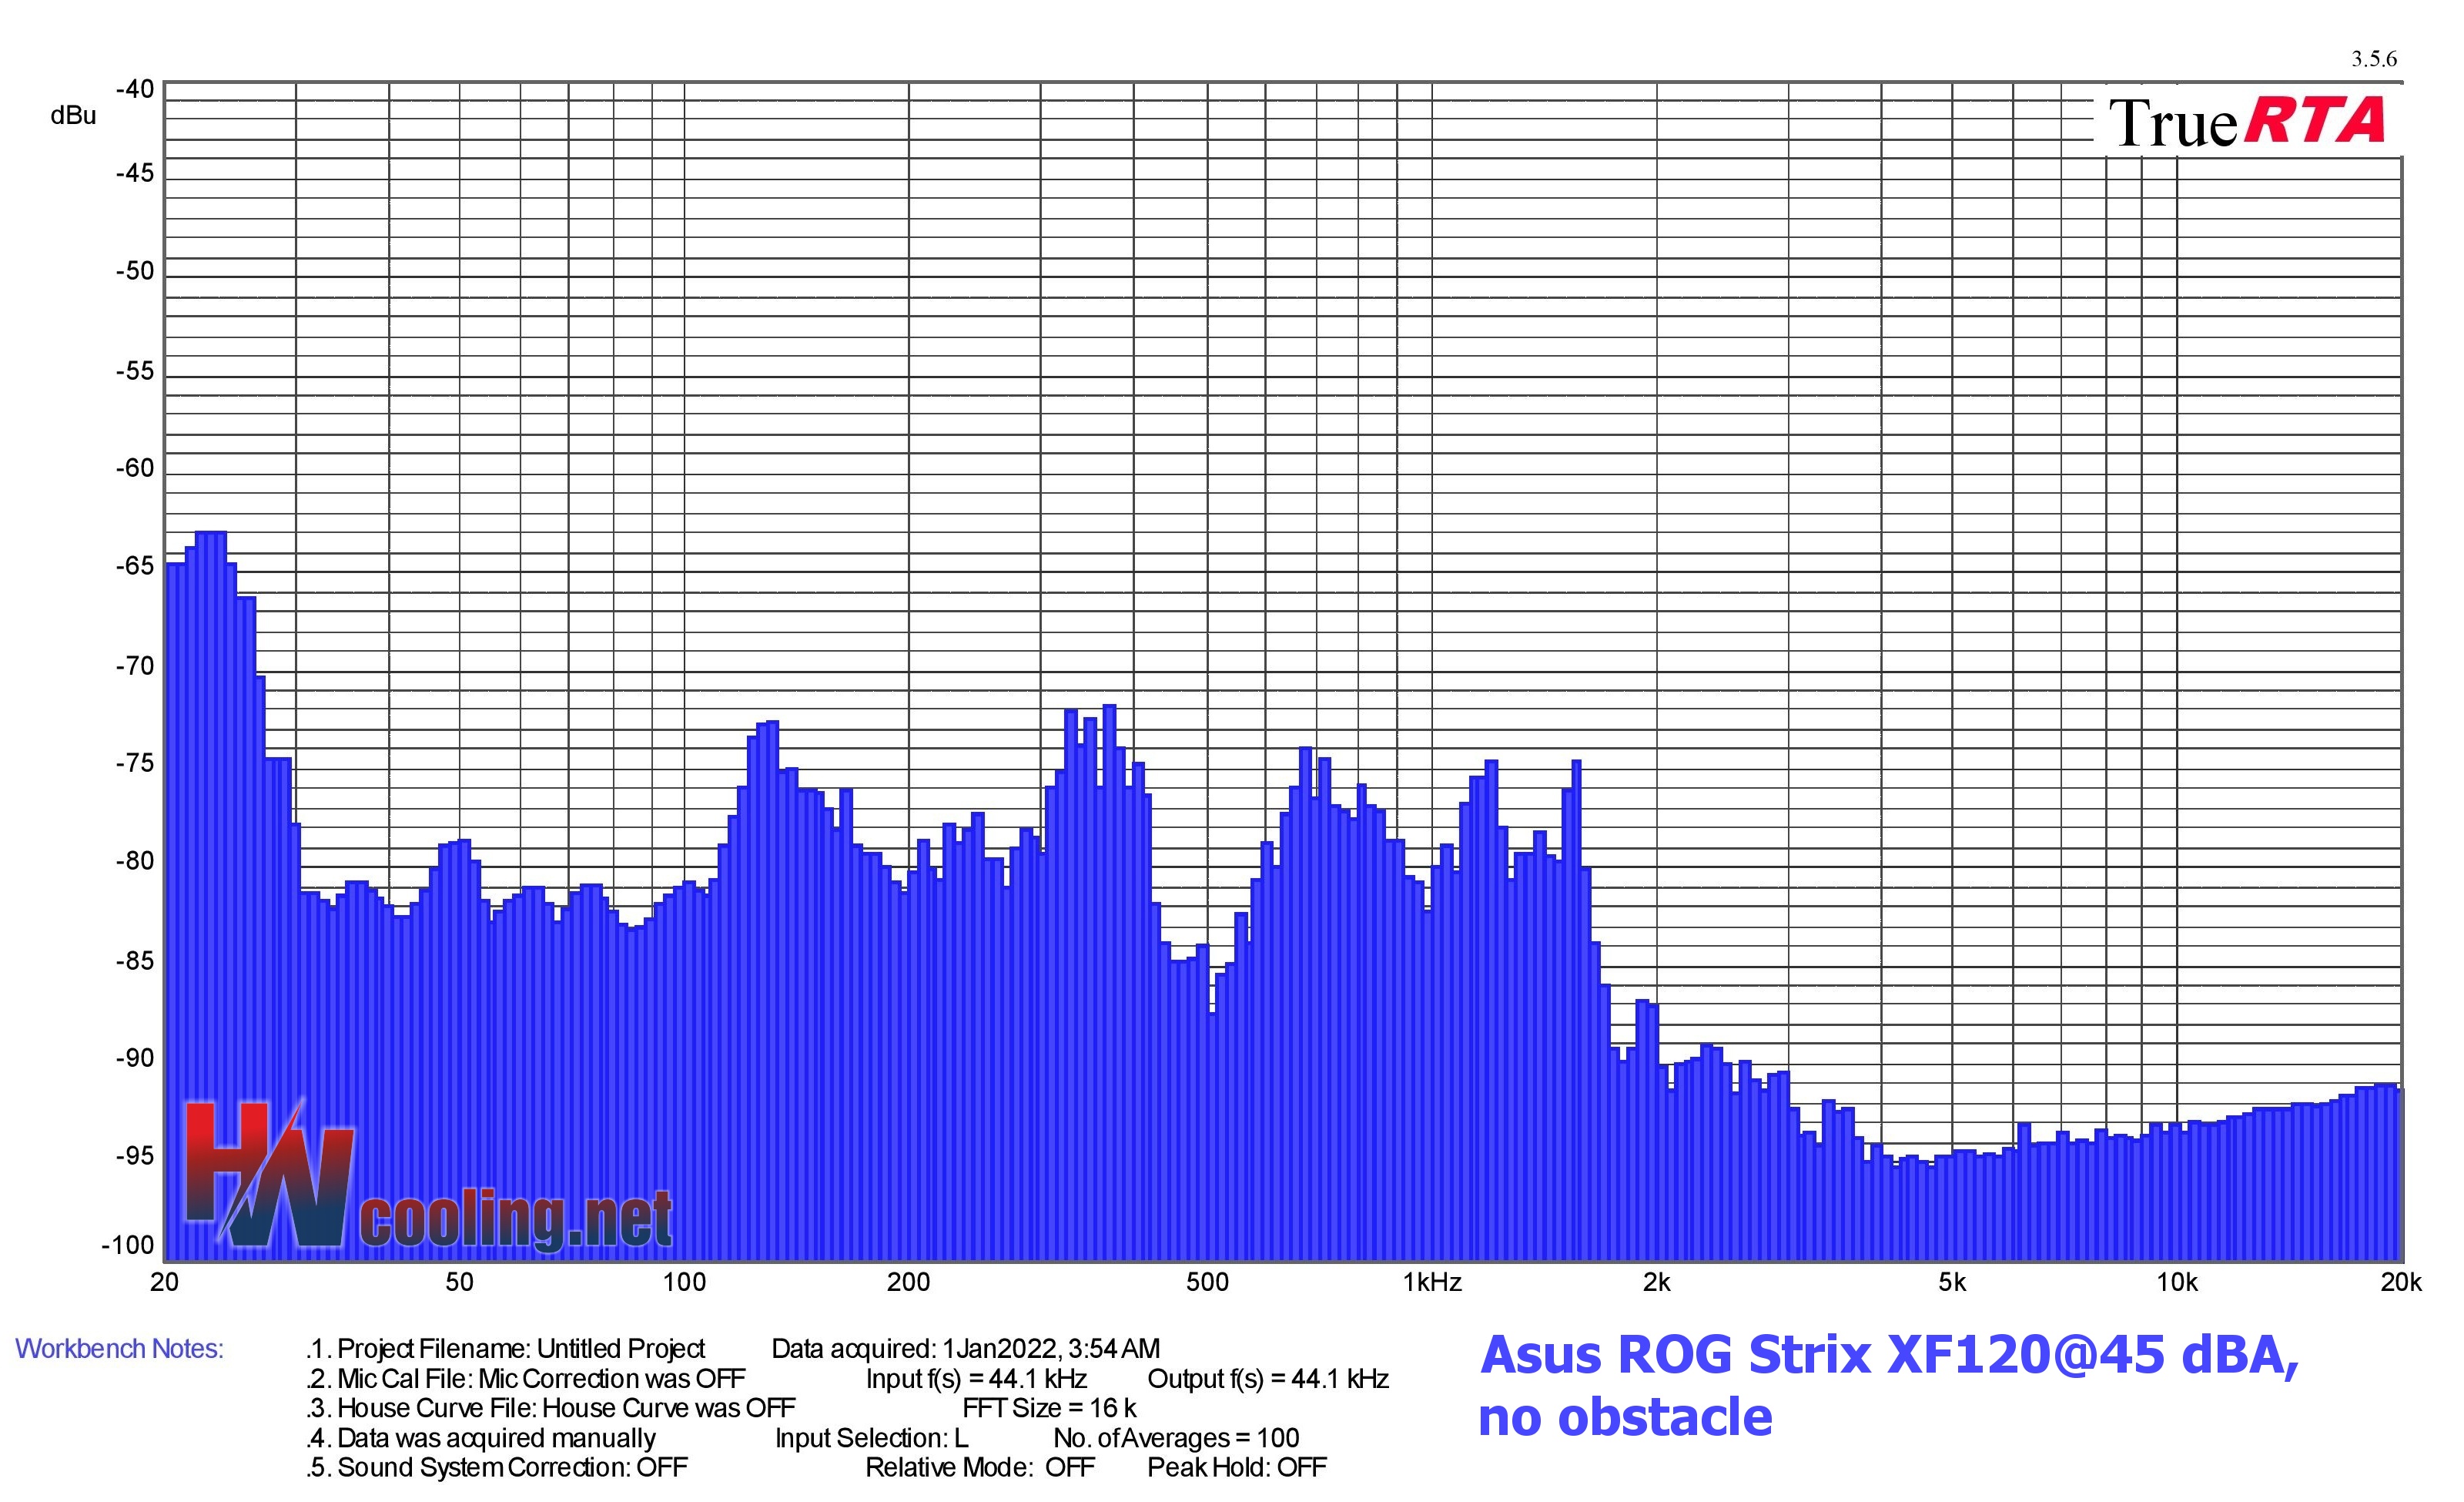
Results: Frequency response of sound w/o obstacles
Measurements are performed in the TrueRTA application, which records sound in a range of 240 frequencies in the recorded range of 20–20,000 Hz. For the possibility of comparison across articles, we export the dominant frequency from the low (20–200 Hz), medium (201–2,000 Hz) and high (2,001–20,000 Hz) range to standard bar graphs.
However, for an even more detailed analysis of the sound expression, it is important to perceive the overall shape of the graph and the intensity of all frequencies/tones. If you don’t understand something in the graphs or tables below, you’ll find the answers to all your questions in this article. It explains how to read the measured data below correctly.
| Fan | Dominant sound freq. and noise level, no obstacle@33 dBA | NF-F12 PWM | NF-A15 PWM | ||||
| Low range | Mid range | High range | |||||
| Frequency [Hz] | Noise level [dBu] | Frequency [Hz] | Noise level [dBu] | Frequency [Hz] | Noise level [dBu] | ||
| Asus ROG Strix XF120 | 164,7 | -66,8 | 320,0 | -68,2 | 2416,3 | -83,8 | |
| Akasa Vegas X7 | N/A | N/A | N/A | N/A | N/A | N/A | |
| Reeven Coldwing 12 | 195,8 | -69,4 | 391,7 | -71,9 | 2152,7 | -85,6 | |
| Reeven Kiran | 123,4 | -71,7 | 391,7 | -71,2 | 3225,4 | -84,4 | |
| SilentiumPC Sigma Pro 120 PWM | 142,5 | -72,4 | 339,0 | -72,5 | 2152,7 | -76,1 | |
| SilentiumPC Sigma Pro Corona RGB 120 | 23,1 | -59,7 | 329,4 | -69,7 | 2635,0 | -81,1 | |
| SilverStone SST-AP121 | 127,0 | -65,5 | 310,9 | -70,2 | 18780,2 | -90,9 | |
| SilverStone SST-FQ121 | 20,3 | -66,0 | 201,6 | -65,8 | 18780,2 | -90,9 | |
| Xigmatek XLF-F1256 | 130,7 | -64,2 | 739,4 | -64,3 | 3133,6 | -90,8 |
| Fan | Dominant sound freq. and noise level, no obstacle@39 dBA | NF-F12 PWM | NF-A15 PWM | ||||
| Low range | Mid range | High range | |||||
| Frequency [Hz] | Noise level [dBu] | Frequency [Hz] | Noise level [dBu] | Frequency [Hz] | Noise level [dBu] | ||
| Asus ROG Strix XF120 | 130,7 | -70,9 | 369,7 | -75,2 | 19330,5 | -91,0 | |
| Akasa Vegas X7 | 127,0 | -77,8 | 369,7 | -76,1 | 19330,5 | -90,9 | |
| Reeven Coldwing 12 | 160,0 | -74,0 | 369,7 | -76,8 | 19330,5 | -90,9 | |
| Reeven Kiran | 184,9 | -75,2 | 369,7 | -75,2 | 17726,2 | -89,8 | |
| SilentiumPC Sigma Pro 120 PWM | 97,9 | -81,7 | 369,7 | -78,1 | 2635,0 | -86,2 | |
| SilentiumPC Sigma Pro Corona RGB 120 | 20,3 | -67,8 | 380,5 | -77,3 | 2487,1 | -85,6 | |
| SilverStone SST-AP121 | 103,7 | -76,2 | 339,0 | -73,4 | 2031,9 | -86,5 | |
| SilverStone SST-FQ121 | 138,5 | -75,2 | 1208,2 | -71,1 | 18780,2 | -90,9 | |
| Xigmatek XLF-F1256 | 190,3 | -77,1 | 761,1 | -75,5 | 19897,0 | -91,1 |
| Fan | Dominant sound freq. and noise level, no obstacle@45 dBA | NF-F12 PWM | NF-A15 PWM | ||||
| Low range | Mid range | High range | |||||
| Frequency [Hz] | Noise level [dBu] | Frequency [Hz] | Noise level [dBu] | Frequency [Hz] | Noise level [dBu] | ||
| Asus ROG Strix XF120 | 23,1 | -62,9 | 369,7 | -71,7 | 2347,5 | -89,1 | |
| Akasa Vegas X7 | N/A | N/A | N/A | N/A | N/A | N/A | |
| Reeven Coldwing 12 | 195,8 | -68,3 | 380,5 | -71,3 | 2031,9 | -90,0 | |
| Reeven Kiran | 130,7 | -73,1 | 219,8 | -70,2 | 17726,2 | -89,4 | |
| SilentiumPC Sigma Pro 120 PWM | 138,5 | -70,0 | 1522,2 | -71,9 | 2560,0 | -82,9 | |
| SilentiumPC Sigma Pro Corona RGB 120 | 190,3 | -70,5 | 369,7 | -66,5 | 2416,3 | -82,4 | |
| SilverStone SST-AP121 | 130,7 | -66,8 | 439,7 | -66,1 | 2347,5 | -90,9 | |
| SilverStone SST-FQ121 | 127,0 | -71,2 | 369,7 | -66,5 | 2031,8 | -81,4 | |
| Xigmatek XLF-F1256 | 130,7 | -71,5 | 239,7 | -60,9 | 18780,2 | -91,1 |
The first and still the only Asus fan that is on sale individually may be a good choice. But you can also get burnt. It depends on what you want to use it for. In the right context, it gives attractive results, and the impression of a very decent fan is spoiled mainly by pointless design details or sugar-coating the specs. Anyway, you can see that compared to the more ordinary fans from the last test, the Strix is a bit of a different class.
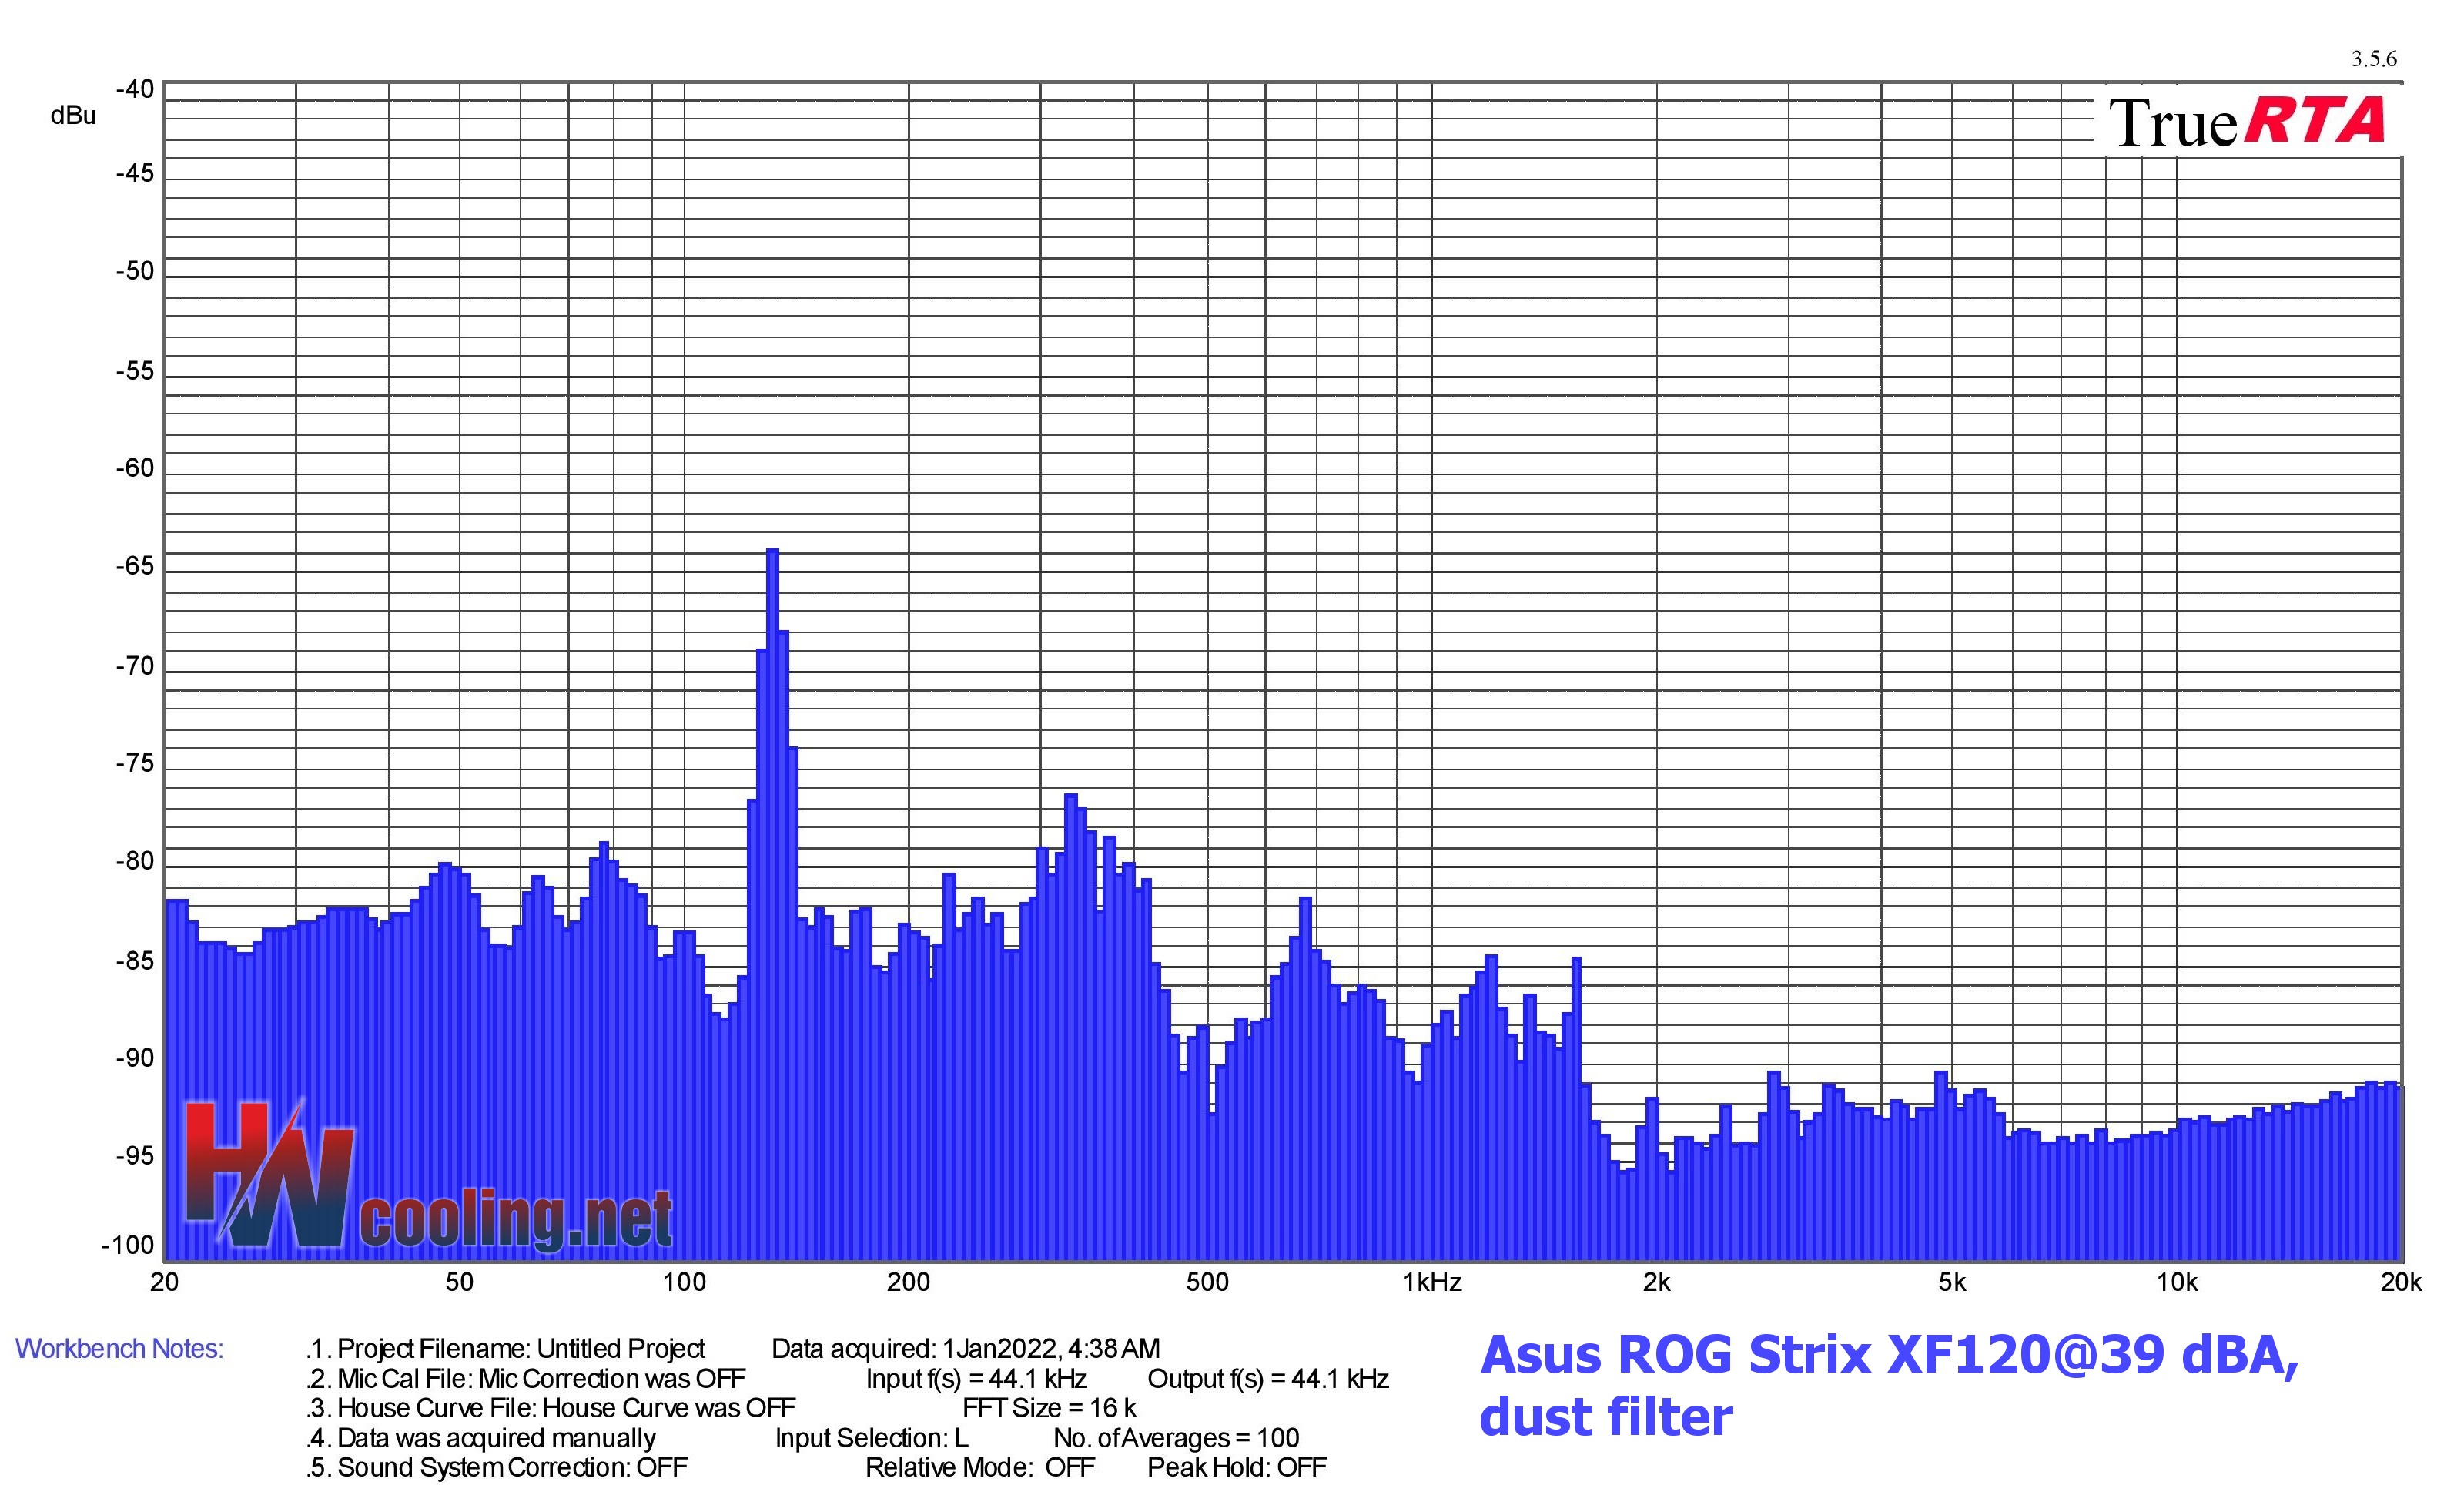
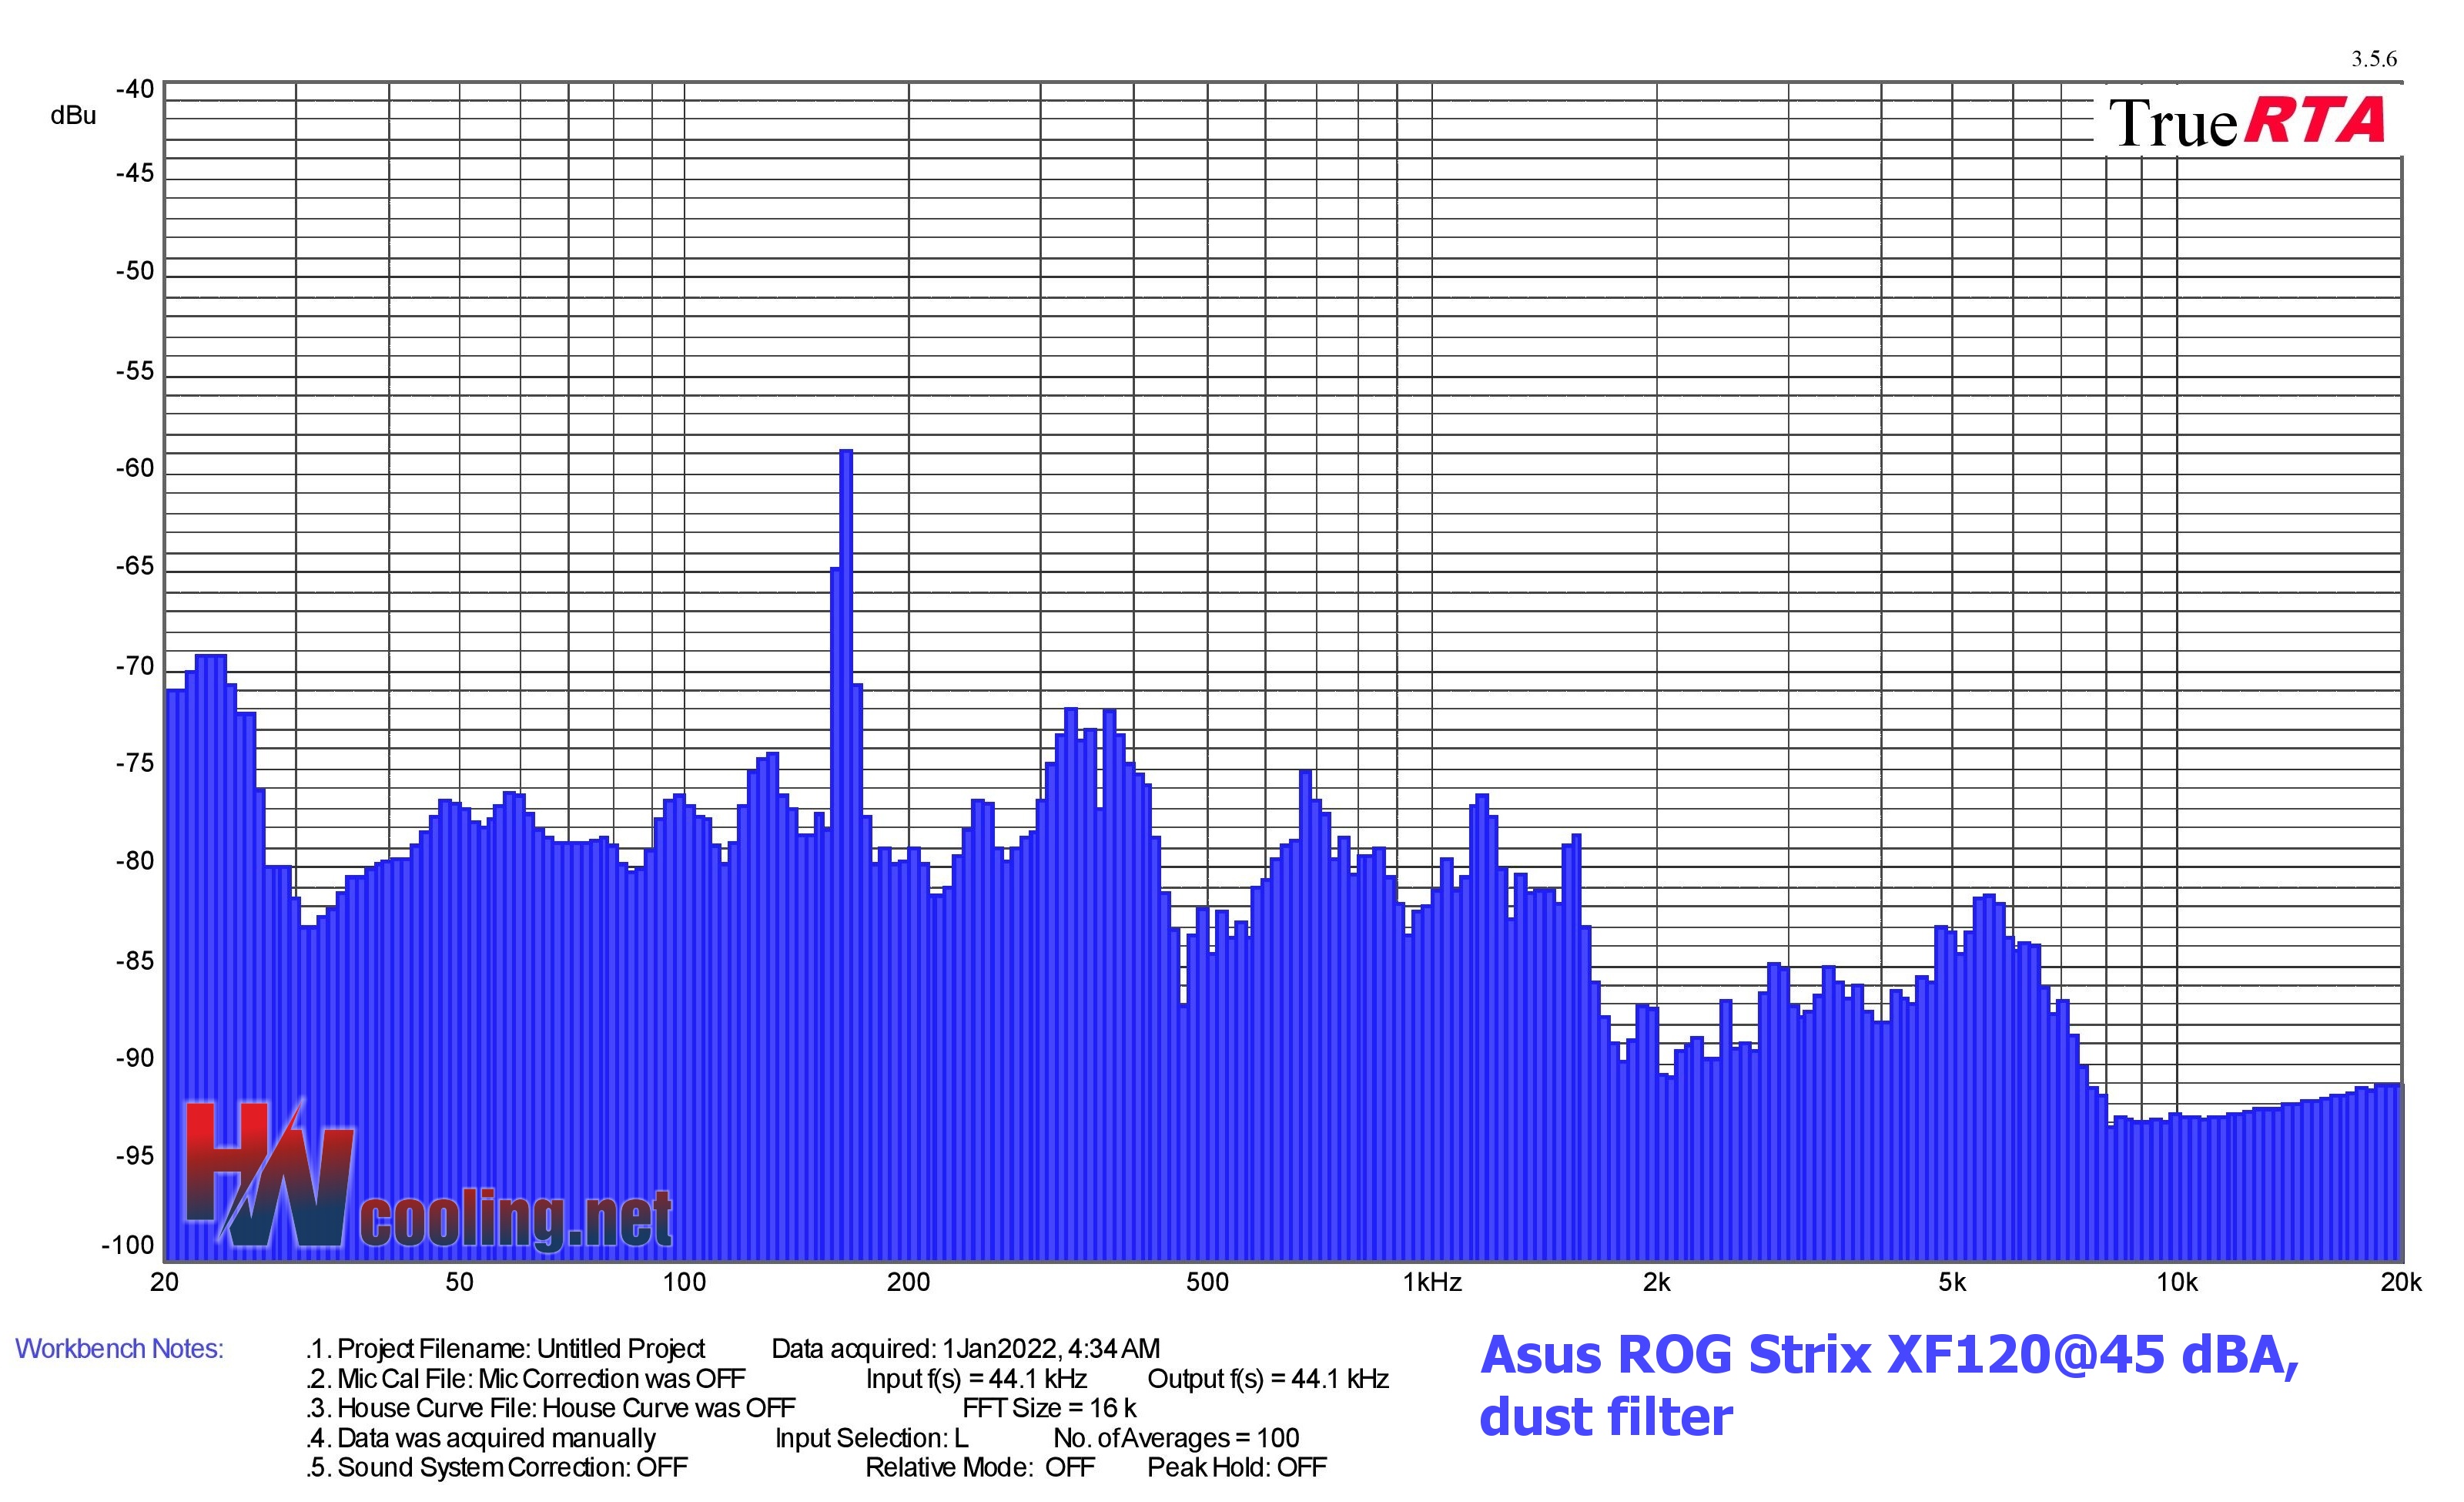
Results: Frequency response of sound with a dust filter
Measurements are performed in the TrueRTA application, which records sound in a range of 240 frequencies in the recorded range of 20–20,000 Hz. For the possibility of comparison across articles, we export the dominant frequency from the low (20–200 Hz), medium (201–2,000 Hz) and high (2,001–20,000 Hz) range to standard bar graphs.
However, for an even more detailed analysis of the sound expression, it is important to perceive the overall shape of the graph and the intensity of all frequencies/tones. If you don’t understand something in the graphs or tables below, you’ll find the answers to all your questions in this article. It explains how to read the measured data below correctly.

| Fan | Dominant sound freq. and noise level, dust filter@33 dBA | NF-F12 PWM | NF-A15 PWM | ||||
| Low range | Mid range | High range | |||||
| Frequency [Hz] | Noise level [dBu] | Frequency [Hz] | Noise level [dBu] | Frequency [Hz] | Noise level [dBu] | ||
| Asus ROG Strix XF120 | 95,1 | -74,3 | 380,5 | -85,8 | 19330,5 | -91,0 | |
| Akasa Vegas X7 | 116,5 | -77,5 | 369,7 | -85,6 | 19330,5 | -90,7 | |
| Reeven Coldwing 12 | 123,4 | -76,8 | 1566,8 | -92,1 | 19330,5 | -90,7 | |
| Reeven Kiran | 130,7 | -72,9 | 239,7 | -86,9 | 19330,5 | -90,8 | |
| SilentiumPC Sigma Pro 120 PWM | N/A | N/A | N/A | N/A | N/A | N/A | |
| SilentiumPC Sigma Pro Corona RGB 120 | 103,7 | -79,2 | 369,7 | -83,6 | 19330,5 | -90,9 | |
| SilverStone SST-AP121 | 50,4 | -81,8 | 155,4 | -78,6 | 18780,2 | -91,0 | |
| SilverStone SST-FQ121 | 41,8 | -75,8 | 329,4 | -82,7 | 19330,5 | -91,0 | |
| Xigmatek XLF-F1256 | 47,6 | -74,2 | 232,9 | -78,7 | 19897,0 | -91,2 |
| Fan | Dominant sound freq. and noise level, dust filter@39 dBA | NF-F12 PWM | NF-A15 PWM | ||||
| Low range | Mid range | High range | |||||
| Frequency [Hz] | Noise level [dBu] | Frequency [Hz] | Noise level [dBu] | Frequency [Hz] | Noise level [dBu] | ||
| Asus ROG Strix XF120 | Asus ROG Strix XF120 | 130,7 | -63,8 | 329,4 | -76,4 | 4832,6 | -90,4 |
| Akasa Vegas X7 | 151,0 | -69,1 | 369,7 | -77,7 | 19330,5 | -90,8 | |
| Reeven Coldwing 12 | 155,4 | -66,4 | 369,7 | -77,8 | 18780,2 | -90,9 | |
| Reeven Kiran | 169,5 | -67,8 | 369,7 | -78,0 | 17726,2 | -90,2 | |
| SilentiumPC Sigma Pro 120 PWM | 123,4 | -68,6 | 369,7 | -75,2 | 2873,5 | -86,7 | |
| SilentiumPC Sigma Pro Corona RGB 120 | 138,5 | -68,1 | 391,7 | -78,0 | 2487,1 | -88,9 | |
| SilverStone SST-AP121 | 151,0 | -78,6 | 339,0 | -74,3 | 19897,0 | -90,9 | |
| SilverStone SST-FQ121 | 142,5 | -69,8 | 1173,8 | -74,9 | 2031,9 | -90,2 | |
| Xigmatek XLF-F1256 | 113,1 | -71,2 | 369,7 | -74,8 | 18780,2 | -91,0 |
| Fan | Dominant sound freq. and noise level, dust filter@45 dBA | NF-F12 PWM | NF-A15 PWM | ||||
| Low range | Mid range | High range | |||||
| Frequency [Hz] | Noise level [dBu] | Frequency [Hz] | Noise level [-dBu] | Frequency [Hz] | Noise level [dBu] | ||
| Asus ROG Strix XF120 | Asus ROG Strix XF120 | 23,1 | -62,9 | 369,7 | -71,7 | 5583,4 | -81,4 |
| Akasa Vegas X7 | N/A | N/A | N/A | N/A | N/A | N/A | |
| Reeven Coldwing 12 | 190,3 | -62,7 | 369,7 | -71,9 | 2347,5 | -86,1 | |
| Reeven Kiran | 169,5 | -67,8 | 369,7 | -78,0 | 17726,2 | -90,2 | |
| SilentiumPC Sigma Pro 120 PWM | 20,3 | -64,4 | 246,8 | -70,1 | 2635,0 | -81,8 | |
| SilentiumPC Sigma Pro Corona RGB 120 | 23,1 | -61,2 | 174,5 | -63,9 | 2487,1 | -84,4 | |
| SilverStone SST-AP121 | 20,3 | -67,9 | 439,7 | -67,9 | 4561,4 | -83,3 | |
| SilverStone SST-FQ121 | 179,6 | -64,9 | 369,7 | -71,2 | 5915,4 | -90,3 | |
| Xigmatek XLF-F1256 | 142,5 | -62,7 | 246,8 | -57,8 | 4974,2 | -83,7 |
The first and still the only Asus fan that is on sale individually may be a good choice. But you can also get burnt. It depends on what you want to use it for. In the right context, it gives attractive results, and the impression of a very decent fan is spoiled mainly by pointless design details or sugar-coating the specs. Anyway, you can see that compared to the more ordinary fans from the last test, the Strix is a bit of a different class.
Results: Frequency response of sound with a hexagonal grille
Measurements are performed in the TrueRTA application, which records sound in a range of 240 frequencies in the recorded range of 20–20,000 Hz. For the possibility of comparison across articles, we export the dominant frequency from the low (20–200 Hz), medium (201–2,000 Hz) and high (2,001–20,000 Hz) range to standard bar graphs.
However, for an even more detailed analysis of the sound expression, it is important to perceive the overall shape of the graph and the intensity of all frequencies/tones. If you don’t understand something in the graphs or tables below, you’ll find the answers to all your questions in this article. It explains how to read the measured data below correctly.
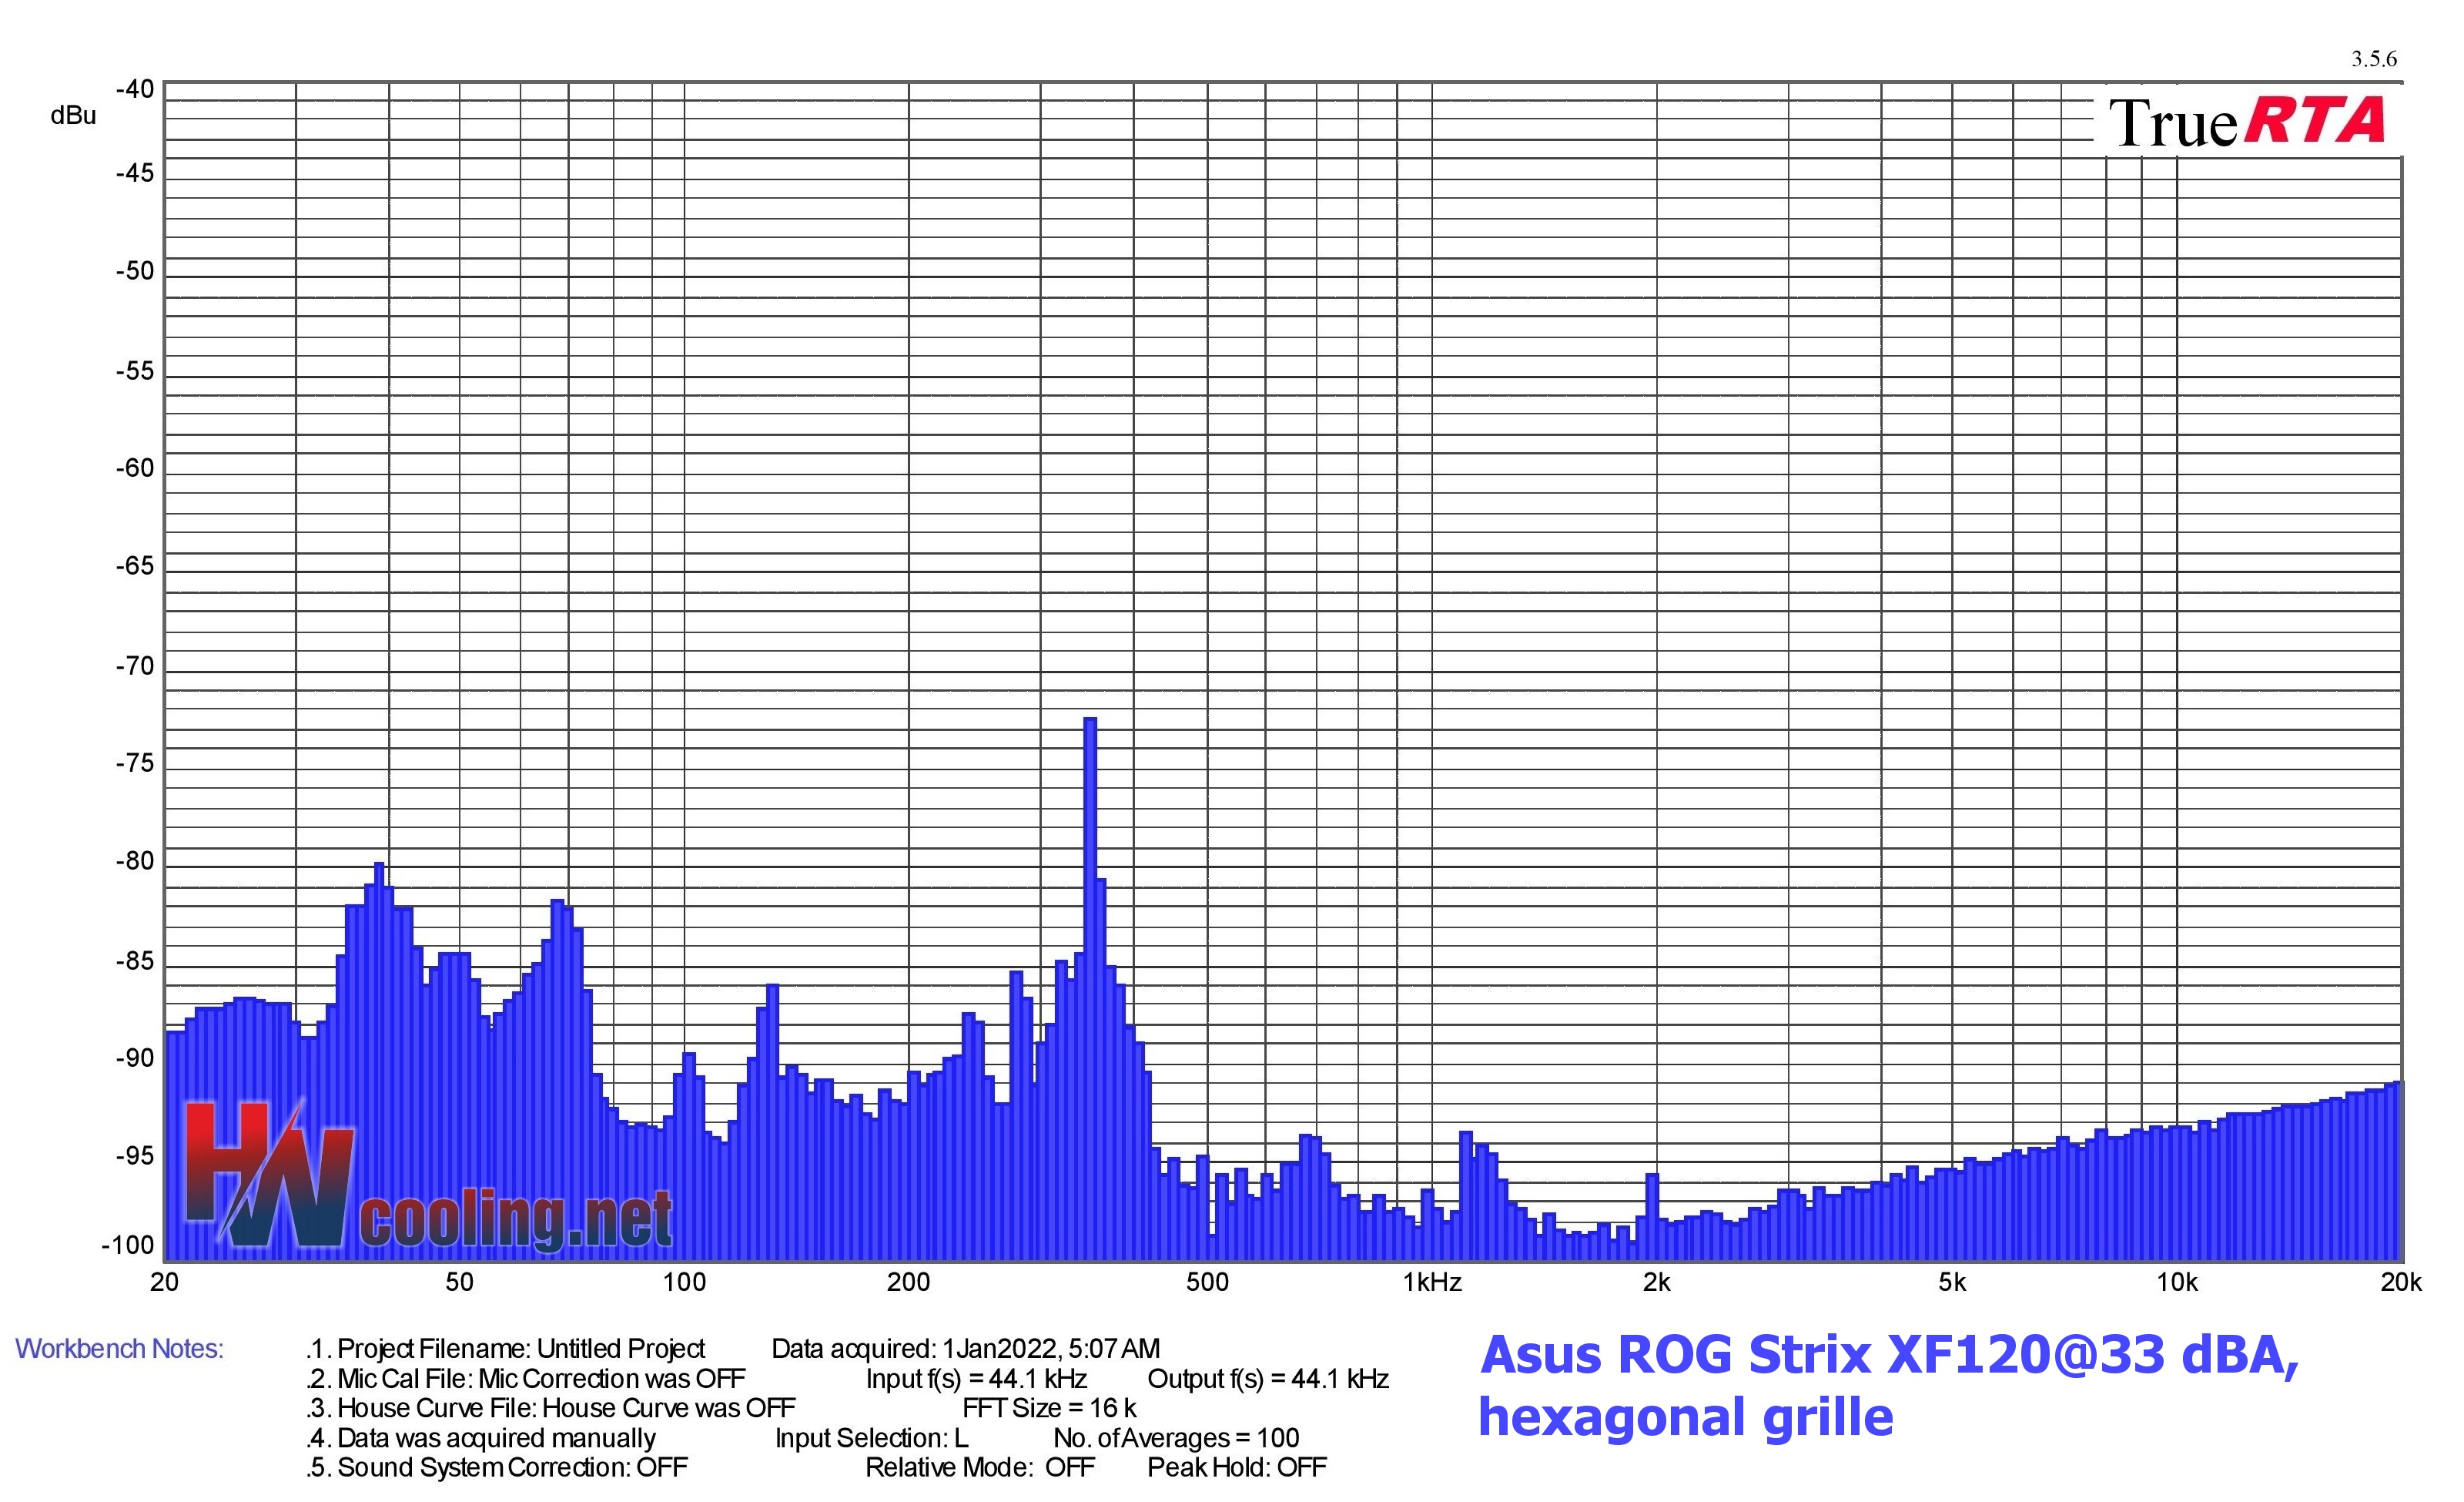
| Fan | Dominant sound freq. and noise level, hexagonal grille@33 dBA | NF-F12 PWM | NF-A15 PWM | ||||
| Low range | Mid range | High range | |||||
| Frequency [Hz] | Noise level [dBu] | Frequency [Hz] | Noise level [dBu] | Frequency [Hz] | Noise level [dBu] | ||
| Asus ROG Strix XF120 | 38,9 | -79,7 | 349,0 | -72,4 | 19897,0 | -90,9 | |
| Akasa Vegas X7 | 100,8 | -85,3 | 359,2 | -80,3 | 19330,5 | -90,9 | |
| Reeven Coldwing 12 | 92,4 | -79,8 | 369,7 | -79,7 | 19897,0 | -90,9 | |
| Reeven Kiran | 97,9 | -84,4 | 391,7 | -77,8 | 19897,0 | -90,8 | |
| SilentiumPC Sigma Pro 120 PWM | N/A | N/A | N/A | N/A | N/A | N/A | |
| SilentiumPC Sigma Pro Corona RGB 120 | 92,4 | -83,0 | 369,7 | -77,9 | 18780,2 | -90,8 | |
| SilverStone SST-AP121 | 113,1 | -80,9 | 246,8 | -84,0 | 19330,5 | -90,9 | |
| SilverStone SST-FQ121 | 38,9 | -76,9 | 1522,2 | -81,7 | 18780,2 | -90,9 | |
| Xigmatek XLF-F1256 | 63,5 | -83,3 | 380,5 | -78,8 | 19897,0 | -90,9 |
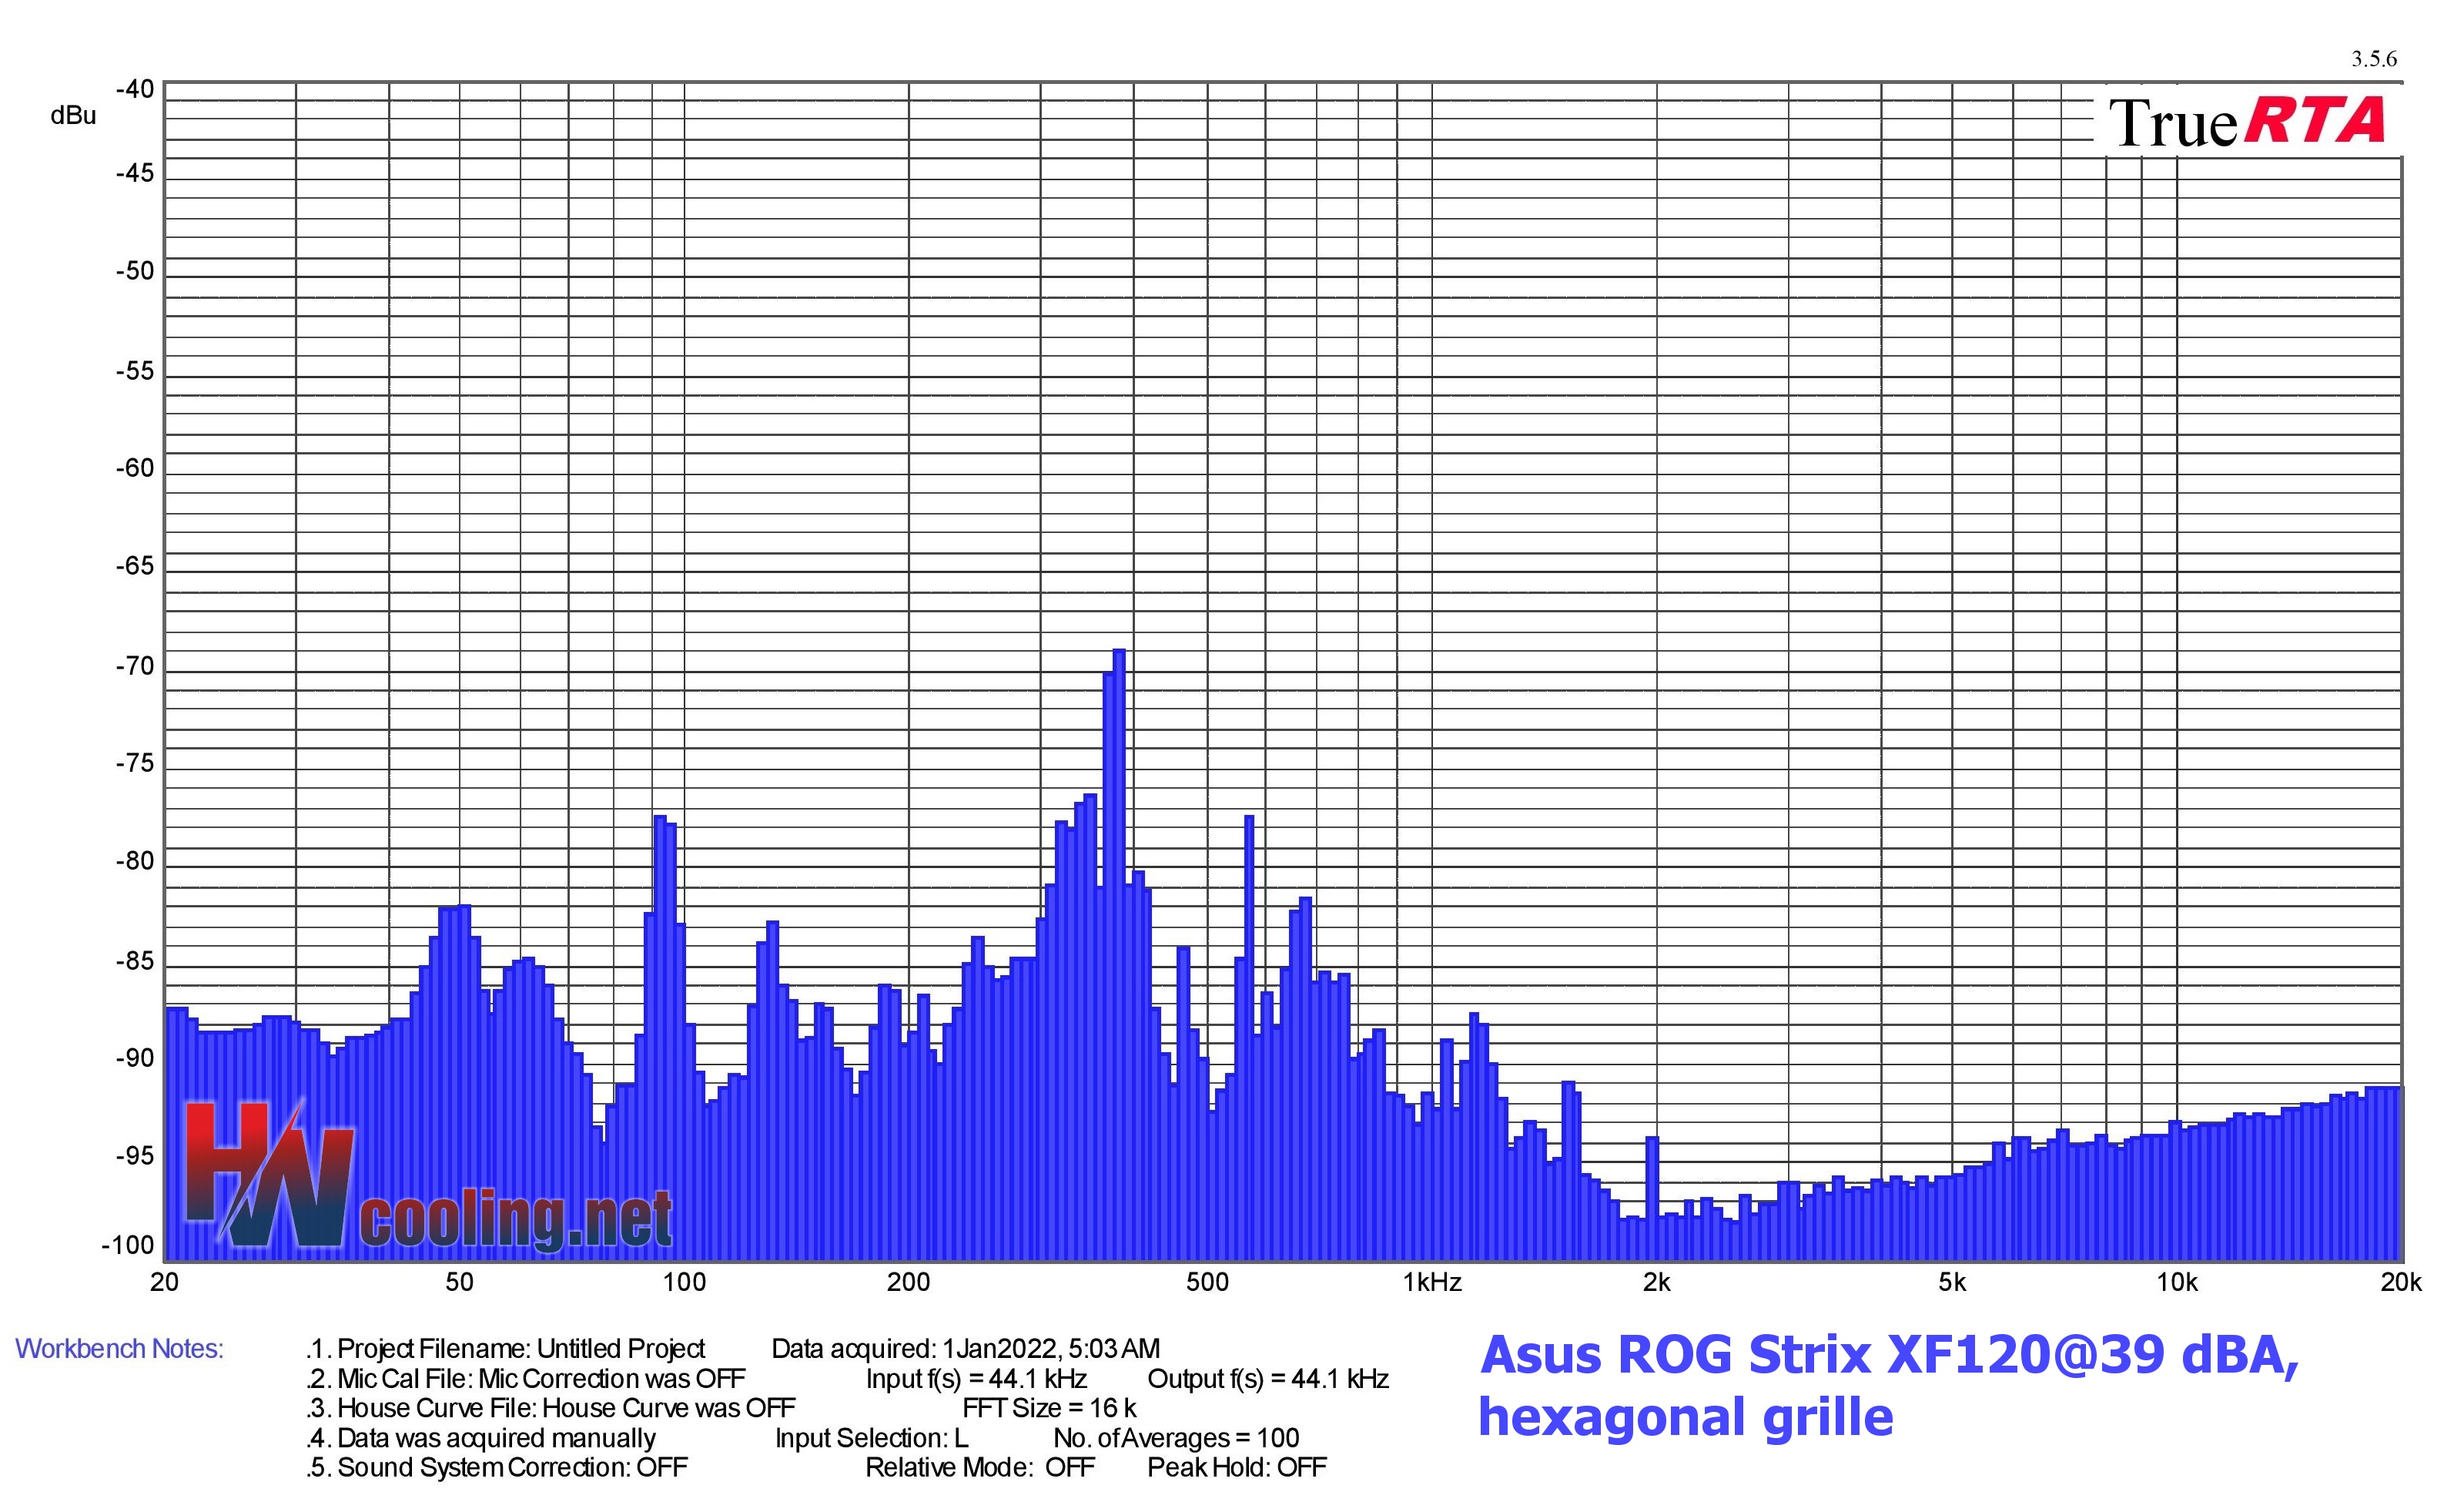
| Fan | Dominant sound freq. and noise level, hexagonal grille@39 dBA | NF-F12 PWM | NF-A15 PWM | ||||
| Low range | Mid range | High range | |||||
| Frequency [Hz] | Noise level [dBu] | Frequency [Hz] | Noise level [dBu] | Frequency [Hz] | Noise level [dBu] | ||
| Asus ROG Strix XF120 | Asus ROG Strix XF120 | 92,4 | -77,5 | 369,7 | -70,1 | 19330,5 | -91,2 |
| Akasa Vegas X7 | 31,3 | -84,3 | 369,7 | -74,3 | 18780,2 | -90,8 | |
| Reeven Coldwing 12 | 123,4 | -71,2 | 380,5 | -71,3 | 18780,2 | -90,9 | |
| Reeven Kiran | 127,0 | -77,7 | 380,5 | -73,4 | 19330,5 | -90,8 | |
| SilentiumPC Sigma Pro 120 PWM | 63,5 | -83,4 | 380,5 | -74,0 | 2347,5 | -83,8 | |
| SilentiumPC Sigma Pro Corona RGB 120 | 134,5 | -72,0 | 369,7 | -75,1 | 19897,0 | -90,8 | |
| SilverStone SST-AP121 | 53,4 | -81,9 | 380,5 | -70,8 | 19330,5 | -91,0 | |
| SilverStone SST-FQ121 | 41,8 | -78,9 | 369,7 | -75,0 | 19330,5 | -91,1 | |
| Xigmatek XLF-F1256 | 50,4 | -70,3 | 246,8 | -72,7 | 19897,0 | -90,9 |

| Fan | Dominant sound freq. and noise level, hexagonal grille@45 dBA | NF-F12 PWM | NF-A15 PWM | ||||
| Low range | Mid range | High range | |||||
| Frequency [Hz] | Noise level [dBu] | Frequency [Hz] | Noise level [dBu] | Frequency [Hz] | Noise level [dBu] | ||
| Asus ROG Strix XF120 | Asus ROG Strix XF120 | 119,9 | -73,4 | 604,1 | -69,6 | -64,385 | -90,9 |
| Akasa Vegas X7 | 33,6 | -81,5 | 427,1 | -70,2 | 18780,2 | -90,9 | |
| Reeven Coldwing 12 | 160,0 | -64,7 | 369,7 | -67,7 | 19897,0 | -91,0 | |
| Reeven Kiran | 155,4 | -73,7 | 369,7 | -69,7 | 19330,5 | -90,8 | |
| SilentiumPC Sigma Pro 120 PWM | 130,7 | -77,8 | 369,7 | -68,1 | 4431,5 | -90,1 | |
| SilentiumPC Sigma Pro Corona RGB 120 | 20,3 | -64,8 | 369,7 | -73,0 | 3044,4 | -89,2 | |
| SilverStone SST-AP121 | 130,7 | -78,0 | 570,2 | -64,9 | 18780,2 | -91,2 | |
| SilverStone SST-FQ121 | 169,5 | -64,4 | 246,8 | -77,4 | 19330,5 | -91,0 | |
| Xigmatek XLF-F1256 | 58,2 | -74,2 | 678,0 | -63,8 | 19330,5 | -90,9 |
The first and still the only Asus fan that is on sale individually may be a good choice. But you can also get burnt. It depends on what you want to use it for. In the right context, it gives attractive results, and the impression of a very decent fan is spoiled mainly by pointless design details or sugar-coating the specs. Anyway, you can see that compared to the more ordinary fans from the last test, the Strix is a bit of a different class.
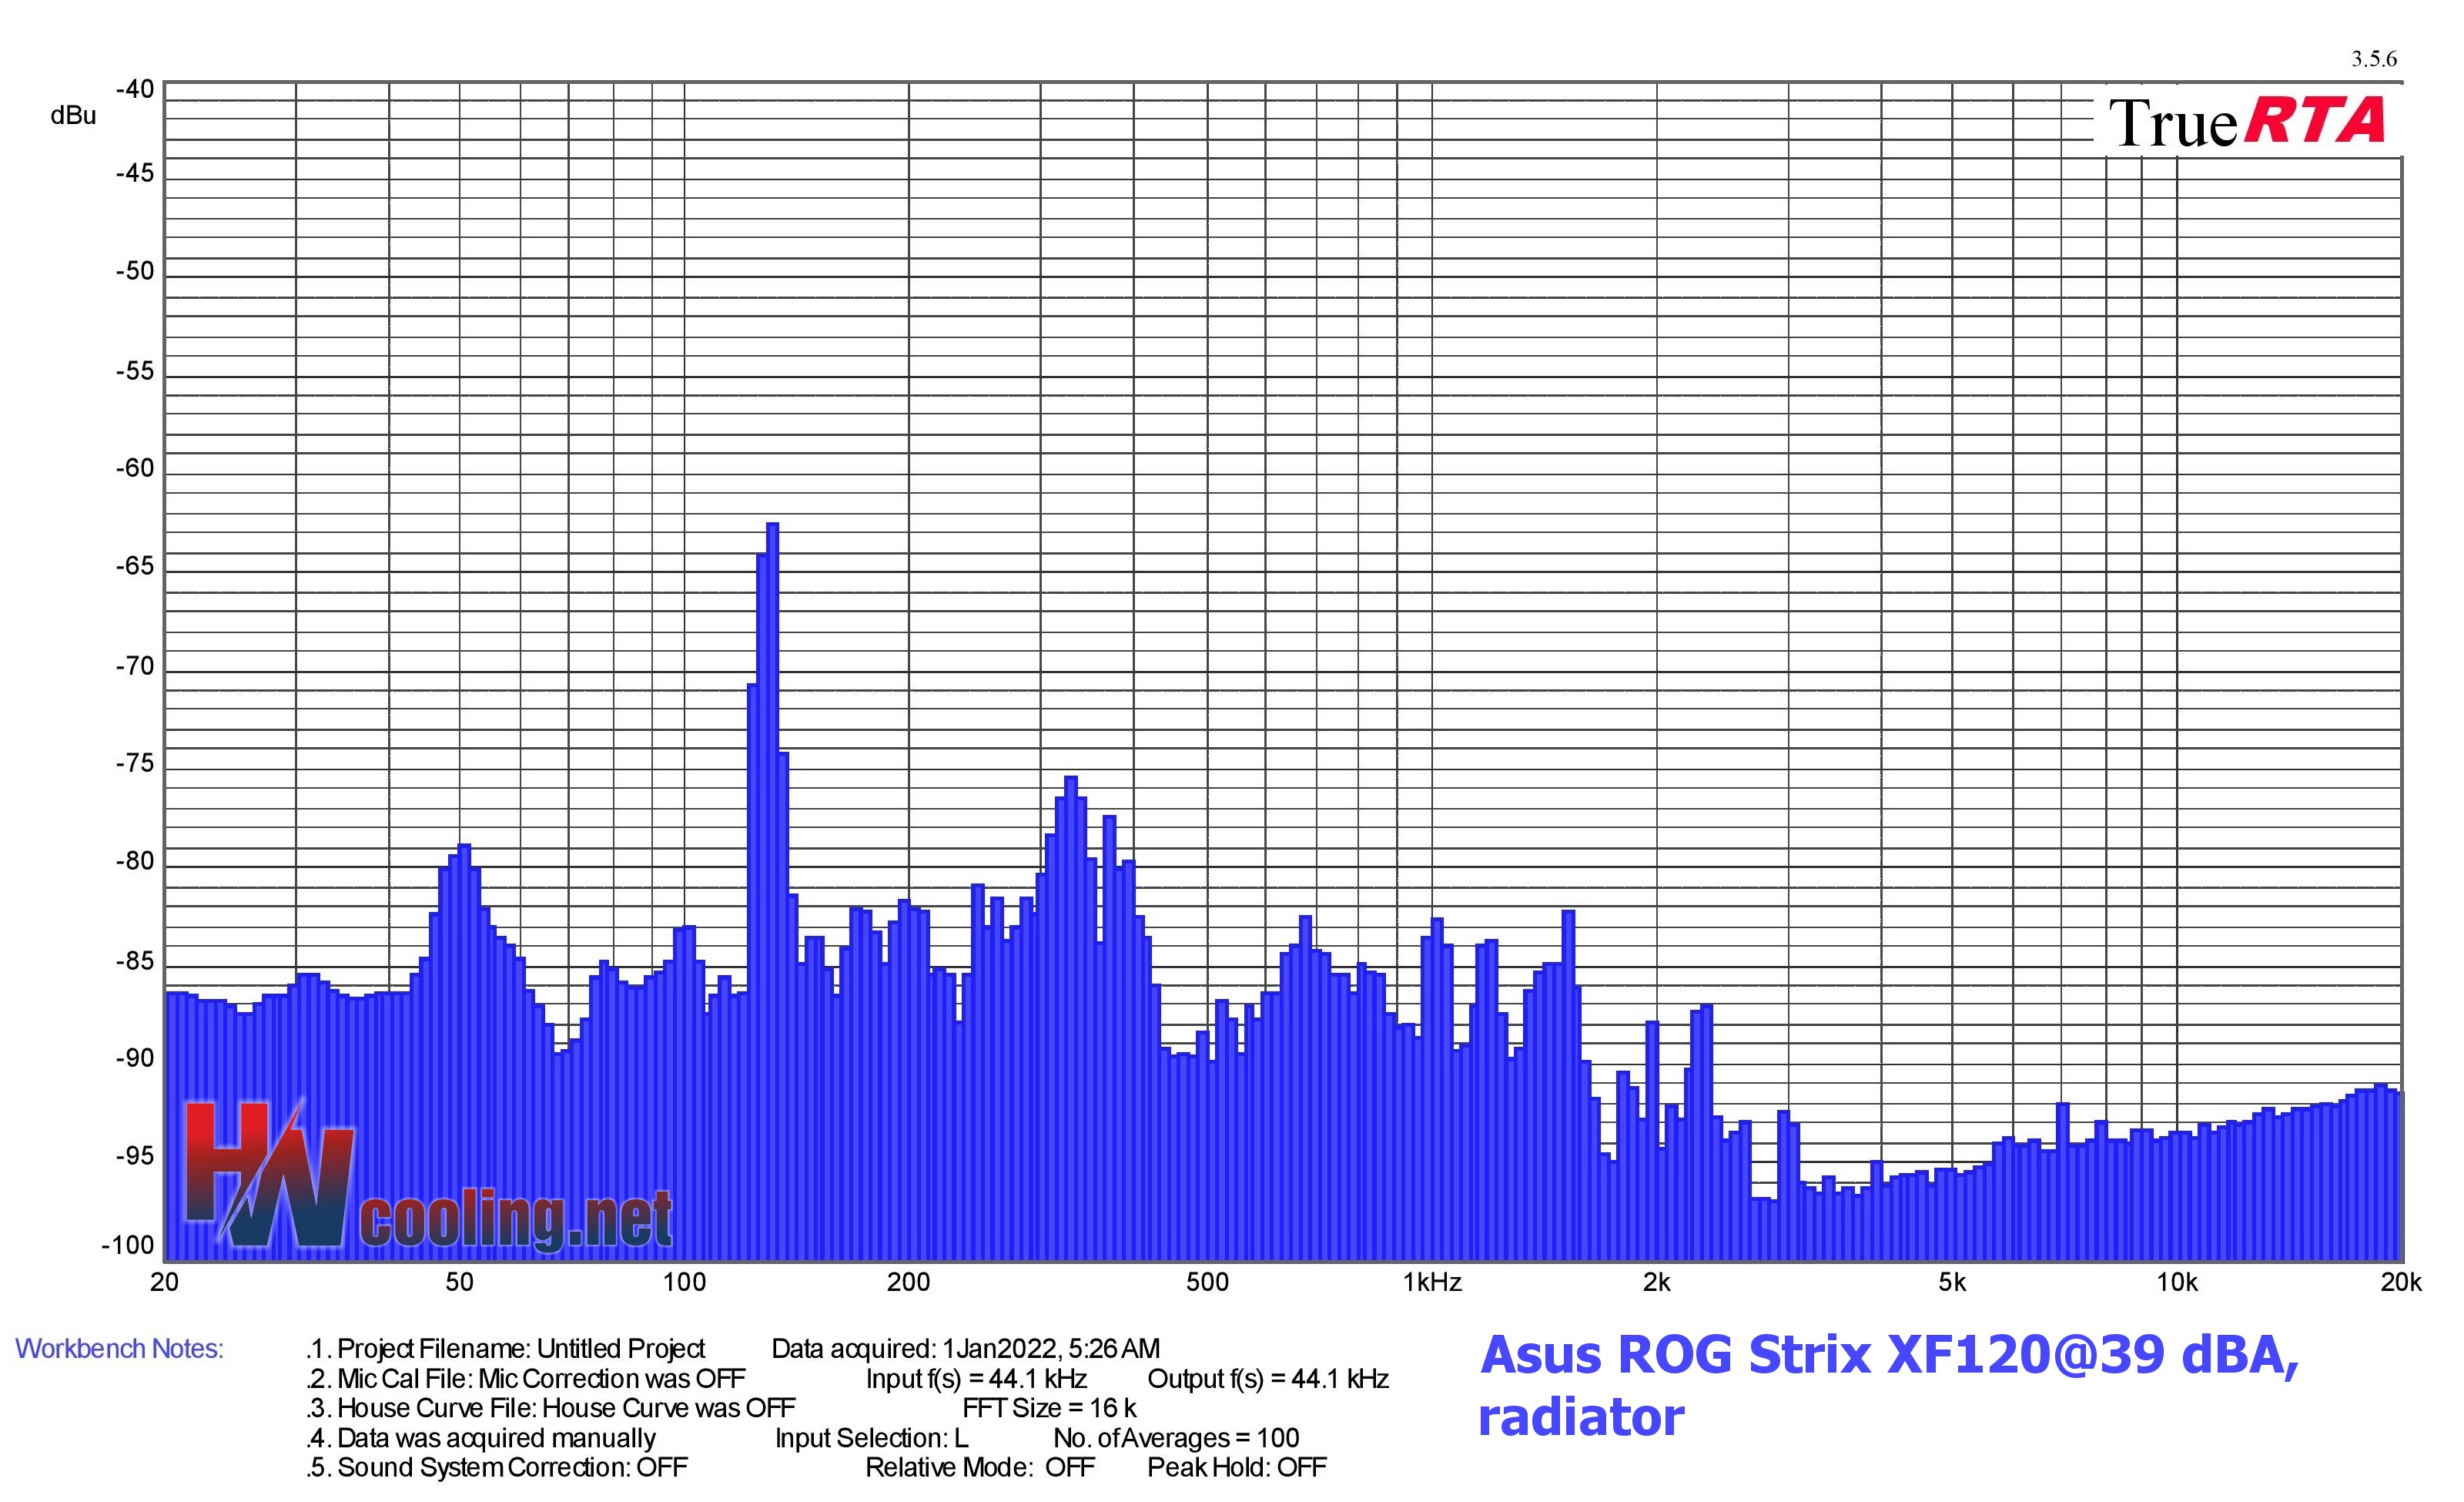
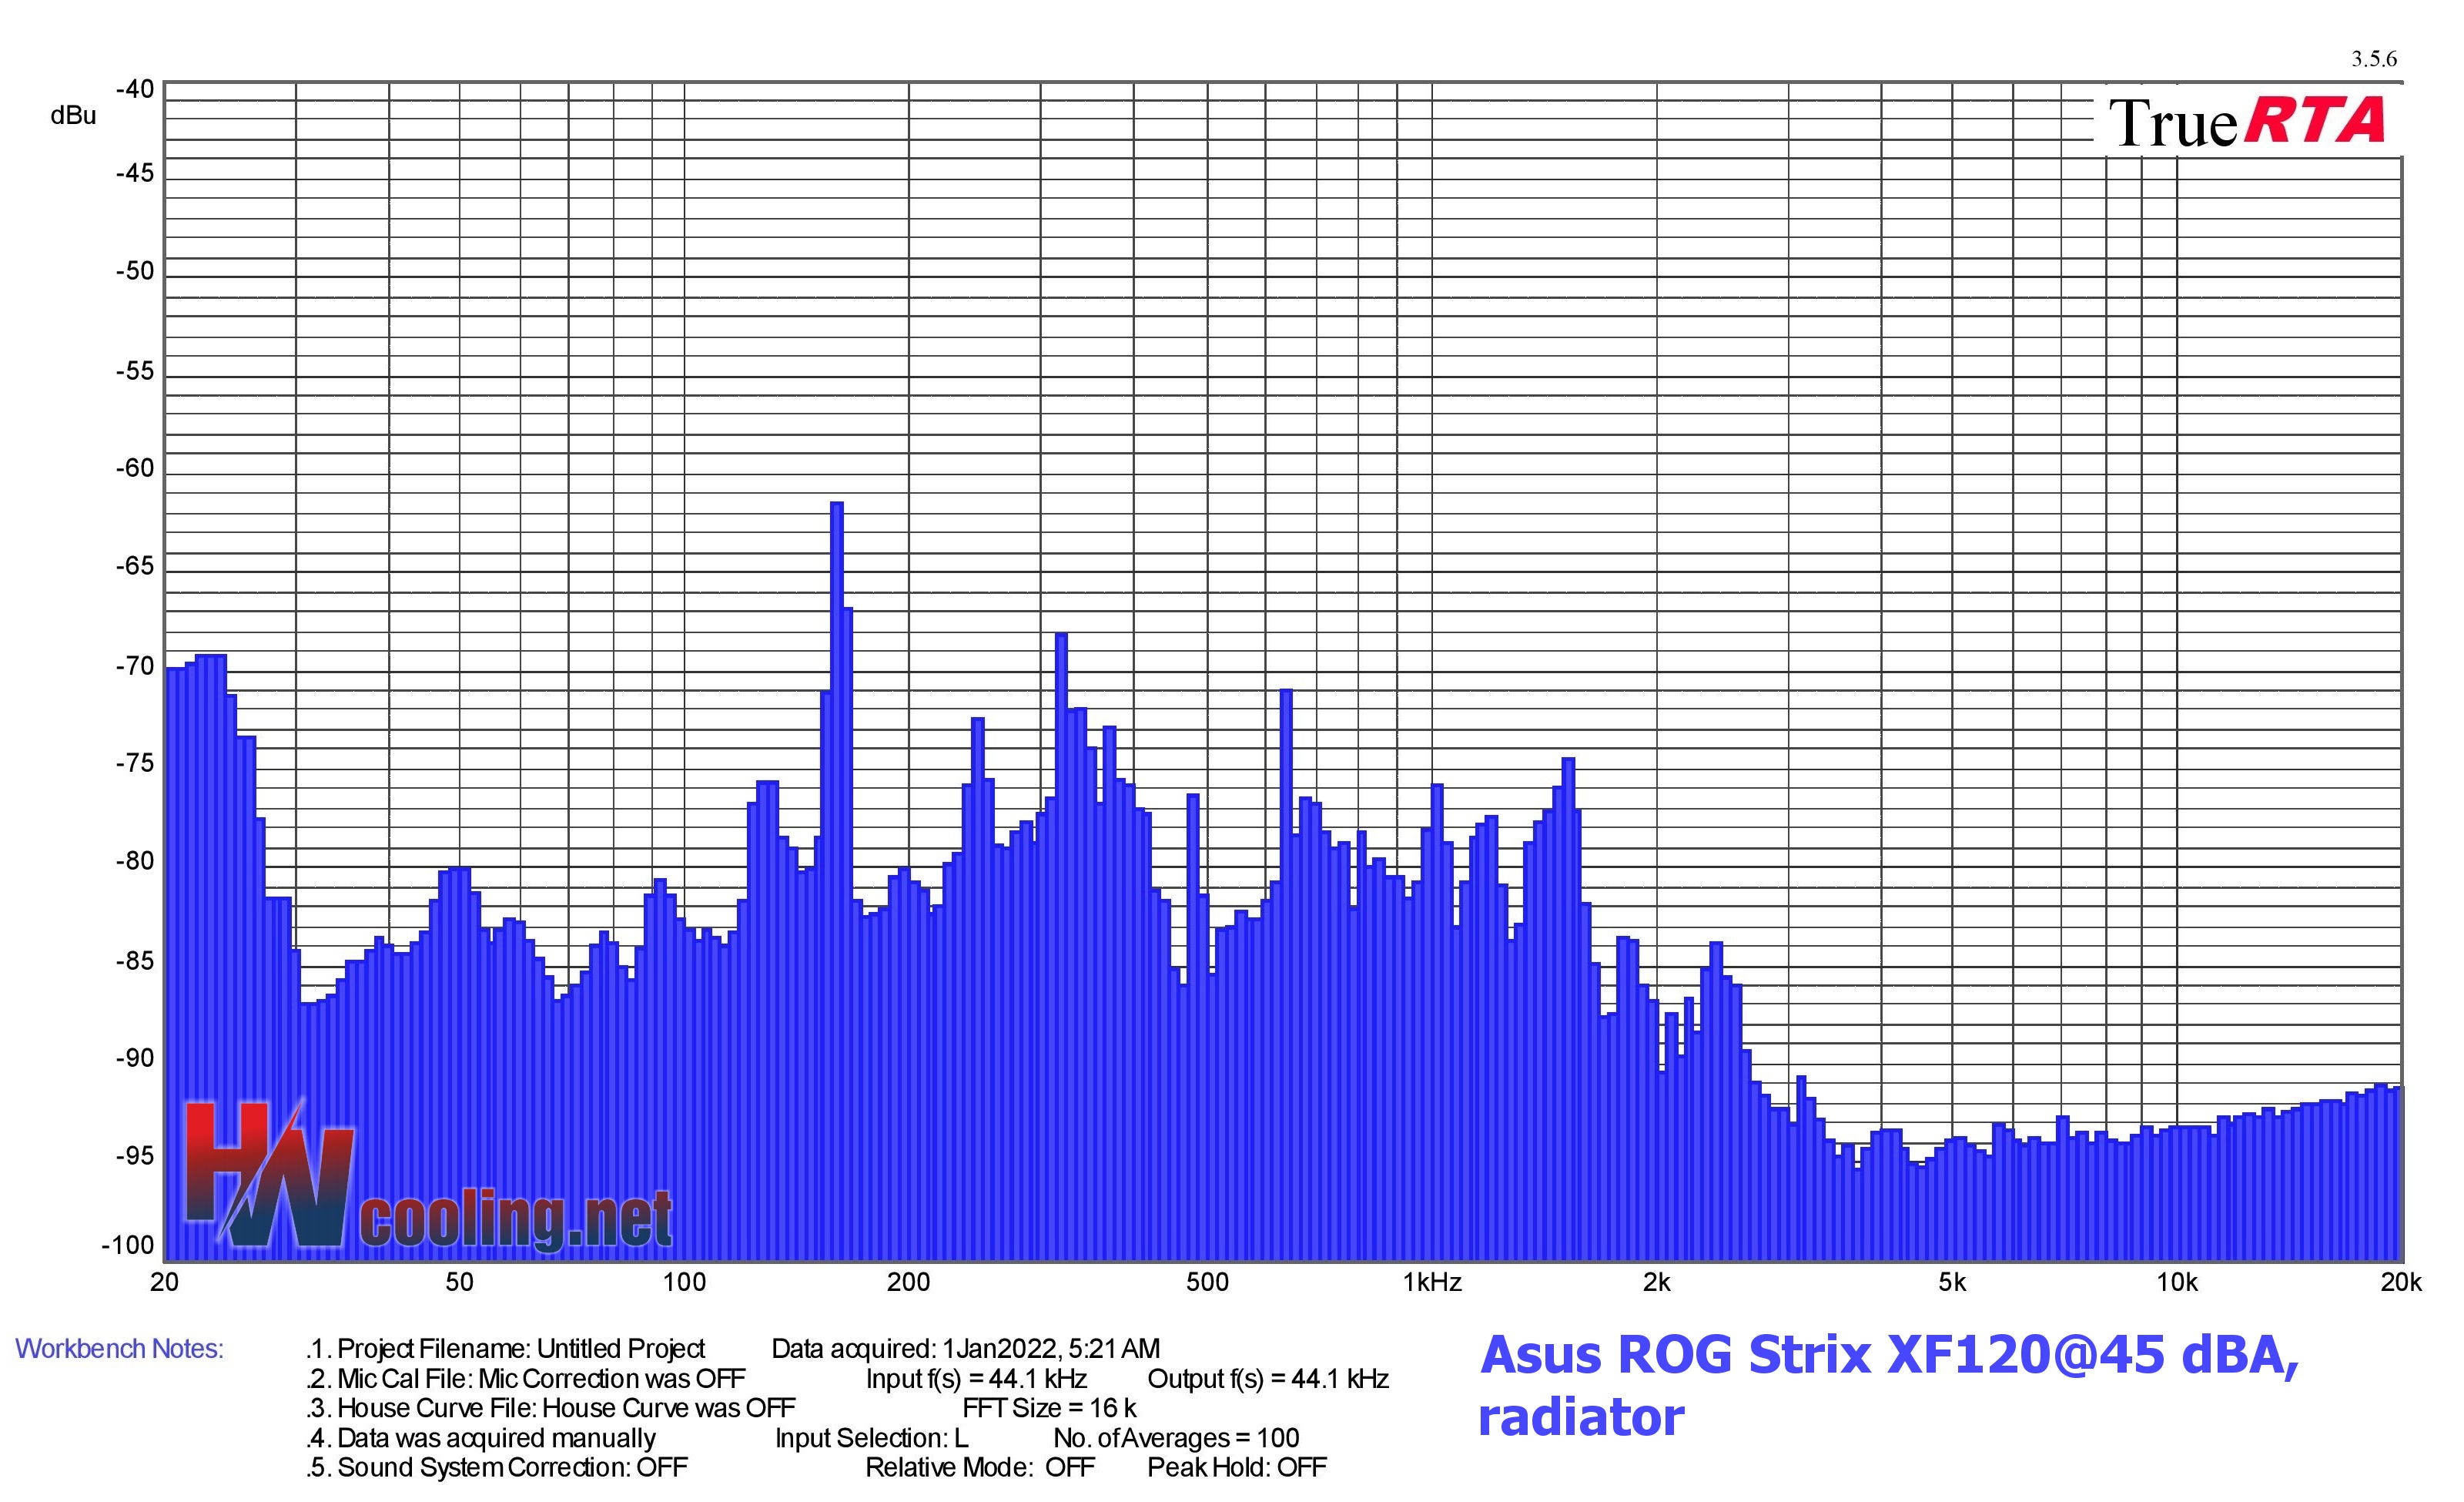
Results: Frequency response of sound with a radiator
Measurements are performed in the TrueRTA application, which records sound in a range of 240 frequencies in the recorded range of 20–20,000 Hz. For the possibility of comparison across articles, we export the dominant frequency from the low (20–200 Hz), medium (201–2,000 Hz) and high (2,001–20,000 Hz) range to standard bar graphs.
However, for an even more detailed analysis of the sound expression, it is important to perceive the overall shape of the graph and the intensity of all frequencies/tones. If you don’t understand something in the graphs or tables below, you’ll find the answers to all your questions in this article. It explains how to read the measured data below correctly.
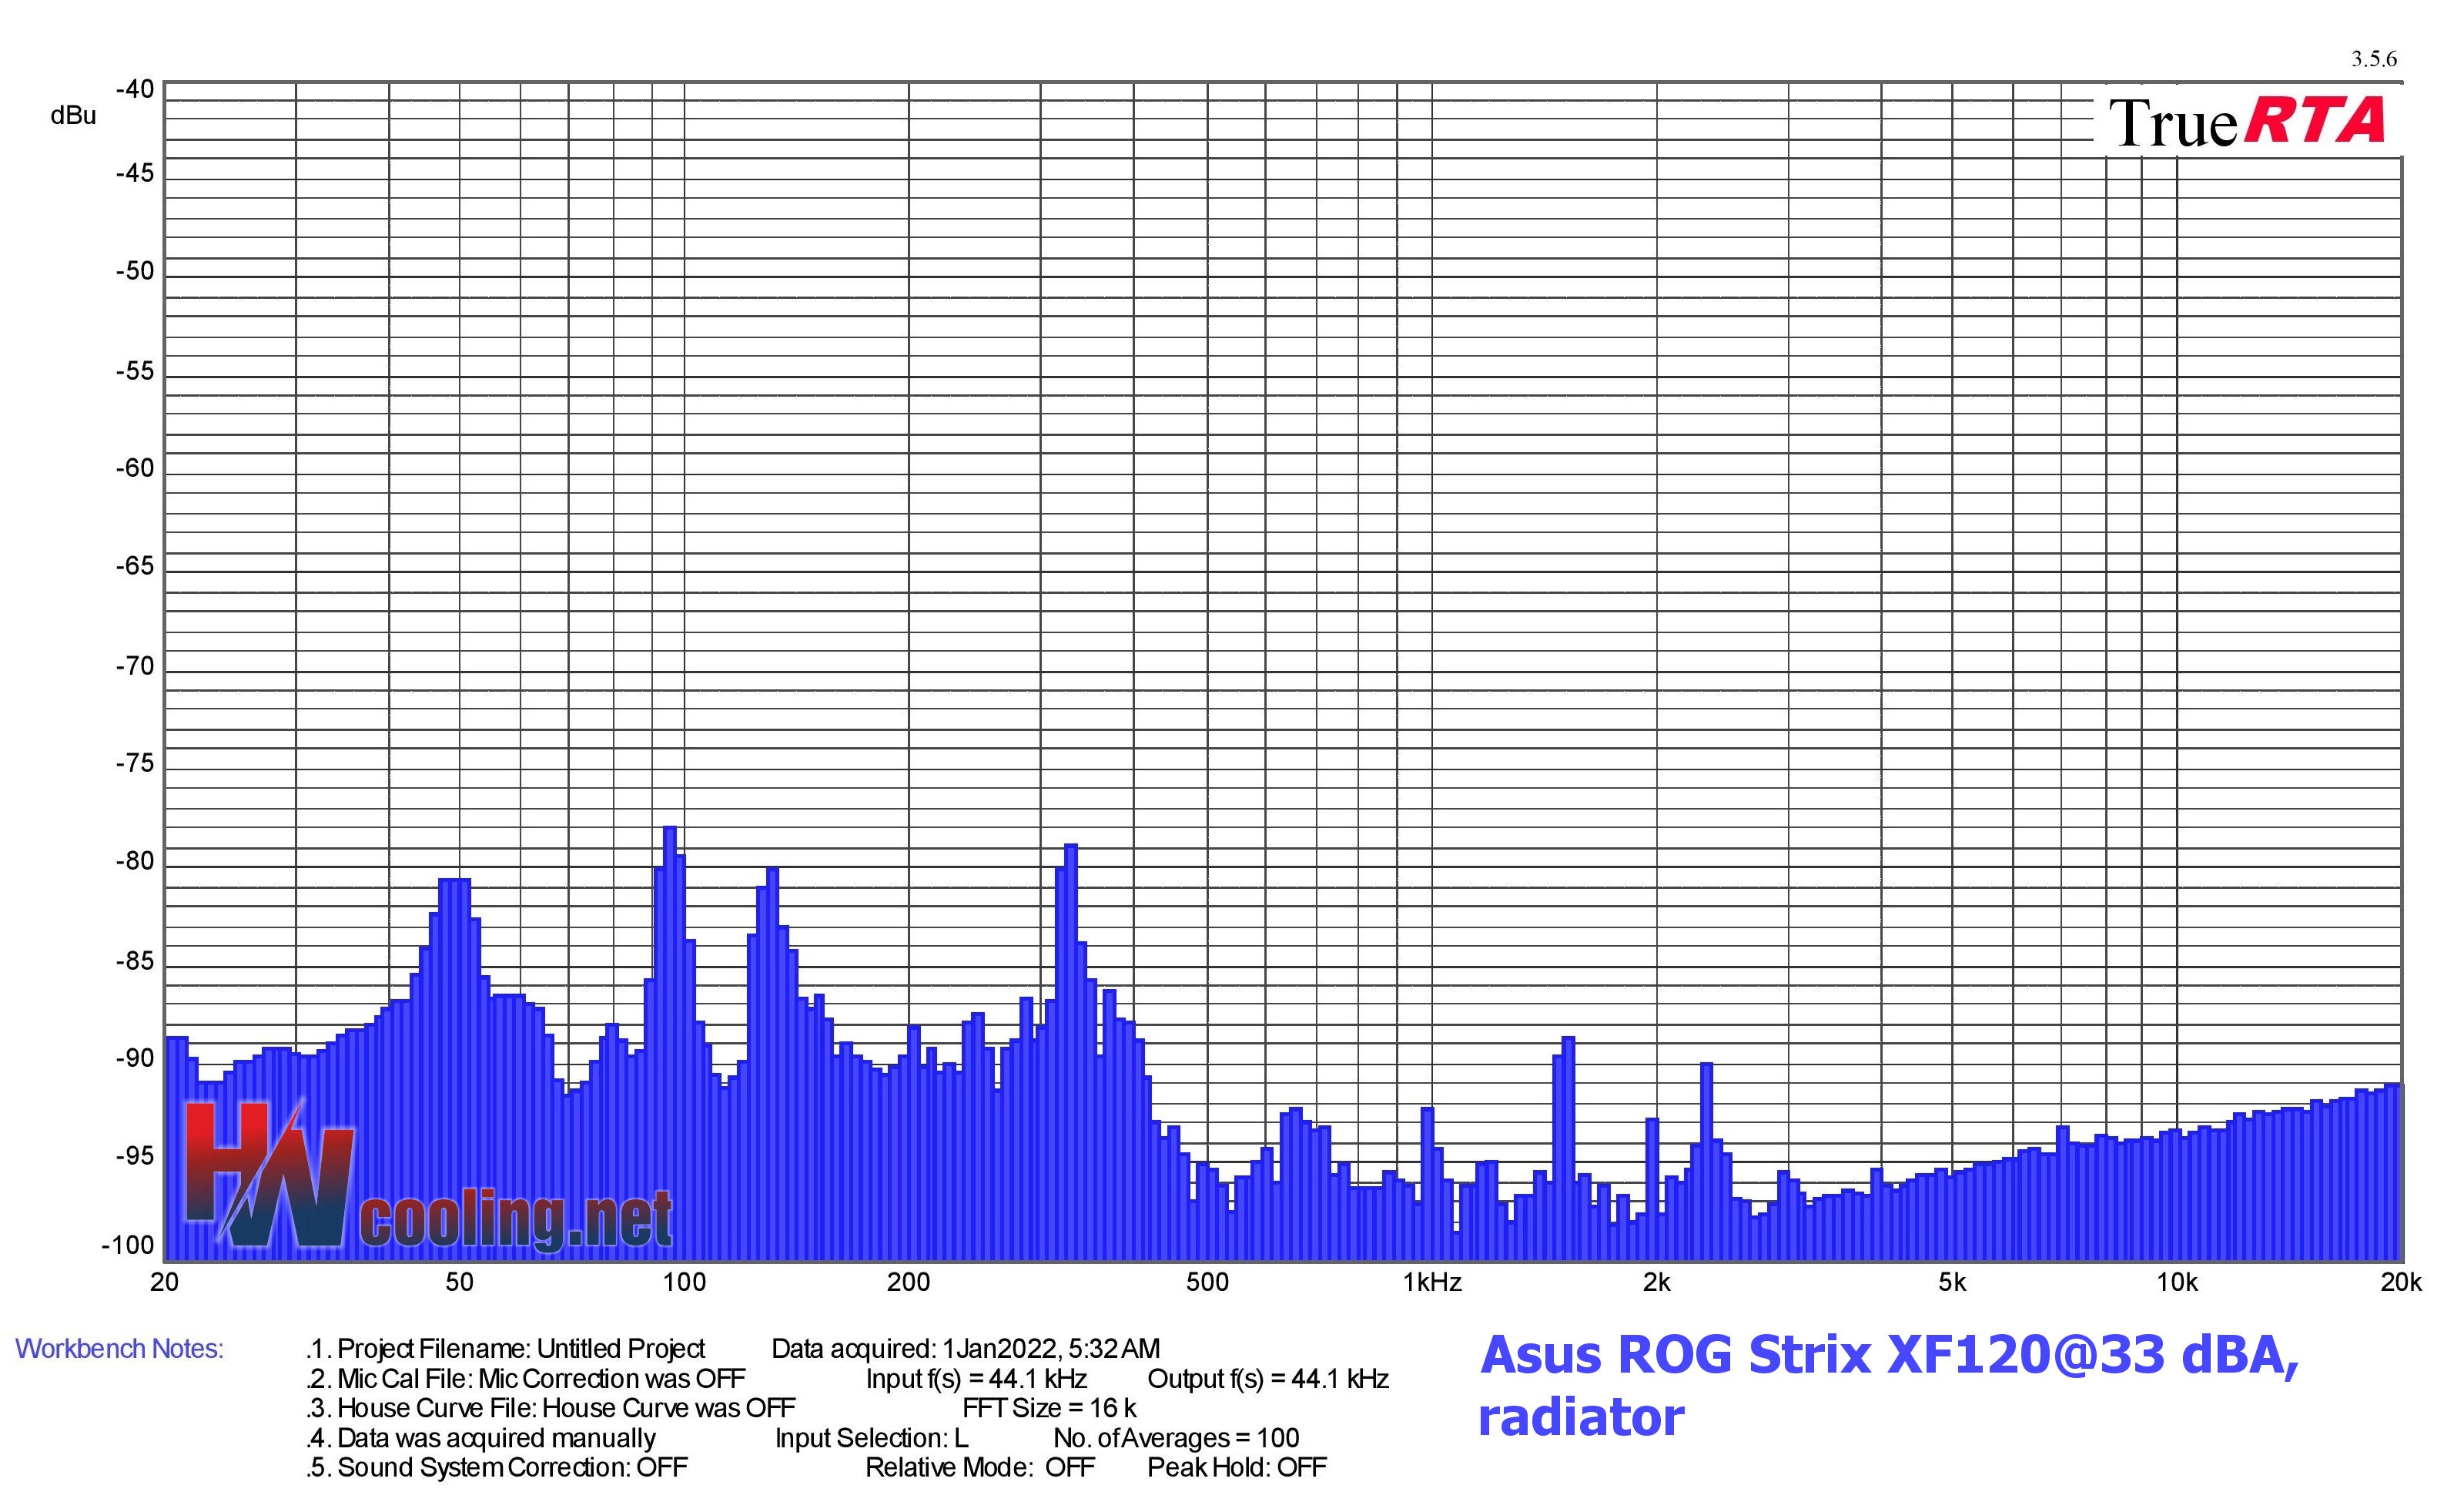
| Fan | Dominant sound freq. and noise level, thinner rad@33 dBA | NF-F12 PWM | NF-A15 PWM | ||||
| Low range | Mid range | High range | |||||
| Frequency [Hz] | Noise level [dBu] | Frequency [Hz] | Noise level [dBu] | Frequency [Hz] | Noise level [dBu] | ||
| Asus ROG Strix XF120 | Asus ROG Strix XF120 | 95,1 | -77,9 | 329,4 | -78,9 | 2347,5 | -90,0 |
| Akasa Vegas X7 | 119,7 | -79,9 | 339,0 | -83,0 | 19330,5 | -90,8 | |
| Reeven Coldwing 12 | 127,0 | -78,2 | 339,0 | -84,8 | 19897,0 | -90,9 | |
| Reeven Kiran | 127,0 | -81,4 | 339,0 | -84,4 | 19897,0 | -90,8 | |
| SilentiumPC Sigma Pro 120 PWM | N/A | N/A | N/A | N/A | N/A | N/A | |
| SilentiumPC Sigma Pro Corona RGB 120 | 130,7 | -77,0 | 339,0 | -84,9 | 18780,2 | -90,9 | |
| SilverStone SST-AP121 | 50,4 | -79,9 | 329,4 | -81,4 | 19330,5 | -90,9 | |
| SilverStone SST-FQ121 | 80,0 | -81,8 | 329,4 | -83,1 | 18780,2 | -91,0 | |
| Xigmatek XLF-F1256 | 36,2 | -66,0 | 783,4 | -80,6 | 19897,9 | -90,9 |
| Fan | Dominant sound freq. and noise level, thinner rad@39 dBA | NF-F12 PWM | NF-A15 PWM | ||||
| Low range | Mid range | High range | |||||
| Frequency [Hz] | Noise level [dBu] | Frequency [Hz] | Noise level [dBu] | Frequency [Hz] | Noise level [dBu] | ||
| Asus ROG Strix XF120 | Asus ROG Strix XF120 | 130,7 | -62,5 | 329,4 | -87,8 | 18780,2 | -91,1 |
| Akasa Vegas X7 | 155,4 | -75,8 | 339,0 | -76,5 | 19330,5 | -90,7 | |
| Reeven Coldwing 12 | 160,0 | -71,4 | 339,0 | -77,9 | 19897,0 | -90,9 | |
| Reeven Kiran | 58,2 | -81,9 | 329,4 | -73,1 | 19330,5 | -90,8 | |
| SilentiumPC Sigma Pro 120 PWM | 127,0 | -72,9 | 339,0 | -78,0 | 2487,1 | -76,5 | |
| SilentiumPC Sigma Pro Corona RGB 120 | 134,5 | -68,8 | 538,2 | -80,3 | 2635,0 | -87,1 | |
| SilverStone SST-AP121 | 123,4 | -69,2 | 854,3 | -77,3 | 18780,2 | -91,1 | |
| SilverStone SST-FQ121 | 146,7 | -71,3 | 1522,2 | -79,6 | 19330,5 | -90,9 | |
| Xigmatek XLF-F1256 | 58,2 | -76,1 | 739,4 | -71,9 | 19330,5 | -91,1 |
| Fan | Dominant sound freq. and noise level, thinner rad@45 dBA | NF-F12 PWM | NF-A15 PWM | ||||
| Low range | Mid range | High range | |||||
| Frequency [Hz] | Noise level [dBu] | Frequency [Hz] | Noise level [dBu] | Frequency [Hz] | Noise level [dBu] | ||
| Asus ROG Strix XF120 | 164,7 | -66,8 | 320,0 | -68,2 | 2416,3 | -83,8 | |
| Akasa Vegas X7 | N/A | N/A | N/A | N/A | N/A | N/A | |
| Reeven Coldwing 12 | 195,8 | -69,4 | 391,7 | -71,9 | 2152,7 | -85,6 | |
| Reeven Kiran | 123,4 | -71,7 | 391,7 | -71,2 | 3225,4 | -84,4 | |
| SilentiumPC Sigma Pro 120 PWM | 142,5 | -72,4 | 339,0 | -72,5 | 2152,7 | -76,1 | |
| SilentiumPC Sigma Pro Corona RGB 120 | 23,1 | -59,7 | 329,4 | -69,7 | 2635,0 | -81,1 | |
| SilverStone SST-AP121 | 127,0 | -65,5 | 310,9 | -70,2 | 18780,2 | -90,9 | |
| SilverStone SST-FQ121 | 20,3 | -66,0 | 201,6 | -65,8 | 18780,2 | -90,9 | |
| Xigmatek XLF-F1256 | 130,7 | -64,2 | 739,4 | -64,3 | 3133,6 | -90,8 |
The first and still the only Asus fan that is on sale individually may be a good choice. But you can also get burnt. It depends on what you want to use it for. In the right context, it gives attractive results, and the impression of a very decent fan is spoiled mainly by pointless design details or sugar-coating the specs. Anyway, you can see that compared to the more ordinary fans from the last test, the Strix is a bit of a different class.
Results: Vibration, in total (3D vector length)
The first and still the only Asus fan that is on sale individually may be a good choice. But you can also get burnt. It depends on what you want to use it for. In the right context, it gives attractive results, and the impression of a very decent fan is spoiled mainly by pointless design details or sugar-coating the specs. Anyway, you can see that compared to the more ordinary fans from the last test, the Strix is a bit of a different class.
Results: Vibration, X-axis
The first and still the only Asus fan that is on sale individually may be a good choice. But you can also get burnt. It depends on what you want to use it for. In the right context, it gives attractive results, and the impression of a very decent fan is spoiled mainly by pointless design details or sugar-coating the specs. Anyway, you can see that compared to the more ordinary fans from the last test, the Strix is a bit of a different class.
Results: Vibration, Y-axis
The first and still the only Asus fan that is on sale individually may be a good choice. But you can also get burnt. It depends on what you want to use it for. In the right context, it gives attractive results, and the impression of a very decent fan is spoiled mainly by pointless design details or sugar-coating the specs. Anyway, you can see that compared to the more ordinary fans from the last test, the Strix is a bit of a different class.
Results: Vibration, Z-axis
The first and still the only Asus fan that is on sale individually may be a good choice. But you can also get burnt. It depends on what you want to use it for. In the right context, it gives attractive results, and the impression of a very decent fan is spoiled mainly by pointless design details or sugar-coating the specs. Anyway, you can see that compared to the more ordinary fans from the last test, the Strix is a bit of a different class.
Results: Power draw including LED
Results: Power draw w/o LED
Results: Motor power
The first and still the only Asus fan that is on sale individually may be a good choice. But you can also get burnt. It depends on what you want to use it for. In the right context, it gives attractive results, and the impression of a very decent fan is spoiled mainly by pointless design details or sugar-coating the specs. Anyway, you can see that compared to the more ordinary fans from the last test, the Strix is a bit of a different class.
Results: Cooling performance per watt, airflow
The first and still the only Asus fan that is on sale individually may be a good choice. But you can also get burnt. It depends on what you want to use it for. In the right context, it gives attractive results, and the impression of a very decent fan is spoiled mainly by pointless design details or sugar-coating the specs. Anyway, you can see that compared to the more ordinary fans from the last test, the Strix is a bit of a different class.
Results: Cooling performance per watt, static pressure
The first and still the only Asus fan that is on sale individually may be a good choice. But you can also get burnt. It depends on what you want to use it for. In the right context, it gives attractive results, and the impression of a very decent fan is spoiled mainly by pointless design details or sugar-coating the specs. Anyway, you can see that compared to the more ordinary fans from the last test, the Strix is a bit of a different class.
Airflow per euro
The first and still the only Asus fan that is on sale individually may be a good choice. But you can also get burnt. It depends on what you want to use it for. In the right context, it gives attractive results, and the impression of a very decent fan is spoiled mainly by pointless design details or sugar-coating the specs. Anyway, you can see that compared to the more ordinary fans from the last test, the Strix is a bit of a different class.
Static pressure per euro
The first and still the only Asus fan that is on sale individually may be a good choice. But you can also get burnt. It depends on what you want to use it for. In the right context, it gives attractive results, and the impression of a very decent fan is spoiled mainly by pointless design details or sugar-coating the specs. Anyway, you can see that compared to the more ordinary fans from the last test, the Strix is a bit of a different class.
Results: Lighting – LED luminance and power draw
The first and still the only Asus fan that is on sale individually may be a good choice. But you can also get burnt. It depends on what you want to use it for. In the right context, it gives attractive results, and the impression of a very decent fan is spoiled mainly by pointless design details or sugar-coating the specs. Anyway, you can see that compared to the more ordinary fans from the last test, the Strix is a bit of a different class.
Results: LED to motor power draw ratio
The first and still the only Asus fan that is on sale individually may be a good choice. But you can also get burnt. It depends on what you want to use it for. In the right context, it gives attractive results, and the impression of a very decent fan is spoiled mainly by pointless design details or sugar-coating the specs. Anyway, you can see that compared to the more ordinary fans from the last test, the Strix is a bit of a different class.
Evaluation
Let’s start with the positive. The Strix XF120’s silent fan bearings are a balm to the ears during operation. Like Noctua fans, they are noiseless. Hand in hand with very low friction goes very low power draw, as the force that the motor is required to overcome is very small. That’s why the start-up speeds are low (from cca 285 rpm), as well as the minimum speed (starts at cca 135 rpm). The only drawback is the short initial rustle, roughly a second, until centering occurs. After that, the running is pretty quiet and some small vibrations get on the frame only at high revs and apparently only due to turbulence.
The airflow is decent, but in this price range it is average to below average in the same noise modes. On the grille, it is outperformed at very low noise by the already more than half-priced Akasa X7 fan. At higher speeds at comparable noise levels, it does have a slight edge over the fans we’ve tested so far, but neither can be considered direct competition – comparisons with it are yet to be made. We already know how the XF120 stacks up against equivalent fans (including the Noctua NF-A12x25), and this verbal assessment is done with that in mind.
For cooling a case, this fan was not properly tuned by its designers and such use is failing, for example, on such trivialities as the collision of the rotor with the dust filter. This is not to say that the XF120 is a bad fan. It will easily justify its operation on cooler radiators. And on top of that, at an impressive price/performance ratio.
However, the static pressure of this fan is above standard, in this it is far ahead cheaper fans across the entire speed spectrum. The only disappontment in this regard are the misleading specifications, which exceed reality (2,29 mm H2O) by 25 %. This is a big difference that does not fall within the stated tolerance. However, when it comes to airflow, Asus specifies the maximum quite precisely.
Among the best fans (and the XF120 ranks among radiator fans within the 120-millimeter range as well), the guideline is which fan is less annoying to listen to.
At slower speeds, the Strix XF120’s sound is characterized by low, or more pleasant, frequencies. And even with use on a radiator. Some more significant hissing occurs only on the plastic dust filter at higher speeds (above 1000 rpm), which is not avoided by other fans. With the XF120, elevated frequencies are in the 4.5-6 kHz band.
If it weren’t for the static pressure misdirection, we might have turned a blind eye and the XF120 would have earned a higher accolade than “Approved”. It’s admittedly more or less a single-purpose fan, but as long as you know exactly what you’re buying it for (and it’s going to be used with respect to what it does best), it doesn’t really matter that much.
English translation and edit by Jozef Dudáš
| Asus ROG Strix XF120 |
| + High static pressure even through restrictive obstacle |
| + Superb results on liquid cooler radiators |
| + Very low speeds possible (stable from approx. 150 rpm) |
| + Virtually noiseless operation of bearings and motor (no non-aerodynamic noises) |
| + Very low power draw below 1 W considering the high performance |
| + Favourable price/performance ratio with regard to static pressure |
| + Expectation of a very long service life |
| - Single-purpose design - Strix XF120 is unsuitable for system cooling |
| - Collides with nylon dust filter |
| - Imperfections in the cosmetics (the surface on some blades is unfinished, with scratches after polishing) |
| Approximate retail price: 23 EUR |
- Contents
- Asus ROG Strix XF120 in detail
- The basis of the methodology, the wind tunnel
- Mounting and vibration measurement
- Initial warm-up and speed recording
- Base 7 equal noise levels…
- .. and sound color (frequency characteristic)
- Static pressure measurement…
- … and airflow
- Everything changes with obstacles
- How we measure power draw and motor power
- Measuring the intensity (and power draw) of lighting
- Results: Speed
- Results: Airflow w/o obstacles
- Results: Airflow through a nylon filter
- Results: Airflow through a plastic filter
- Results: Airflow through a hexagonal grille
- Results: Airflow through a thinner radiator
- Results: Airflow through a thicker radiator
- Results: Static pressure w/o obstacles
- Results: Static pressure through a nylon filter
- Results: Static pressure through a plastic filter
- Results: Static pressure through a hexagonal grille
- Results: Static pressure through a thinner radiator
- Results: Static pressure through a thicker radiator
- Results: Static pressure, efficiency by orientation
- Reality vs. specifications
- Results: Frequency response of sound w/o obstacles
- Results: Frequency response of sound with a dust filter
- Results: Frequency response of sound with a hexagonal grille
- Results: Frequency response of sound with a radiator
- Results: Vibration, in total (3D vector length)
- Results: Vibration, X-axis
- Results: Vibration, Y-axis
- Results: Vibration, Z-axis
- Results: Power draw (and motor power)
- Results: Cooling performance per watt, airflow
- Results: Cooling performance per watt, static pressure
- Airflow per euro
- Static pressure per euro
- Results: Lighting – LED luminance and power draw
- Results: LED to motor power draw ratio
- Evaluation