


Gaming performance per euro
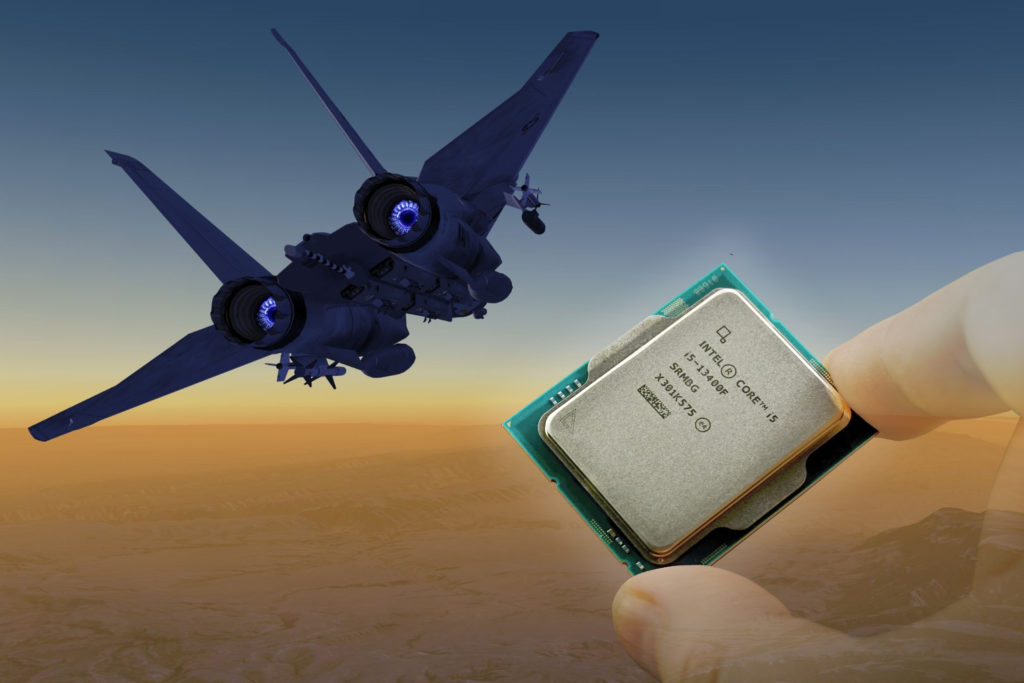
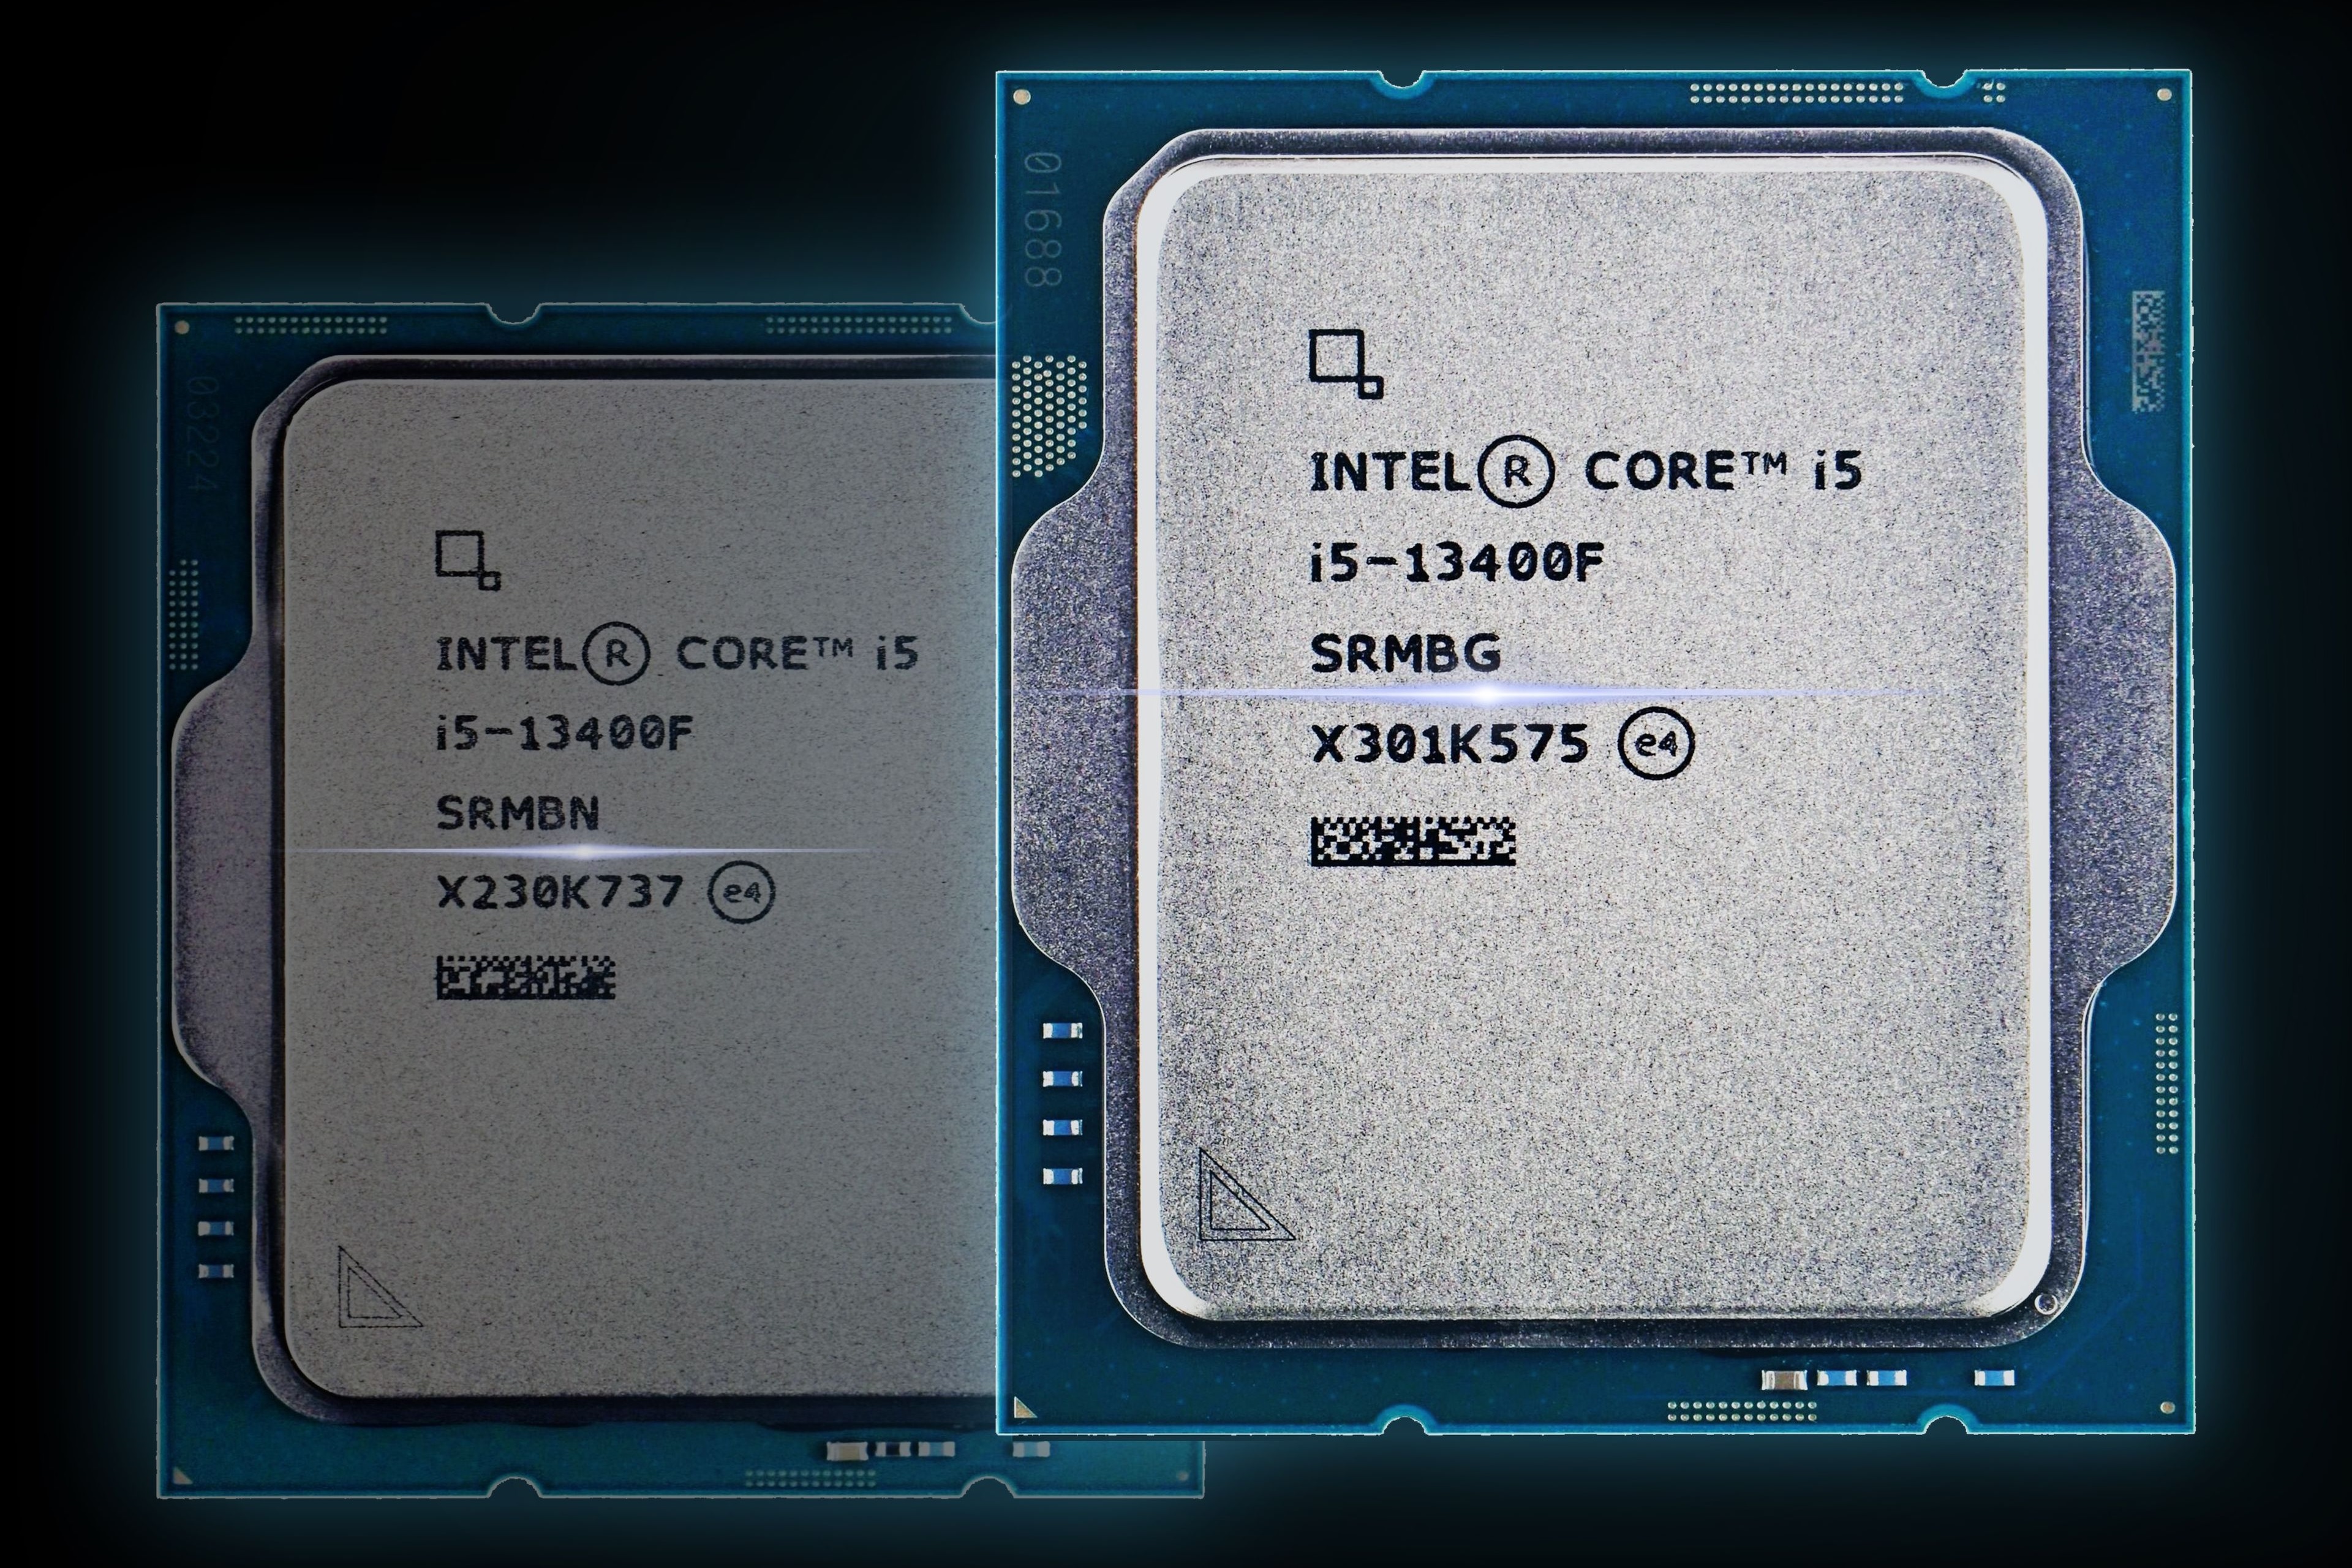
The third and final Intel Core i5-13400F CPU test with measurements beyond standard will add to what the previous two have shown. We ran the two existing steppings – B0 (with Raptor Cove/Raptor Lake P cores) and C0 (Golden Cove/Alder Lake) – through all the games we use to test processors, in four different display setups. In the case of stepping B0 even with modified CPU settings, with E cores disabled.
The results of this article follow up on game tests, of which we have only had a few. From testing ten games at 720p, 1080p, 1440p and 2160p, it’s possible to draw more objective conclusions. Whether it’s the difference in game performance due to different stepping (B0/C0) or the (de)activation of the four “efficient” Gracemont cores.
“True” Raptor Lake is faster…
On average, stepping B0 achieves 2–5% higher gaming performance than stepping C0, but this comes at the price of slightly lower efficiency. The power draw of the B0 variant can be higher possibly by up to 14% (i.e. approx. 7 W).Of the games tested, the biggest speed difference in favour of stepping B0 is in CS:GO – up to 25% (1080p@high), in DOOM Eternal – up to 11%.
There is also a bigger difference (up to 10%) in the minimum fps in F1 2020, which have smaller drops with stepping B0. In most games, such as Assassin’s Creed: Valhalla, Borderlands 3, Cyberpunk 2077, MS Flight Simulator or Shadow of the Tomb Raider, however, the difference is always less than 5% (and often only around 2%). But heads up, sometimes stepping C0 has the upper hand. Albeit always only symbolically, but we’ve nevertheless measured repeatedly higher fps in Assassin’s Creed: Valhalla or Total War Saga: Troy and from the perspective of minimal fps, in v Metro Exodus as well.
The difference in efficiency is at 2% in favour of stepping C0. The latter is slightly slower on average across all games tested, but also draws less power. And the lower power draw (compared to gaming performance) is the winner here.

… and little (E) cores don’t help much
But perhaps the most interesting thing is that the Core i5-13400F’s highest gaming performance can be achieved with the E cores disabled (i.e. with only 6 P cores). Of course, this is not always the case and cannot be generalized, but in any case the results show that at lower CPU load (at higher resolutions 1440p and 2160p) the processor score is already a bit higher on average in the configuration without E cores. They don’t reduce game performance though, and on the contrary, in games that can use part of the tasks assigned to E cores in addition to 6 P cores, running with them is faster. However, this occurs at lower resolutions (with higher CPU load) and on average it’s up to 3%.
In F1 2020, where E cores have virtually no impact on fps, power draw is significantly higher with them, by 14%. The percentage increase in power draw (+7%) over game performance (+2%) is also higher in Shadow of the Tomb Raider.But then again, in Total War Saga: Troy, power draw is 7% lower with E cores at comparable speed (~201 fps). It’s individual, but mostly, on average, E cores in games mean lower efficiency. This is also indicated by the gaming performance per unit of power draw ratio. This is 4% higher after disabling the E cores, when the processor has only 6 P cores available.
English translation and edit by Jozef Dudáš
The third and final Intel Core i5-13400F CPU test with measurements beyond standard will add to what the previous two have shown. We ran the two existing steppings – B0 (with Raptor Cove/Raptor Lake P cores) and C0 (Golden Cove/Alder Lake) – through all the games we use to test processors, in four different display setups. In the case of stepping B0 even with modified CPU settings, with E cores disabled.
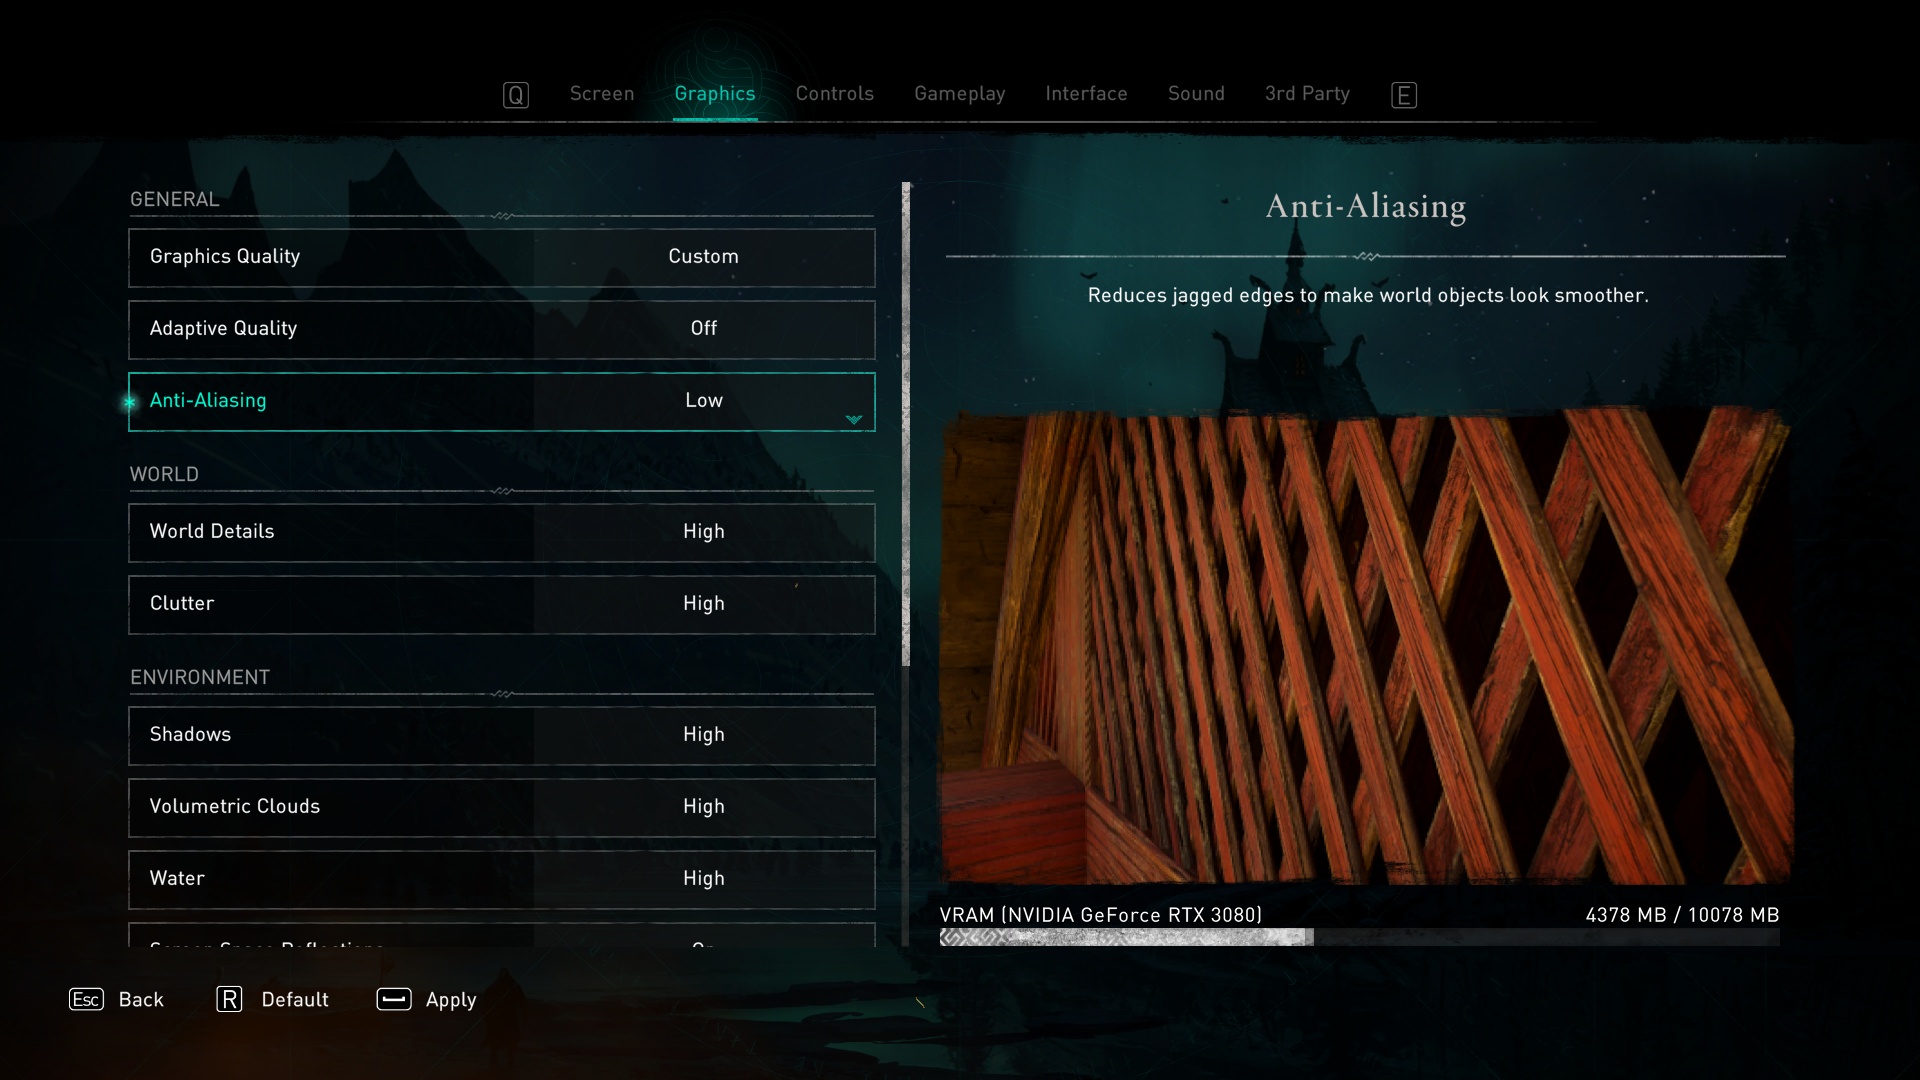
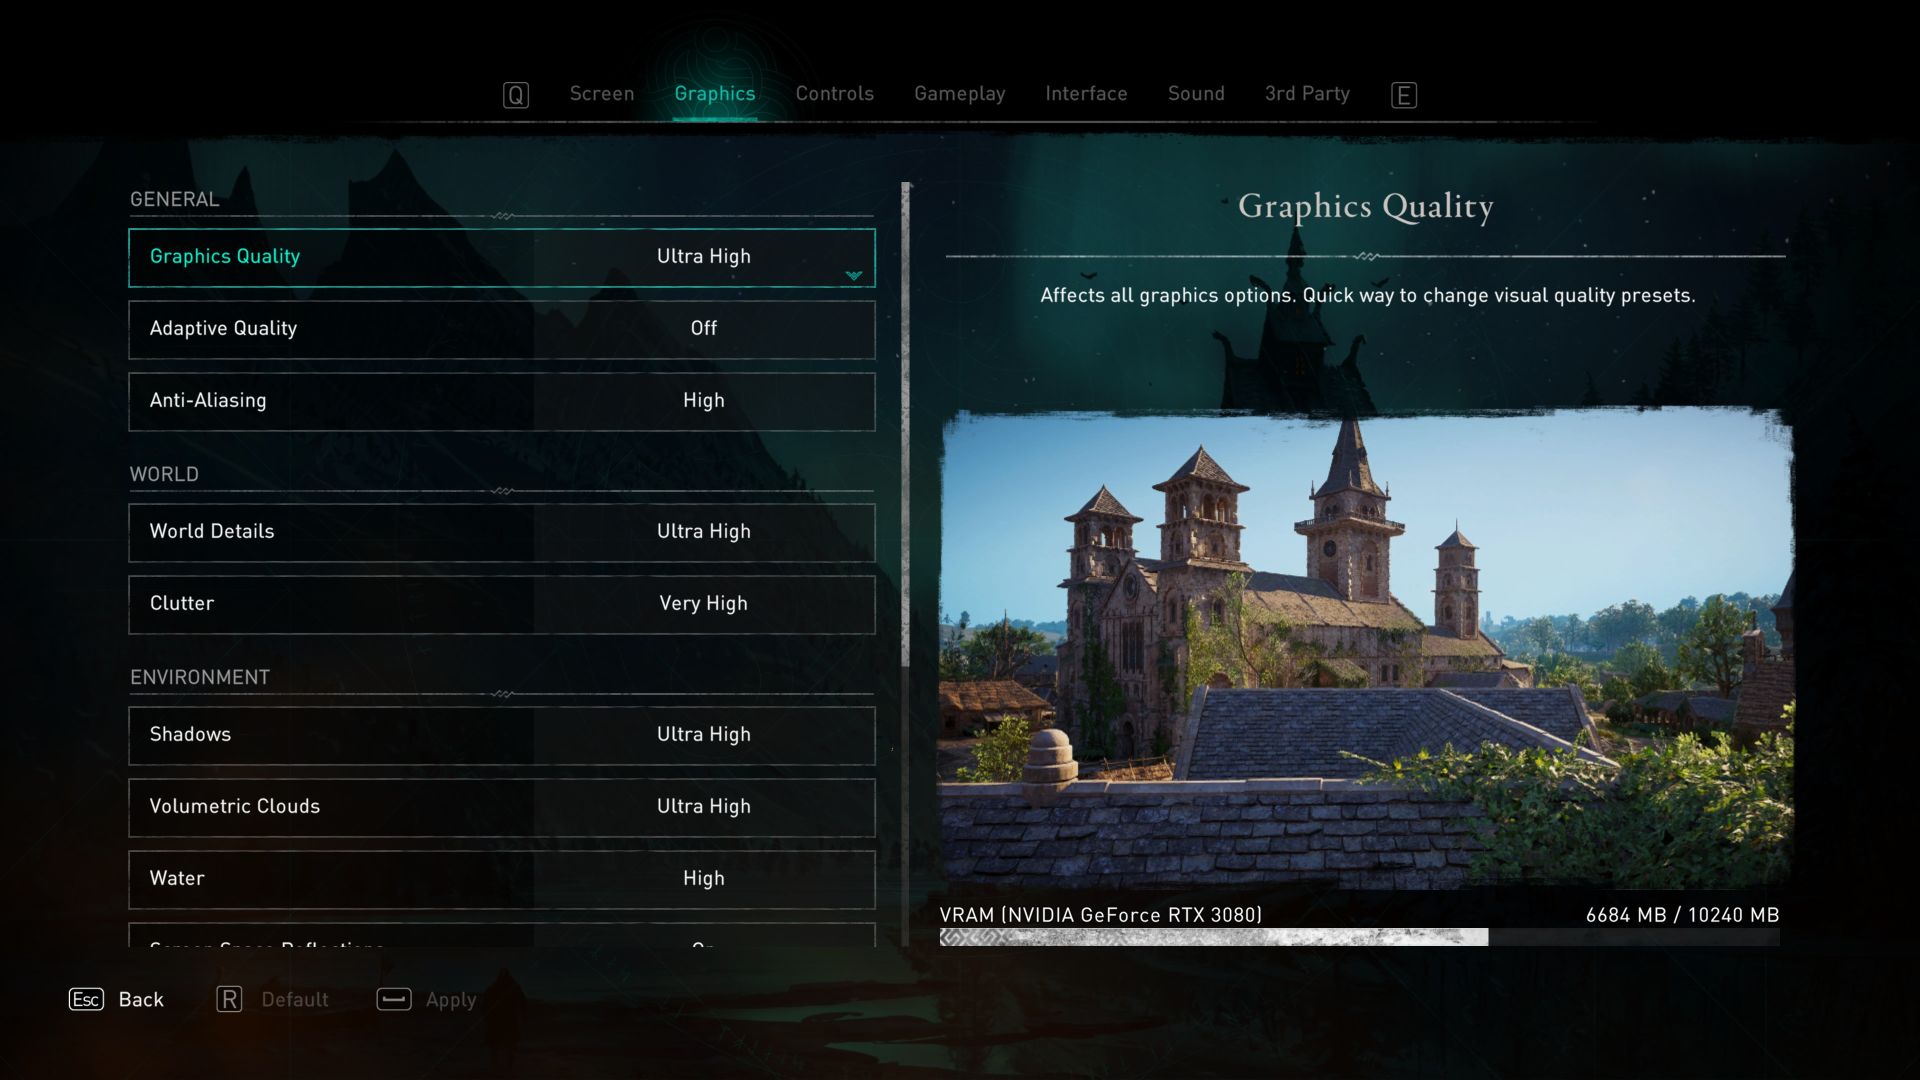
Assassin’s Creed: Valhalla

Test environment: resolution 1280 × 720 px; graphics settings preset Low; API DirectX 12; no extra settings; test scene: built-in benchmark.

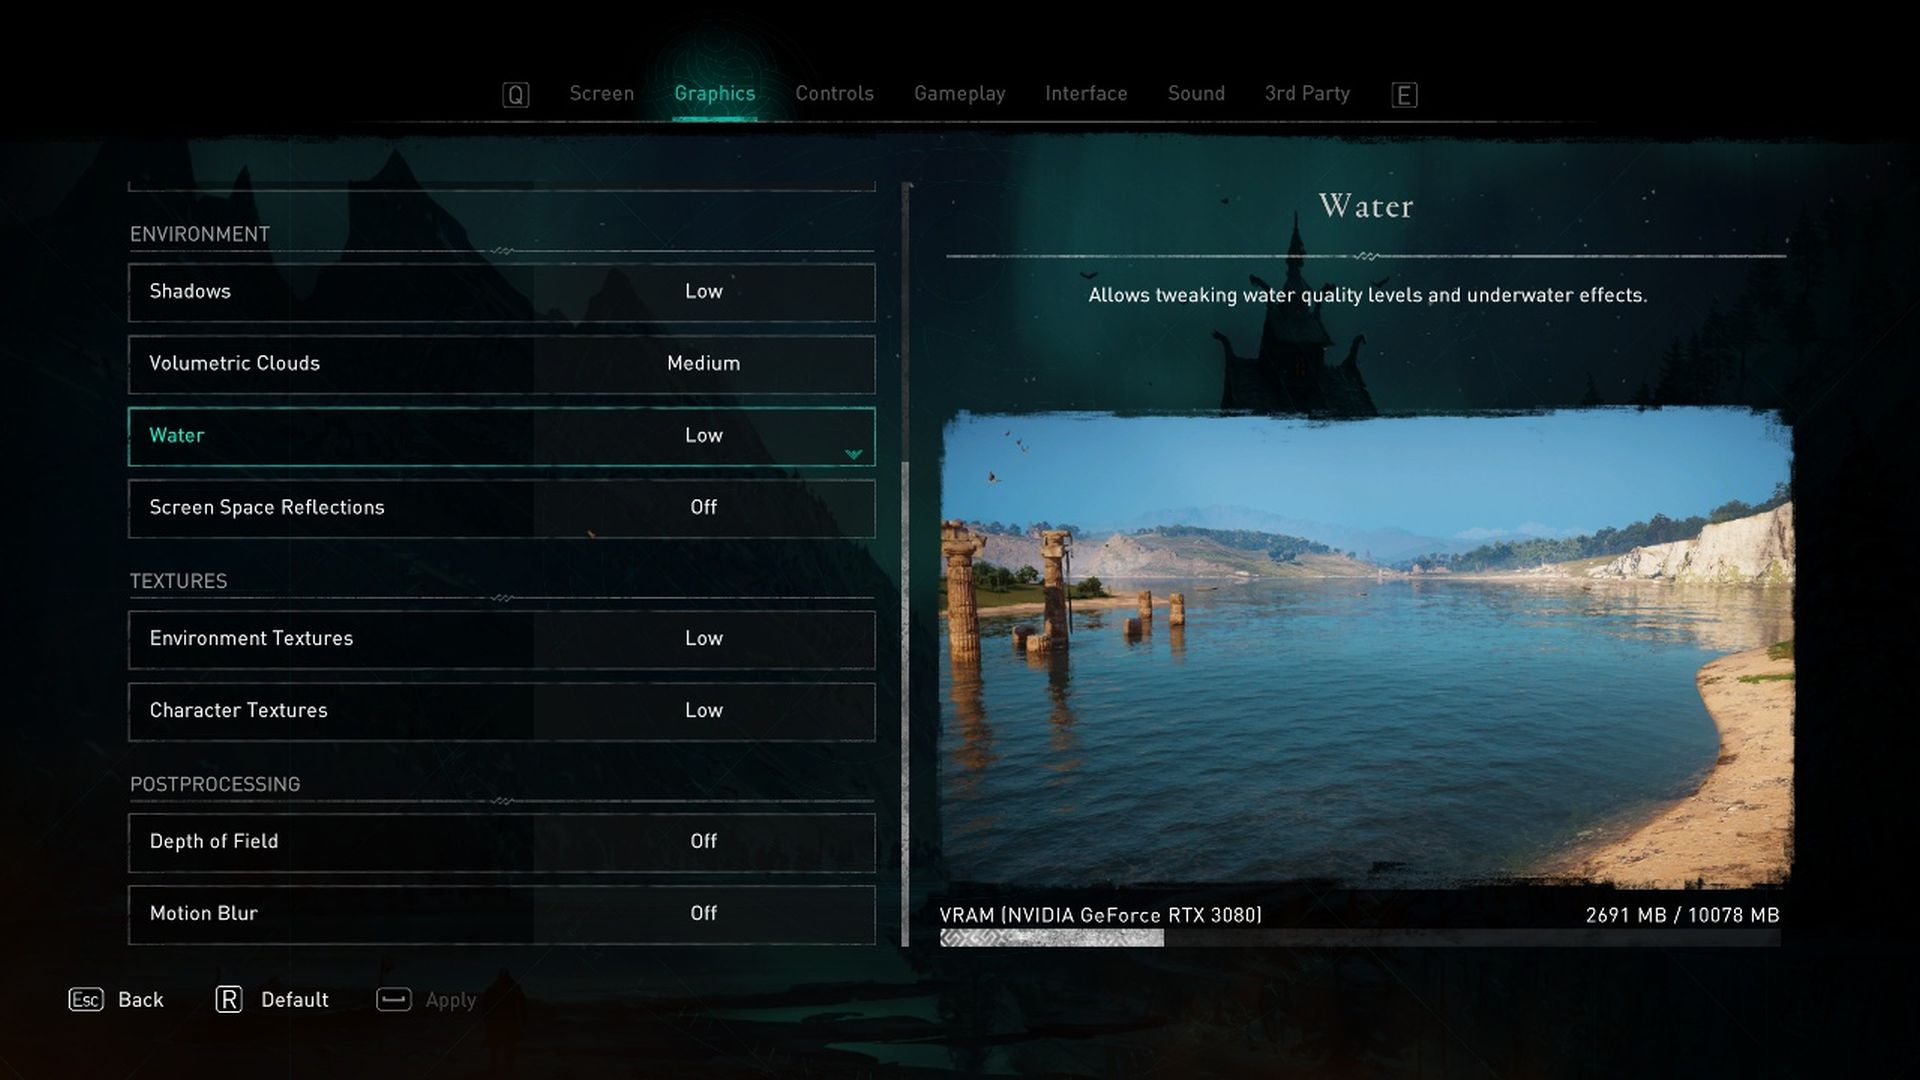

Test environment: resolution 1920 × 1080 px; graphics settings preset Low; API DirectX 12; extra settings Anti-Aliasing: low; test scene: built-in benchmark.
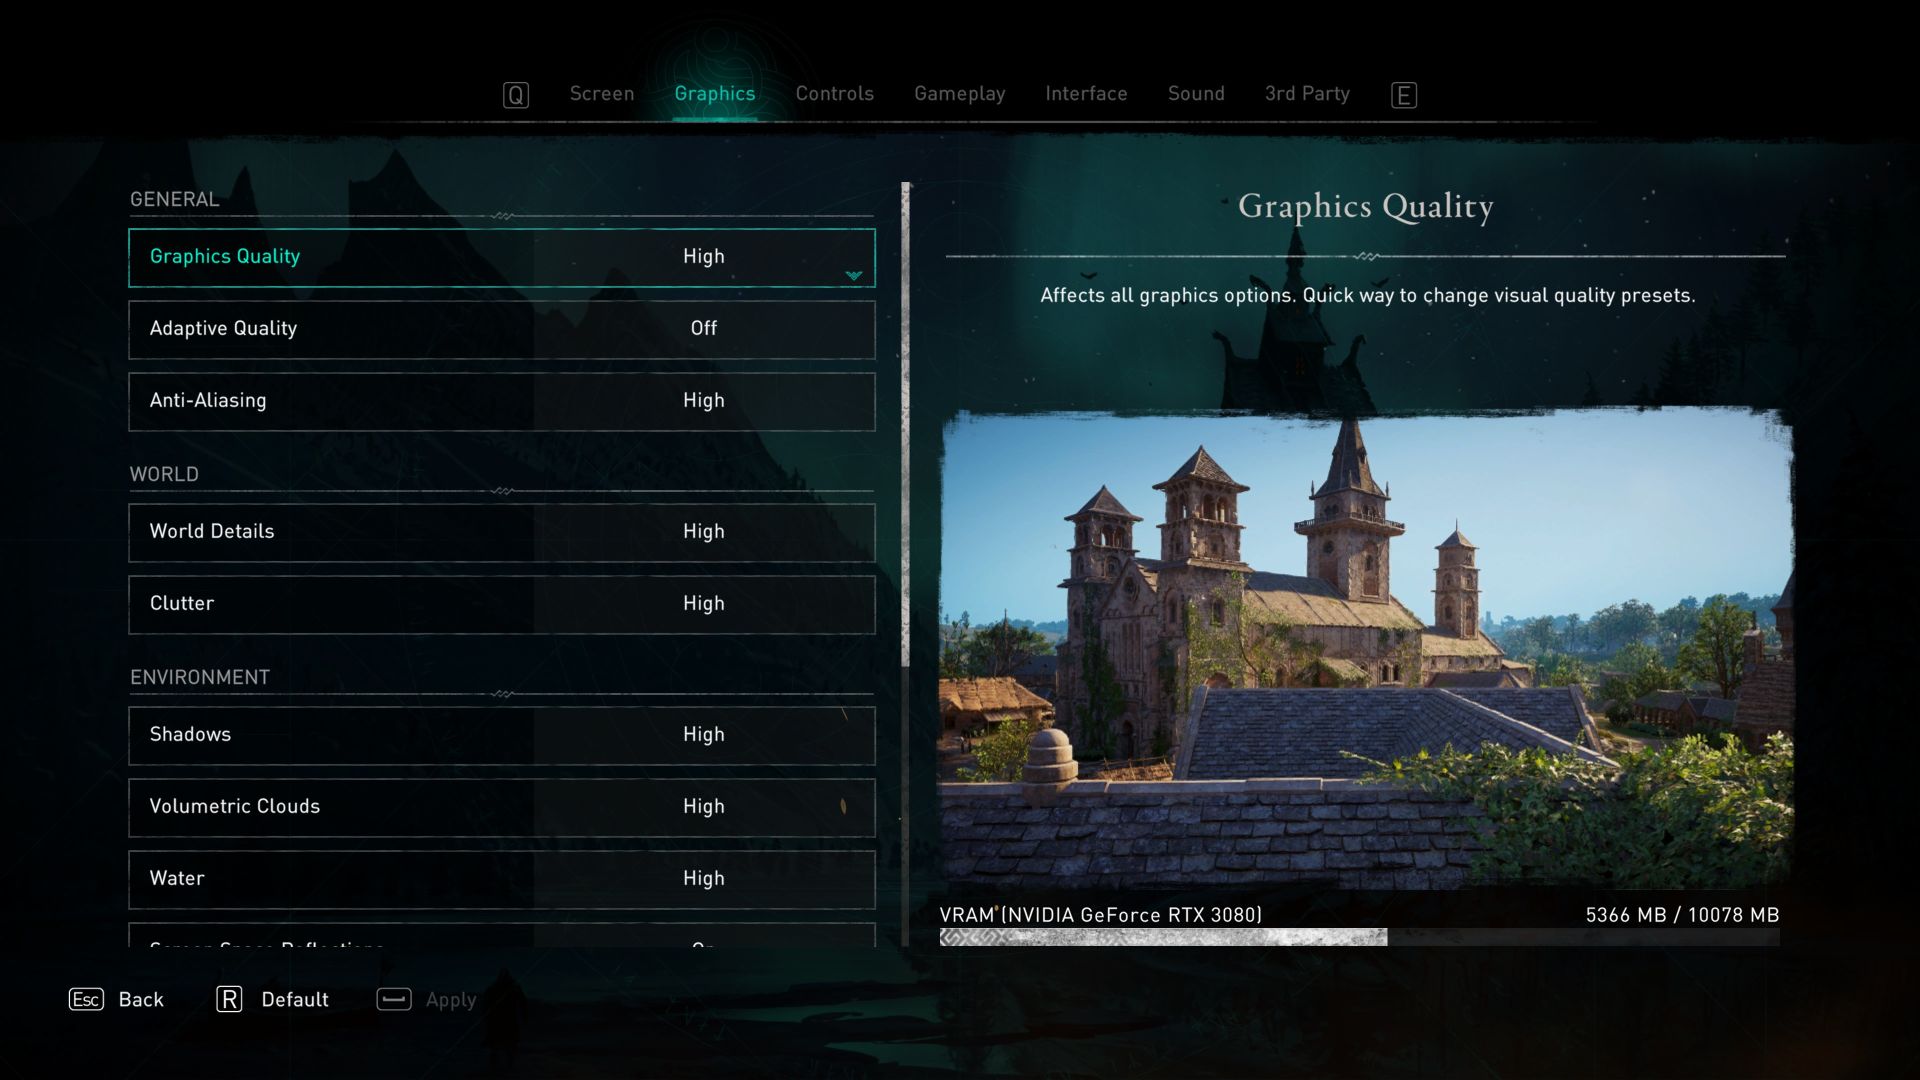
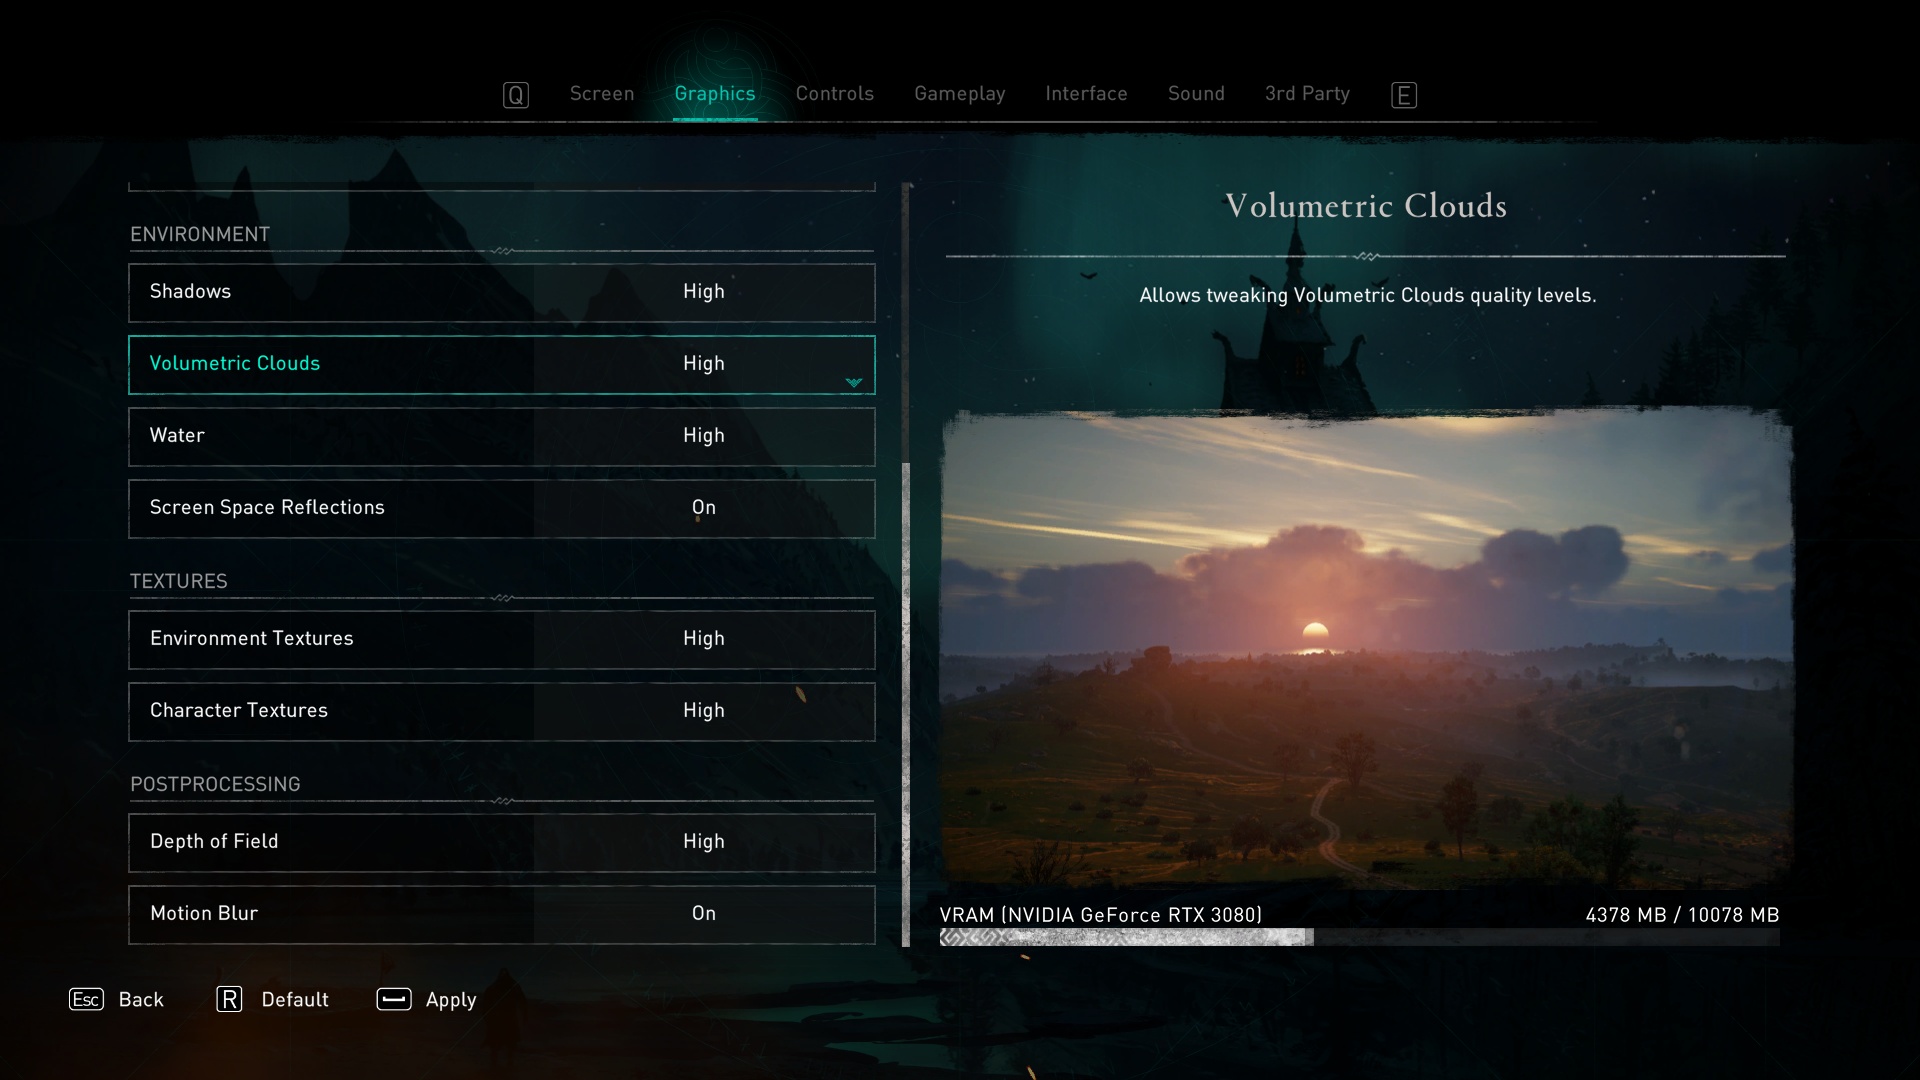
Test environment: resolution 2560 × 1440 px; graphics settings preset High; API DirectX 12; no extra settings; test scene: built-in benchmark.
Test environment: resolution 3840 × 2160 px; graphics settings preset Ultra High; API DirectX 12; no extra settings; test scene: built-in benchmark.

The third and final Intel Core i5-13400F CPU test with measurements beyond standard will add to what the previous two have shown. We ran the two existing steppings – B0 (with Raptor Cove/Raptor Lake P cores) and C0 (Golden Cove/Alder Lake) – through all the games we use to test processors, in four different display setups. In the case of stepping B0 even with modified CPU settings, with E cores disabled.
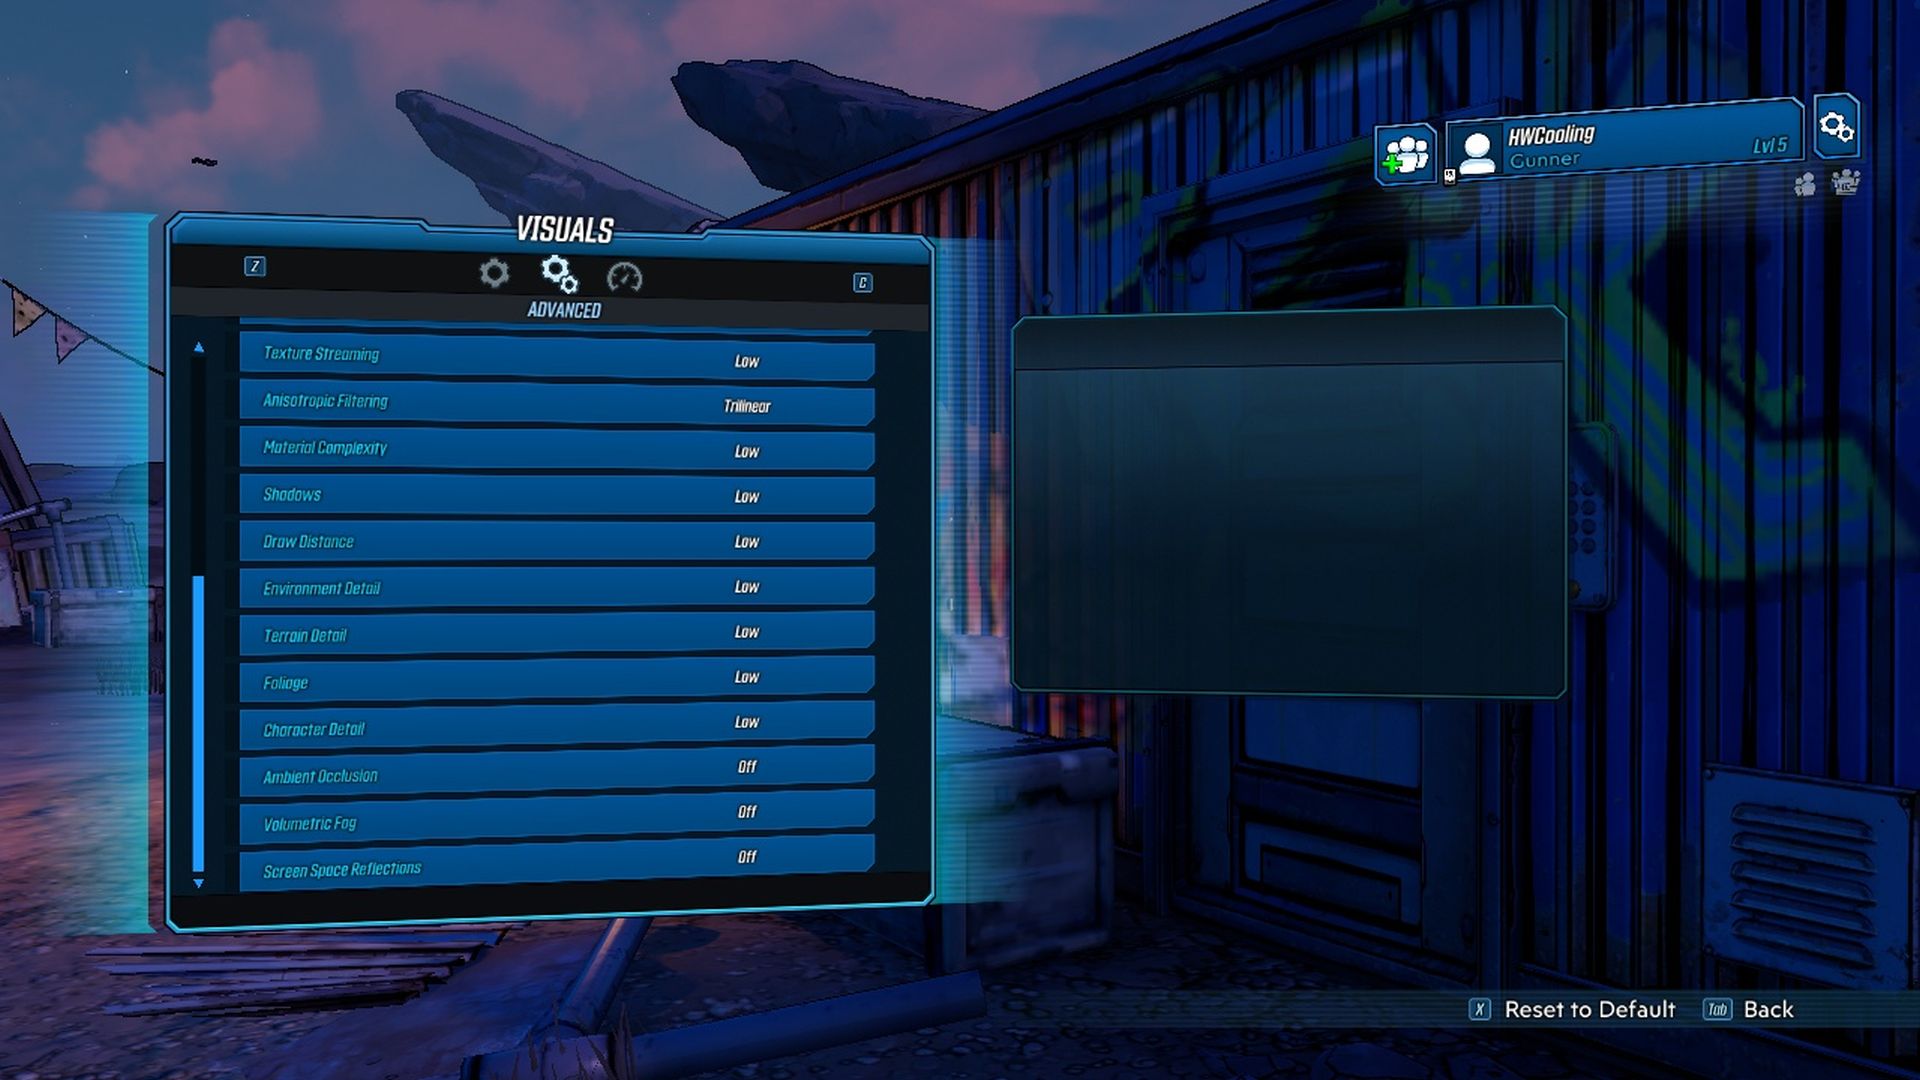
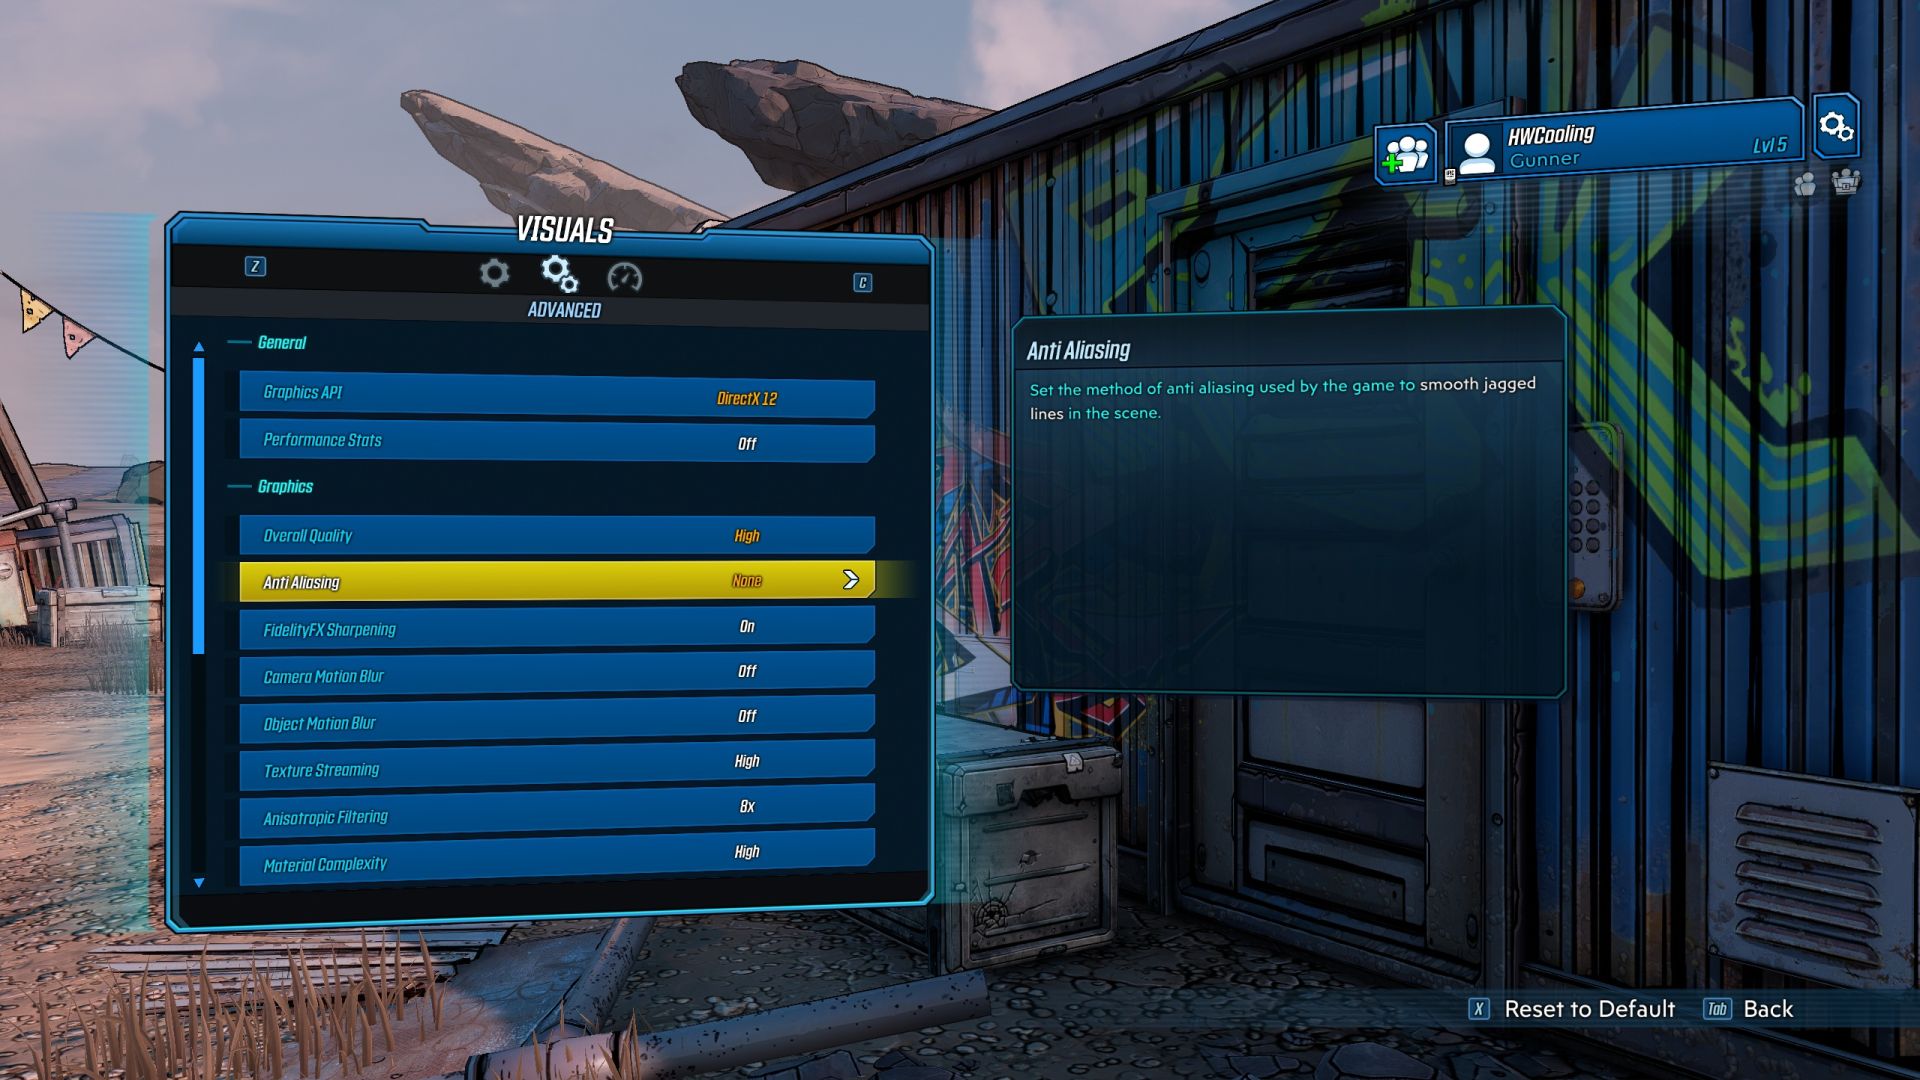
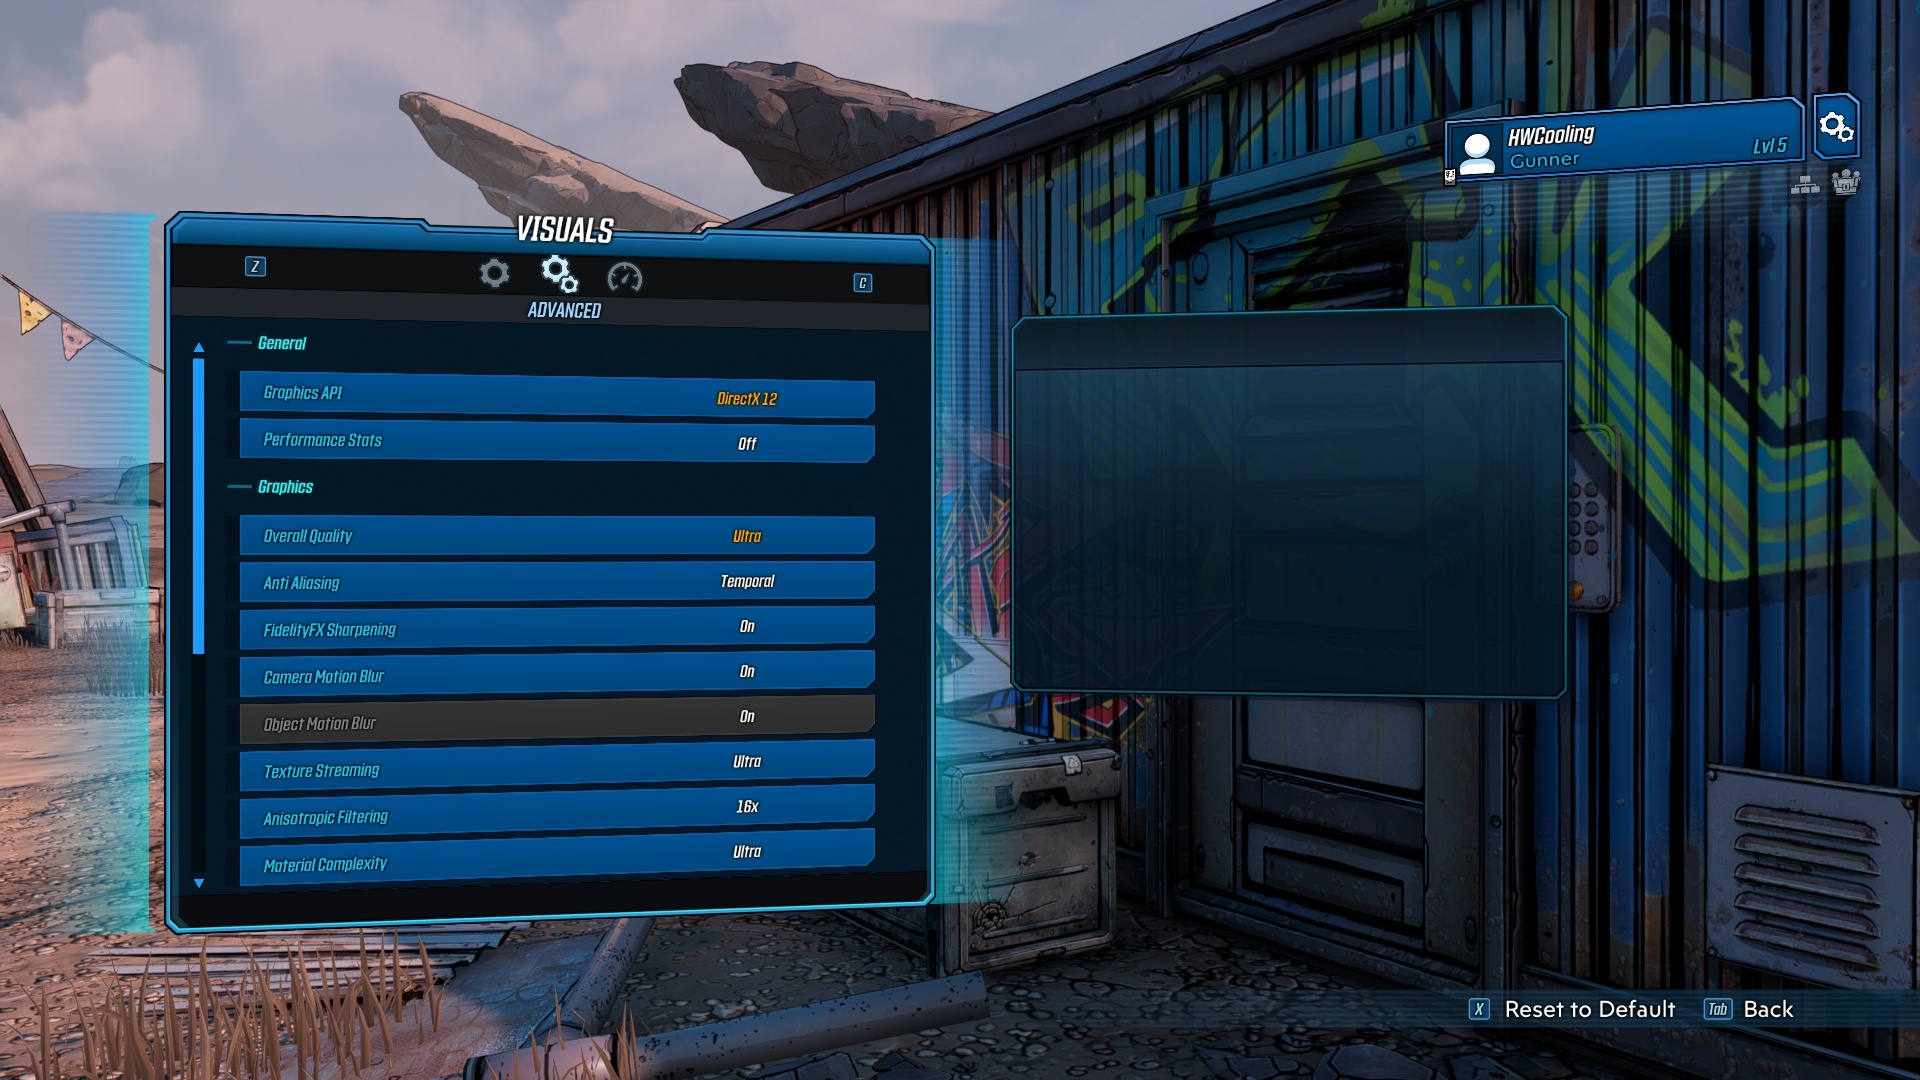
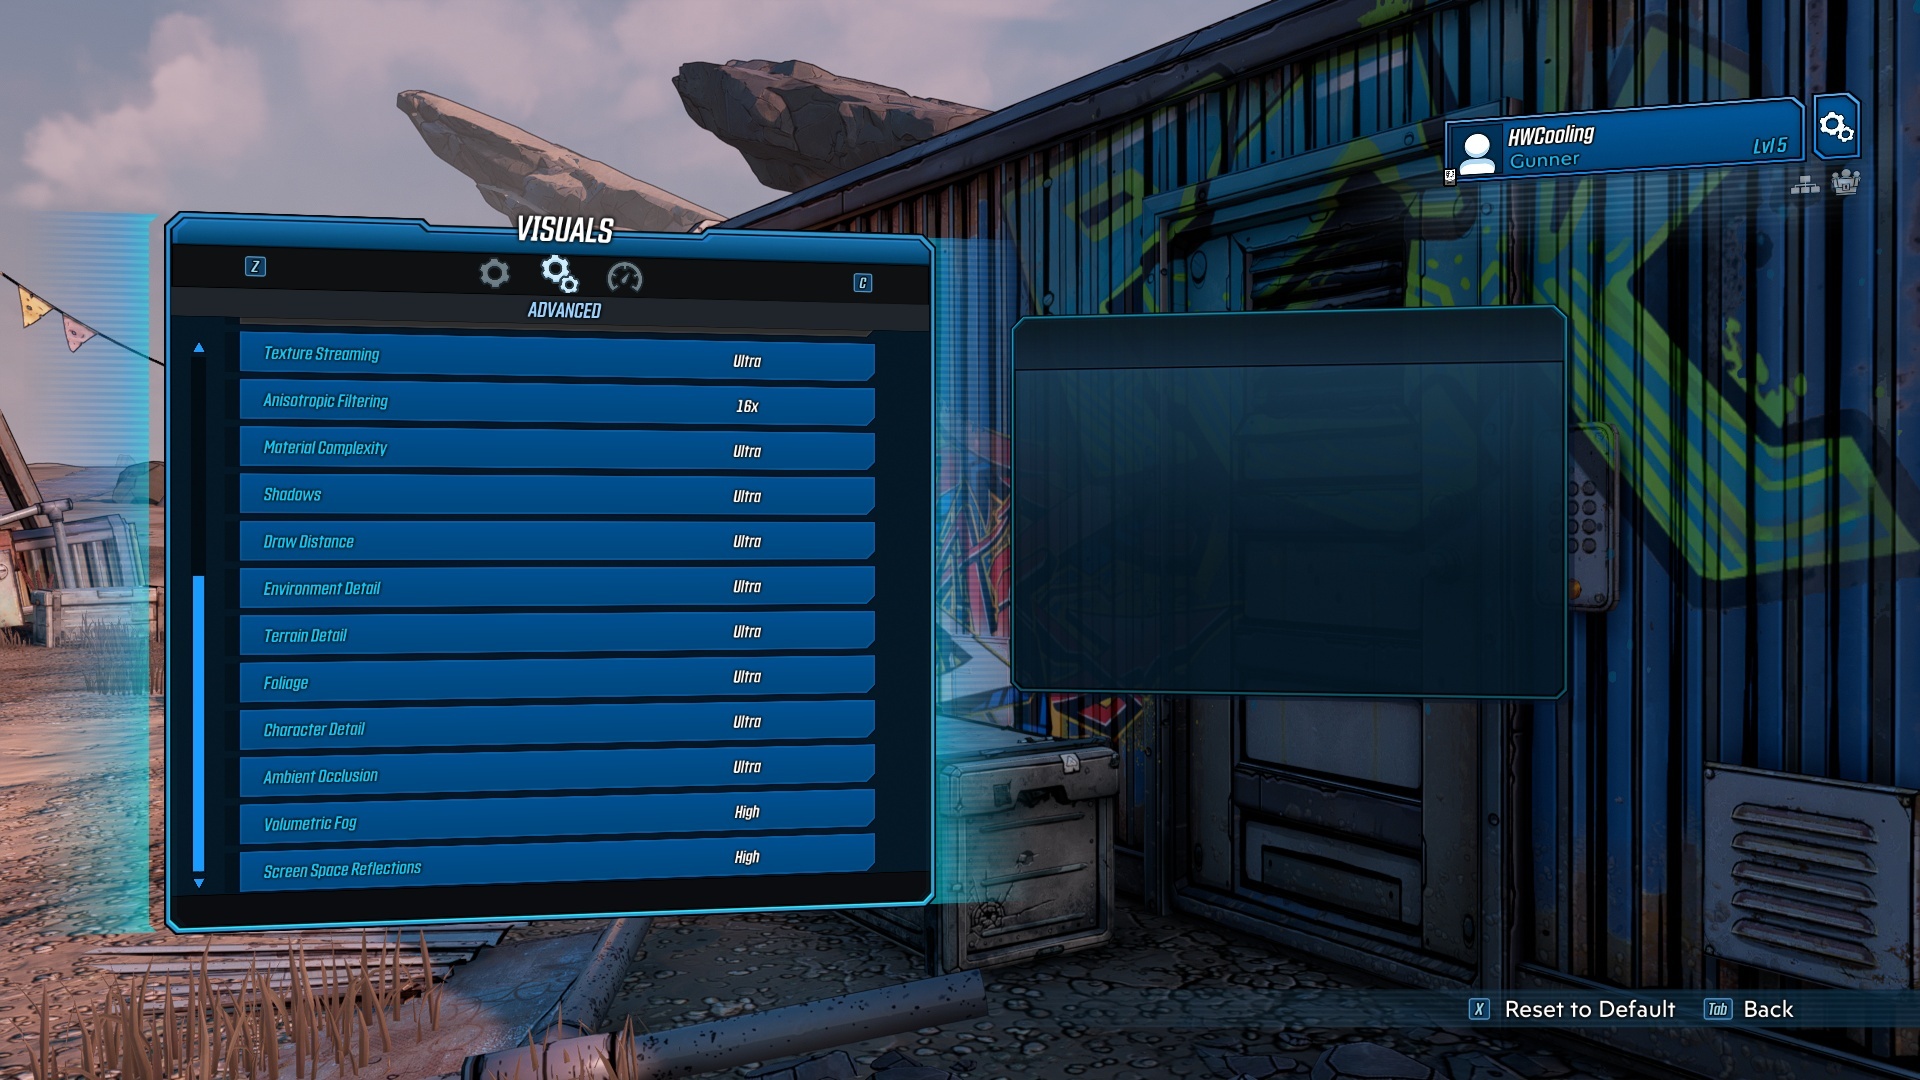
Borderlands 3

Test environment: resolution 1280 × 720 px; graphics settings preset Very Low; API DirectX 12; no extra settings; test scene: built-in benchmark.

Test environment: resolution 1920 × 1080 px; graphics settings preset High; API DirectX 12; extra settings Anti-Aliasing: None; test scene: built-in benchmark.
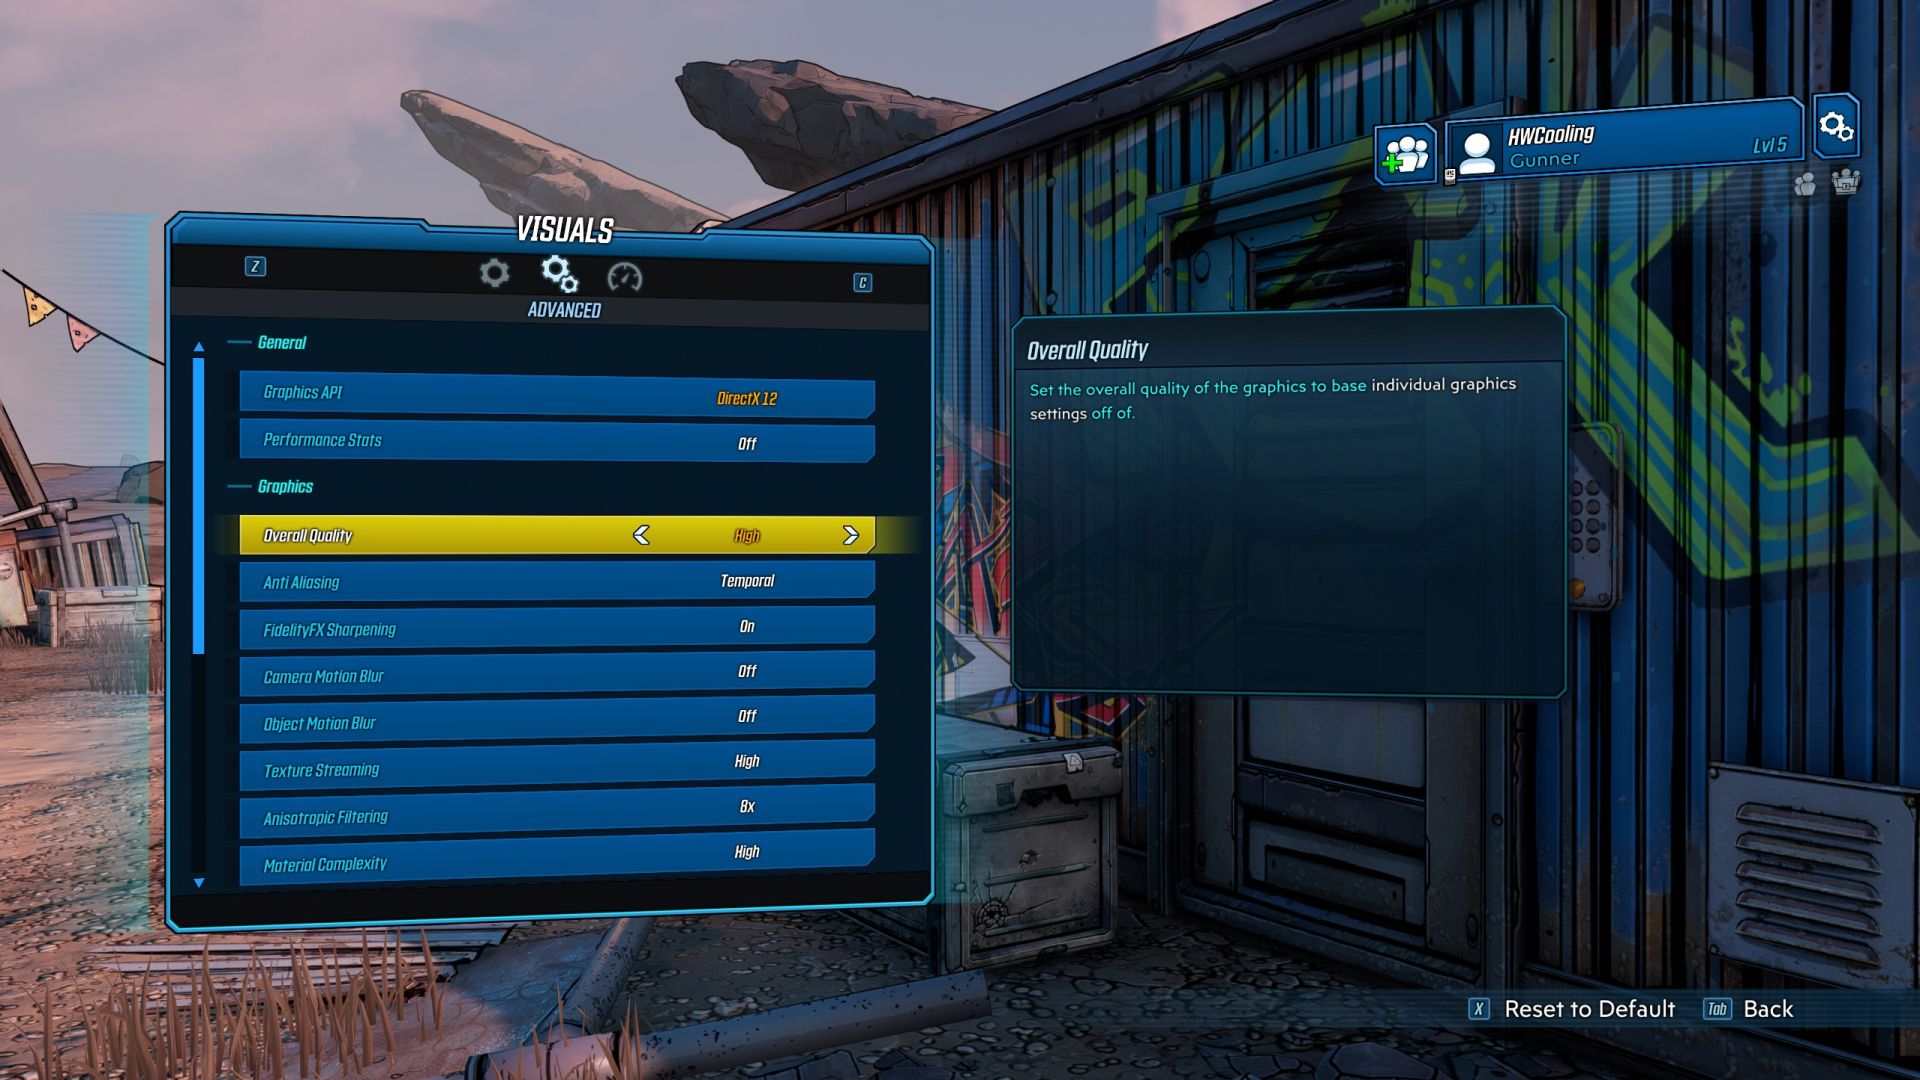
Test environment: resolution 2560 × 1440 px; graphics settings preset High; API DirectX 12; no extra settings; test scene: built-in benchmark.

Test environment: resolution 3840 × 2160 px; graphics settings preset Ultra; API DirectX 12; no extra settings; test scene: built-in benchmark.
The third and final Intel Core i5-13400F CPU test with measurements beyond standard will add to what the previous two have shown. We ran the two existing steppings – B0 (with Raptor Cove/Raptor Lake P cores) and C0 (Golden Cove/Alder Lake) – through all the games we use to test processors, in four different display setups. In the case of stepping B0 even with modified CPU settings, with E cores disabled.
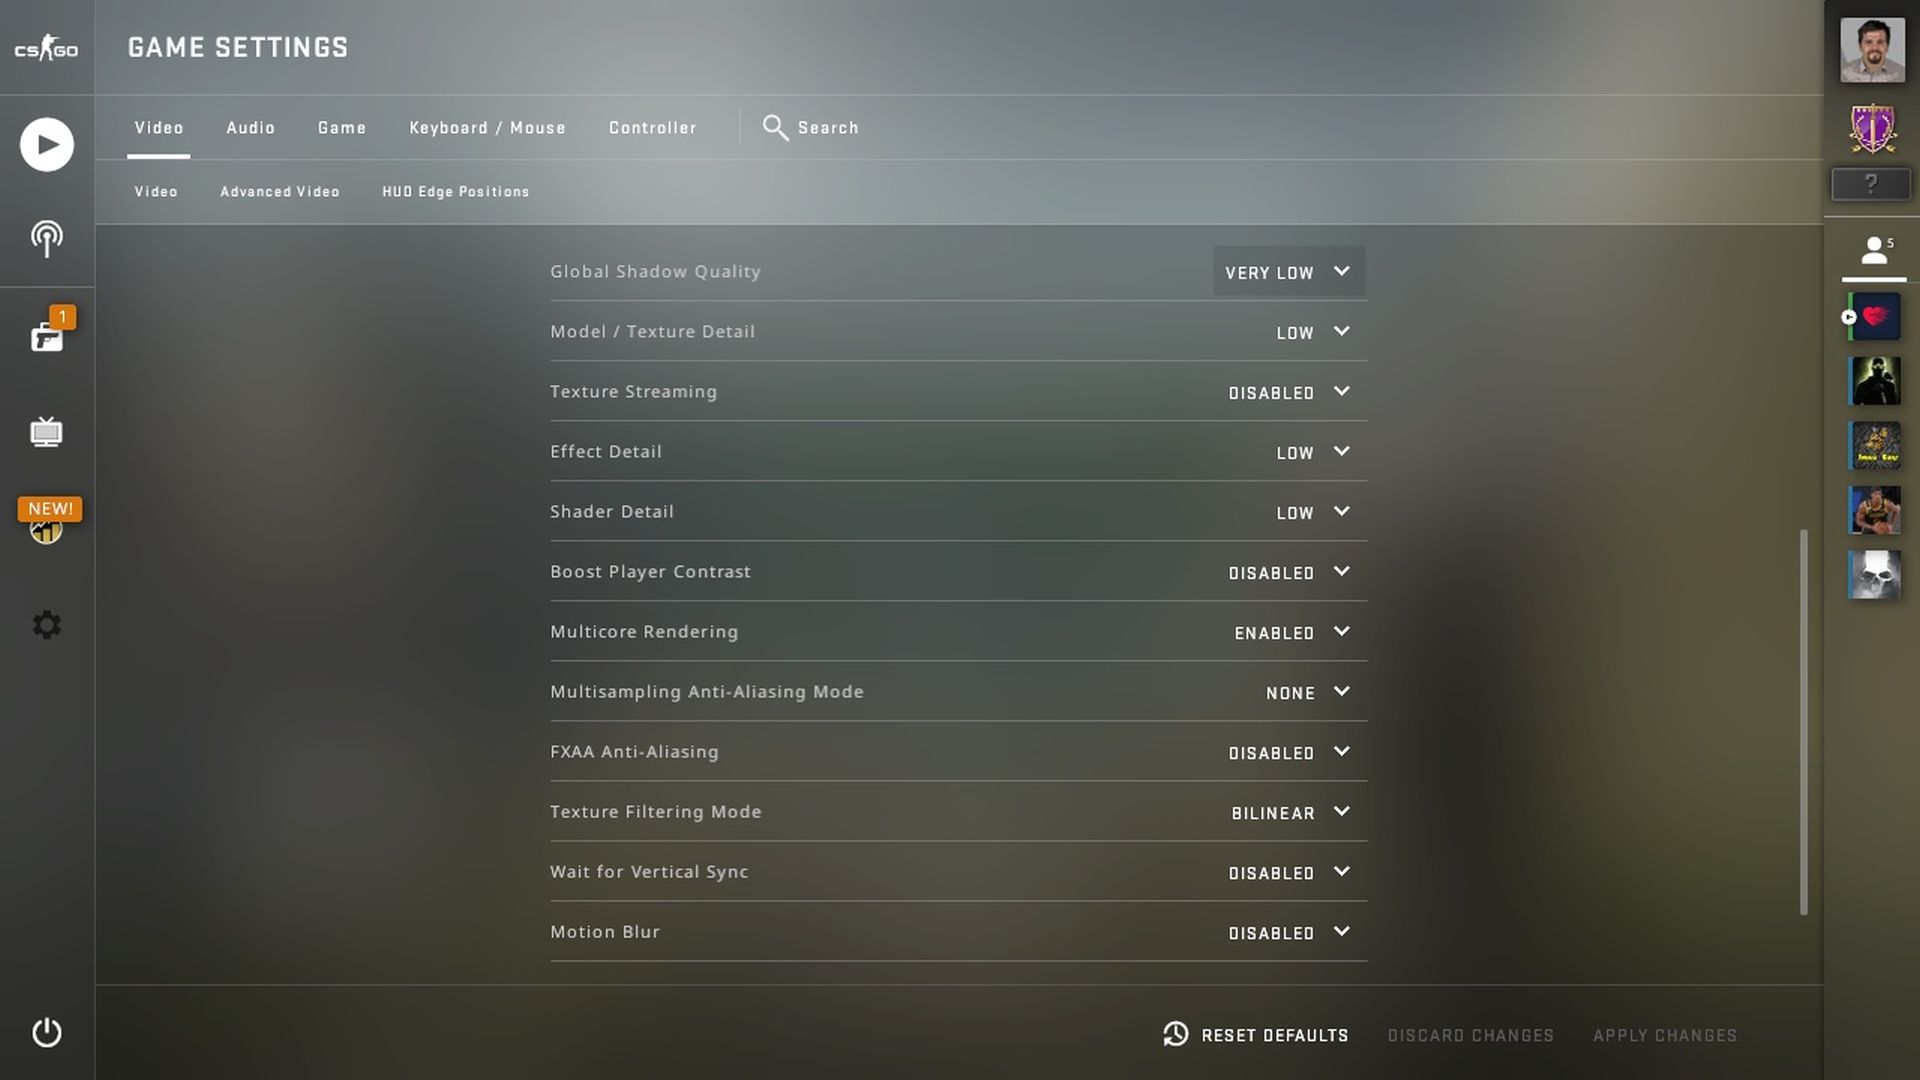
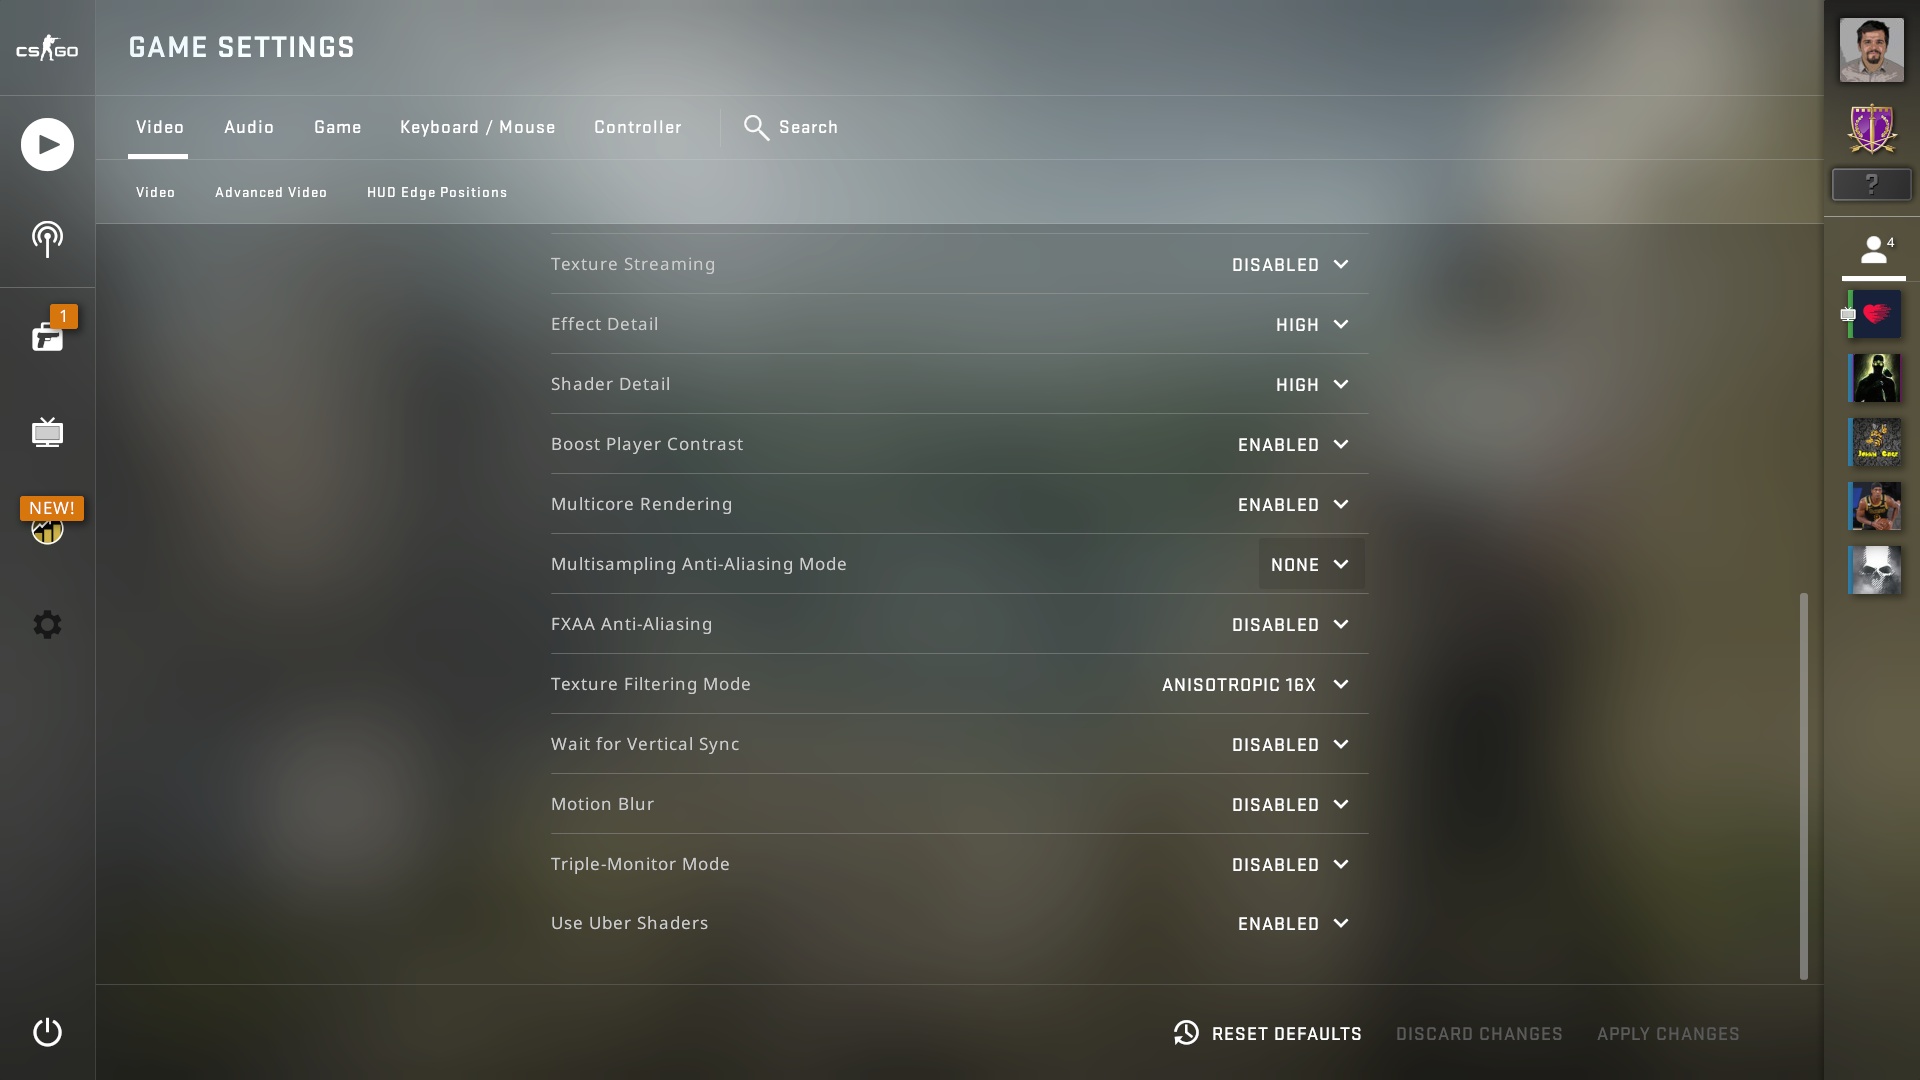
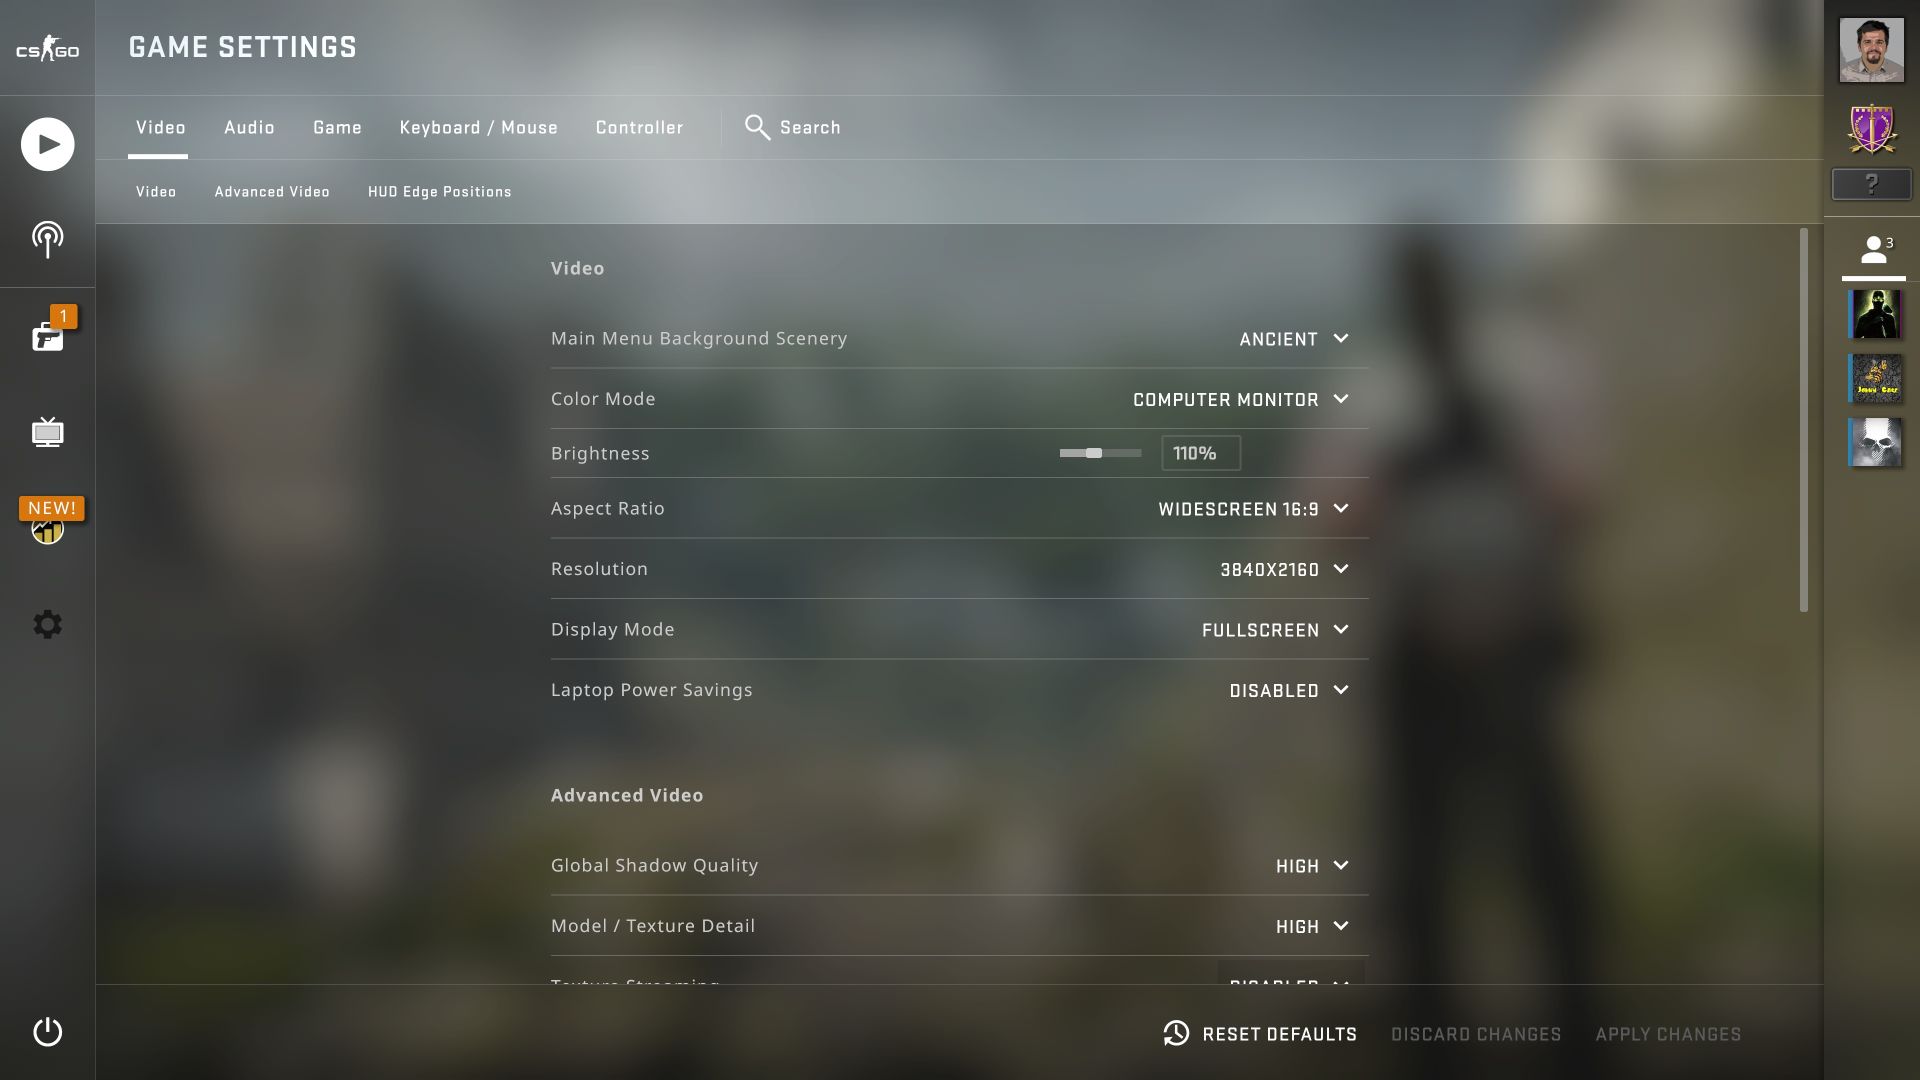
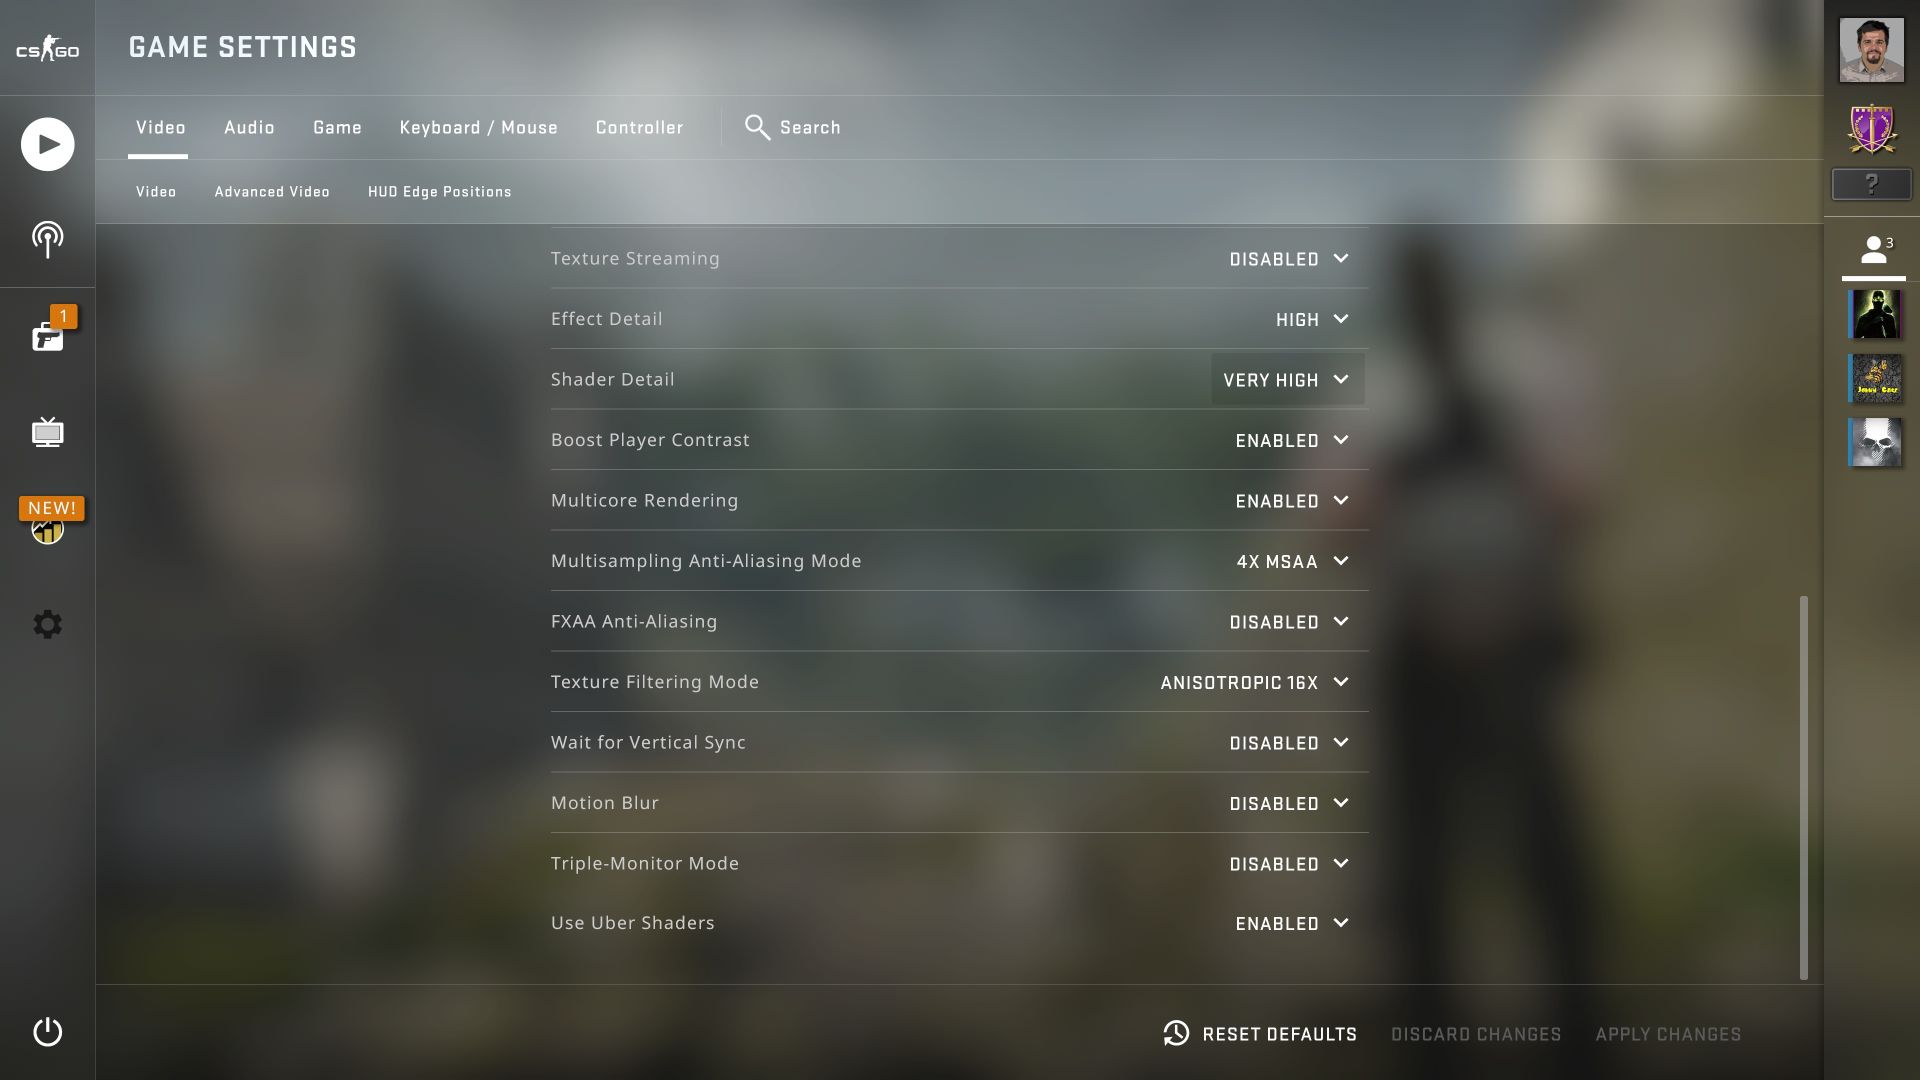
Counter-Strike: GO

Test environment: resolution 1280 × 720 px; lowest graphics settings and w/o Anti-Aliasing, API DirectX 9; Test platform script with Dust 2 map tour.

Test environment: resolution 1920 × 1080 px; high graphics settings and w/o Anti-Aliasingu, API DirectX 9; Test platform script with Dust 2 map tour.
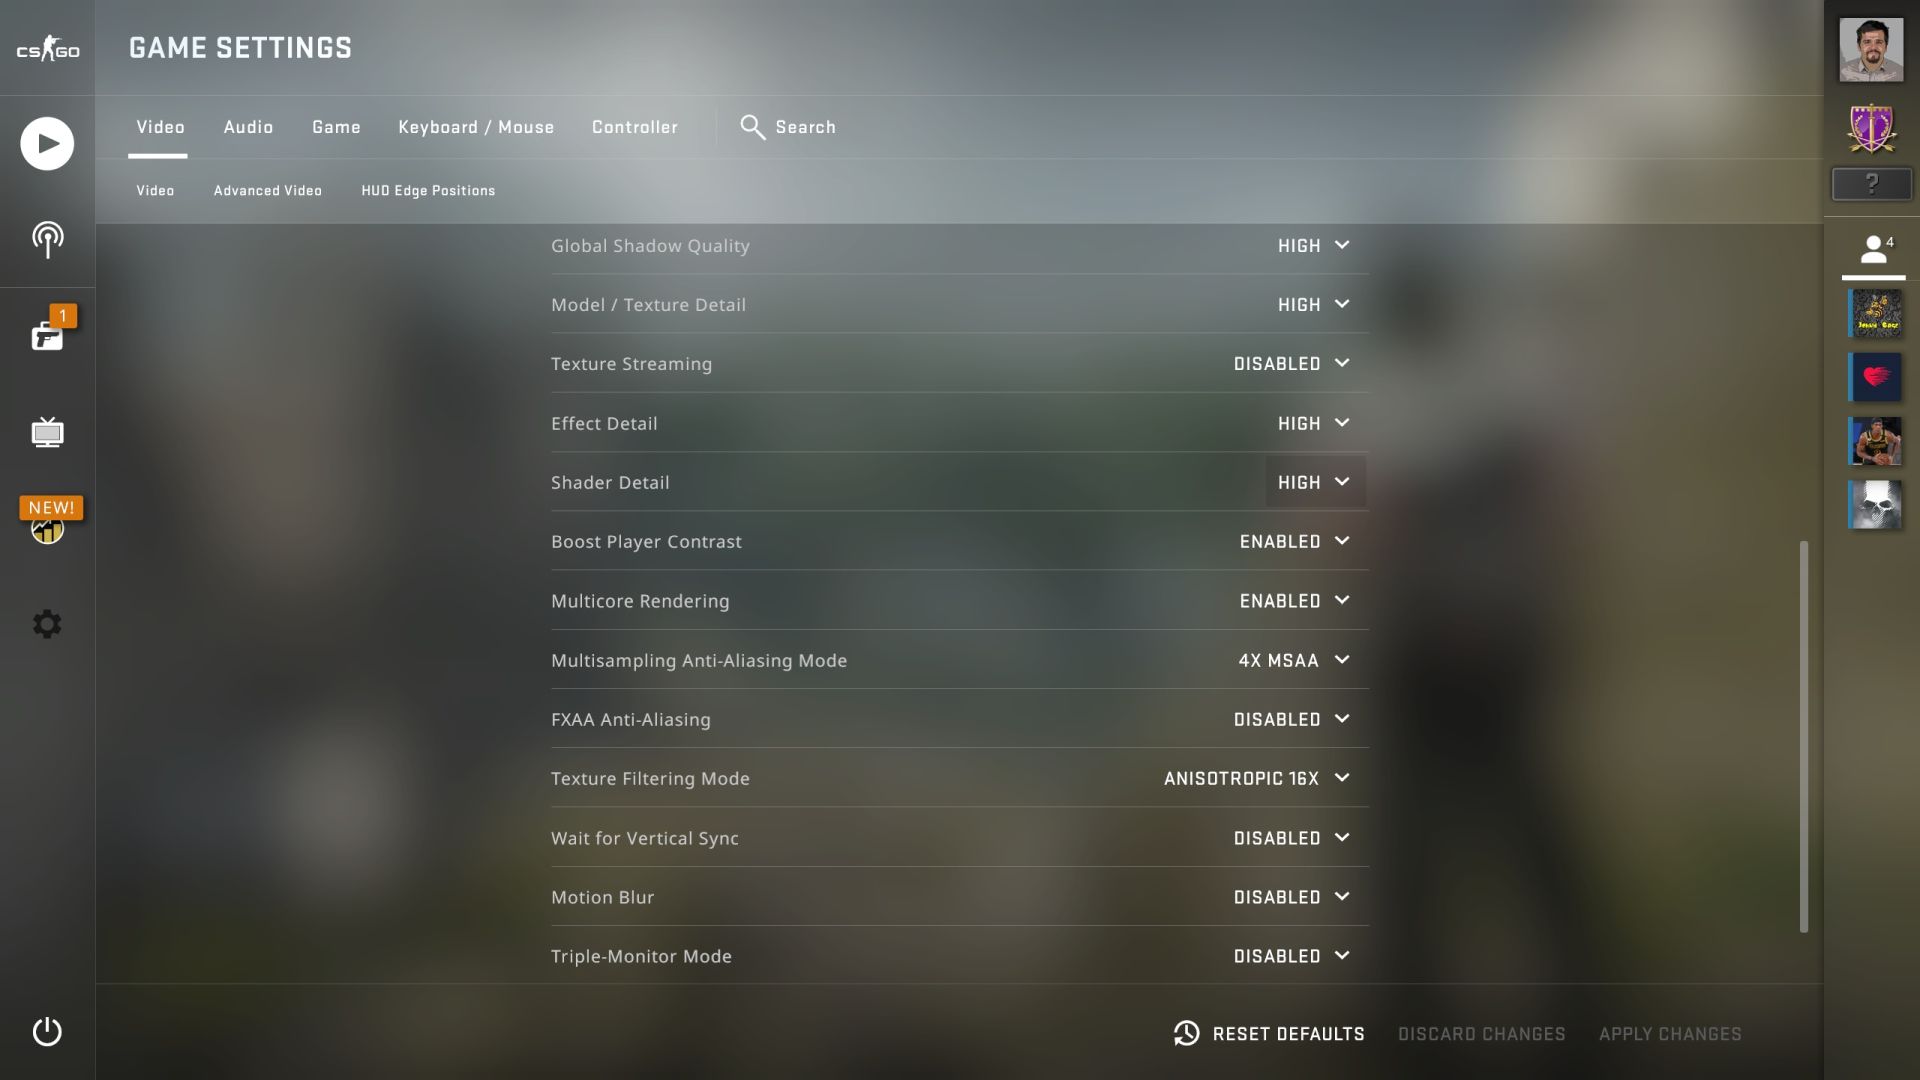
Test environment: resolution 2560 × 1440 px; high graphics settings; 4× MSAA, API DirectX 9; Test platform script with Dust 2 map tour.
Test environment: resolution 3840 × 2160 px; very high graphics settings; 4× MSAA, API DirectX 9; Test platform script with Dust 2 map tour.
The third and final Intel Core i5-13400F CPU test with measurements beyond standard will add to what the previous two have shown. We ran the two existing steppings – B0 (with Raptor Cove/Raptor Lake P cores) and C0 (Golden Cove/Alder Lake) – through all the games we use to test processors, in four different display setups. In the case of stepping B0 even with modified CPU settings, with E cores disabled.
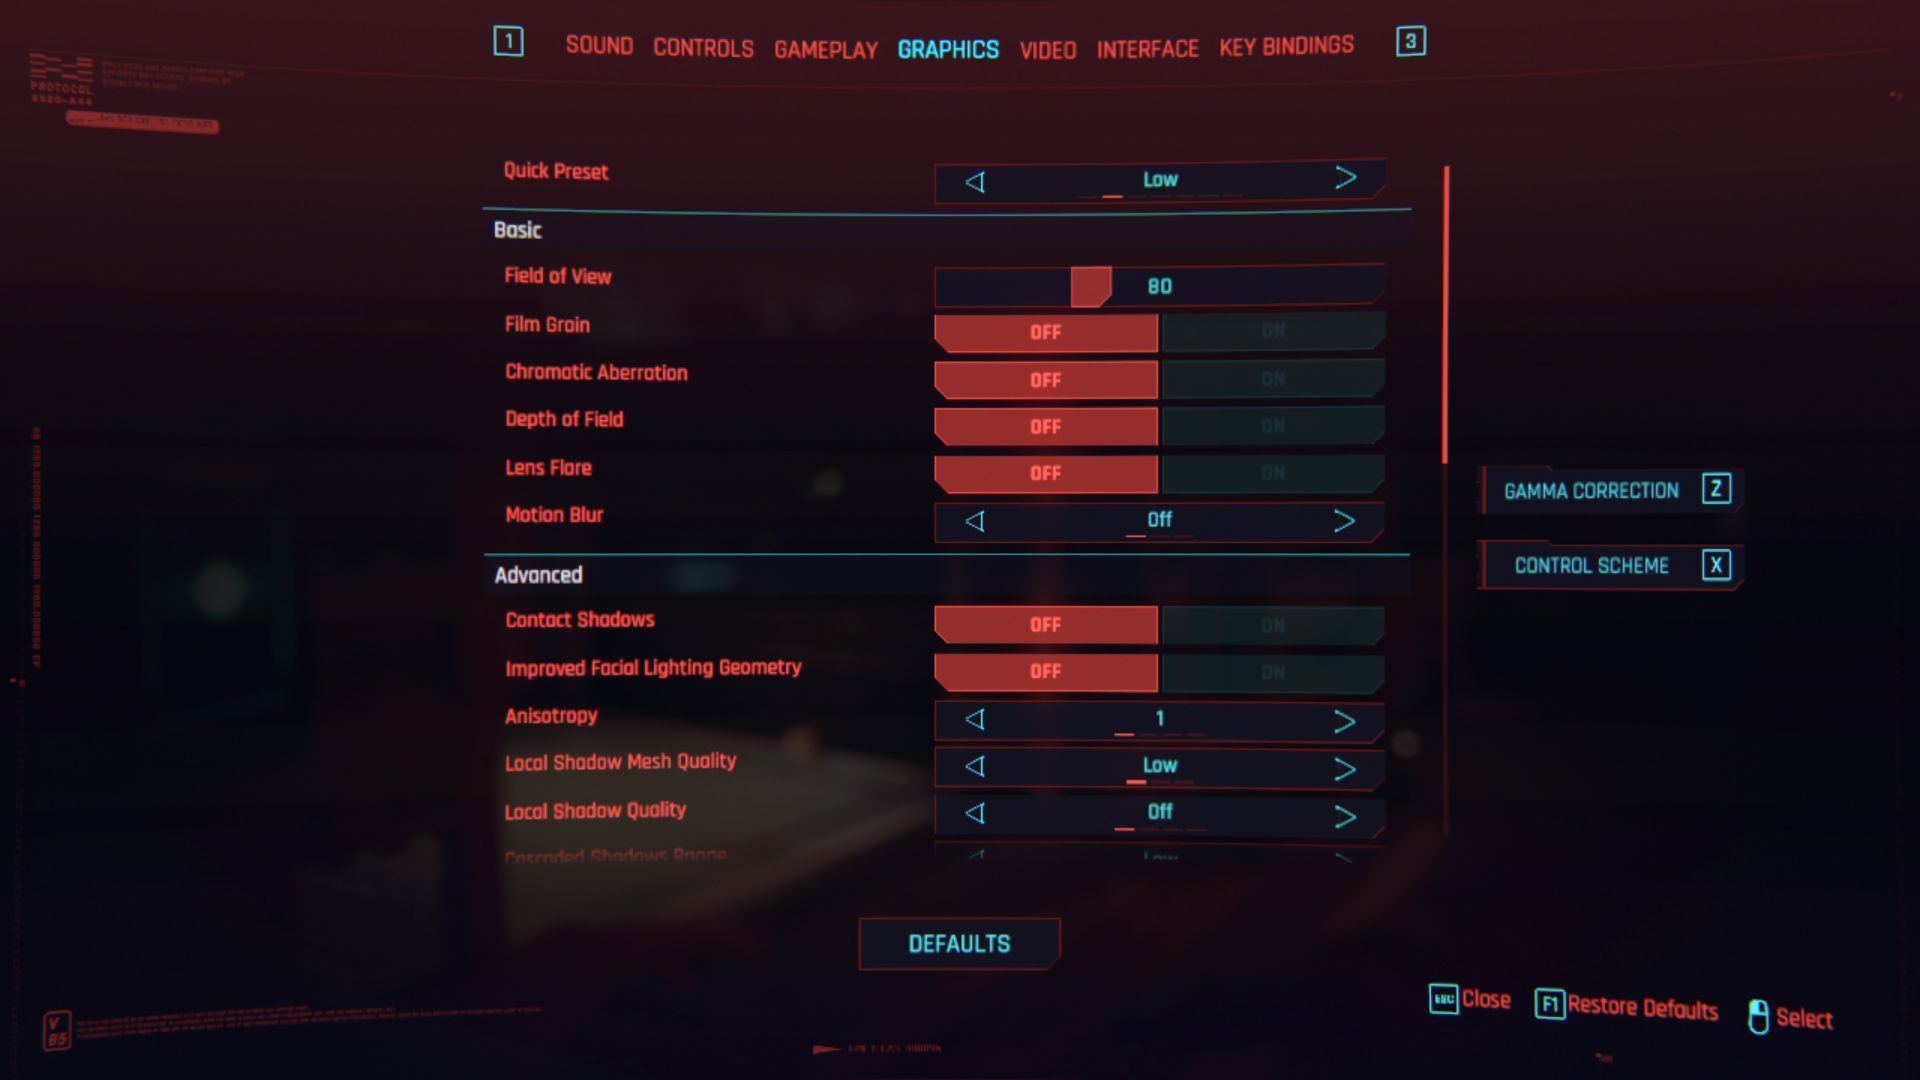
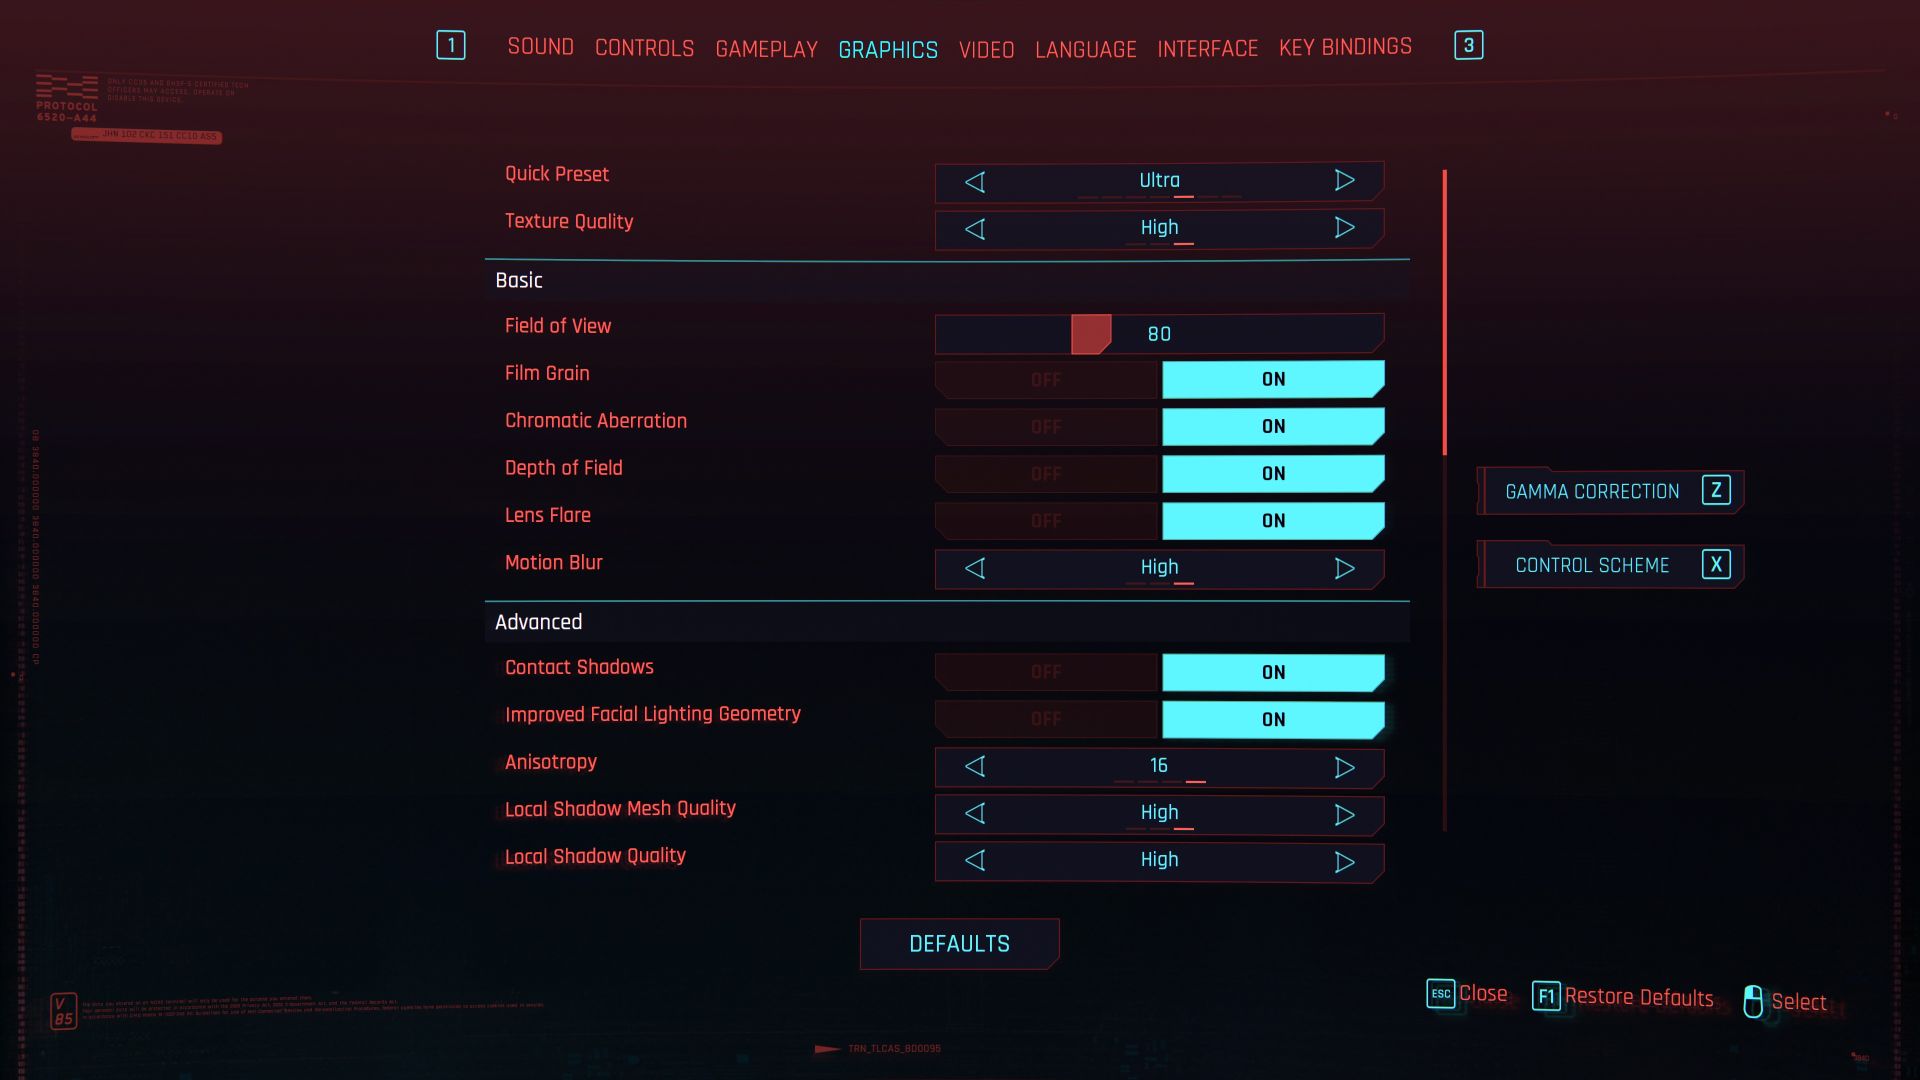
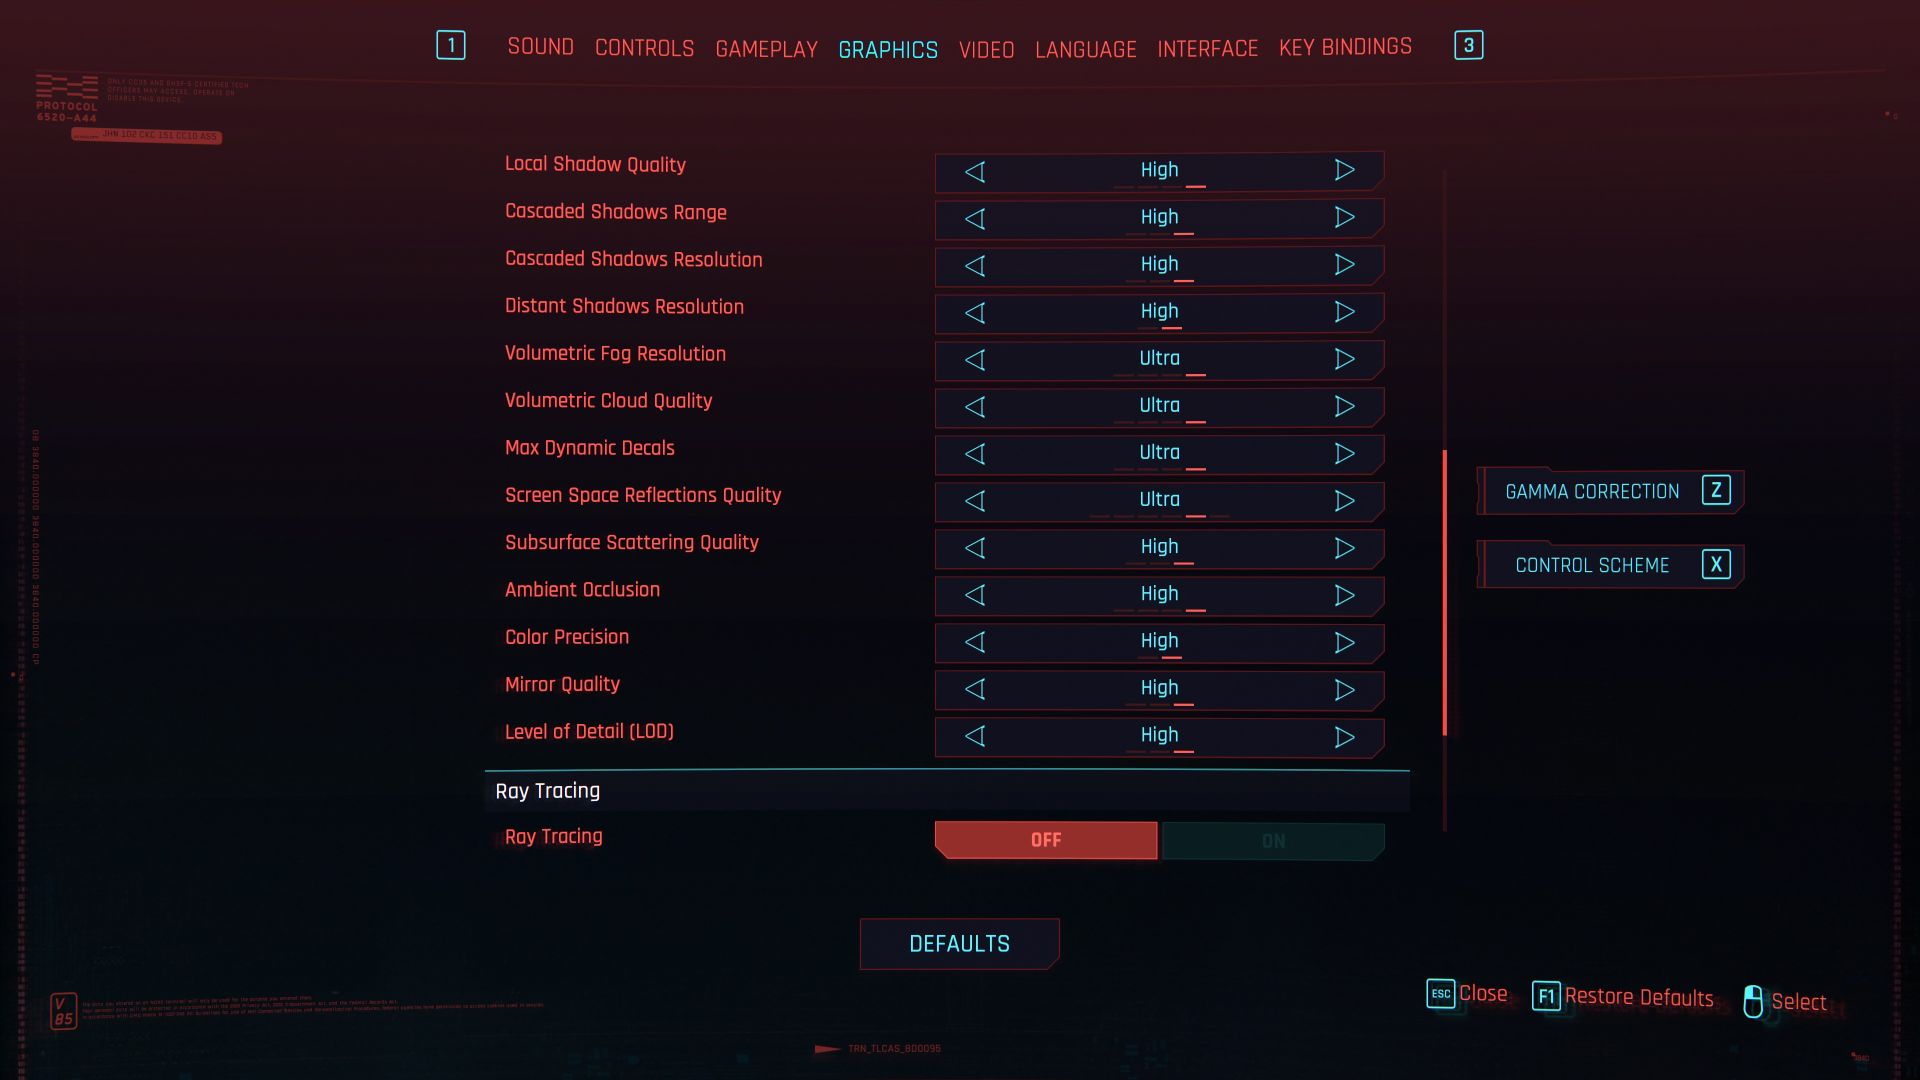
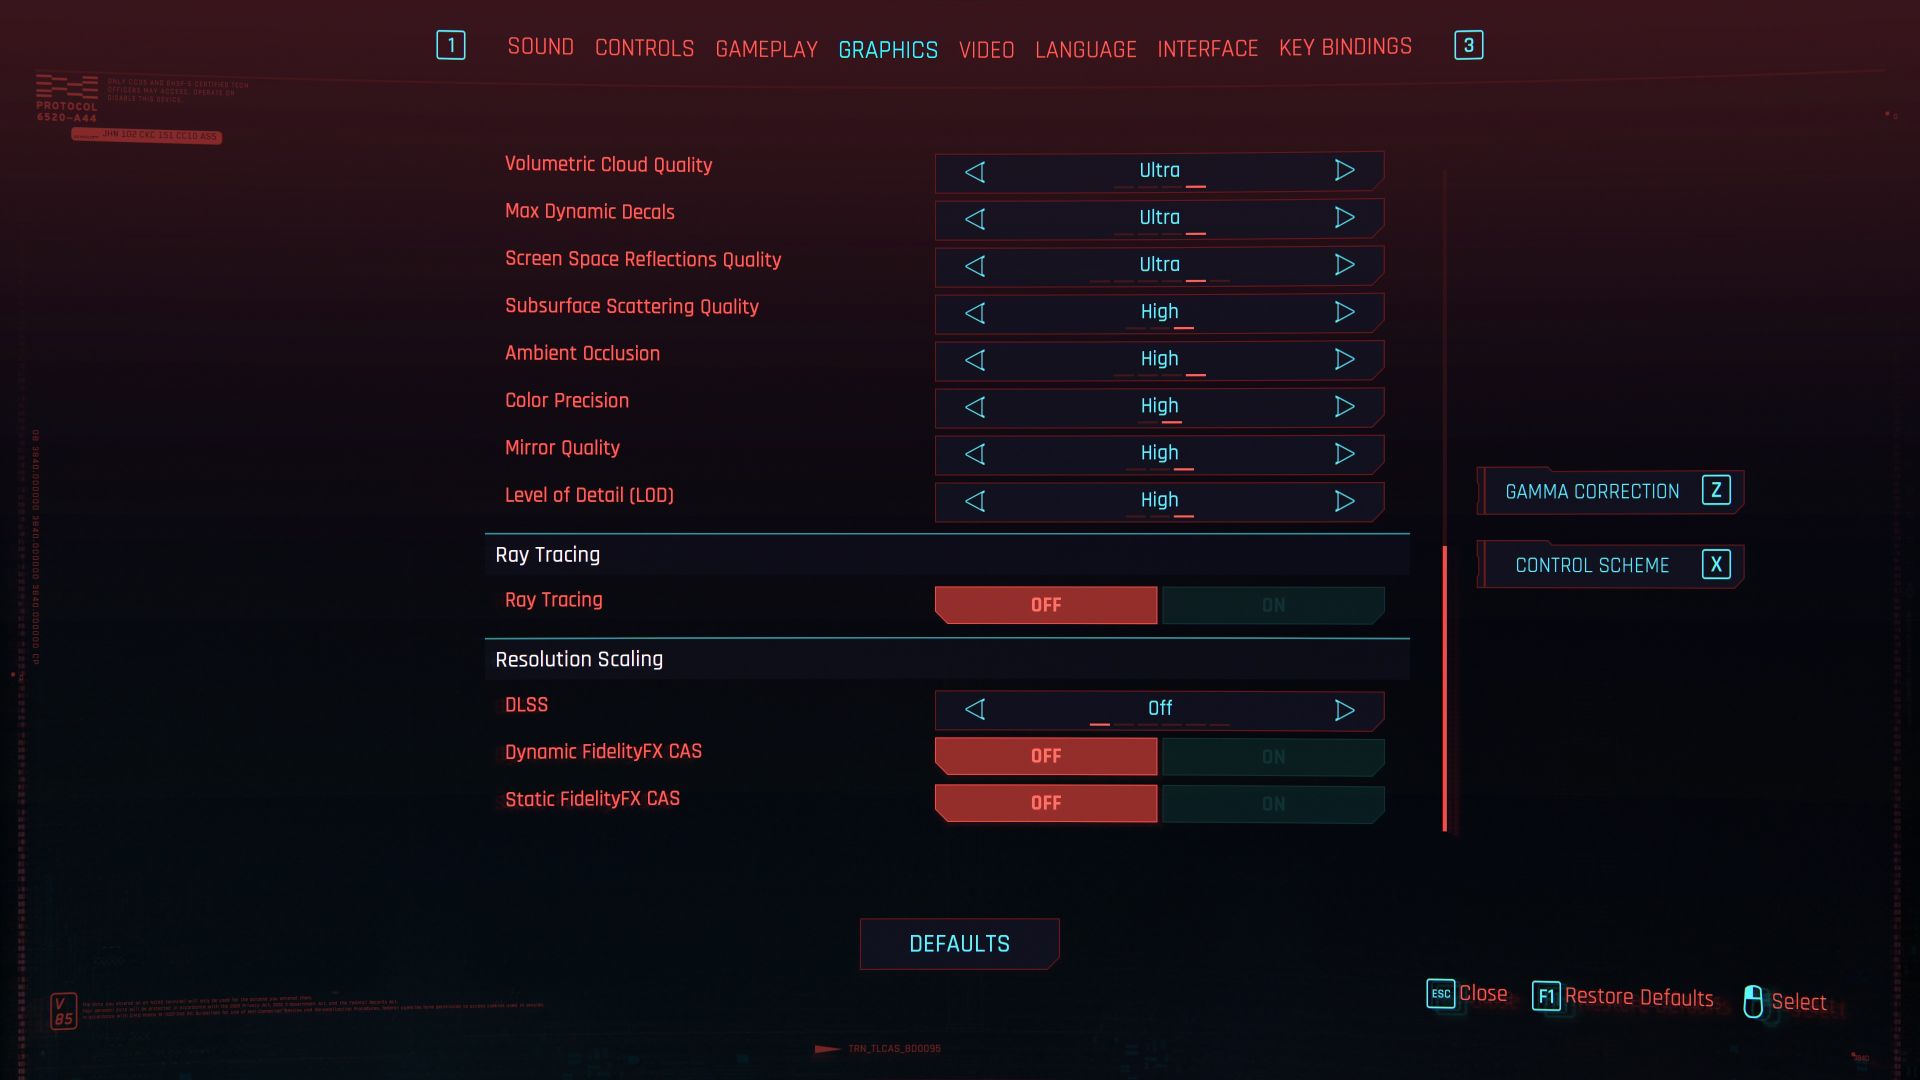
Cyberpunk 2077
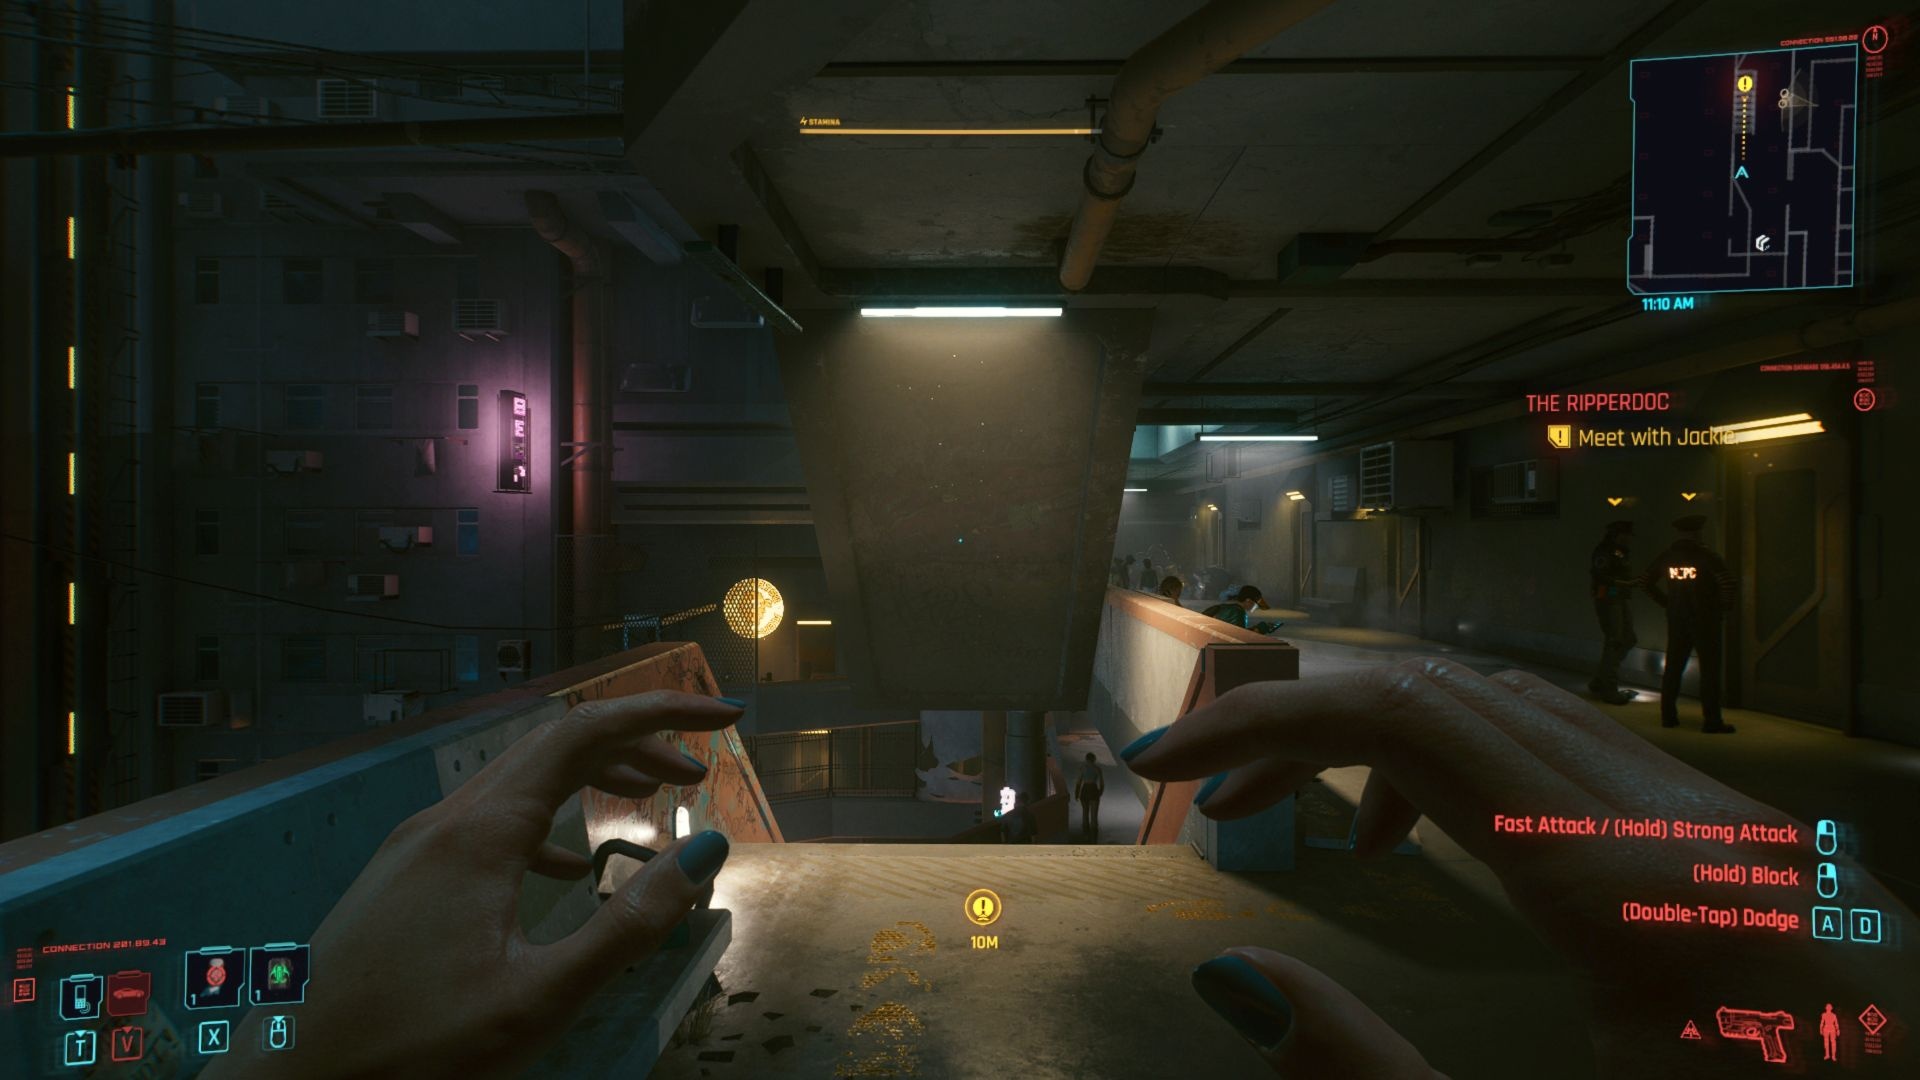
Test environment: resolution 1280 × 720 px; graphics settings preset Low; API DirectX 12; no extra settings; test scene: custom (Little China)
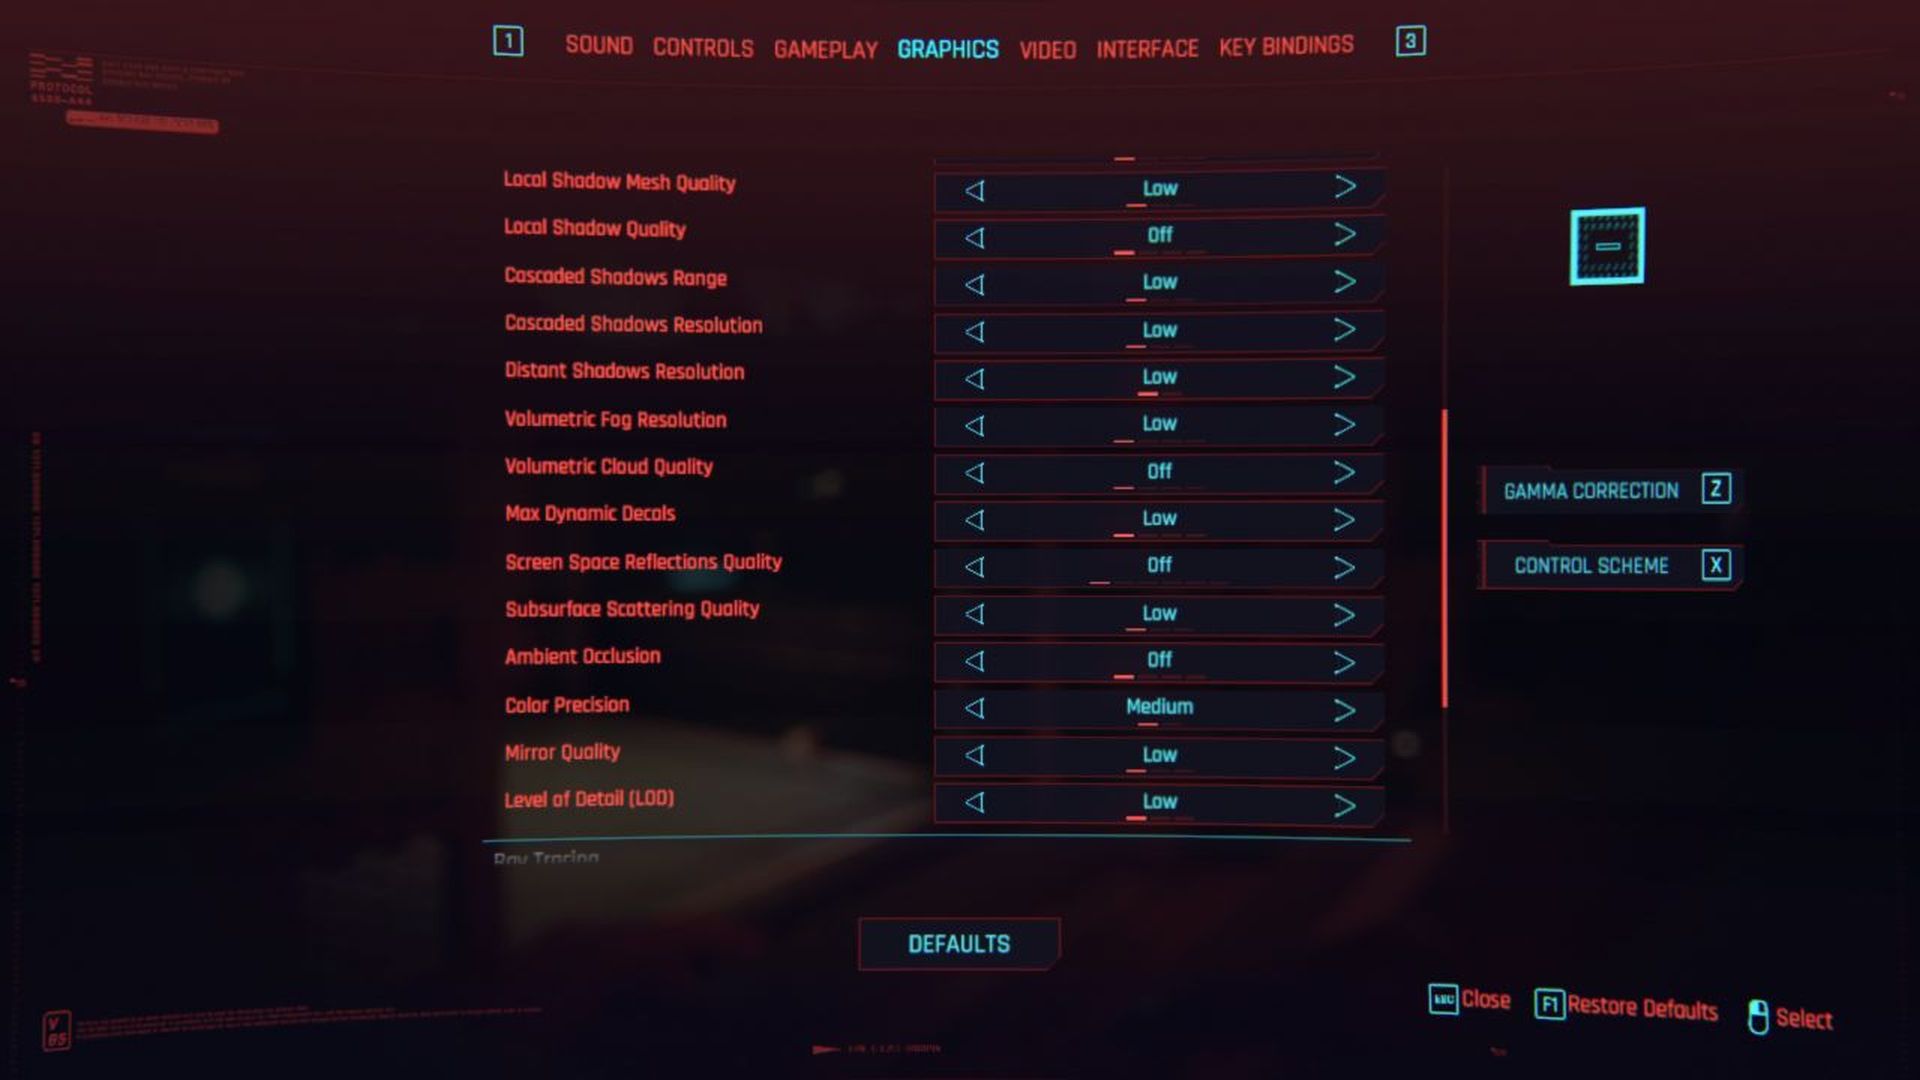

Test environment: resolution 1920 × 1080 px; graphics settings preset High; API DirectX 12; no extra settings; test scene: custom (Little China).
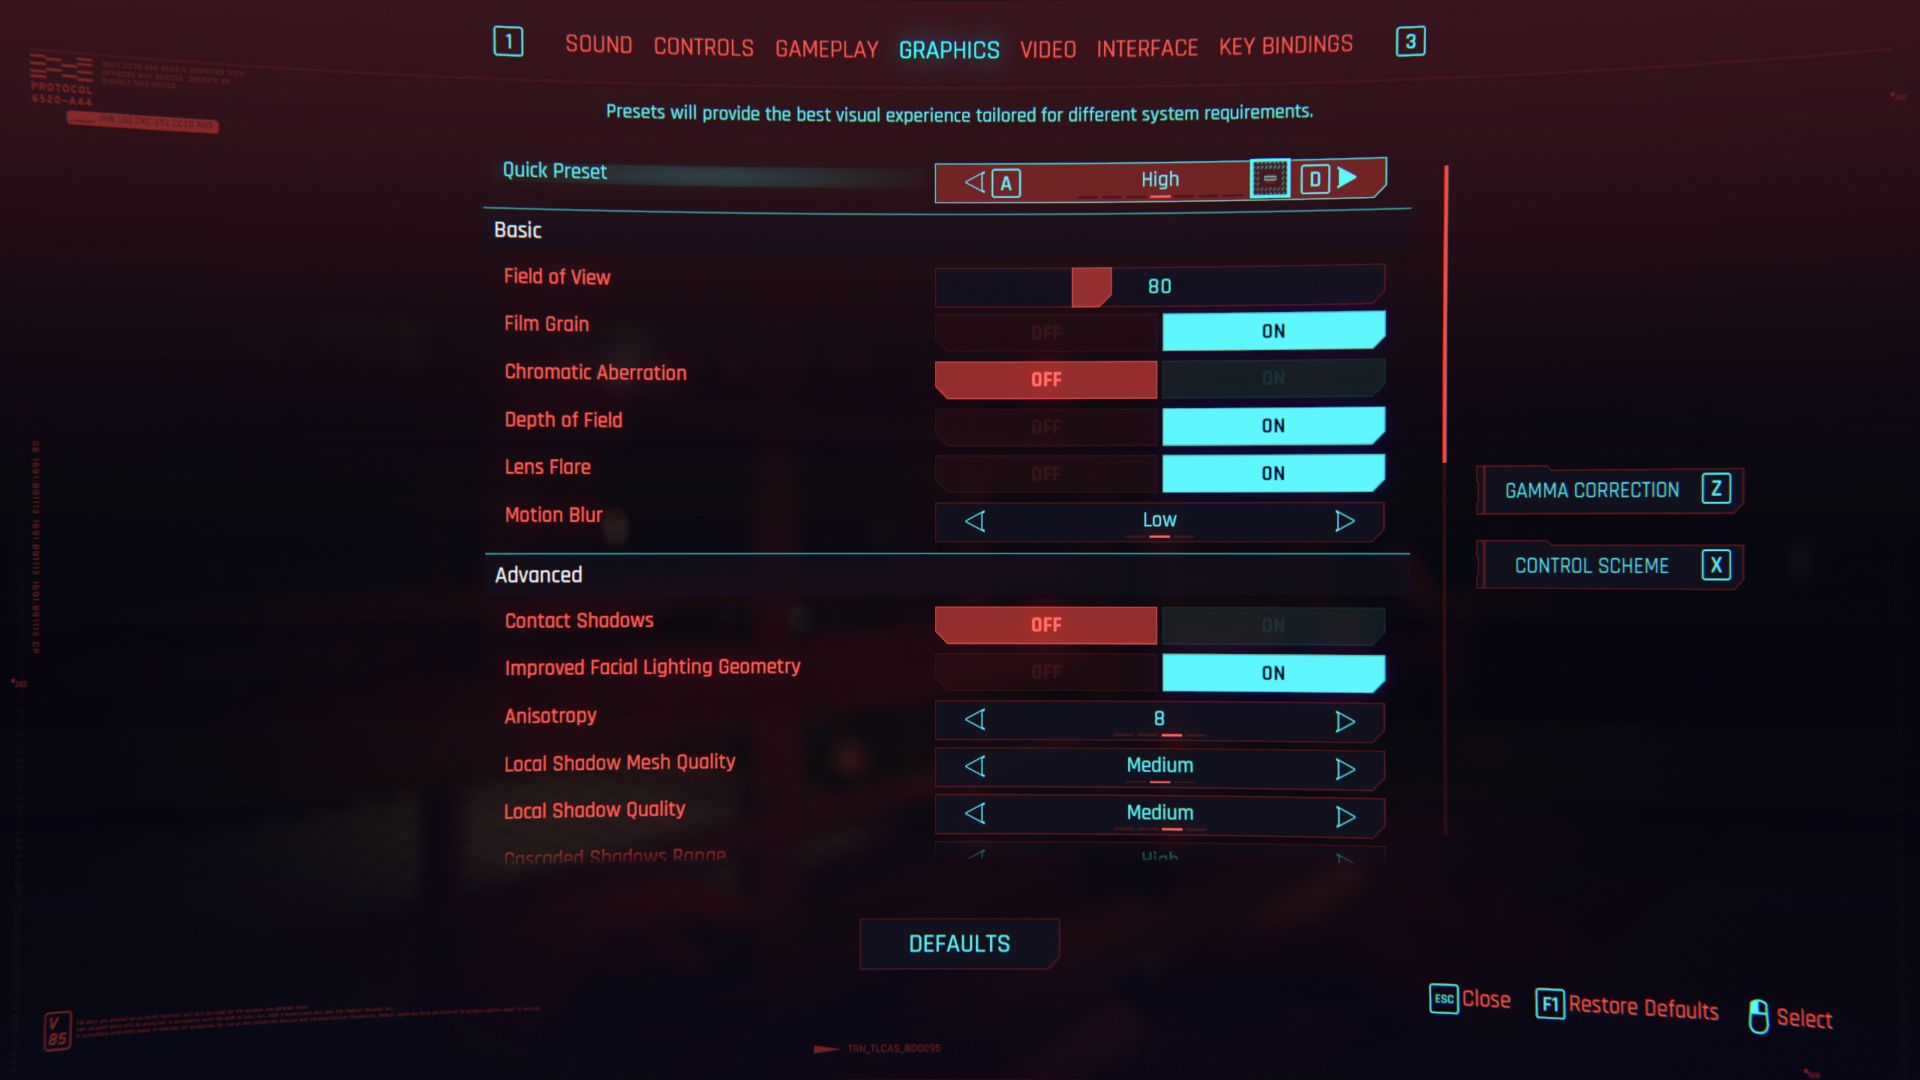

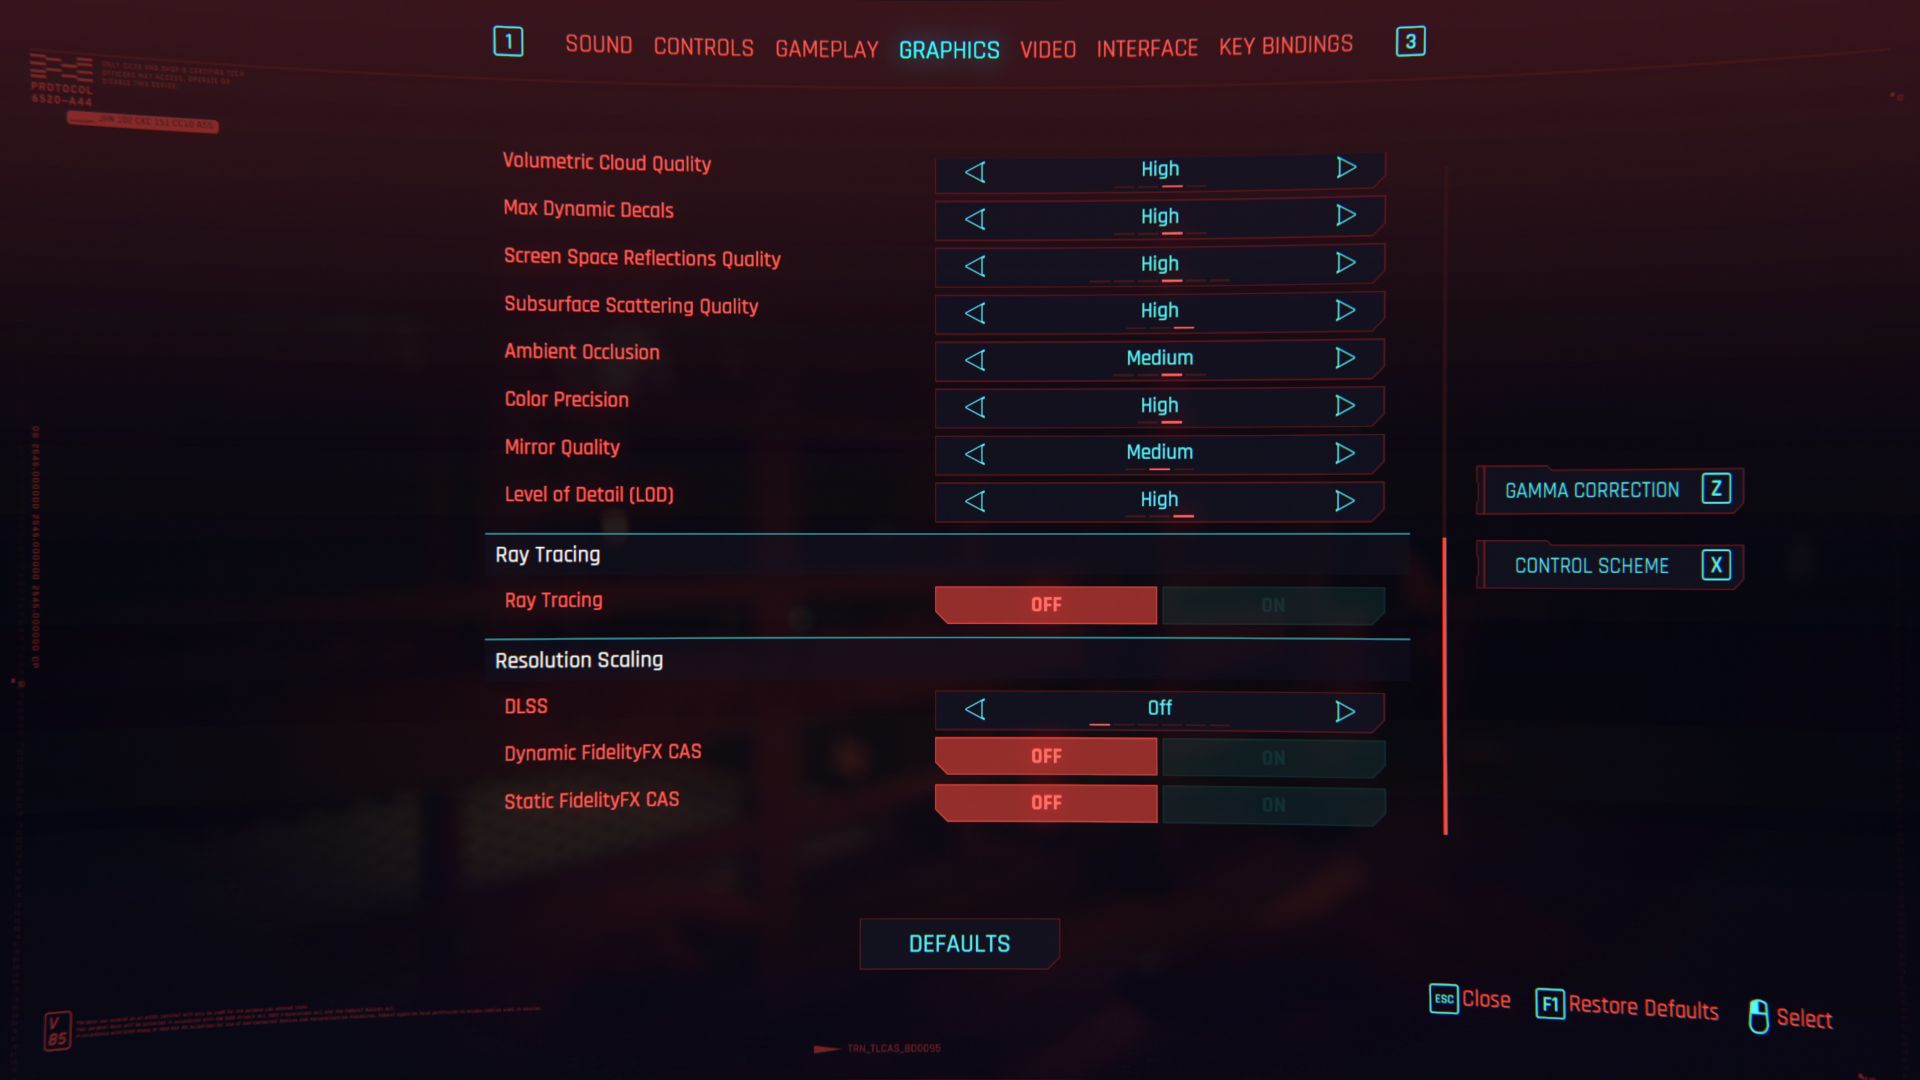
Test environment: resolution 2560 × 1440 px; graphics settings preset High; API DirectX 12; no extra settings; test scene: custom (Little China).
Test environment: resolution 3840 × 2160 px; graphics settings preset Ultra; API DirectX 12; no extra settings; test scene: custom (Little China).
The third and final Intel Core i5-13400F CPU test with measurements beyond standard will add to what the previous two have shown. We ran the two existing steppings – B0 (with Raptor Cove/Raptor Lake P cores) and C0 (Golden Cove/Alder Lake) – through all the games we use to test processors, in four different display setups. In the case of stepping B0 even with modified CPU settings, with E cores disabled.
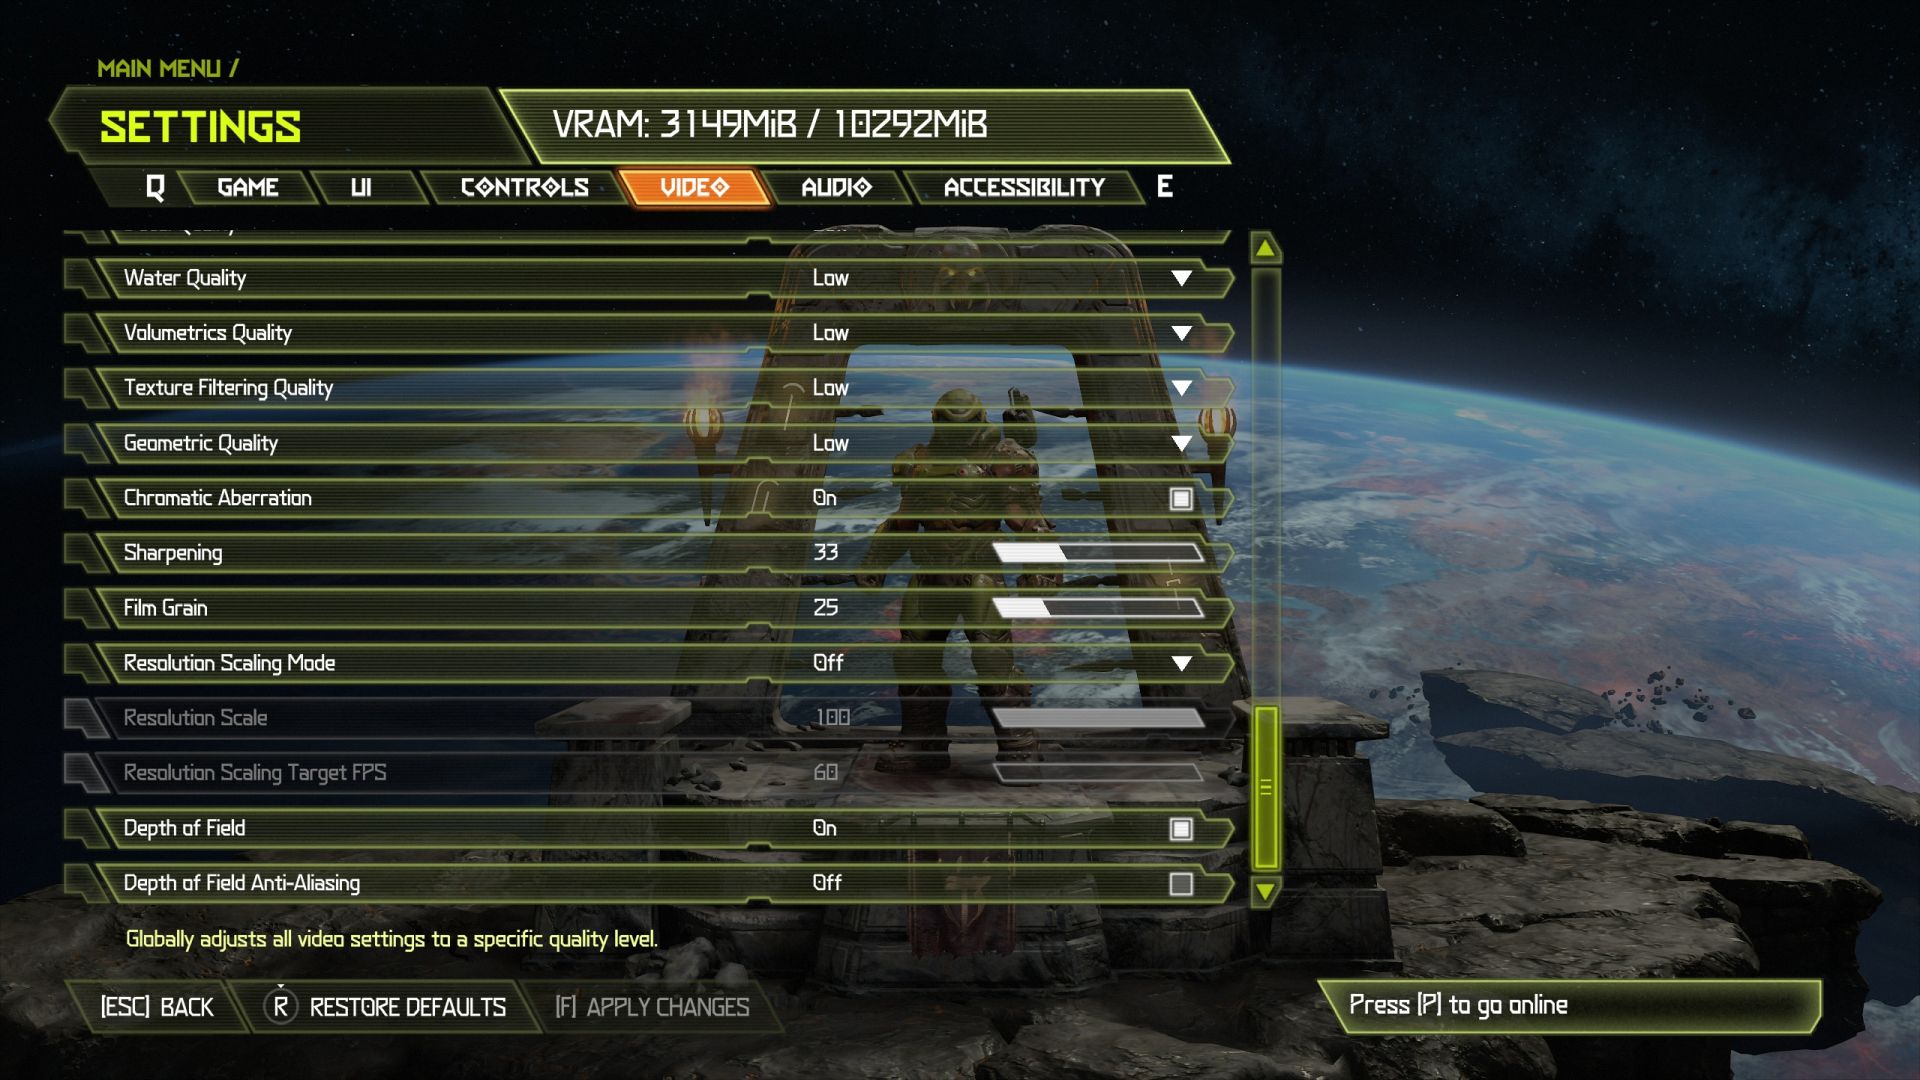
DOOM Eternal

Test environment: resolution 1280 × 720 px; graphics settings preset Low; API Vulkan; extra settings Present From Compute: off, Motion Blur: Low, Depth of Field Anti-Aliasing: off; test scene: custom.
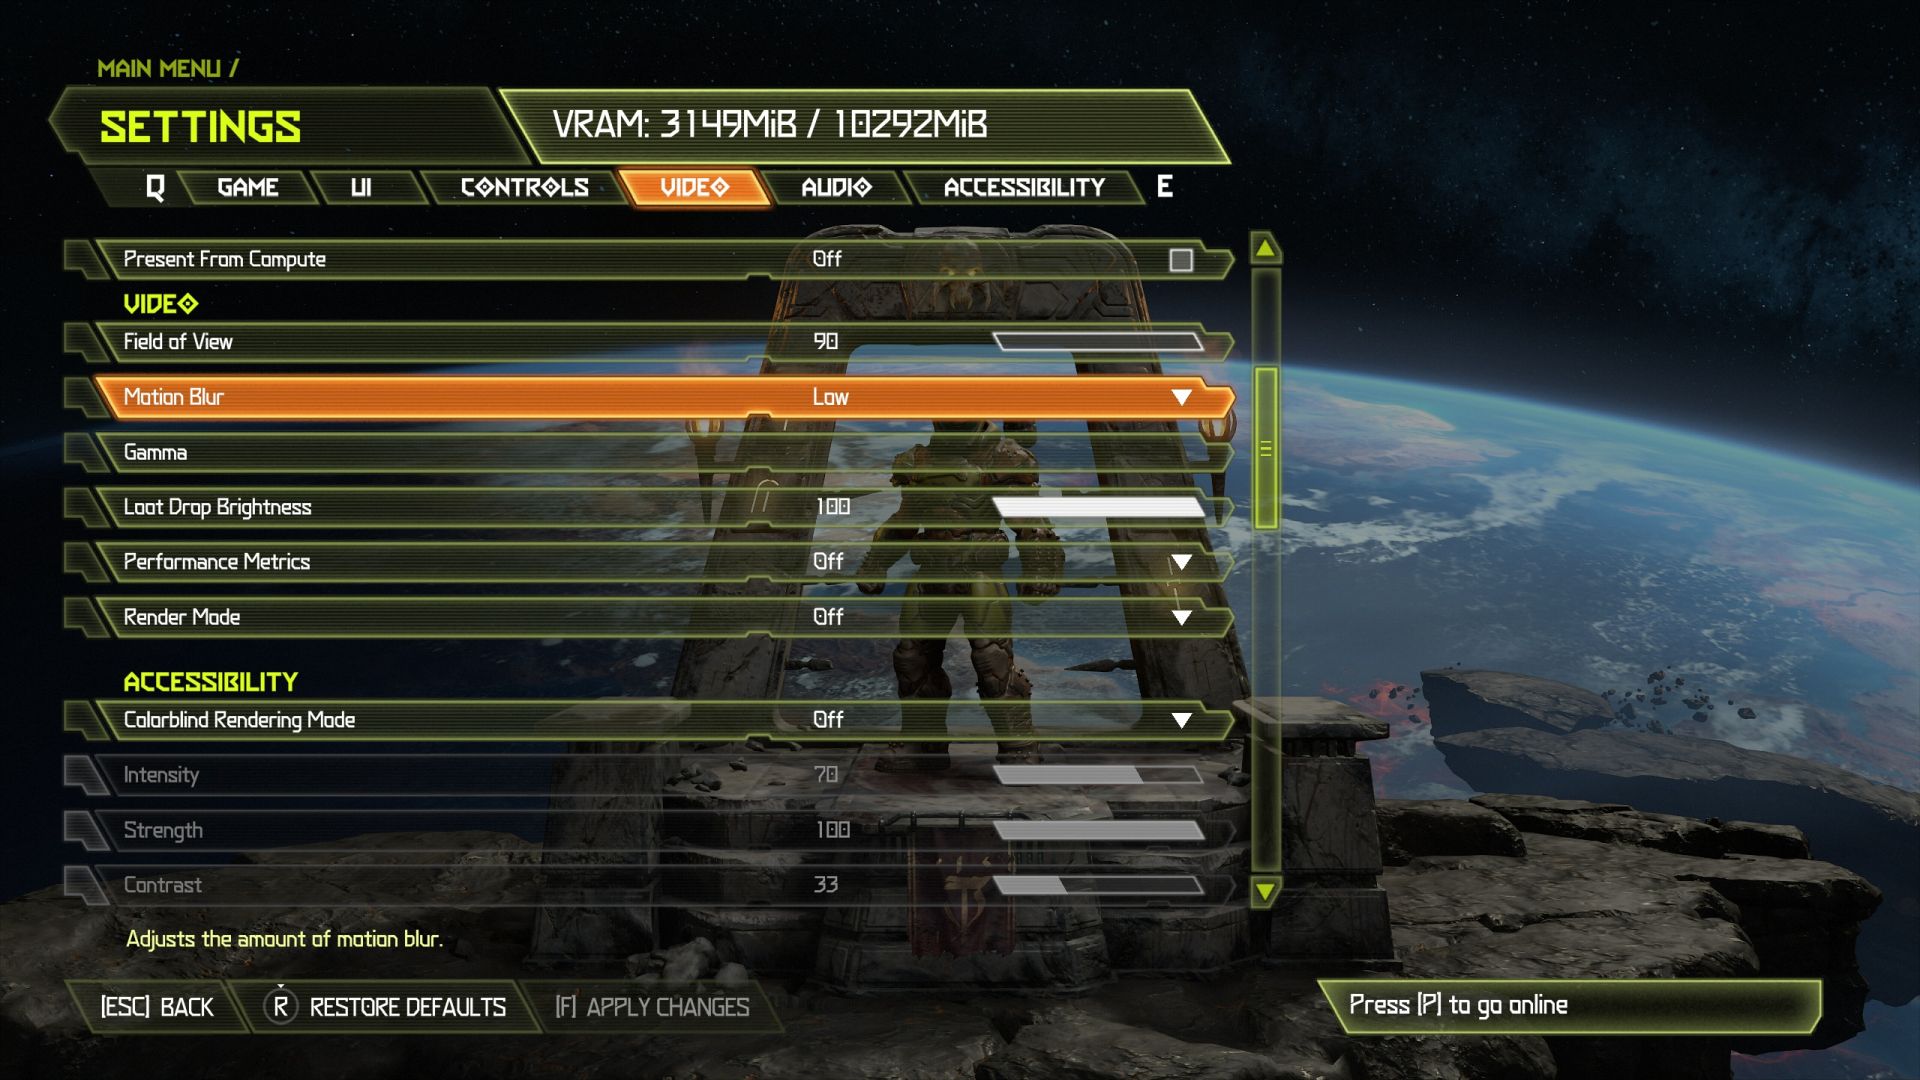
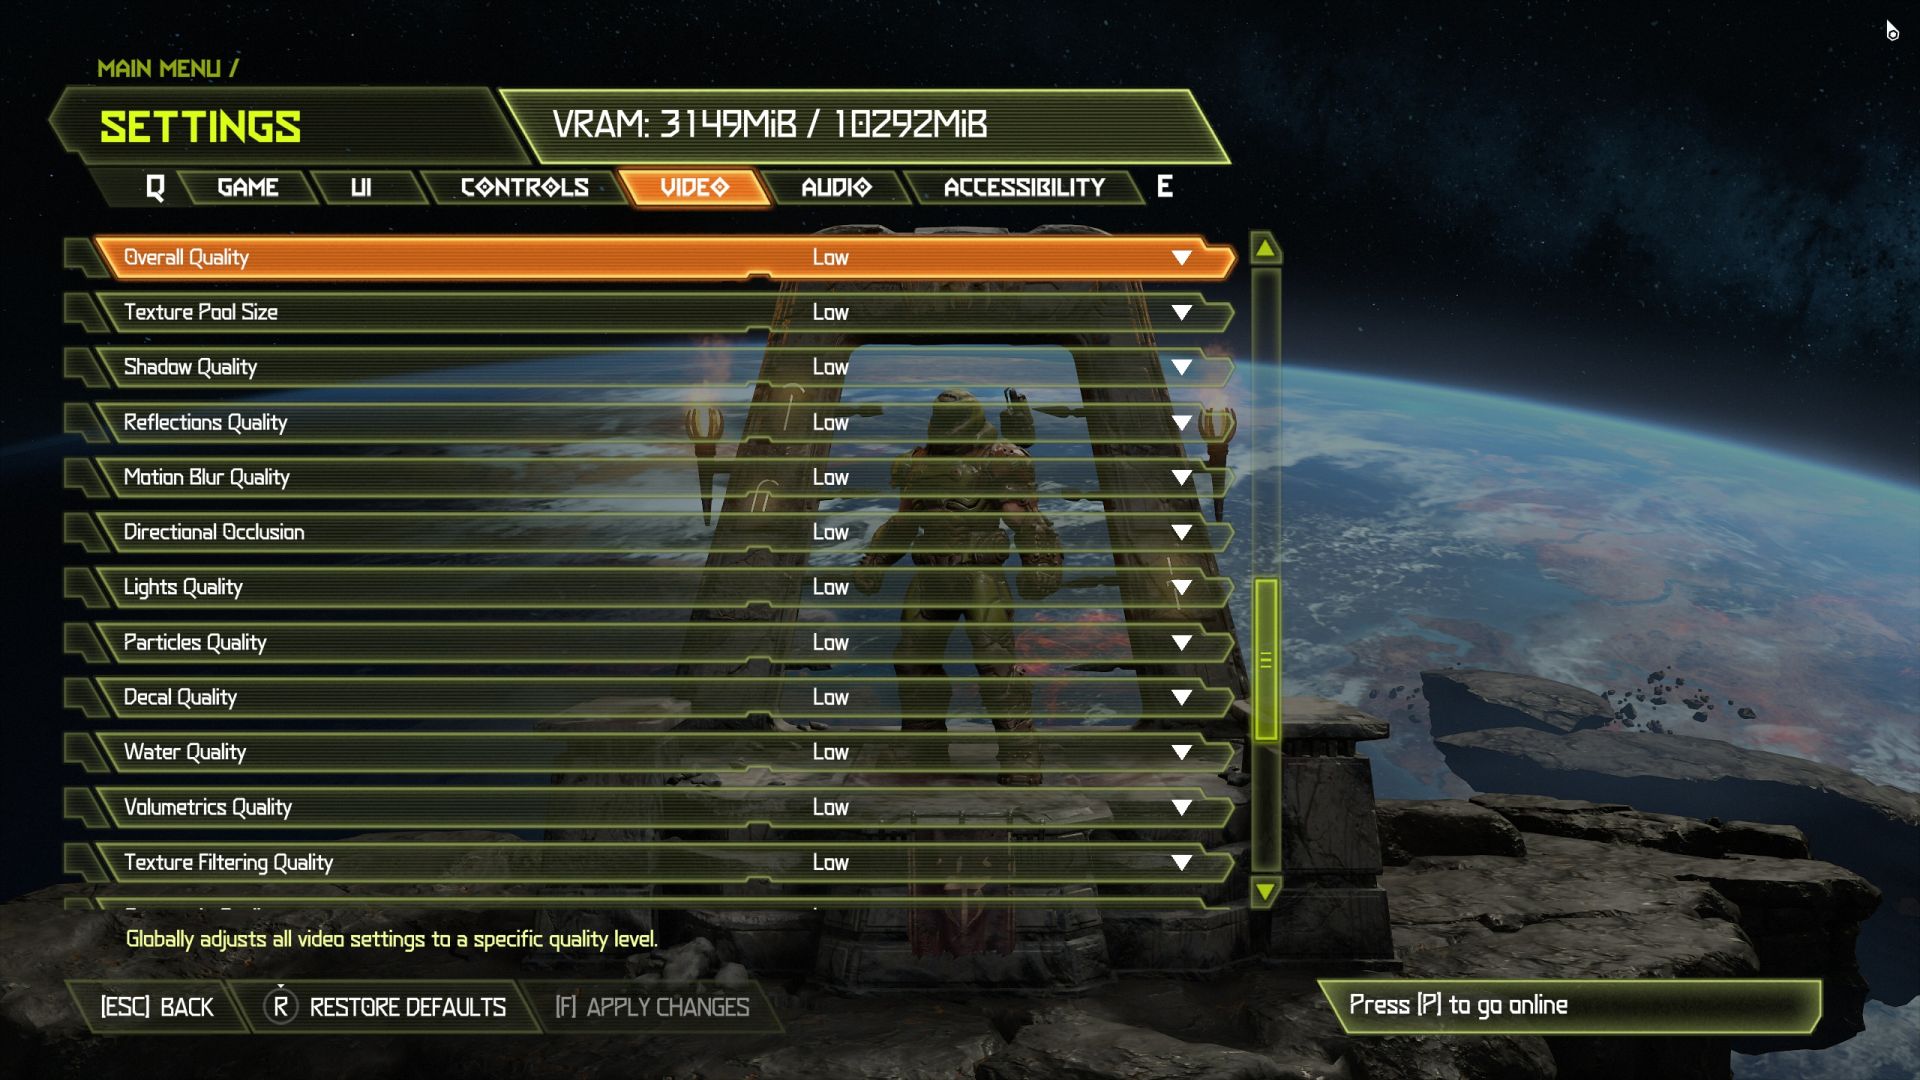
Test environment: resolution 1920 × 1080 px; graphics settings preset High; API Vulkan; extra settings Present From Compute: on, Motion Blur: High, Depth of Field Anti-Aliasing: off; test scene: custom.

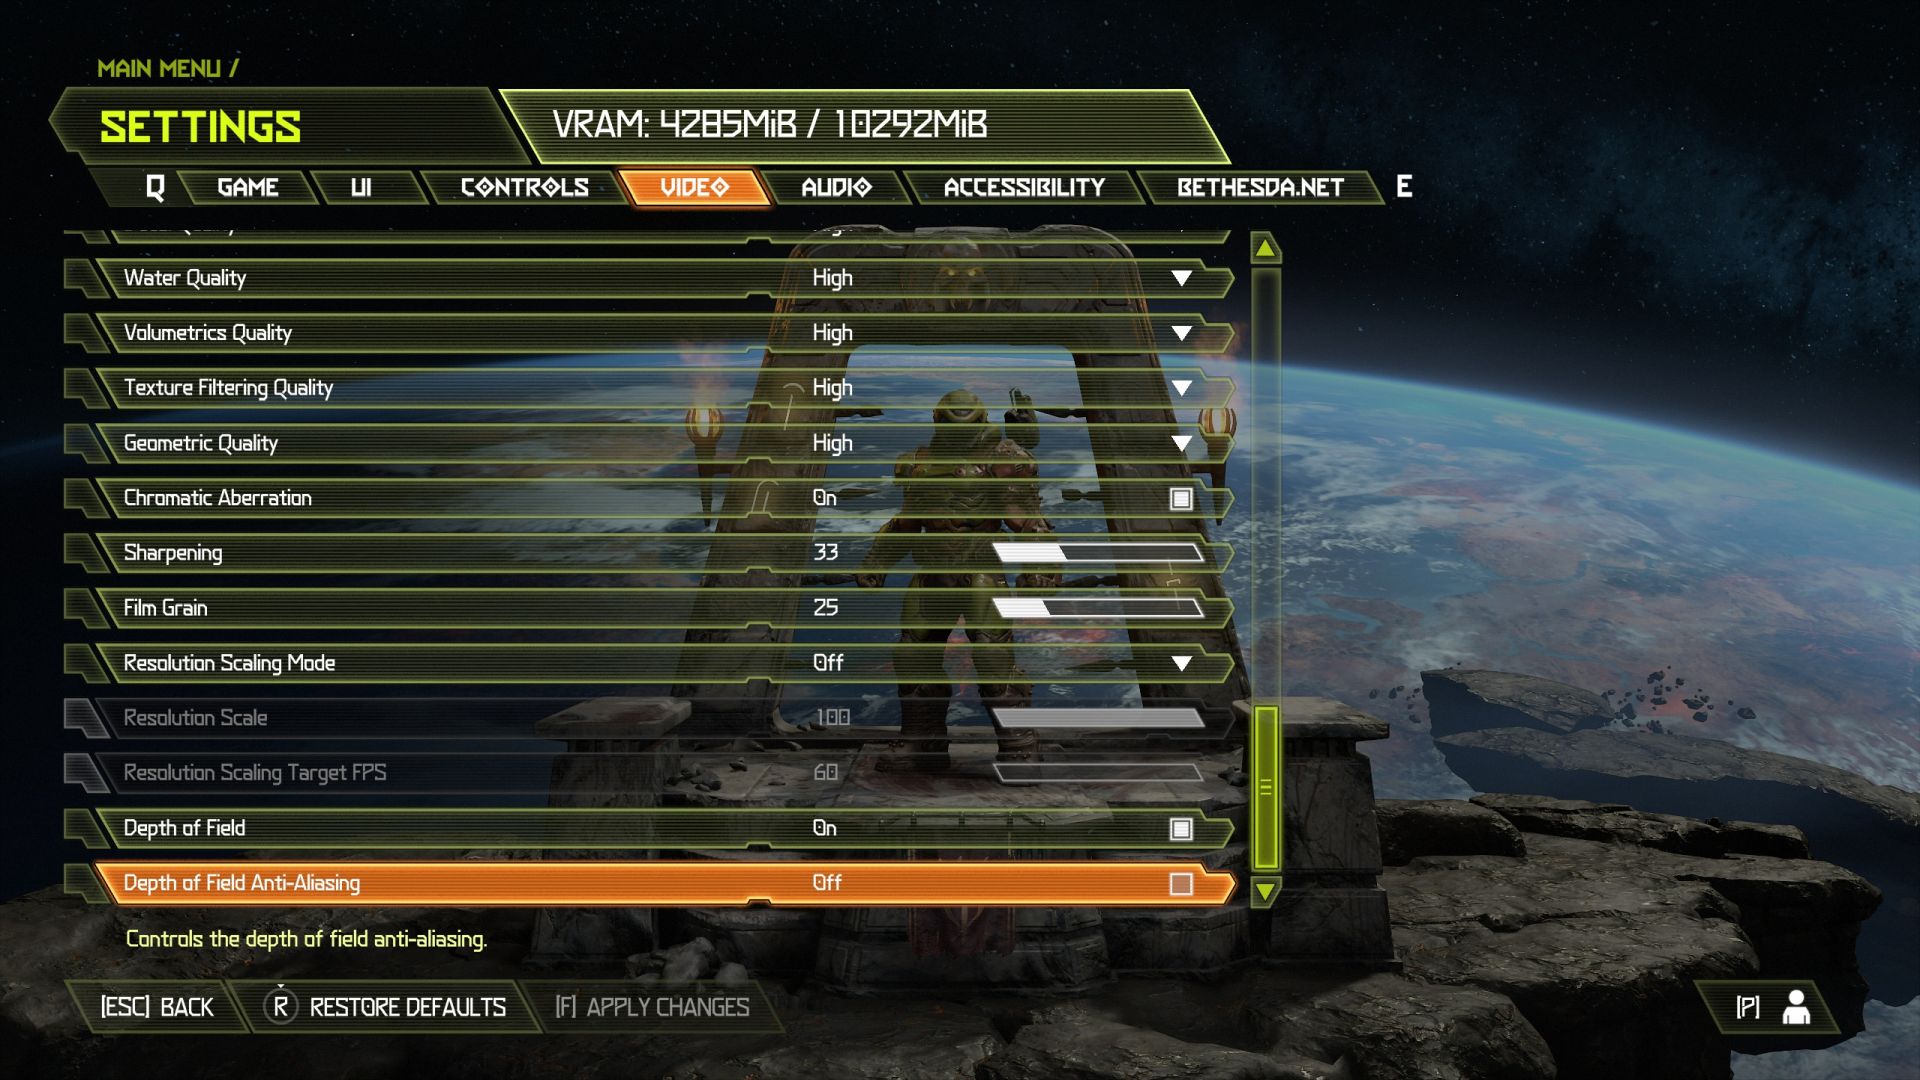
Test environment: resolution 2560 × 1440 px; graphics settings preset High; API Vulkan; extra settings Present From Compute: on, Motion Blur: High, Depth of Field Anti-Aliasing: on; test scene: custom.

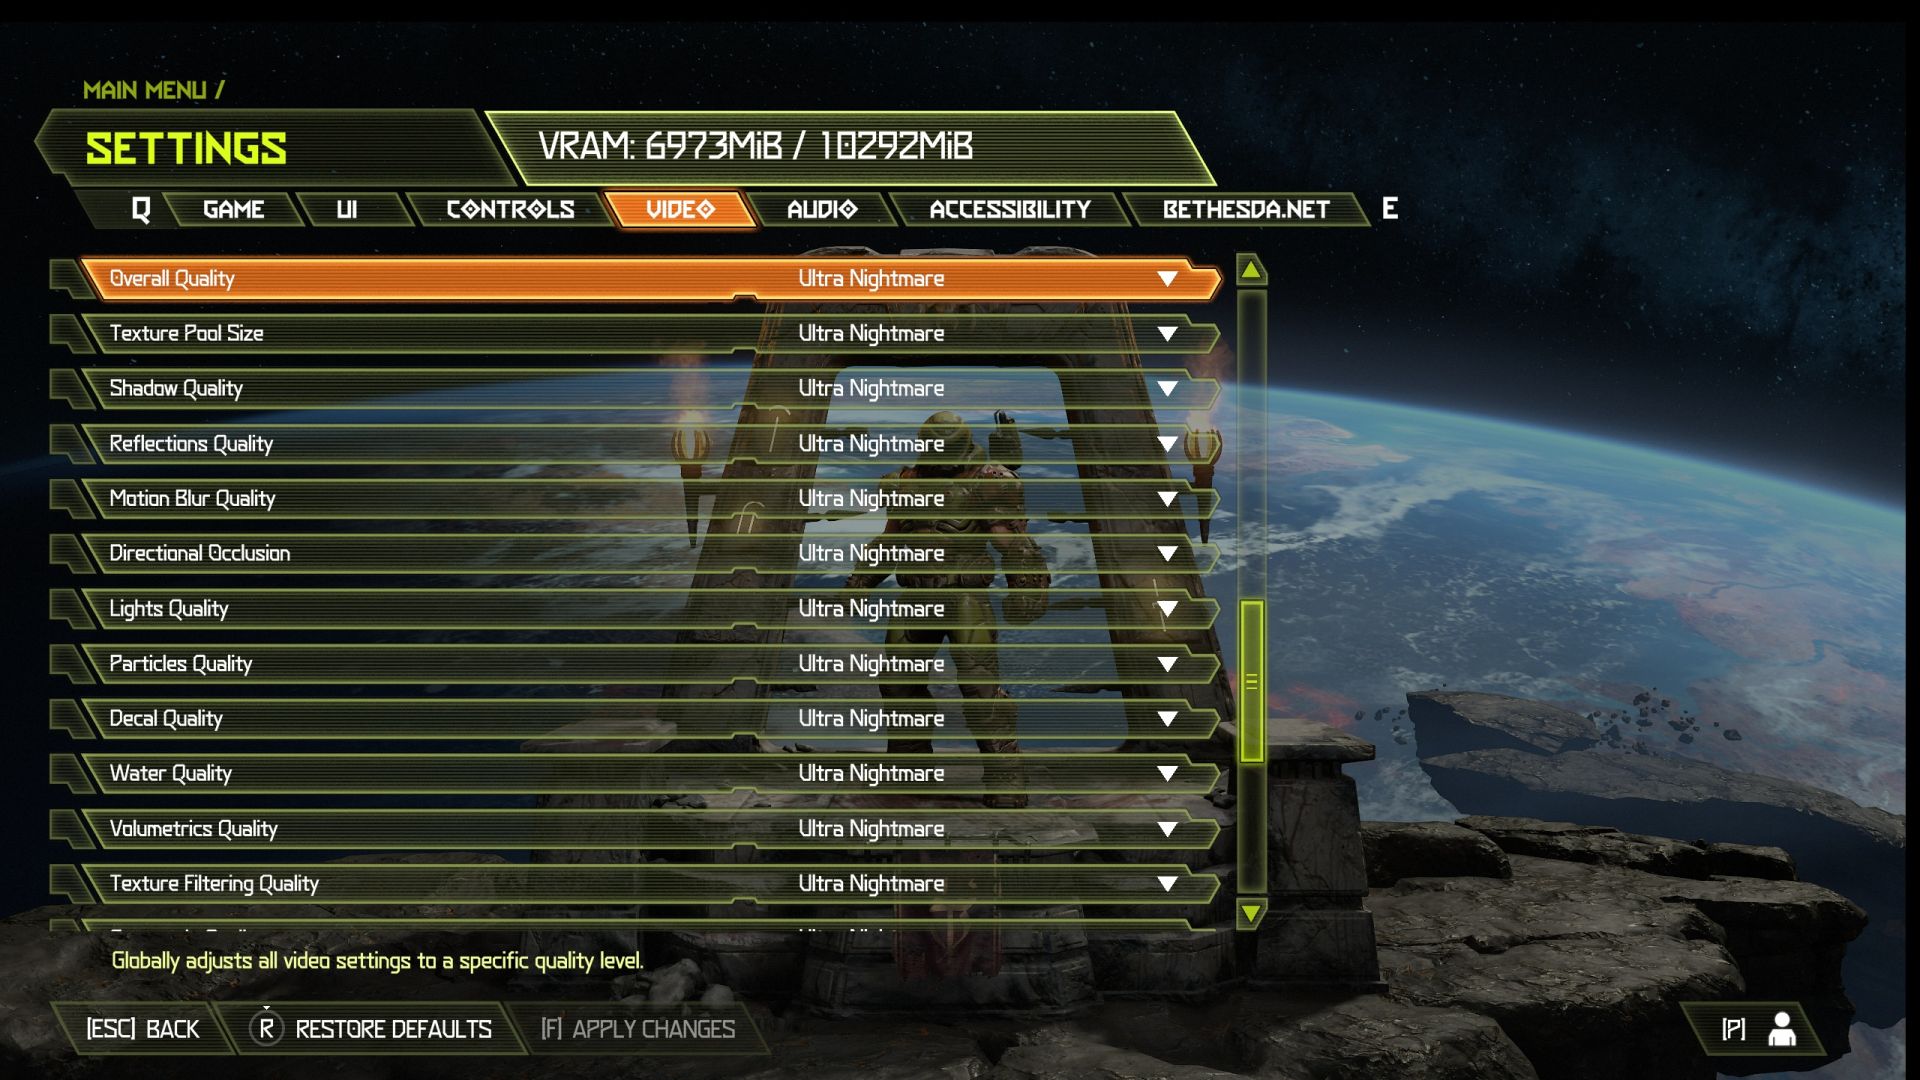
Test environment: resolution 3840 × 2160 px; graphics settings preset Ultra Nightmare; API Vulkan; extra settings Present From Compute: on, Motion Blur: High, Depth of Field Anti-Aliasing: on; test scene: custom.


The third and final Intel Core i5-13400F CPU test with measurements beyond standard will add to what the previous two have shown. We ran the two existing steppings – B0 (with Raptor Cove/Raptor Lake P cores) and C0 (Golden Cove/Alder Lake) – through all the games we use to test processors, in four different display setups. In the case of stepping B0 even with modified CPU settings, with E cores disabled.
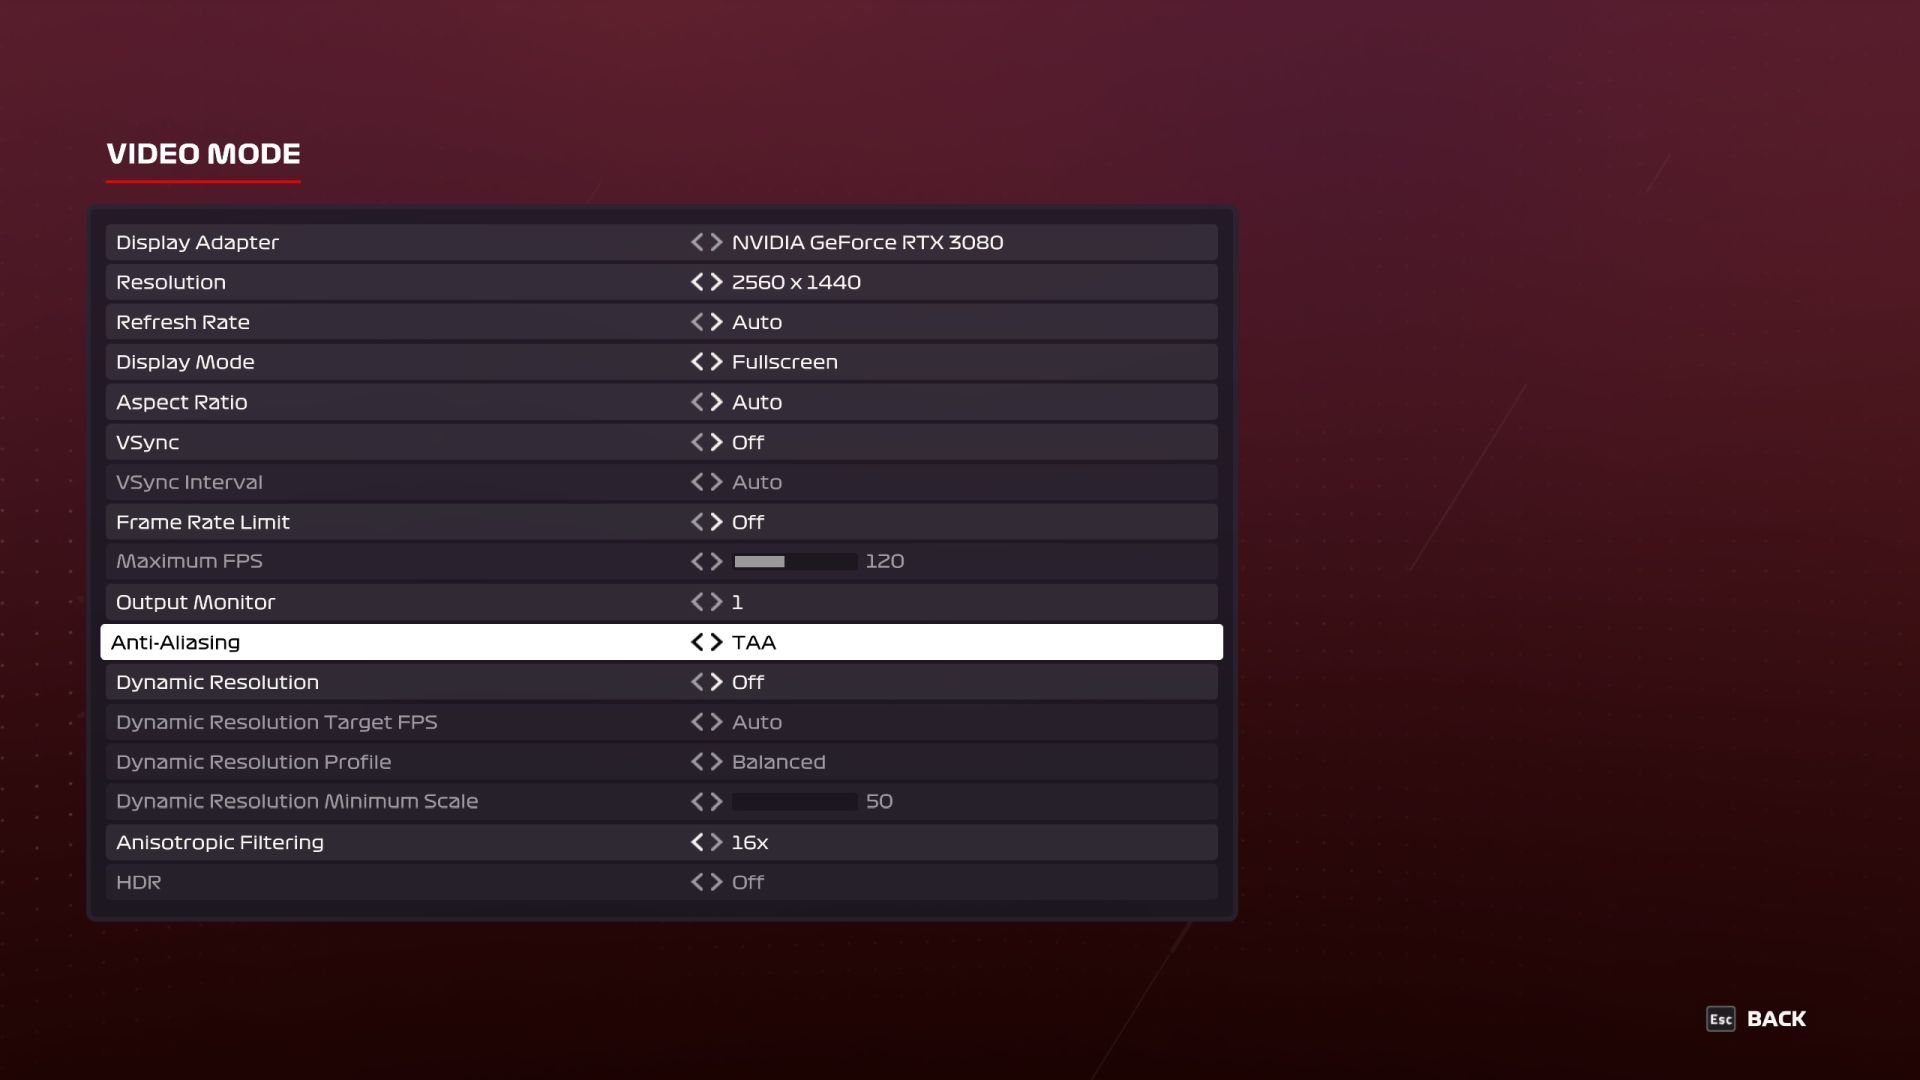
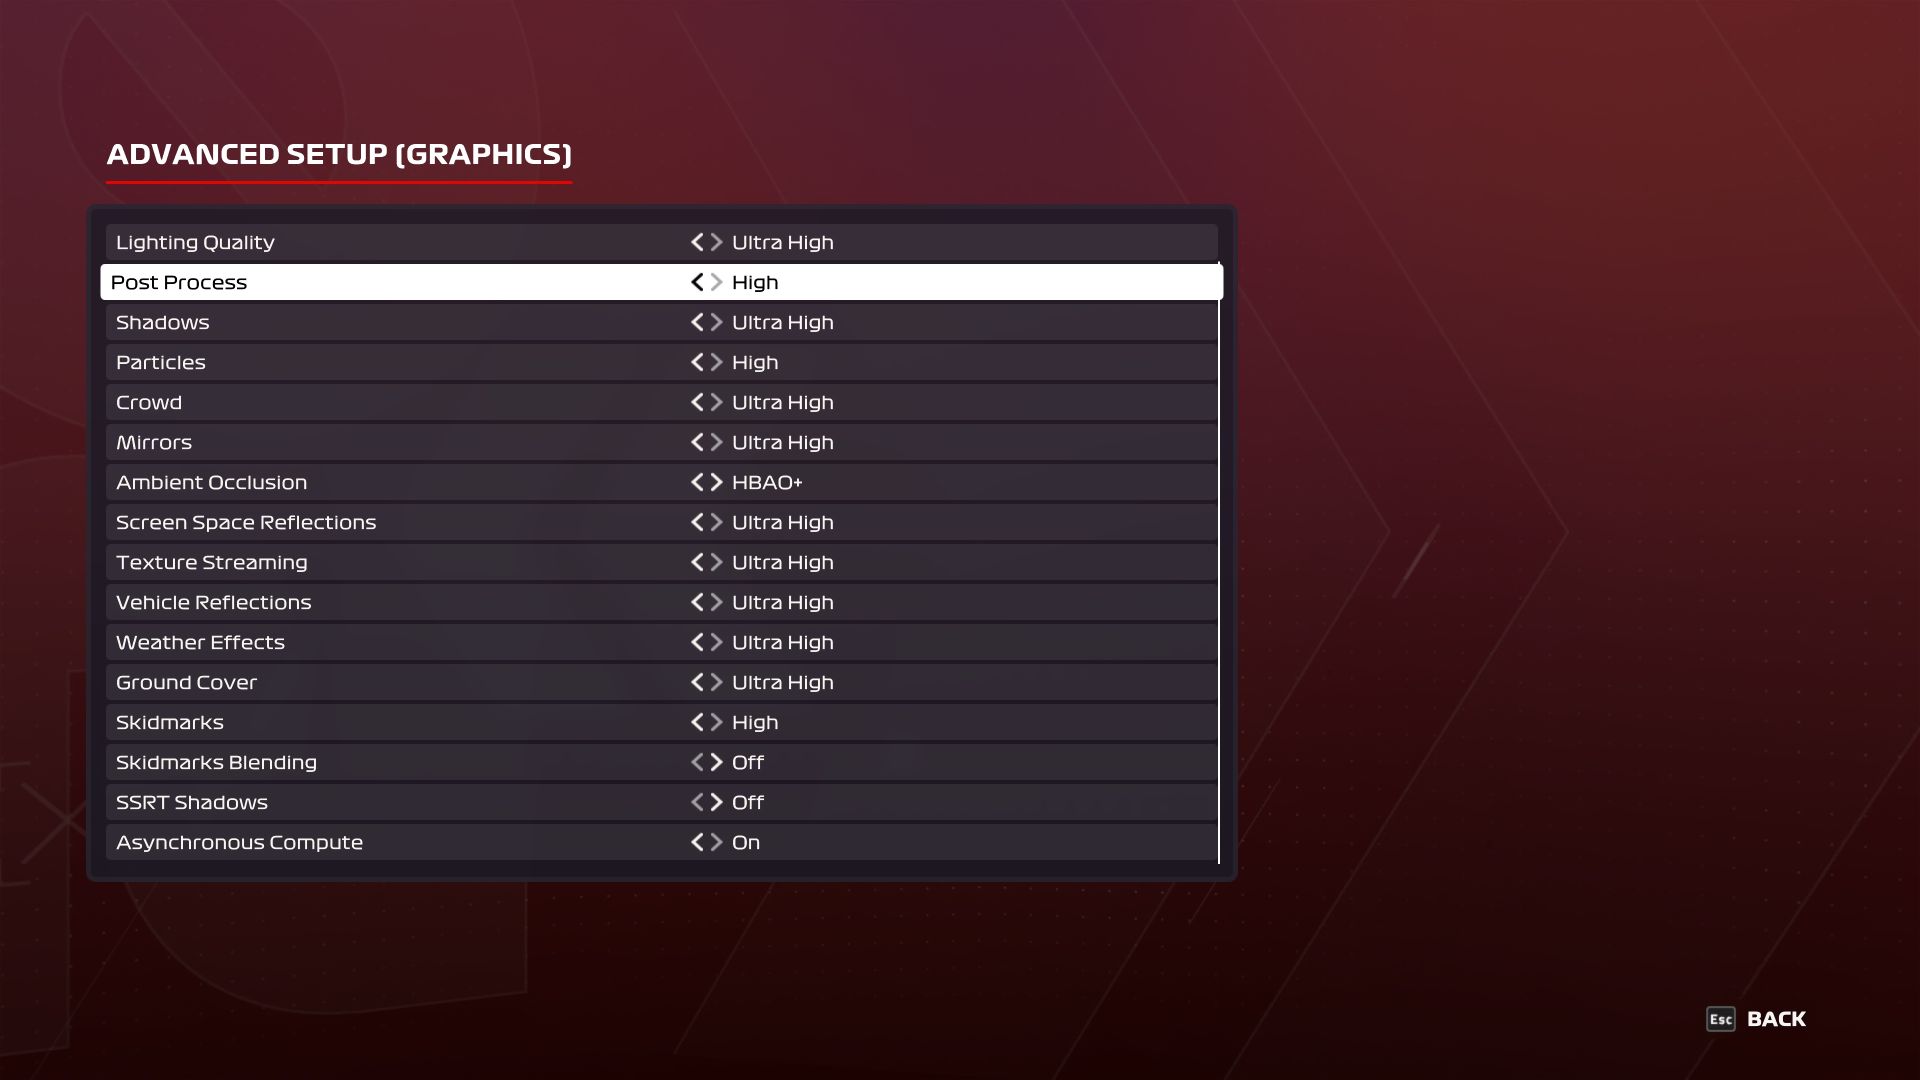
F1 2020
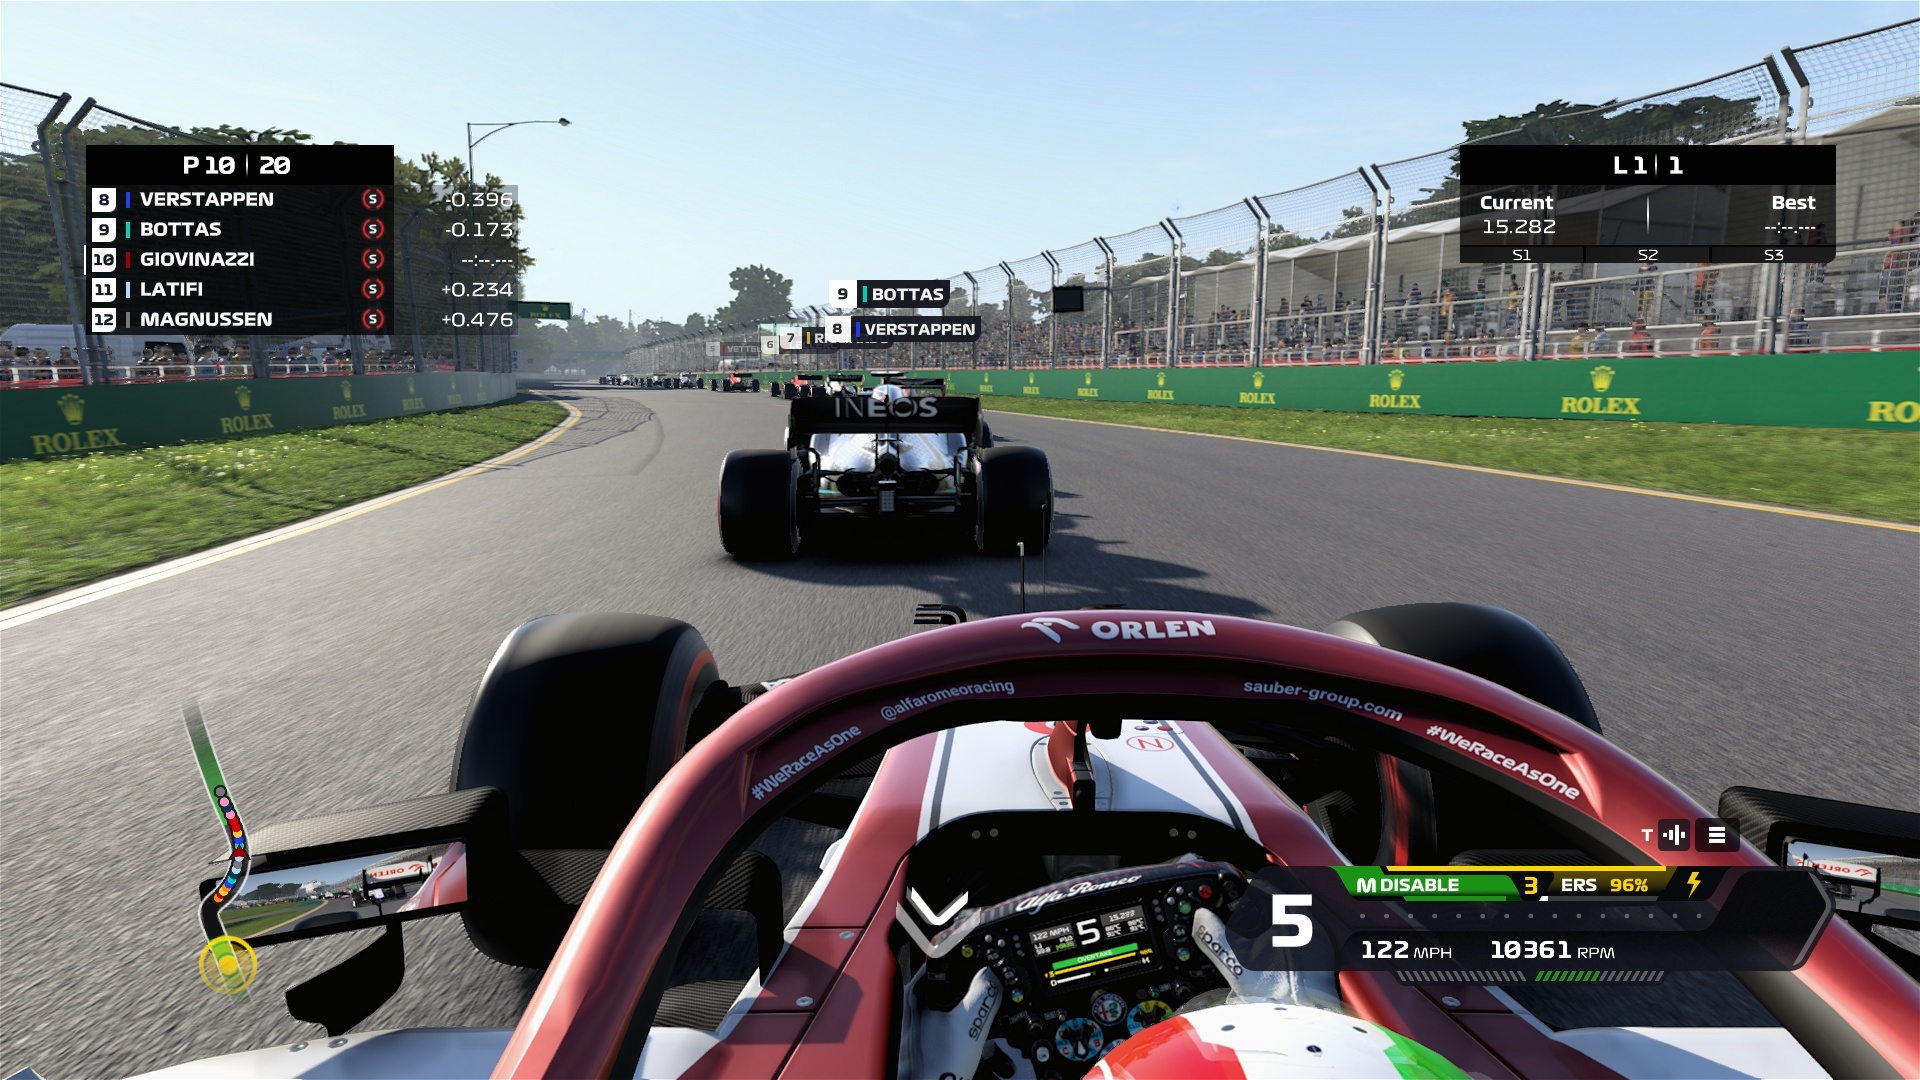
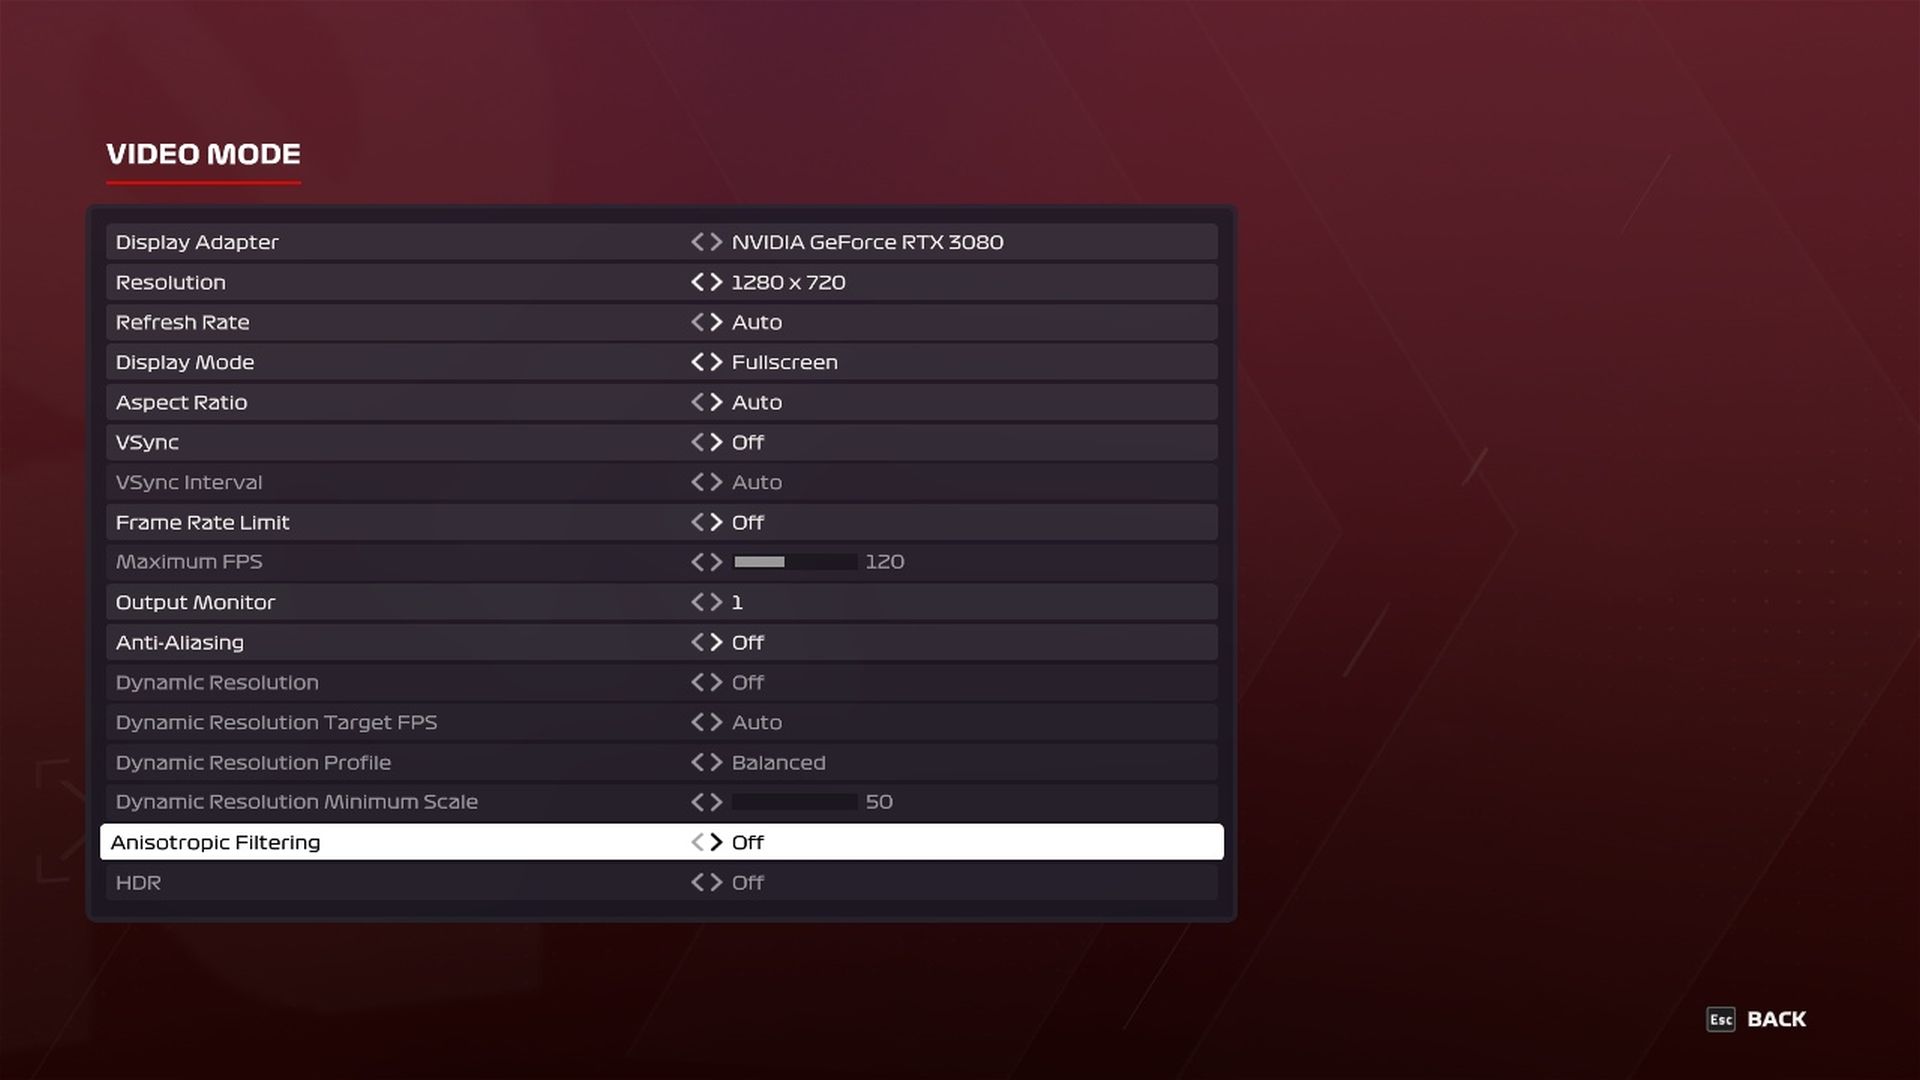
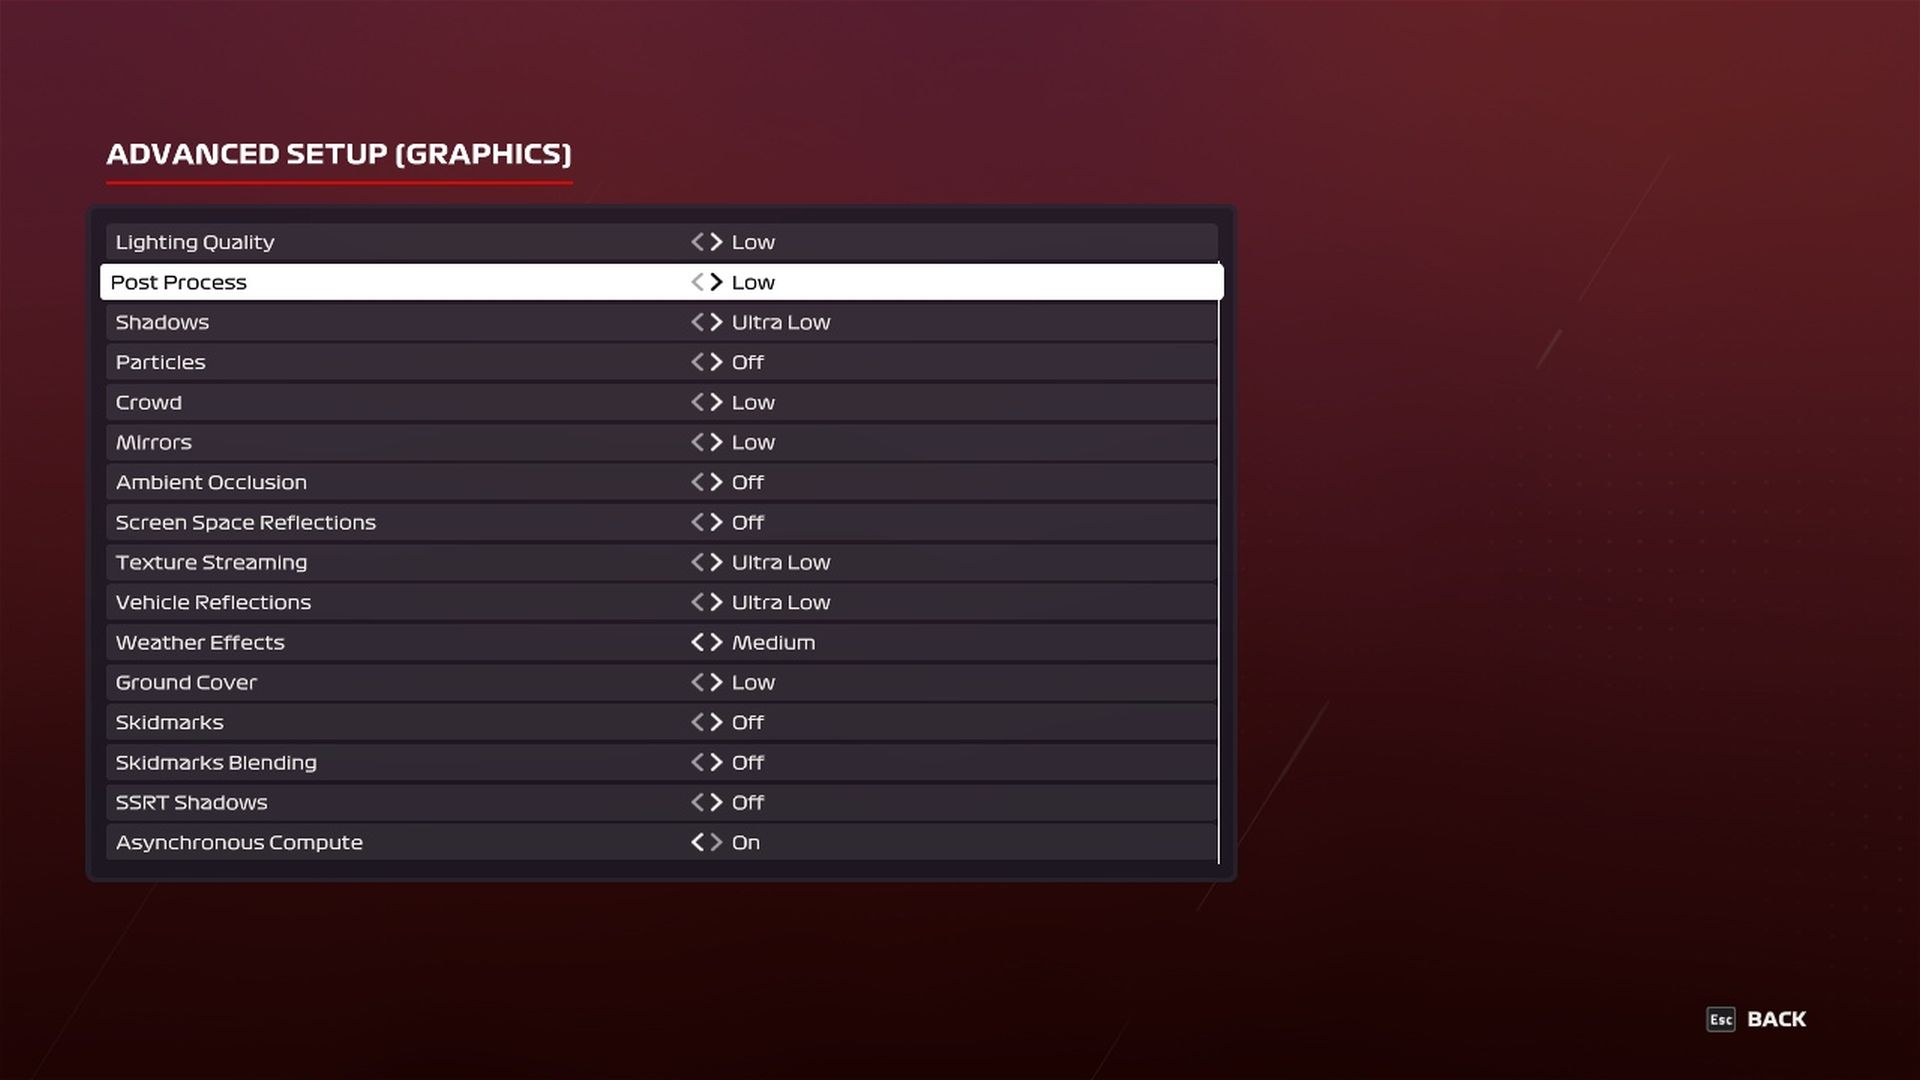
Test environment: resolution 1280 × 720 px; graphics settings preset Ultra Low; API DirectX 12; extra settings Anti-Aliasing: off, Anisotropic Filtering: off; test scene: built-in benchmark (Australia, Clear/Dry, Cycle).
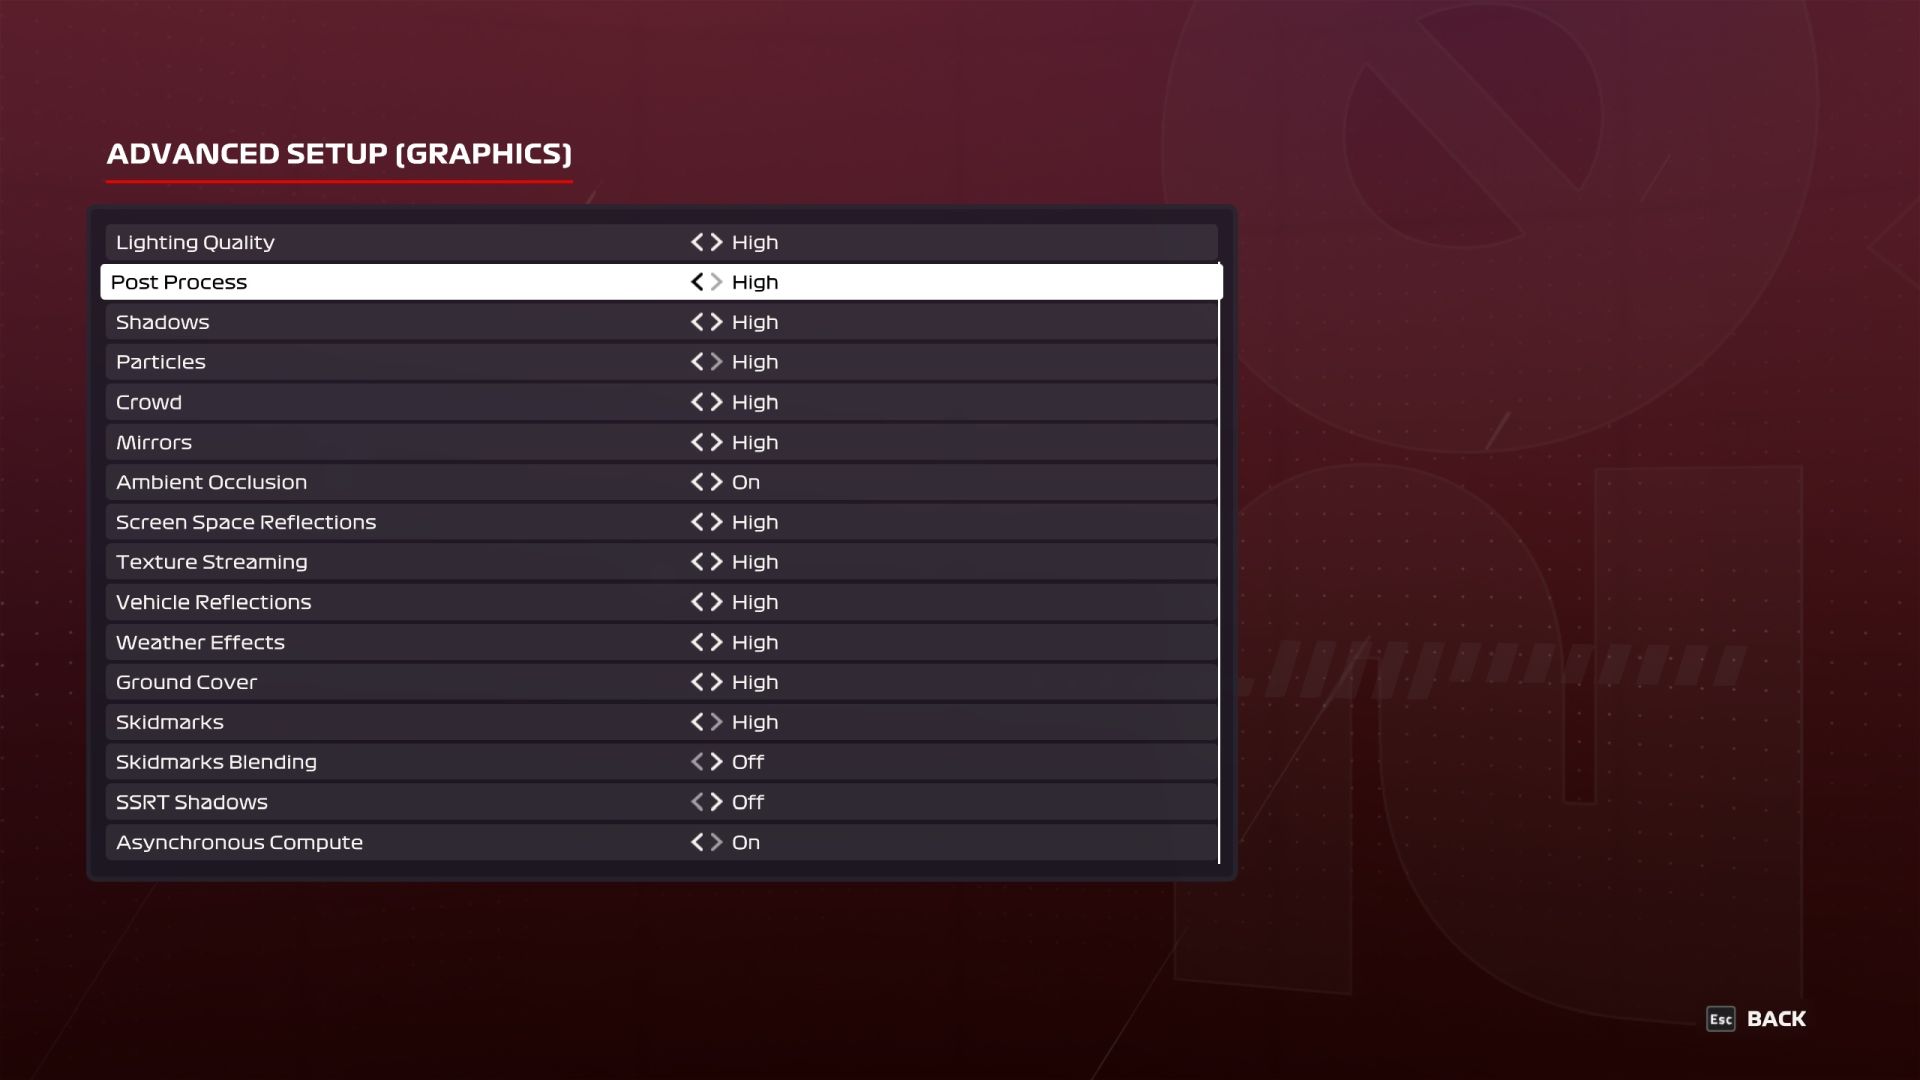
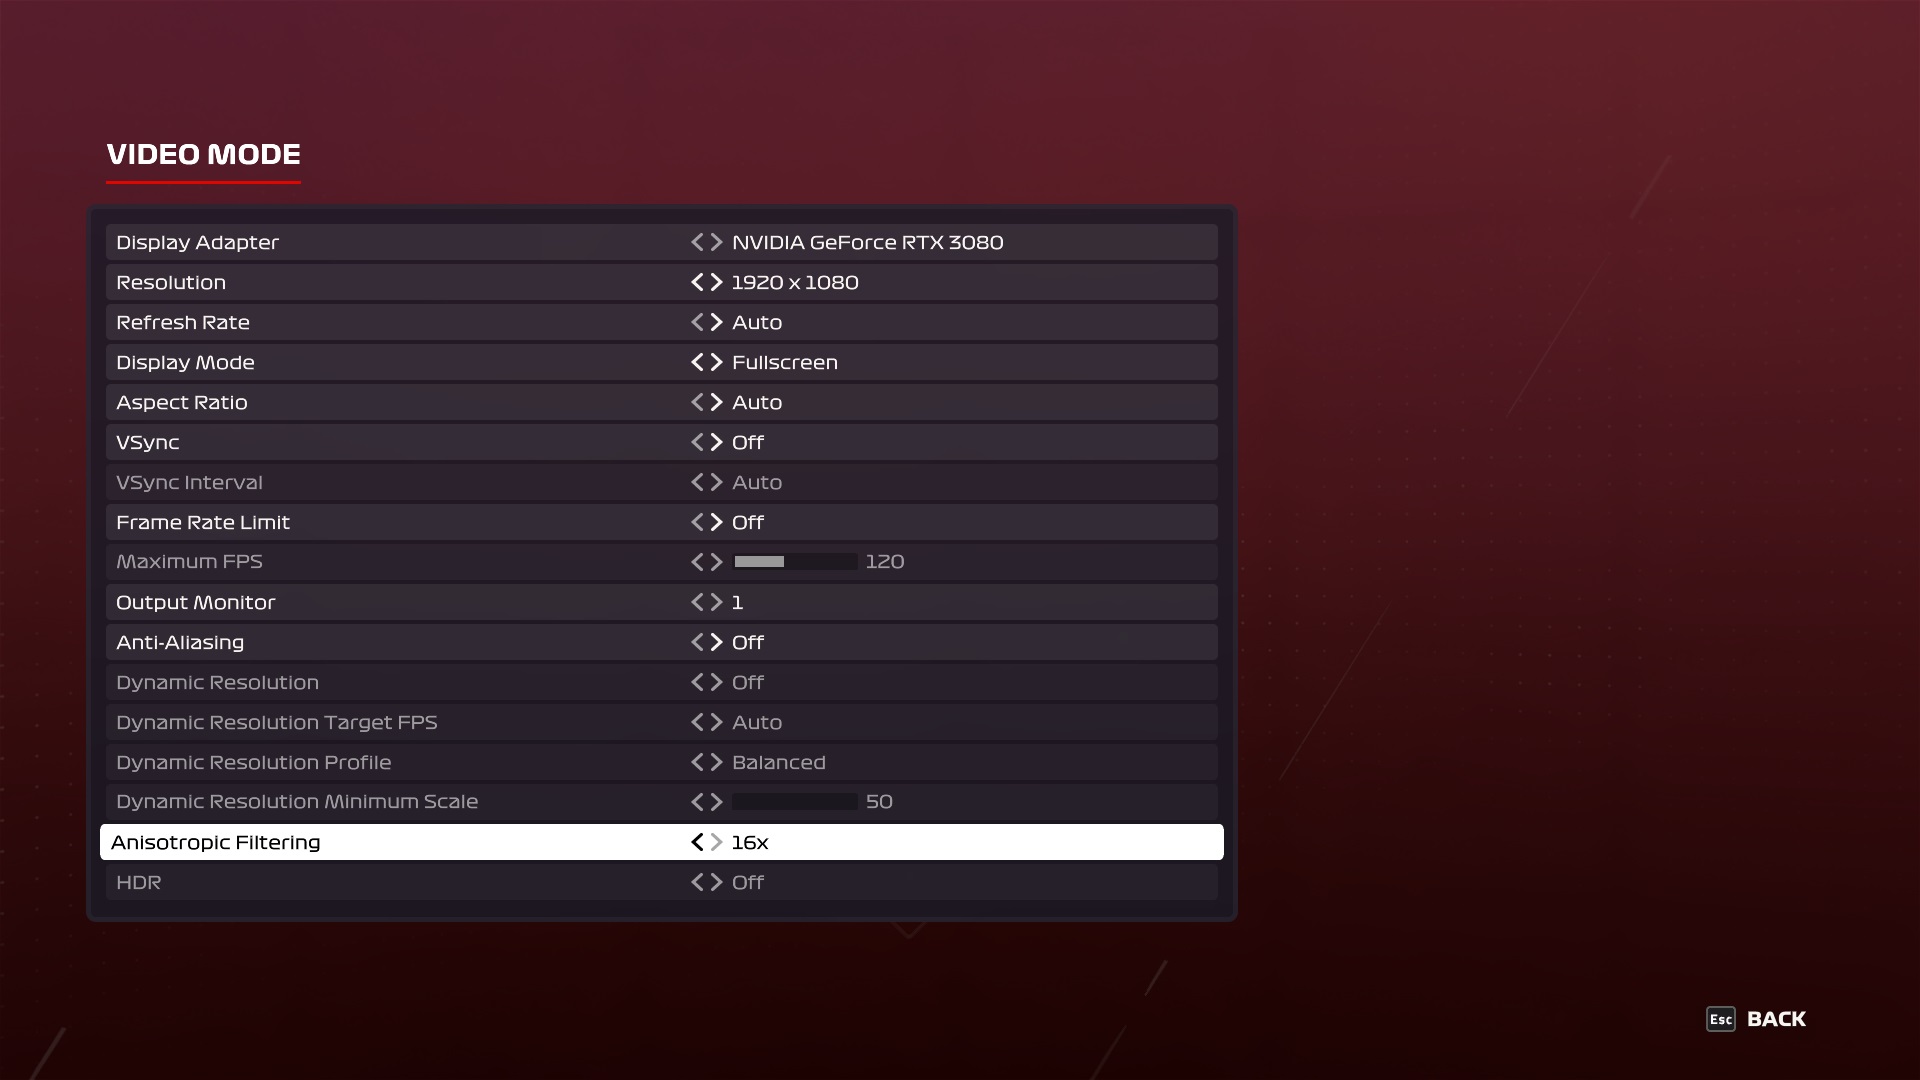
Test environment: resolution 1920 × 1080 px; graphics settings preset High; API DirectX 12; extra settings Anti-Aliasing: off, Skidmarks Blending: off; test scene: built-in benchmark (Australia, Clear/Dry, Cycle).
Test environment: resolution 2560 × 1440 px; graphics settings preset High; API DirectX 12; extra settings Anti-Aliasing: TAA, Skidmarks Blending: off; test scene: built-in benchmark (Australia, Clear/Dry, Cycle).
Test environment: resolution 3840 × 2160 px; graphics settings preset Ultra High; API DirectX 12; extra settings Anti-Aliasing: TAA, Skidmarks Blending: off; test scene: built-in benchmark (Australia, Clear/Dry, Cycle).
The third and final Intel Core i5-13400F CPU test with measurements beyond standard will add to what the previous two have shown. We ran the two existing steppings – B0 (with Raptor Cove/Raptor Lake P cores) and C0 (Golden Cove/Alder Lake) – through all the games we use to test processors, in four different display setups. In the case of stepping B0 even with modified CPU settings, with E cores disabled.
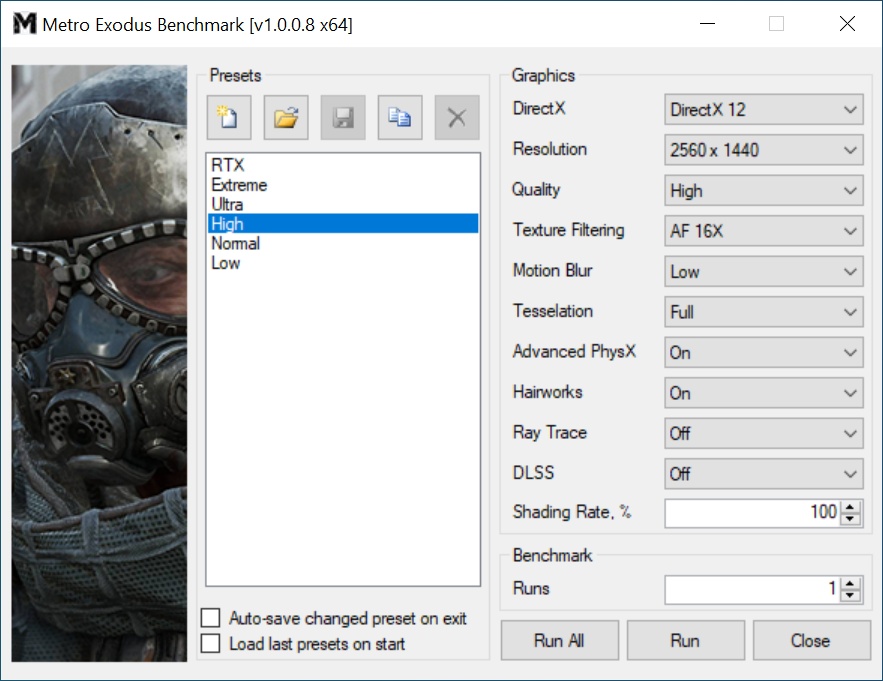
Metro Exodus

Test environment: resolution 1280 × 720 px; graphics settings preset Low; API DirectX 12; no extra settings test scene: built-in benchmark.

Test environment: resolution 1920 × 1080 px; graphics settings preset High; API DirectX 12; no extra settings; test scene: built-in benchmark.

Test environment: resolution 2560 × 1440 px; graphics settings preset High; API DirectX 12; no extra settings; test scene: built-in benchmark.
Test environment: resolution 3840 × 2160 px; graphics settings preset Extreme; API DirectX 12; no extra settings; test scene: built-in benchmark.

The third and final Intel Core i5-13400F CPU test with measurements beyond standard will add to what the previous two have shown. We ran the two existing steppings – B0 (with Raptor Cove/Raptor Lake P cores) and C0 (Golden Cove/Alder Lake) – through all the games we use to test processors, in four different display setups. In the case of stepping B0 even with modified CPU settings, with E cores disabled.
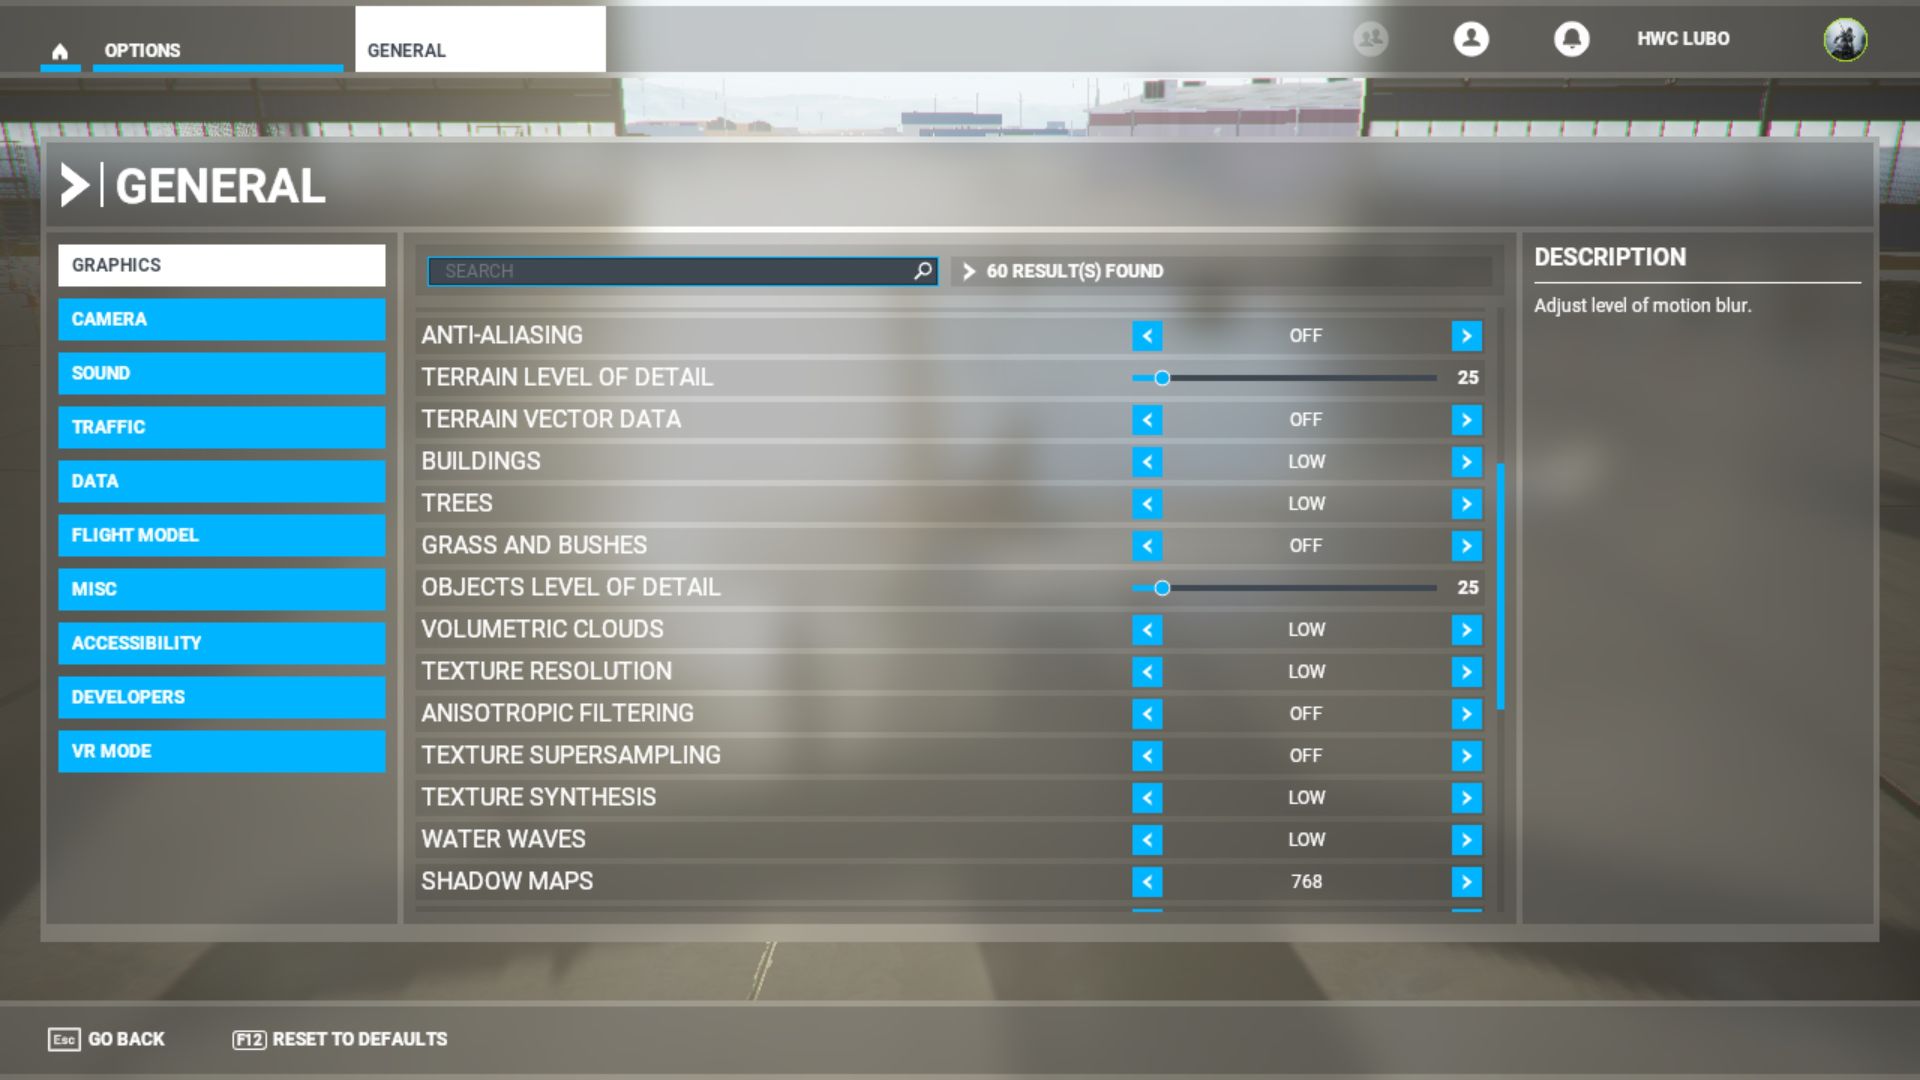
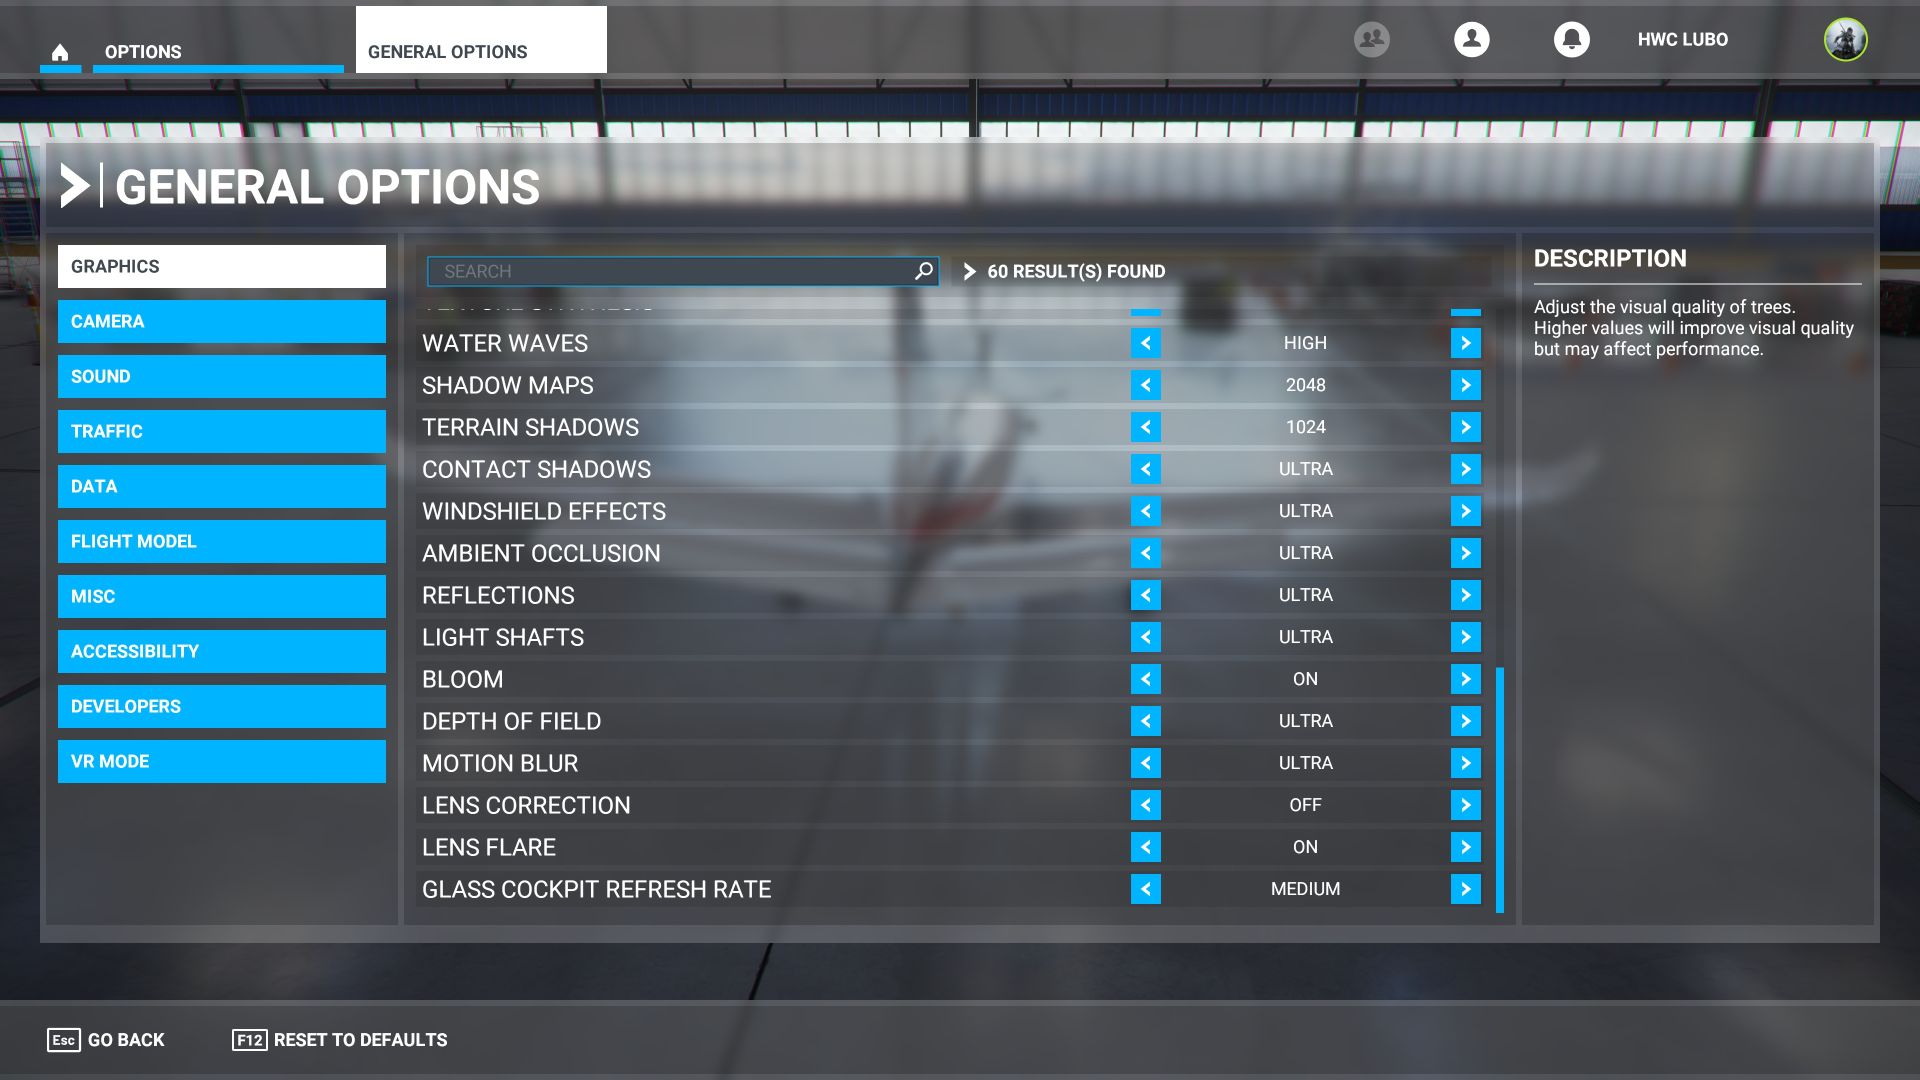
Microsoft Flight Simulator
Disclaimer: The performance of this game changes and improves frequently due to continuous updates. We verify the consistency of the results by re-testing the Ryzen 9 5900X processor before each measurement. In case of significant deviations, we discard the older results and start building the database from scratch. Due to the incompleteness of the MFS results, we do not use MFS to calculate the average gaming performance of the processors.

Test environment: resolution 1280 × 720 px; graphics settings preset Low; API DirectX 11; extra settings Anti-Aliasing: off; test scene: custom (Paris-Charles de Gaulle, Air Traffic: AI, February 14, 9:00) autopilot: from 1000 m until hitting the terrain.

Test environment: resolution 1920 × 1080 px; graphics settings preset Low; API DirectX 11; extra settings Anti-Aliasing: off; test scene: custom (Paris-Charles de Gaulle, Air Traffic: AI, February 14, 9:00) autopilot: from 1000 m until hitting the terrain.
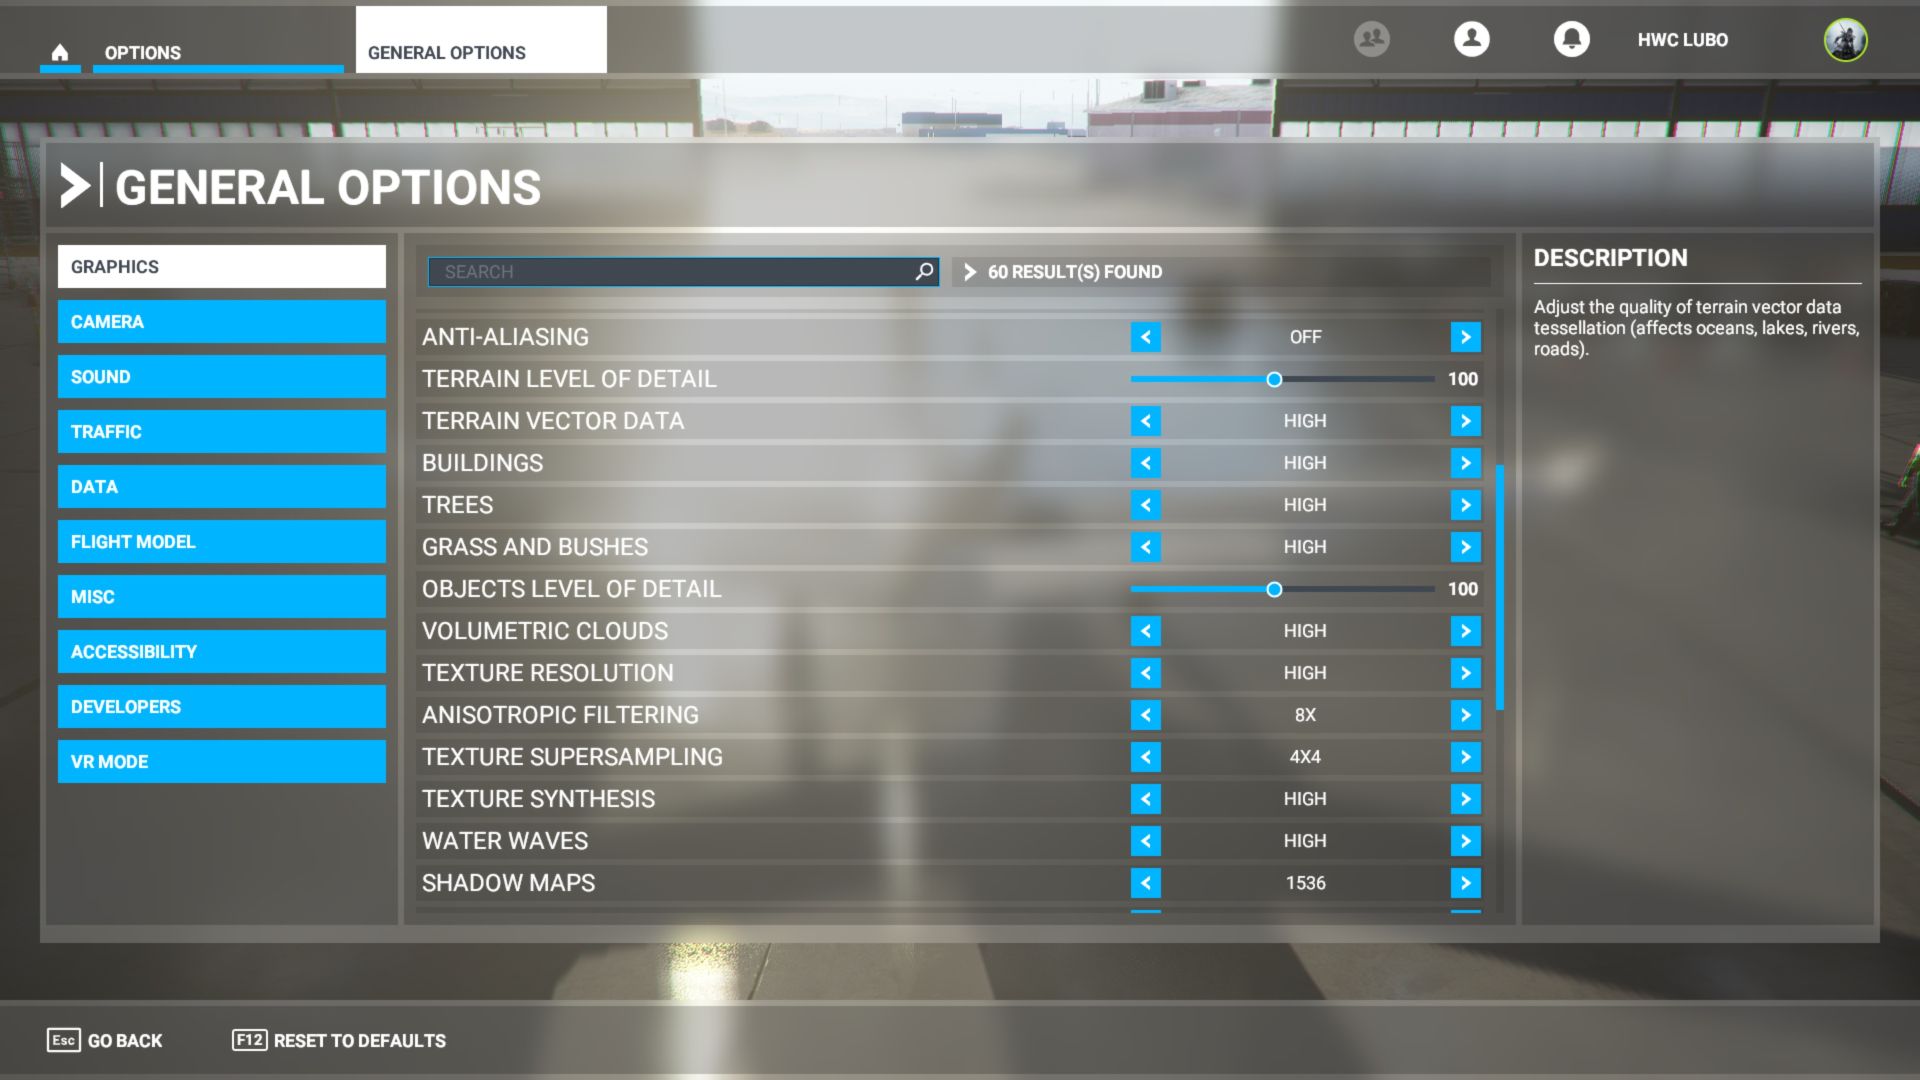
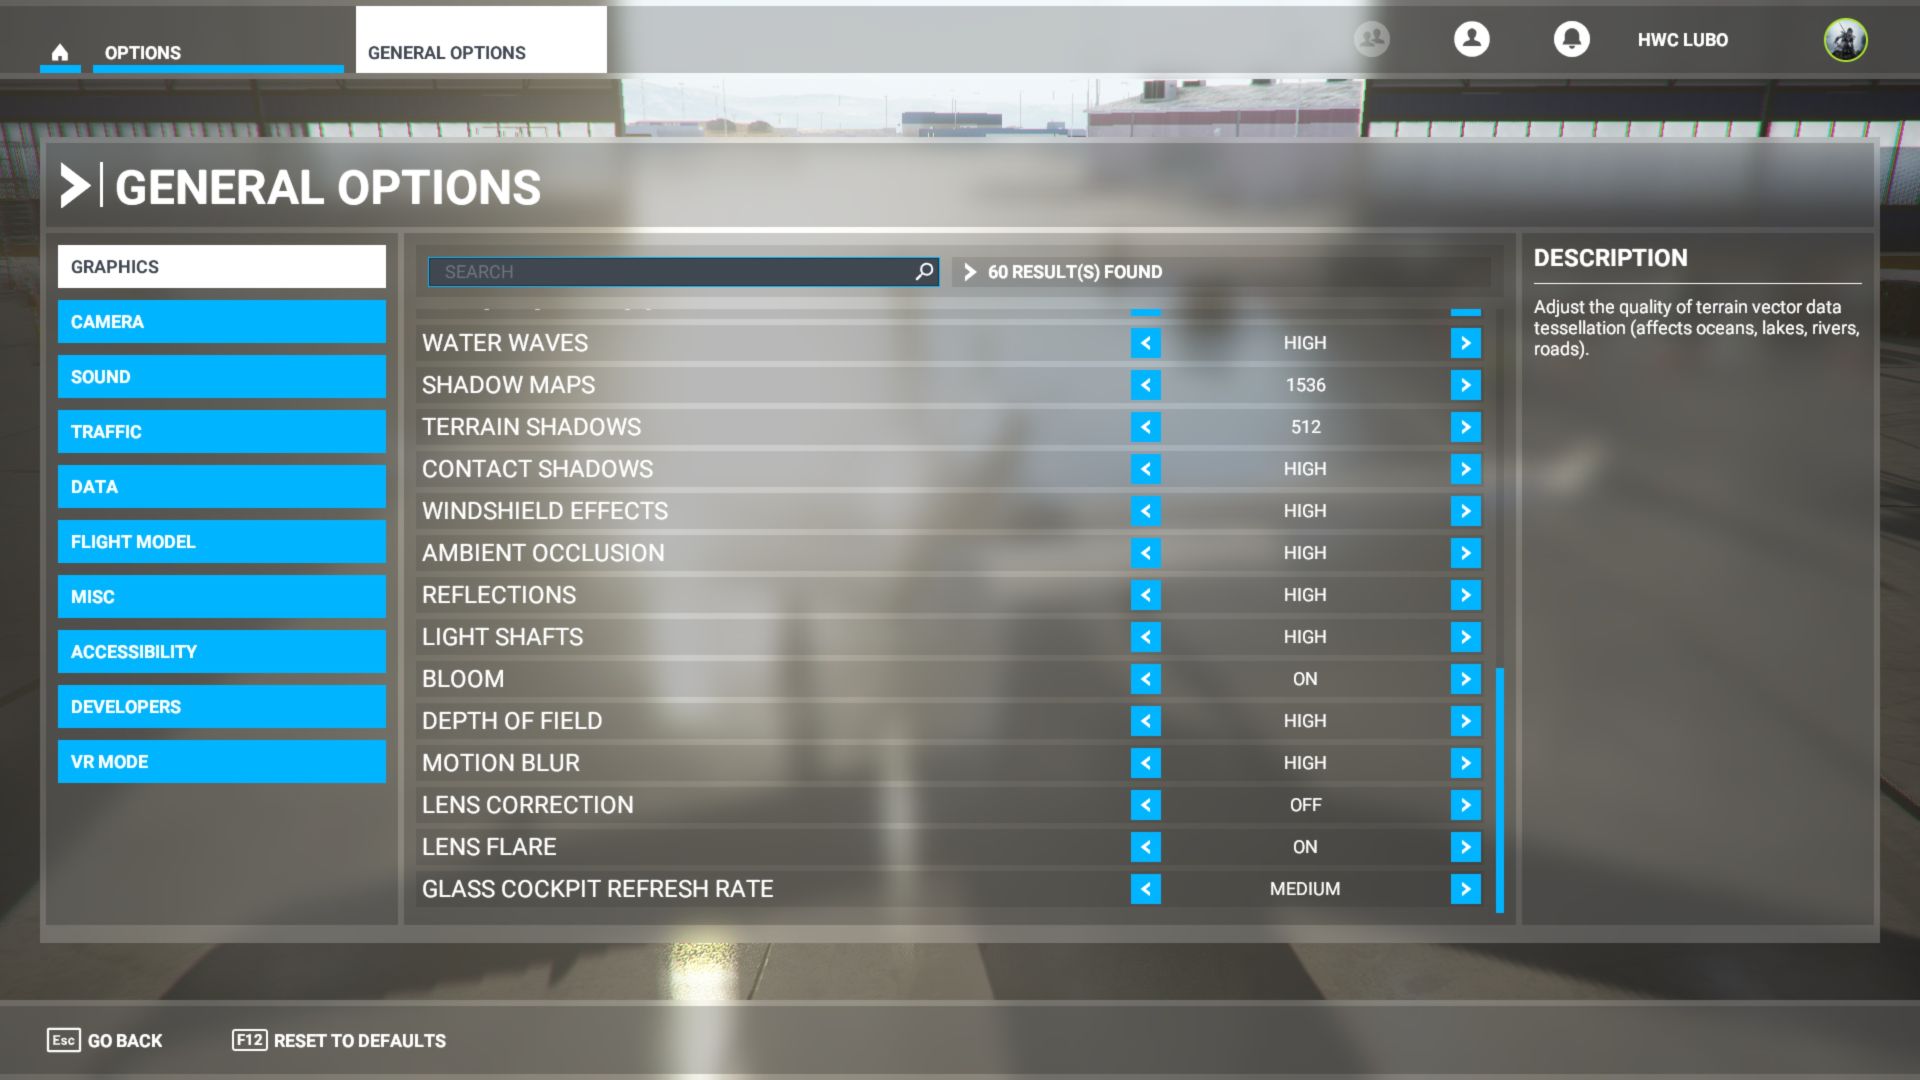
Test environment: resolution 2560 × 1440 px; graphics settings preset High; API DirectX 11; extra settings Anti-Aliasing: TAA; test scene: custom (Paris-Charles de Gaulle, Air Traffic: AI, February 14, 9:00) autopilot: from 1000 m until hitting the terrain.
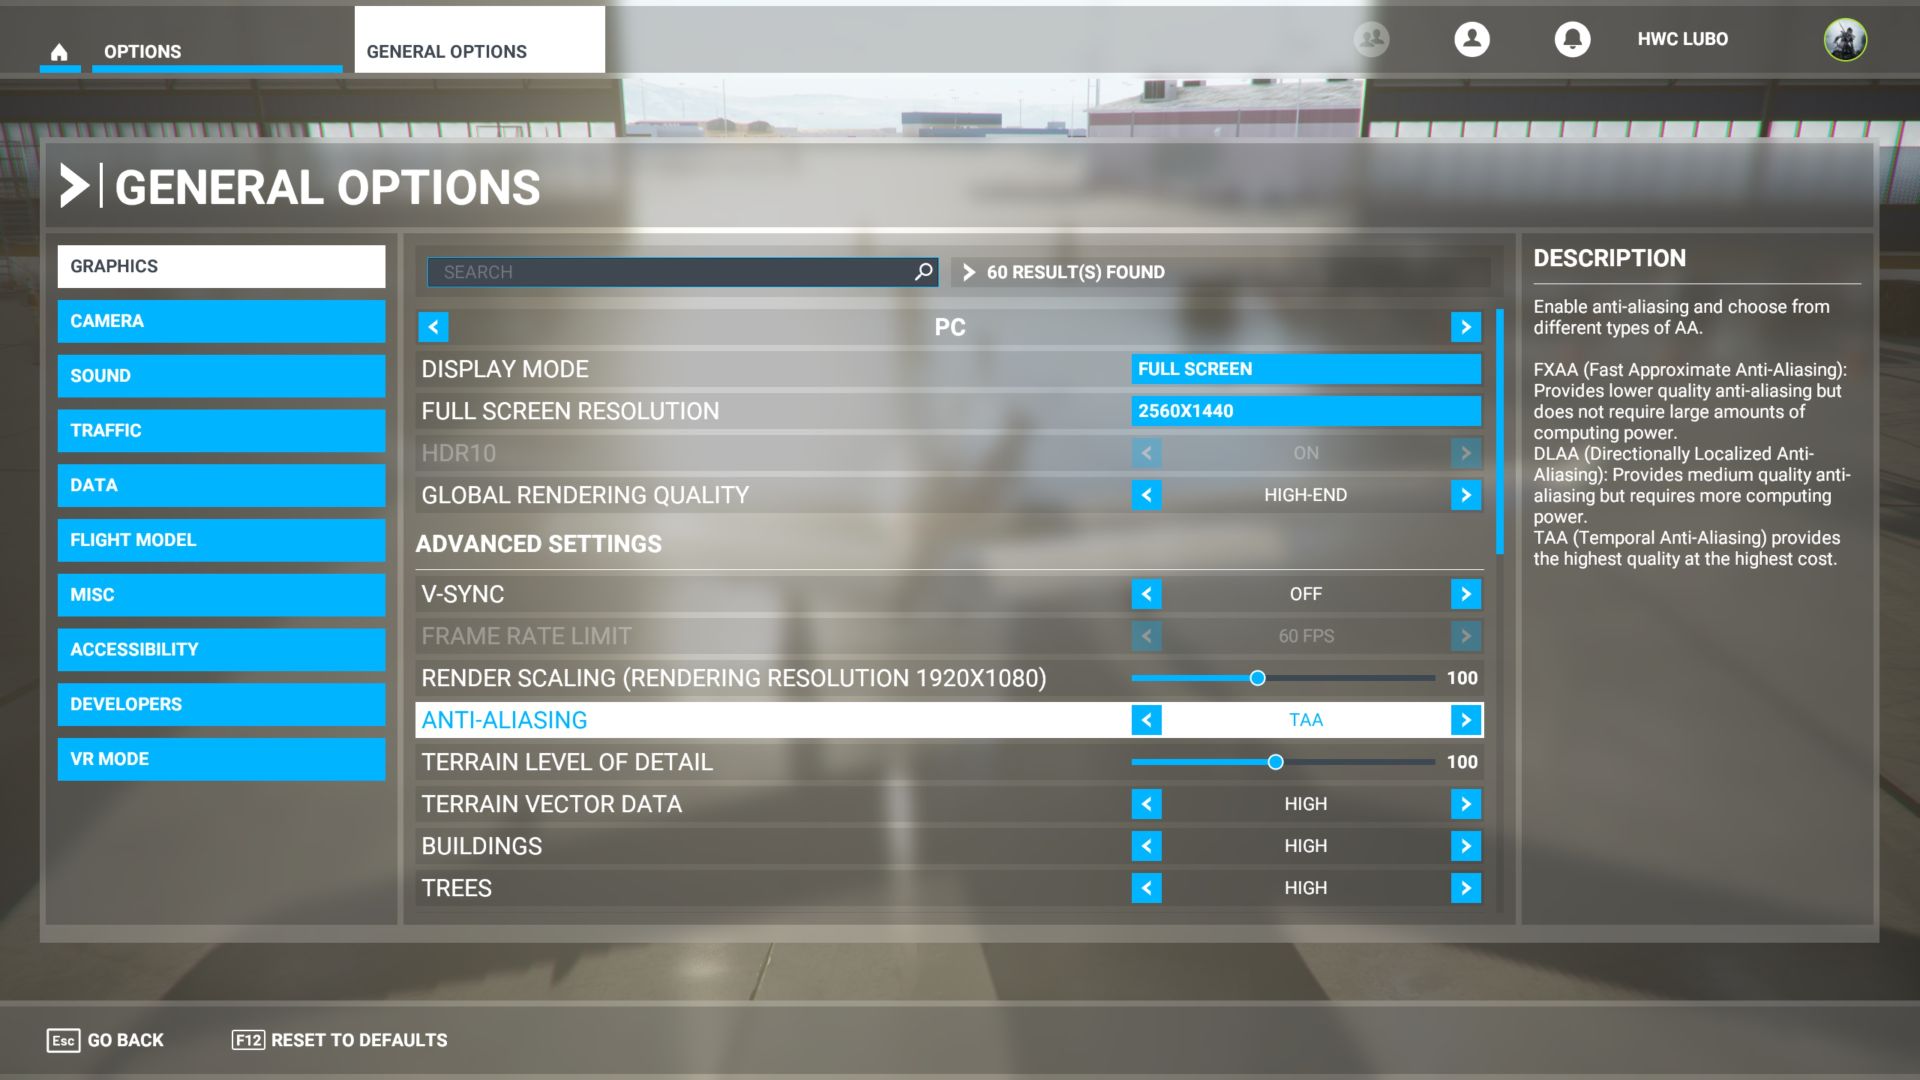
Test environment: resolution 3840 × 2160 px; graphics settings preset Ultra; API DirectX 11; extra settings Anti-Aliasing: TAA; test scene: custom (Paris-Charles de Gaulle, Air Traffic: AI, February 14, 9:00) autopilot: from 1000 m until hitting the terrain.

The third and final Intel Core i5-13400F CPU test with measurements beyond standard will add to what the previous two have shown. We ran the two existing steppings – B0 (with Raptor Cove/Raptor Lake P cores) and C0 (Golden Cove/Alder Lake) – through all the games we use to test processors, in four different display setups. In the case of stepping B0 even with modified CPU settings, with E cores disabled.
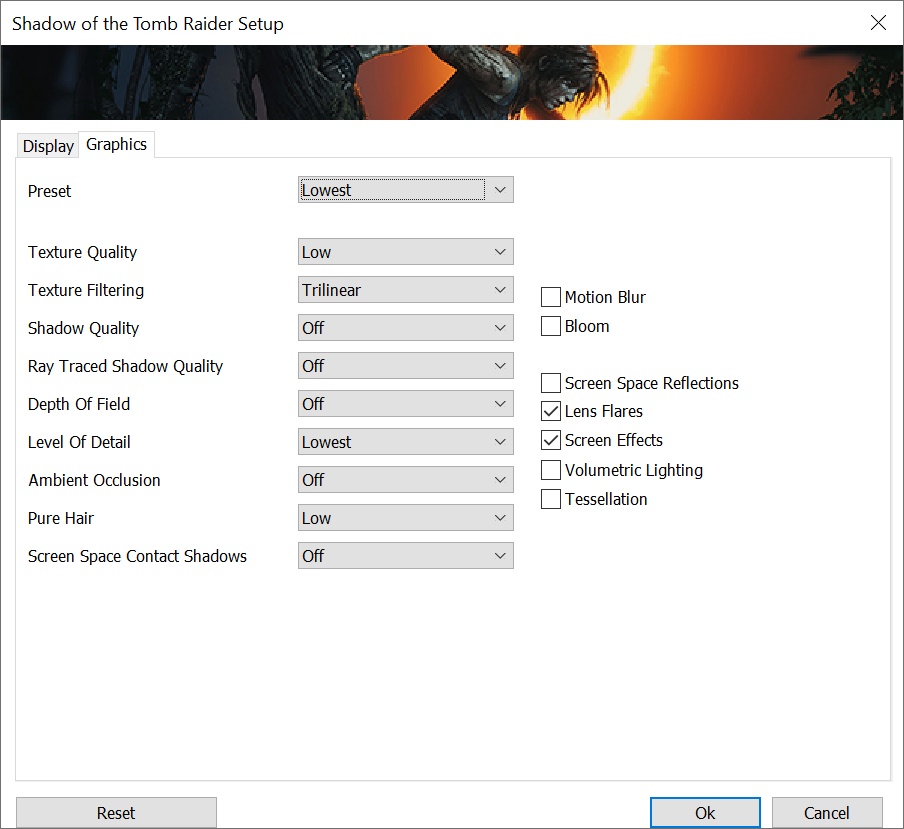
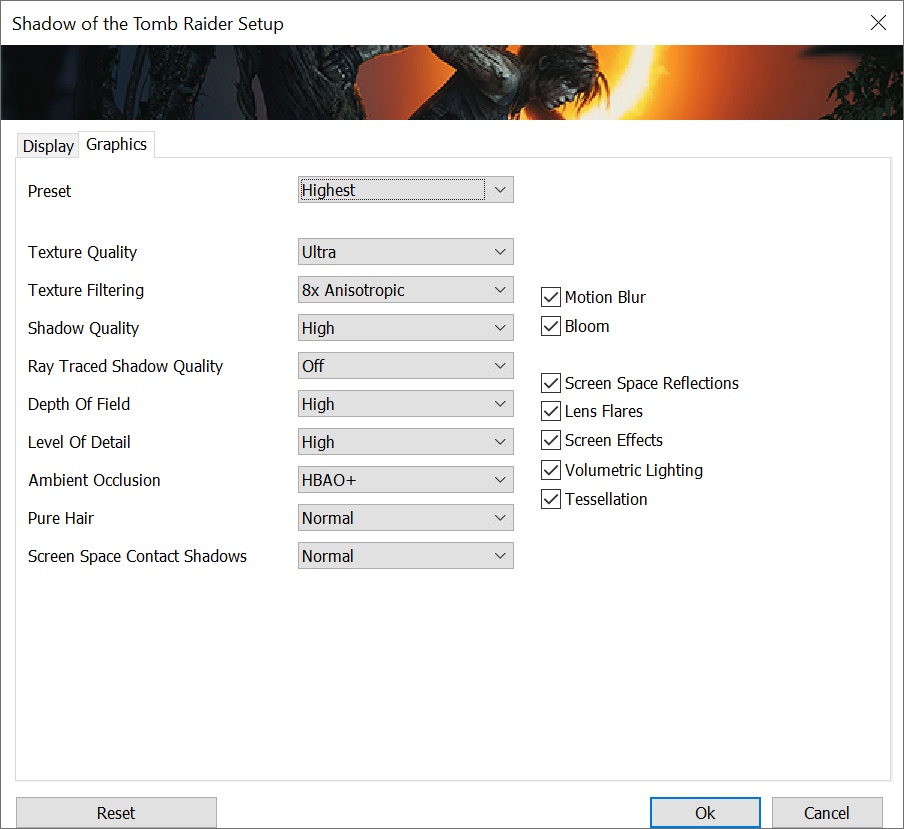
Shadow of the Tomb Raider

Test environment: resolution 1280 × 720 px; graphics settings preset Lowest; API DirectX 12; extra settings Anti-Aliasing: off; test scene: built-in benchmark.

Test environment: resolution 1920 × 1080 px; graphics settings preset High; API DirectX 12; extra settings Anti-Aliasing: off; test scene: built-in benchmark.
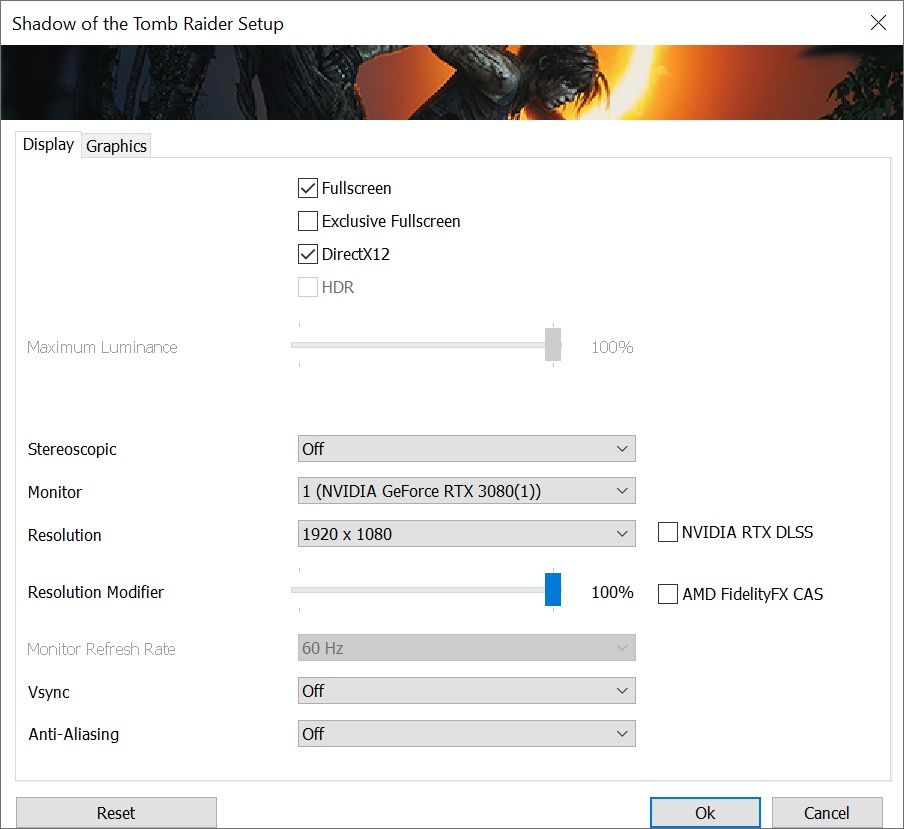

Test environment: resolution 2560 × 1440 px; graphics settings preset High; API DirectX 12; extra settings Anti-Aliasing: TAA; test scene: built-in benchmark.

Test environment: resolution 3840 × 2160 px; graphics settings preset Highest; API DirectX 12; extra settings Anti-Aliasing: TAA; test scene: built-in benchmark.
The third and final Intel Core i5-13400F CPU test with measurements beyond standard will add to what the previous two have shown. We ran the two existing steppings – B0 (with Raptor Cove/Raptor Lake P cores) and C0 (Golden Cove/Alder Lake) – through all the games we use to test processors, in four different display setups. In the case of stepping B0 even with modified CPU settings, with E cores disabled.
Total War Saga: Troy
Test environment: resolution 1280 × 720 px; graphics settings preset Low; API DirectX 11; no extra settings; test scene: built-in benchmark.
Test environment: resolution 1920 × 1080 px; graphics settings preset High; API DirectX 11; no extra settings; test scene: built-in benchmark.
Test environment: resolution 2560 × 1440 px; graphics settings preset High; API DirectX 11; no extra settings; test scene: built-in benchmark.
Test environment: resolution 3840 × 2160 px; graphics settings preset Ultra; API DirectX 11; no extra settings; test scene: built-in benchmark.

Disclaimer: The results in Total War Saga: Troy do not reflect well the comparison of Raptor Lake and Alder Lake processors, including the Core i5-13400(F) and Core i5-12400(F). The motherboard used, Asus ROG Strix Z790-E Gaming WiFi, achieves lower performance than other motherboards in this game for some reason. This is also shown by our comparative analyses.
The third and final Intel Core i5-13400F CPU test with measurements beyond standard will add to what the previous two have shown. We ran the two existing steppings – B0 (with Raptor Cove/Raptor Lake P cores) and C0 (Golden Cove/Alder Lake) – through all the games we use to test processors, in four different display setups. In the case of stepping B0 even with modified CPU settings, with E cores disabled.
Overall gaming performance
To calculate average gaming performance, we normalized the Intel Core i7-11900K processor. The percentage differences of all other processors are based on this, with each of the games contributing an equal weight to the final result. To see exactly what the formula we use to arrive at each value looks like, see „New average CPU score measuring method“.
The third and final Intel Core i5-13400F CPU test with measurements beyond standard will add to what the previous two have shown. We ran the two existing steppings – B0 (with Raptor Cove/Raptor Lake P cores) and C0 (Golden Cove/Alder Lake) – through all the games we use to test processors, in four different display setups. In the case of stepping B0 even with modified CPU settings, with E cores disabled.
Gaming performance per euro
The third and final Intel Core i5-13400F CPU test with measurements beyond standard will add to what the previous two have shown. We ran the two existing steppings – B0 (with Raptor Cove/Raptor Lake P cores) and C0 (Golden Cove/Alder Lake) – through all the games we use to test processors, in four different display setups. In the case of stepping B0 even with modified CPU settings, with E cores disabled.
Power draw…

The third and final Intel Core i5-13400F CPU test with measurements beyond standard will add to what the previous two have shown. We ran the two existing steppings – B0 (with Raptor Cove/Raptor Lake P cores) and C0 (Golden Cove/Alder Lake) – through all the games we use to test processors, in four different display setups. In the case of stepping B0 even with modified CPU settings, with E cores disabled.
- Contents
- Different Ci5-13400Fs in different games
- Assassin’s Creed: Valhalla
- Borderlands 3
- Counter-Strike: GO
- Cyberpunk 2077
- DOOM Eternal
- F1 2020
- Metro Exodus
- Microsoft Flight Simulator
- Shadow of the Tomb Raider
- Total War Saga: Troy
- Overall gaming performance
- Gaming performance per euro
- Power draw...
- ...and gaming performance per watt