
We've improved the calculation to determine average performance and performance per euro
Since the last processor test (including) we have changed the way we evaluate the overall or average performance of all games. You suggested to us in the discussion half a year ago that it would be better for all games to have the same weight. However, the right time to incorporate this new calculation came only recently. So how do we actually do it and why is it better than before?
Overall, average, or relative (well, the name doesn’t really matter) performance values are rather strange information, but for a quick idea and performance overview, let’s say they can be a little helpful. Of course, if they are interpreted appropriately. And since we see from the statistics that the chapter with the overall game performance is the third most popular one after the conclusion, we decided to make these results a little more objective. Well, the situation actually made us do it. After the July update of the Microsoft Flight Simulator, we had to throw this game out of the formula for calculating the average performance, because the performance has changed very significantly, as you know from our tests.. And since we have to recalculate it all, let’s do it in a new way—a better one.
I’m not trying to say that we have so far calculated the values of the average game performance incorrectly or misleadingly, but a proposed formula of reader ifkopifko is fairer. What’s the difference? So far, we have calculated the average game performance as the sum of the average and minimum fps in the individual resolutions. The amount then changed to a kind of point gain, which was already in proportion to the results of other processors. Based on this, the interactive graphs then recalculated the percentage differences. The disadvantage of this procedure, however, was that each game had a different weight, so some interfered with the final score more and others less.
DOOM Eternal is a good example. It always reaches extremely high fps in FHD resolution, always three-digit, even 409–459 fps (12.23691%). The differences (points) in the measured values are thus significantly higher than, for example, in Assassin’s Creed: Valhalla with fps in the interval (102–113 fps) with significantly smaller differences in points (fps), but the percentage increases are very similar, at around 10–12%. In the end, DOOM Eternal has a higher weight not only than AC: Valhalla itself, but as ACV together with Metro Exodus and Cyberpunk 2077, in which we worked with significantly lower fps.
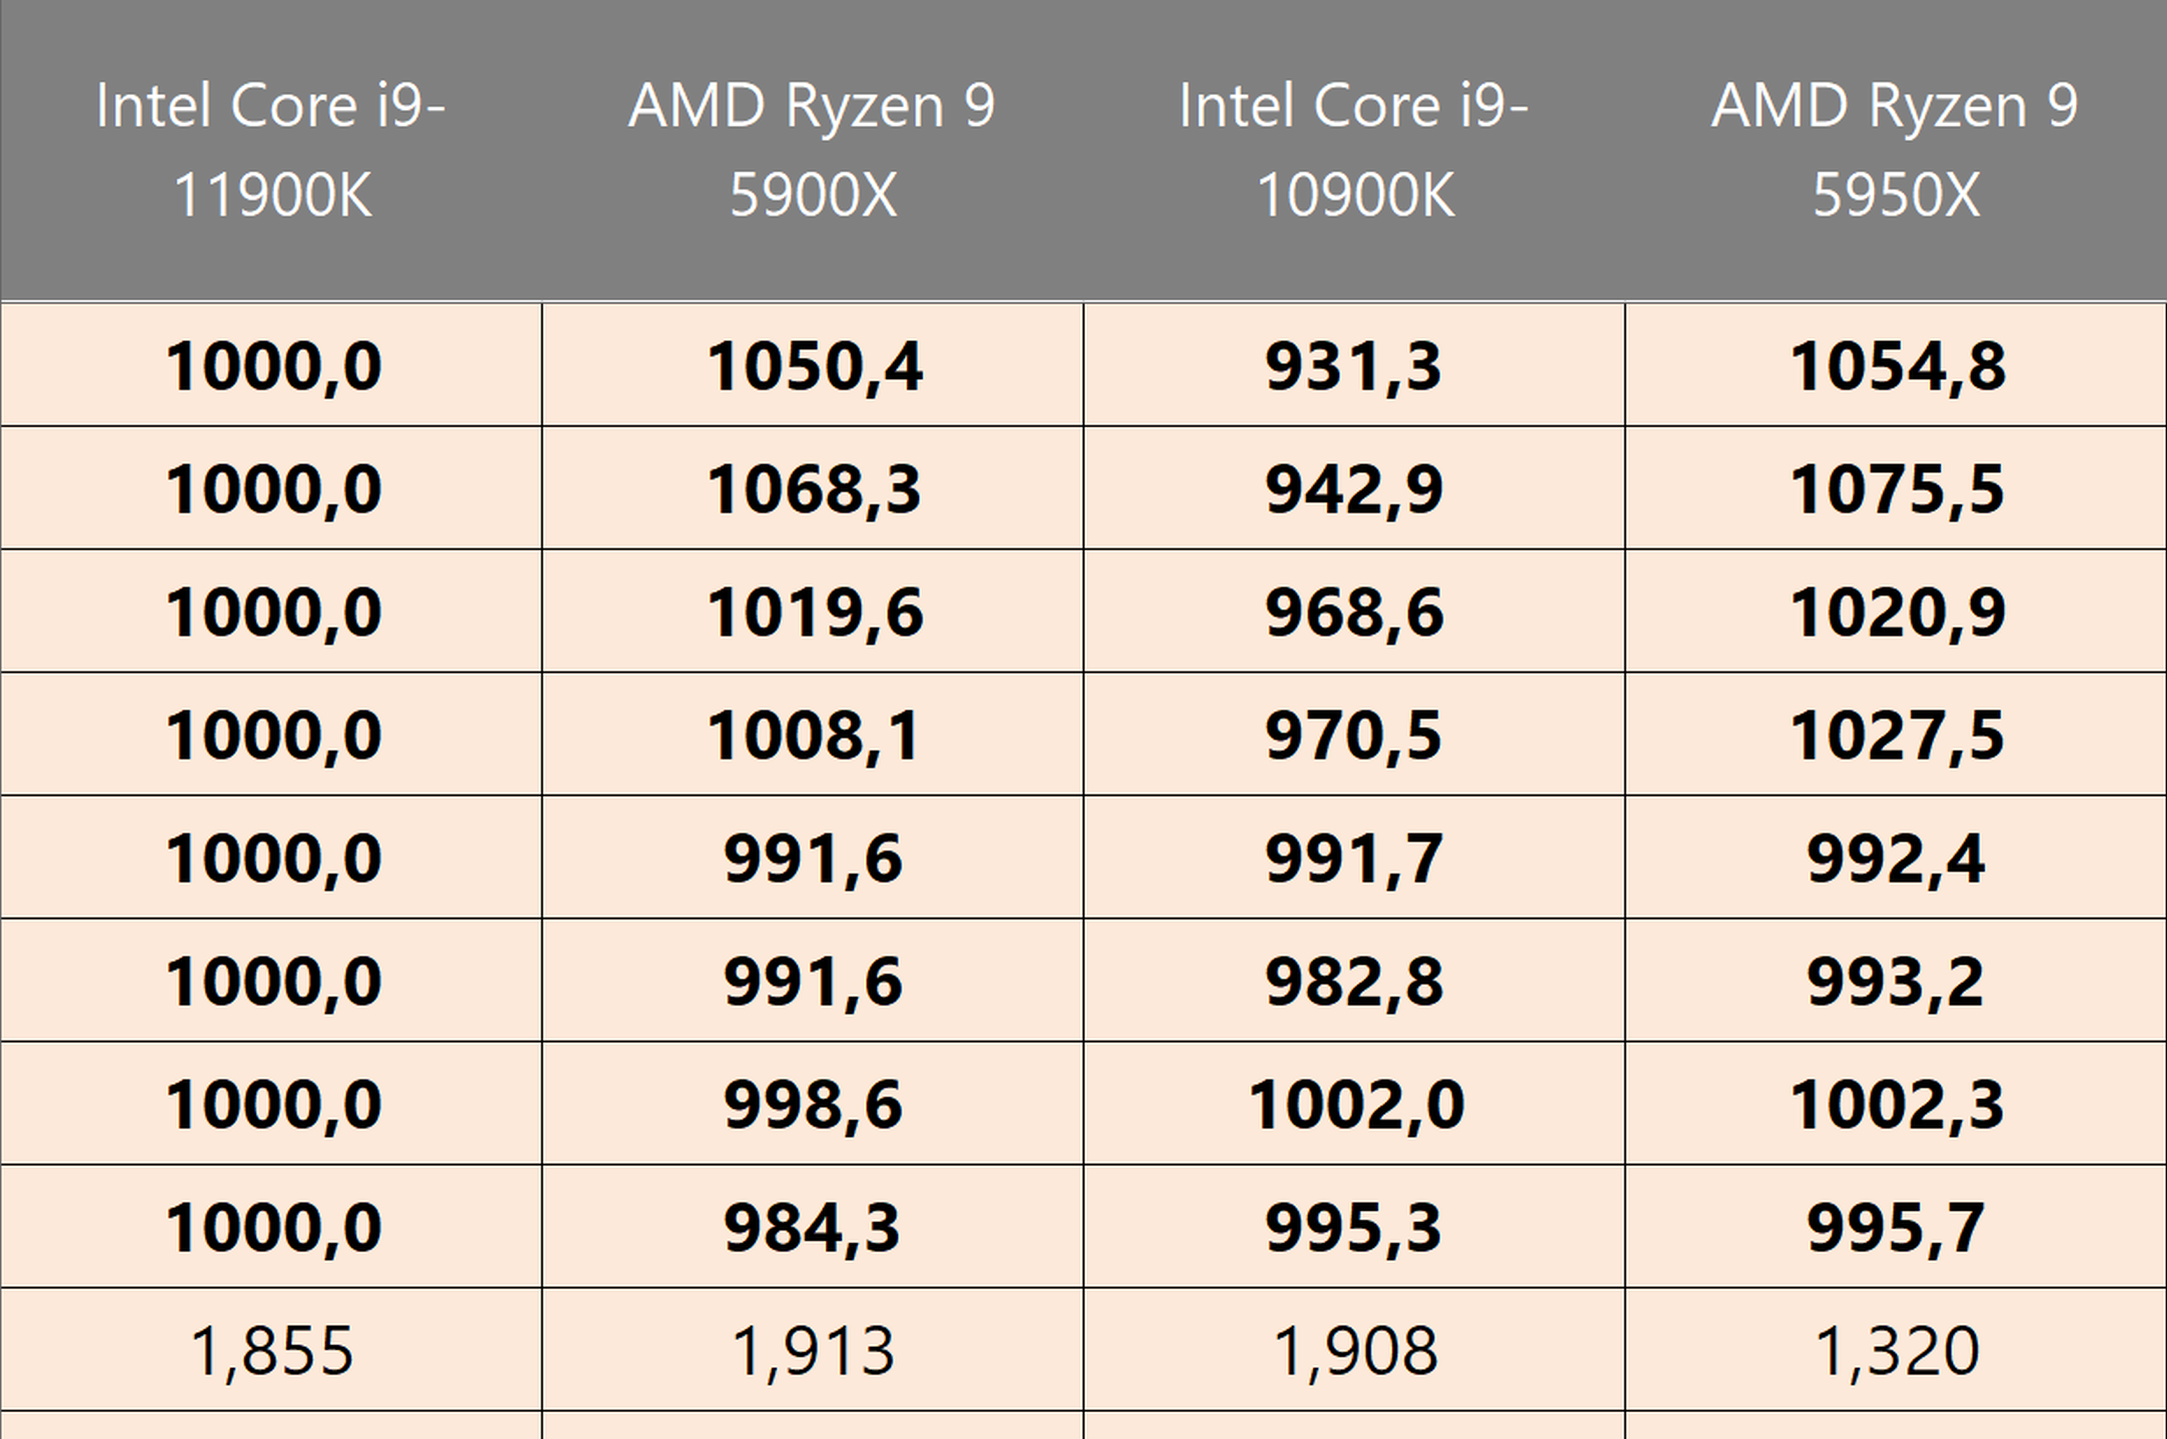
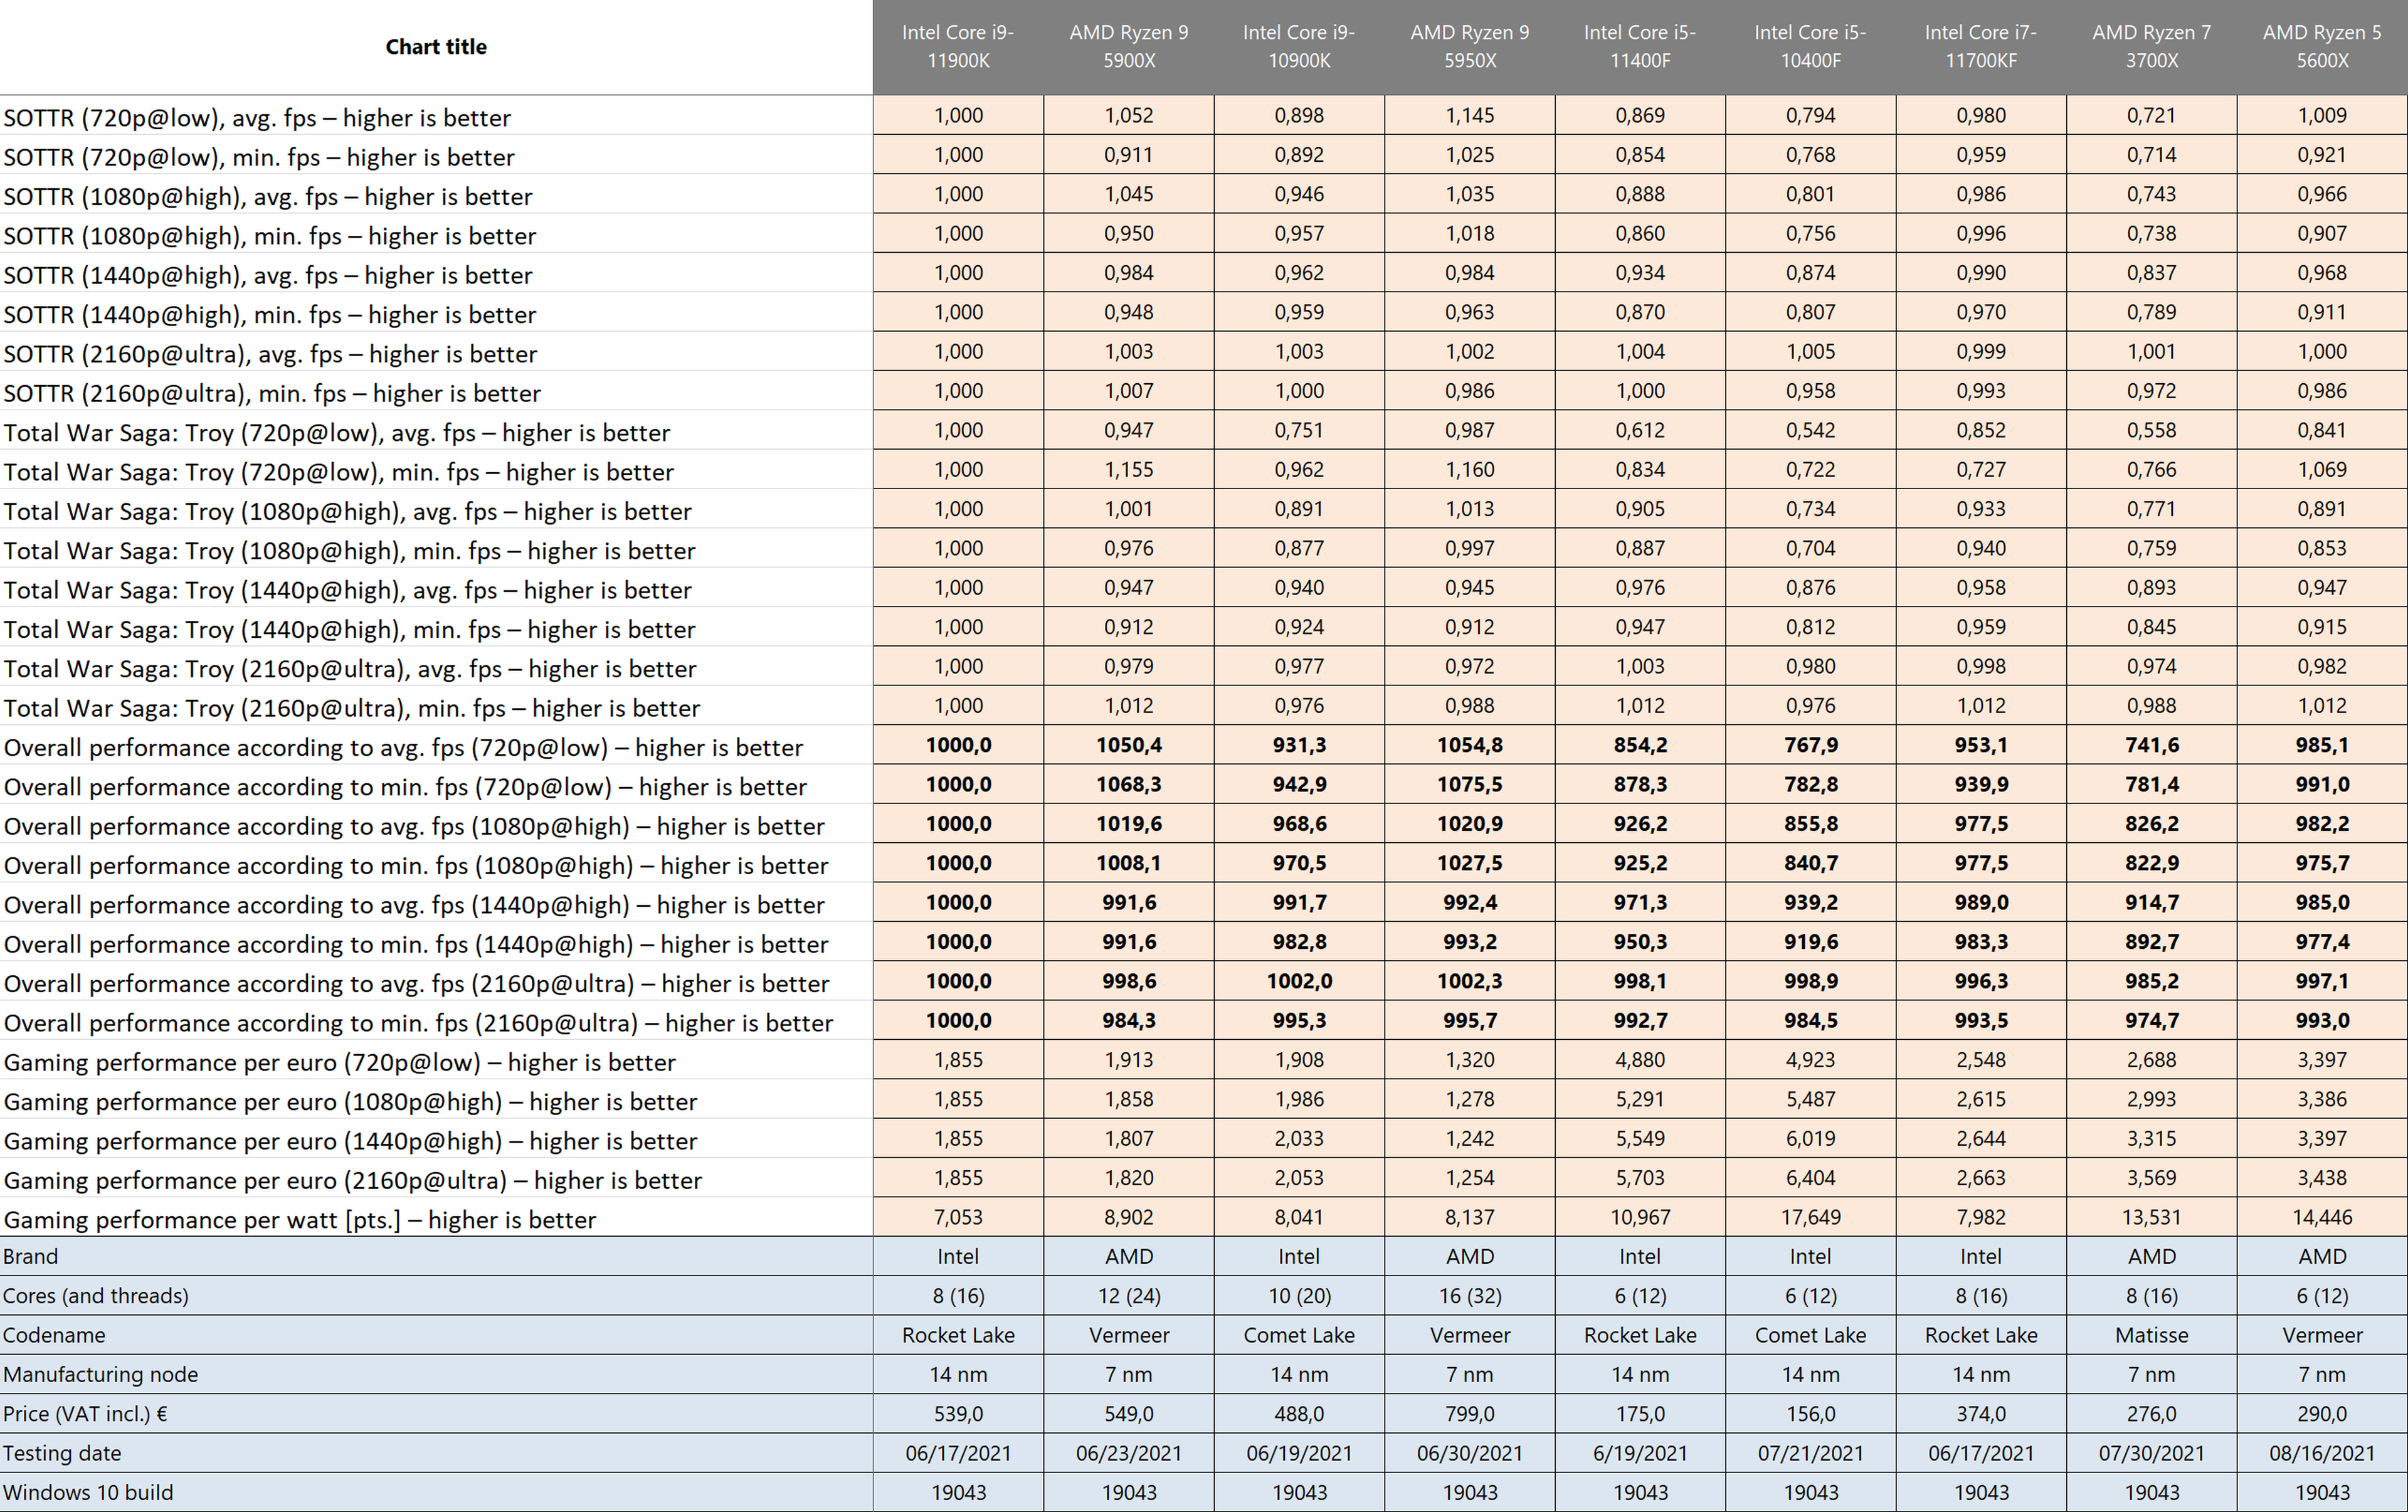
With this old method, more hardware-intensive games were outweighed by less demanding ones (in addition to DOOM, these also include CS:GO or F1 2020). However, this imbalance has a relatively simple solution, namely to calculate the percentage differences at the level of individual games. That’s how we’re doing it from now on. We calculate the mutual ratios or percentage differences with respect to one processor (Core i9-11900K) with “normalized” results to the value of 1. In the end, we multiply the results of the quotients by the value of 1,000, so that they do not often start with zero.
While another option was offered, normalization according to the highest-performance processor in each game, this would be significantly more complicated, as it will change over time, which means the continuous need for recalculation. But those are the details, and both methods are more reasonable than the one we’ve used so far.
After this adjustment, the numerical coefficients determining the gaming performance per euro are also new—now based on new fundamentals. If you’re interested, you can look at an older Ryzen 3700X test to compare how the individual ratios have changed. These have hardly changed, as you can see at first glance by comparing the lengths of the individual bars, but even so, the new way of determining the average game performance or game performance per unit of power consumption is more reasonable and more accurate.
We will proceed similarly in the tests of graphics cards, which will soon be expanded by the Sapphire RX 6600 XT Pulse.