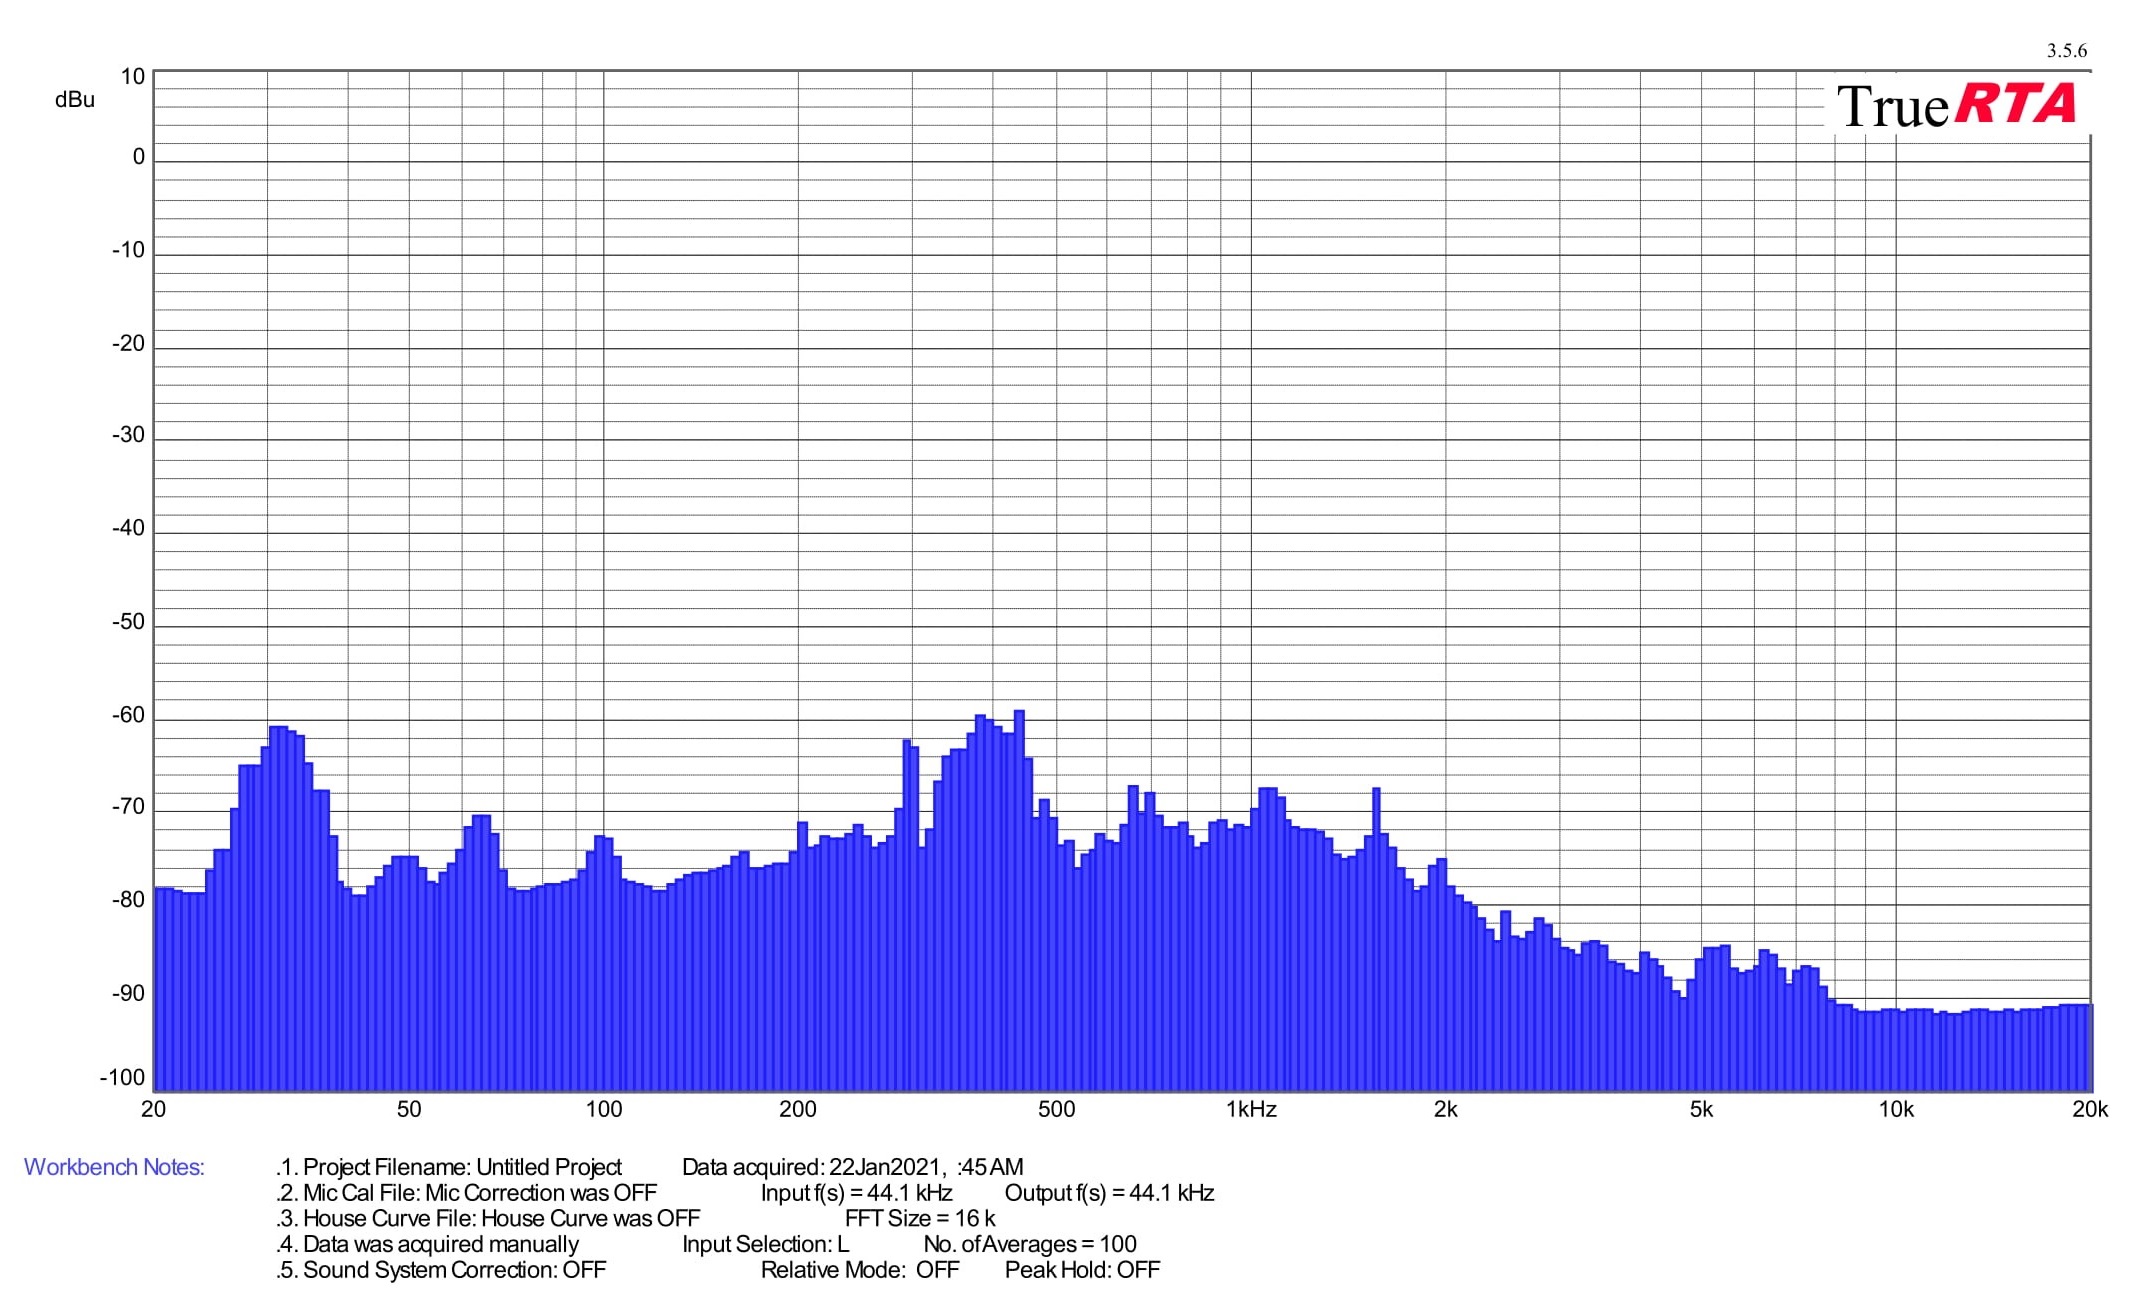
The PSU tests, which will be published shortly, will also include a detailed noise analysis. Each model has a different fan, a different grille in front of it, and operates at a different speed under the same loads, all of which shapes the different noise character. In order to make everything clear and accurate, spectral analysis of the sound is essential. This tells us which frequencies are noisier and how each PSU actually “sounds”.
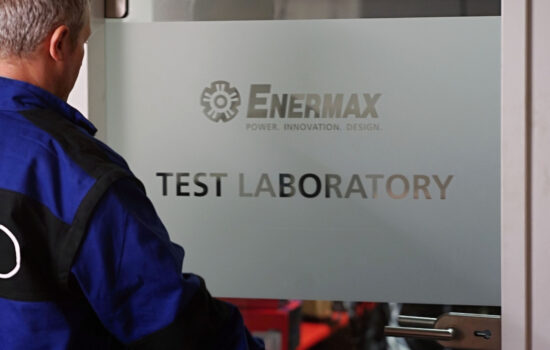
Previously, we showed you how we get data for the electrical quantities of PSUs, now we’ll look at the acoustic ones. Their measurement is already underway in our testlab, although we were already getting data in the Enermax external testlab. Namely, the fan speeds that correspond to the specified loads. These were read off at the end of each test along with the electrical quantities.
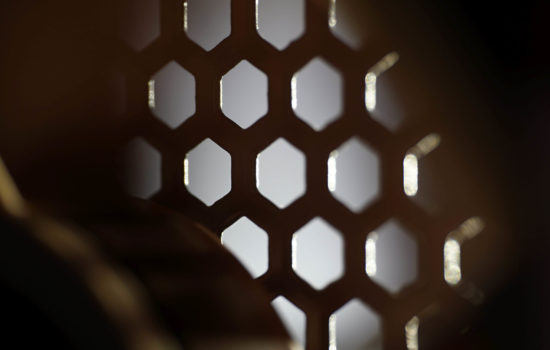
A small reflective sticker for the UNI-T UT372 laser tachometer is stuck on the impeller of each PSU fan. Thanks to this, we were able to record the speed values and reconstruct them at our HWCooling testlab. But this, naturally, without current load, so the sound does not include the sound of the coils, but only the interaction of the fan with the grille and the sticker (deflector). You might say that this is a bit of a shame, but on the other hand the sound of the coils is influenced by the quality of the grid voltage and so the result can always vary. But the nature of the aerodynamic measurements will, on the other hand, not.

The microphone (for creating spectrographs) and noise meter are a short distance from the PSUs, with the sensors 15 centimetres from the tip of the fan blades. Vertically, the sensors are centred. To give the highest resolution, with the greatest sensitivity, there is an amplifying parabolic shield around the sensors in combination with this. You know this from our other tests (fans or graphics cards), it is not something new.
The sensors of the sound recording instruments are in a radial position with respect to the fan. Otherwise (in an axial position) there would be some distortion due to more intense airflow around the microphone or noise meter when measuring from such a short distance.
In addition to the measurements normalized to the same electrical outputs, the test modes were also optimized to the same noise levels of 33, 39 and 45 dBA. So to the same levels as we have in our regular fan tests. We tune the individual modes until they reach the specified values (i.e., for example, exactly 39.0 dBA) in 30 consecutive samples, which are averaged in real time by a properly calibrated Reed R8080 noise meter. The same procedure (averaging a larger number of samples) results in the dBA value reported for each PSU output level. The TrueRTA spectrographs are also based on an average of 100 samples.
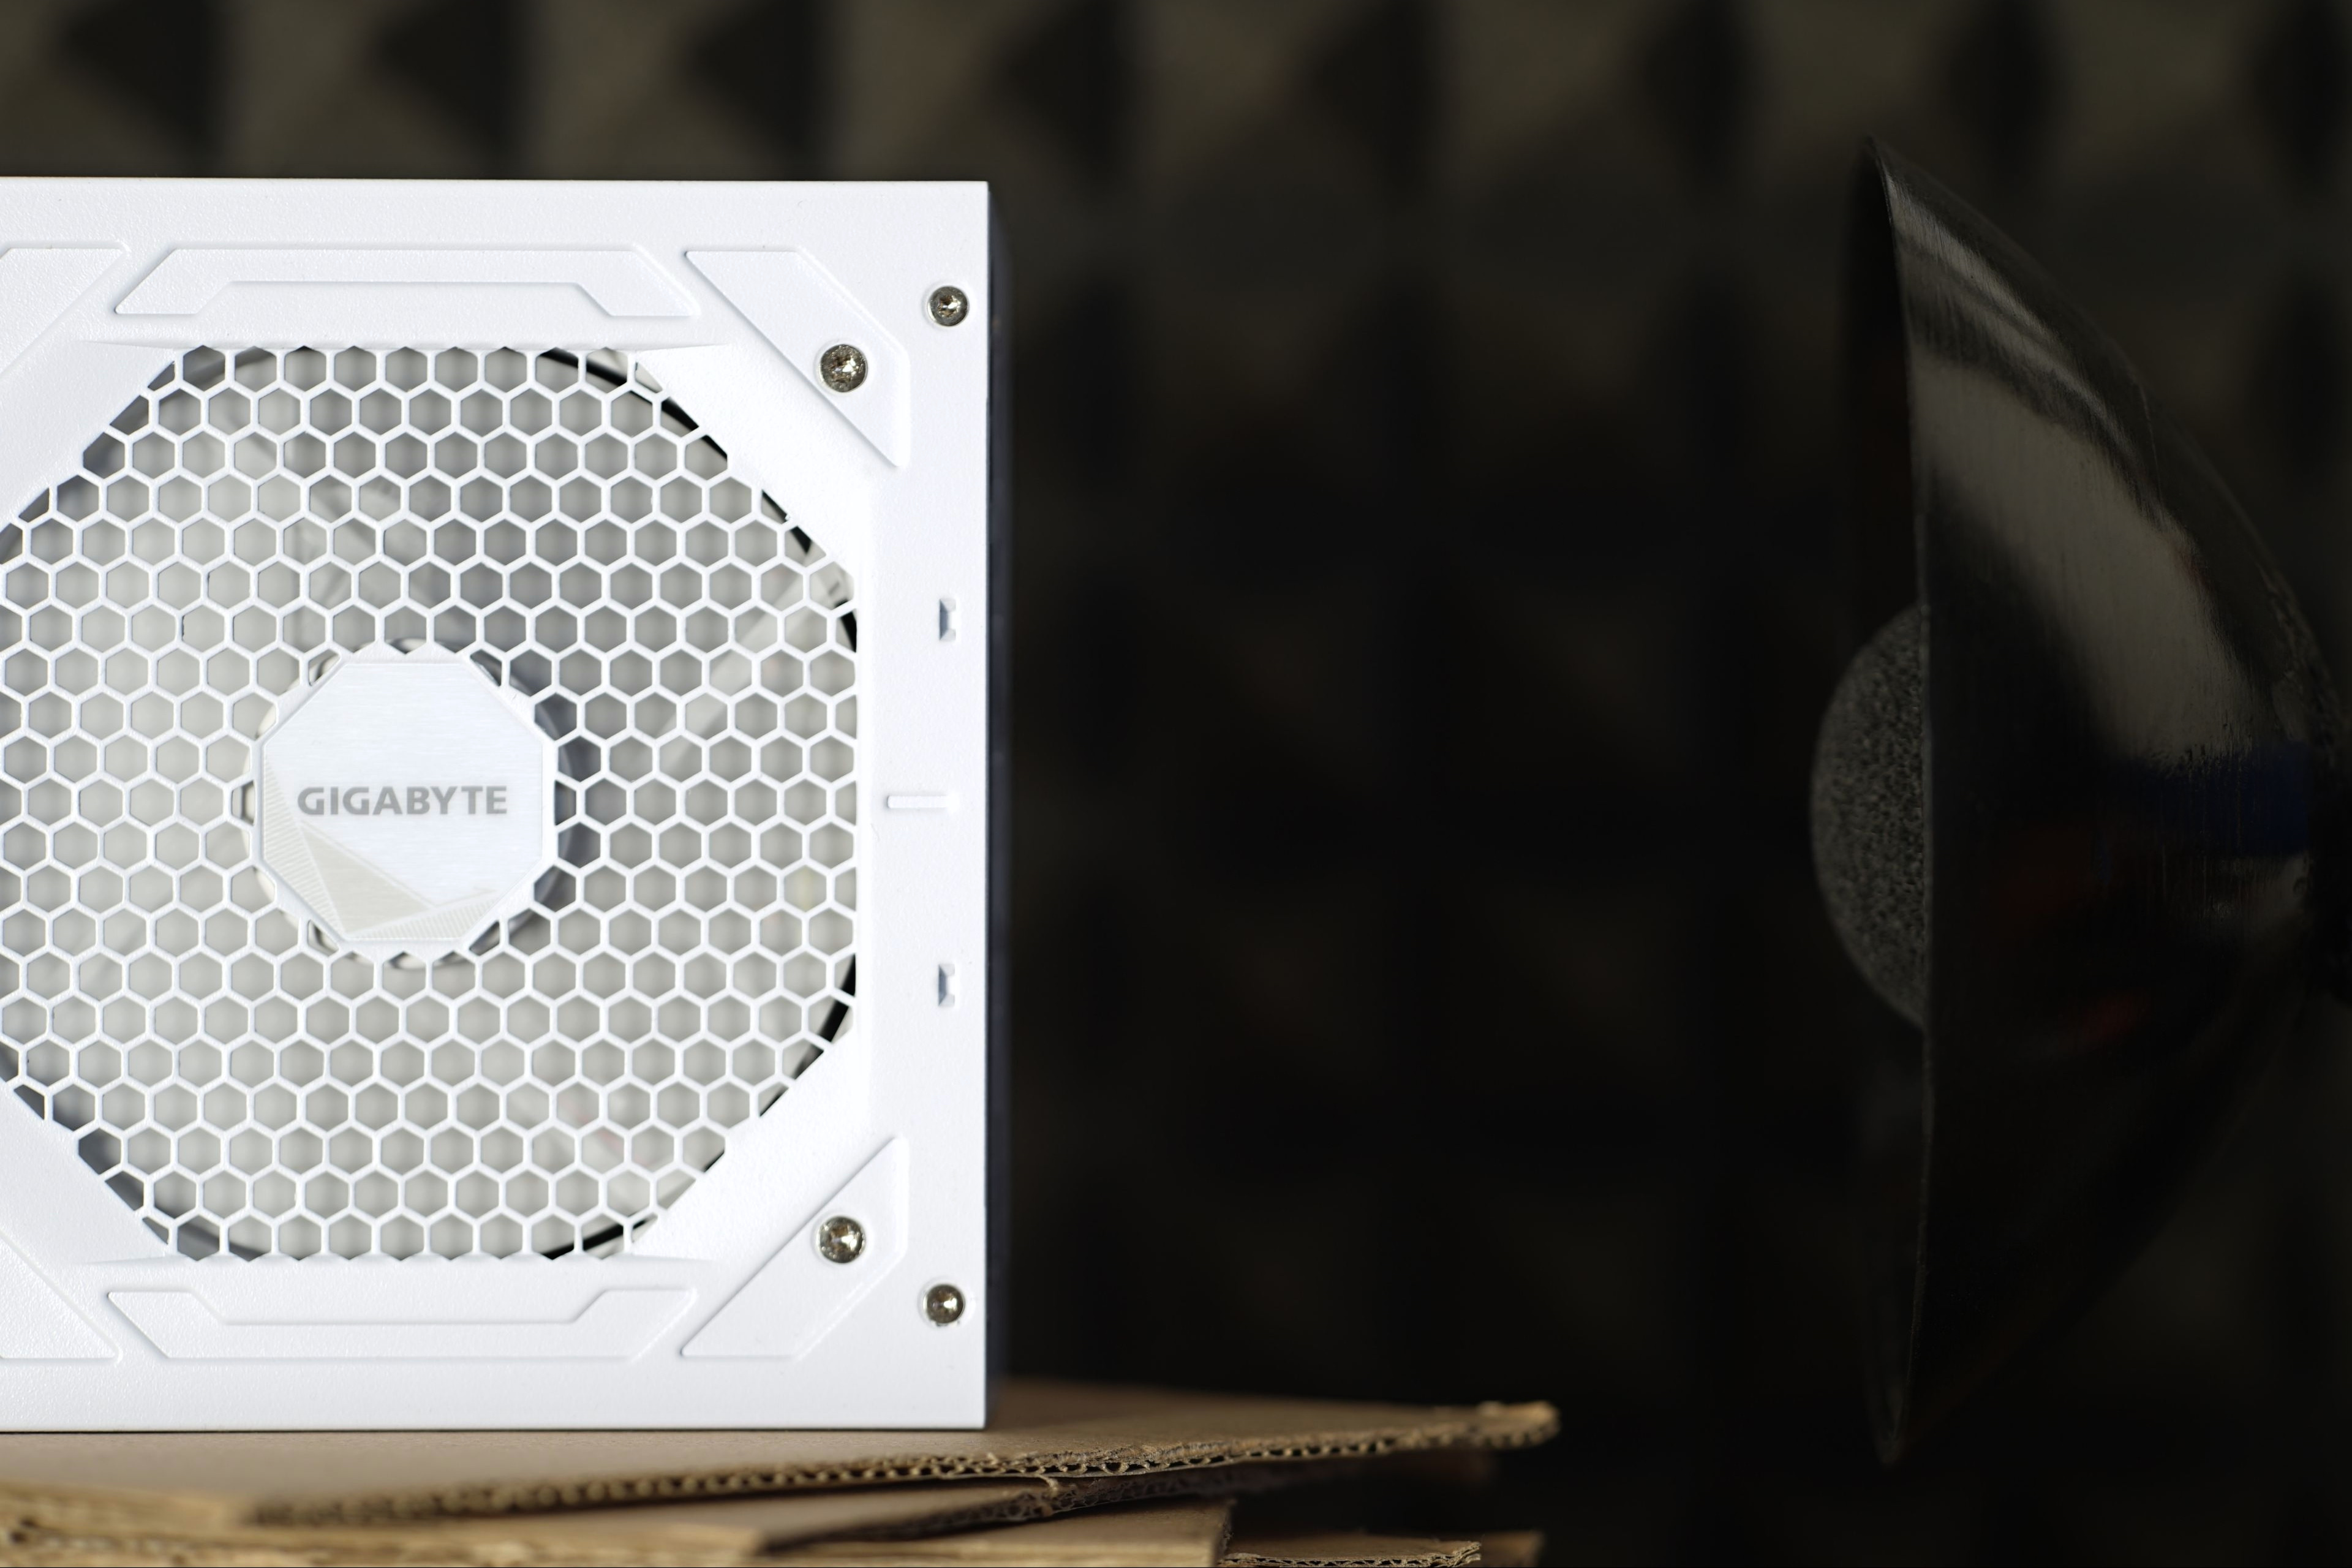
Measurements are taken at very low background noise levels in an area surrounded by acoustic panels to eliminate sound reflections. To suppress secondary noise, each PSU is then mounted on a cardboard stand, the design of which is made to ensure that it does not transmit vibrations to the platform and at the same time never itself enters resonant frequencies and thus does not artificially increase the noise floor during measurements.
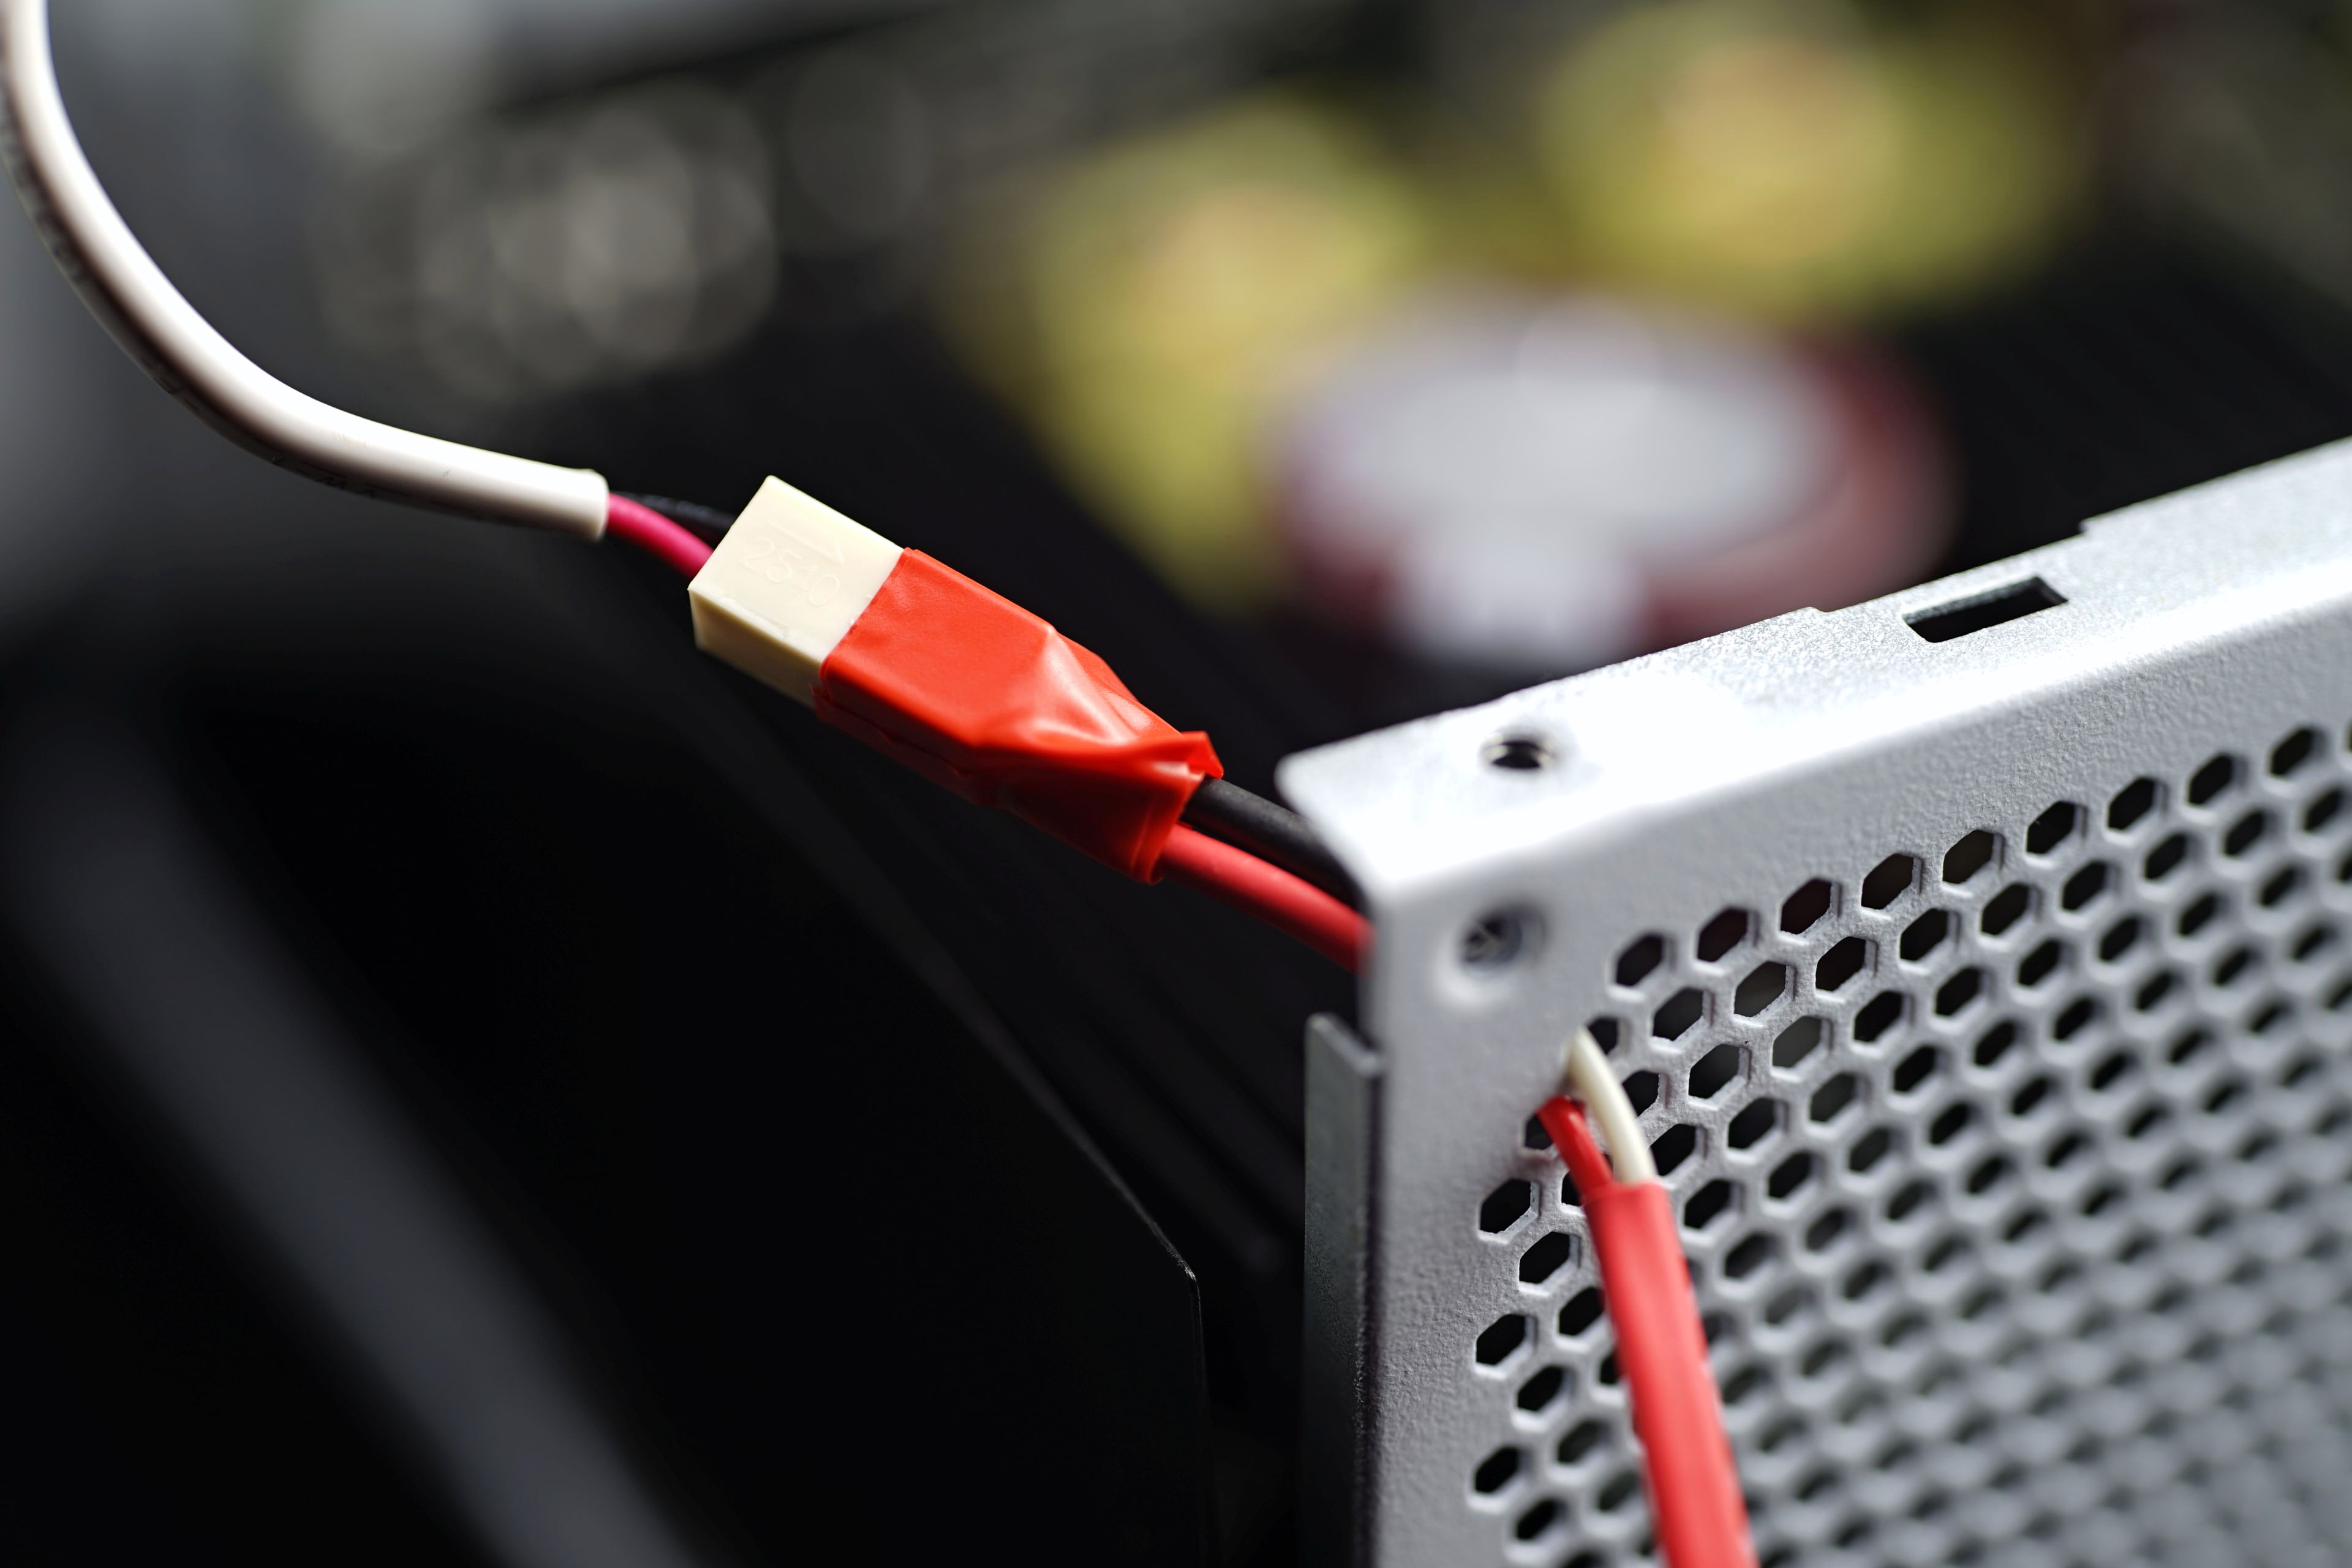
The Gophert CPS-3205 II laboratory power supply is used to set the exact speed required. The latter is passive, very quiet (moreover well isolated from the measurement set-up), so that its activity does not distort the measurements. The fans are connected to the power supply by custom cables through an output grille.
With this article, we wrap up the matters around the testing methodology. Next on the topic of computer PSUs, the very first test will finally come out.
English translation and edit by Jozef Dudáš