


Testing fans... differently
Here and there we come across the opinion that it is advisable to test fans in real life conditions, which we can easily refute. At the same time, we understand that a layman can best identify with the differences in component temperatures that arise precisely due to different fan airflows. To help you see the correlations of such tests with results from “unnatural” environments, here’s something we remembered.
You know from the nature of our endeavors that we are not big fans of in vivo testing(i.e. in real-life conditions). This is because the results tend to be non-transferable for many reasons. At the level of examining CPU or GPU temperature differences, the situation is distorted by the mere fact that different temperatures impact different performance/power draw and at different loads the TDP of the cooler with which the fans are tested is different.
Even if we disregard the above, in methodologies with noise normalization to the equal levels, by choosing a particular heatsink, while you artificially favor one fan, you unfairly harm another. For example, Noctua will certainly have an interest in having tests run on their heatsinks while Endorfy will want to see theirs.
And so will every manufacturer who psychoacoustically optimizes (typically with specific protrusions, cutouts, irregularities, …) their coolers so that the combination of a heatsink and a fan produces as little noise as possible. More specifically, to eliminate as much as possible the resonant frequencies causing tonal peaks. When tuning noise, these naturally determine which fan can be set to a higher speed and, conversely, which will have a lower speed at equal noise levels. Thus, on heatsink “A” the order from the most efficient fan to the least efficient will look different than on heatsink “B”. This is shaped by how a given heatsink design “fits” the fan. While this can be eliminated by using radiators with a generic fin pattern, we are back to what we were talking about a moment ago, at the beginning.

Then there are the system fans which always create different pressures in the test case with their settings, and these also affect each fan differently. There are many variables and reasons why the results of fan tests in a real-life environment cannot be used responsibly, and we will certainly do a detailed analysis on this one day. In this prologue, we wanted to touch lightly on the issue and we can slowly get to why we are now going to be taking the step of presenting you, as an exception, with a type of test that we ourselves do not consider to be who knows how relevant.
How we test the fans…
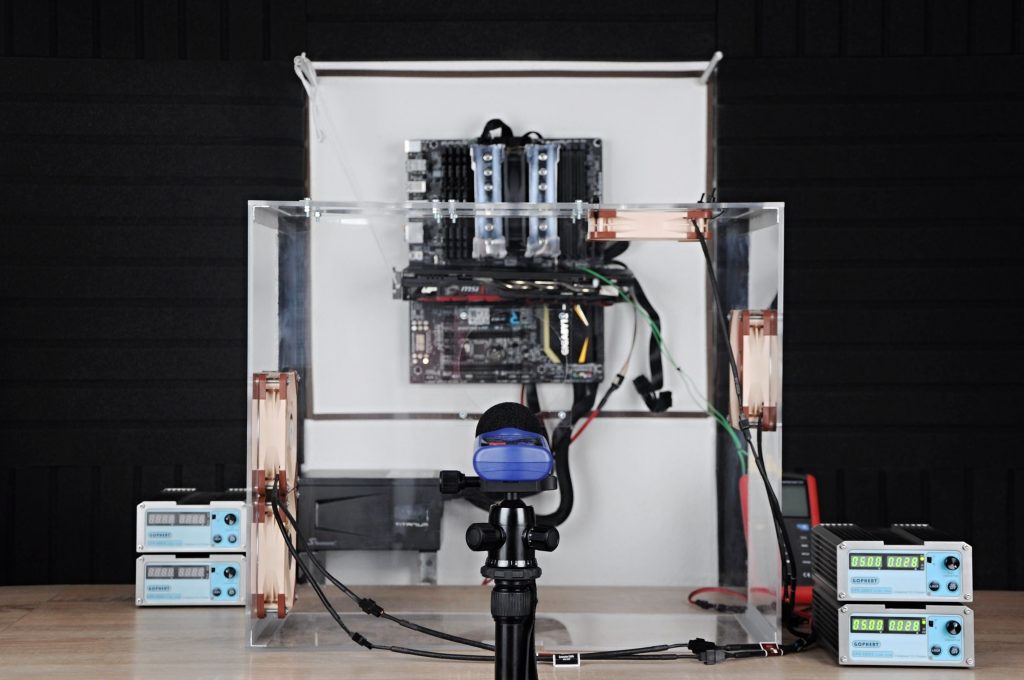
First of all, it should be noted that we do not test the fans on the fins of heatsinks, but in the system positions of the wind tunnel, which imitates a computer case. You may be familiar with this from testing methodologies for motherboards, processors or graphics cards. It is a single chamber square structure (500 × 420 × 225 mm) with no elements that would somehow influence the natural shape of the airflow trajectory of the fans. Of course, if we used a different structure, the ratios of the results might be different. But the design of the case itself also has an effect on better or worse acoustics, which will eventually manifest themselves in different ways when tuning the same noise ratios with different fans, changing (fan) model to model. Different cases mean different sound reflection between the walls and different amplification, different reactions to fan vibrations (and the consequent intensity of the resulting noise). Airflow routing is also different across different cases due to the particular aerodynamic design. In short, it’s alchemy.
We always test four fans in parallel in a ratio of two intake (front panel) and two exhaust fans (rear panel plus ceiling). Airflow is also balanced – all fans reach approximately the same speed (this was also an attractive option in our test of different system fan configurations).
The fans are tuned to three equal noise levels (36; 33 and 31.5 dBA) in a parallel electrical circuit, where all fans are supplied with the same voltage (an equally long cable with the same cross-section of cores runs to each fan from one channel, so that the voltage drop due to the resistance of the wires at the end is no different).

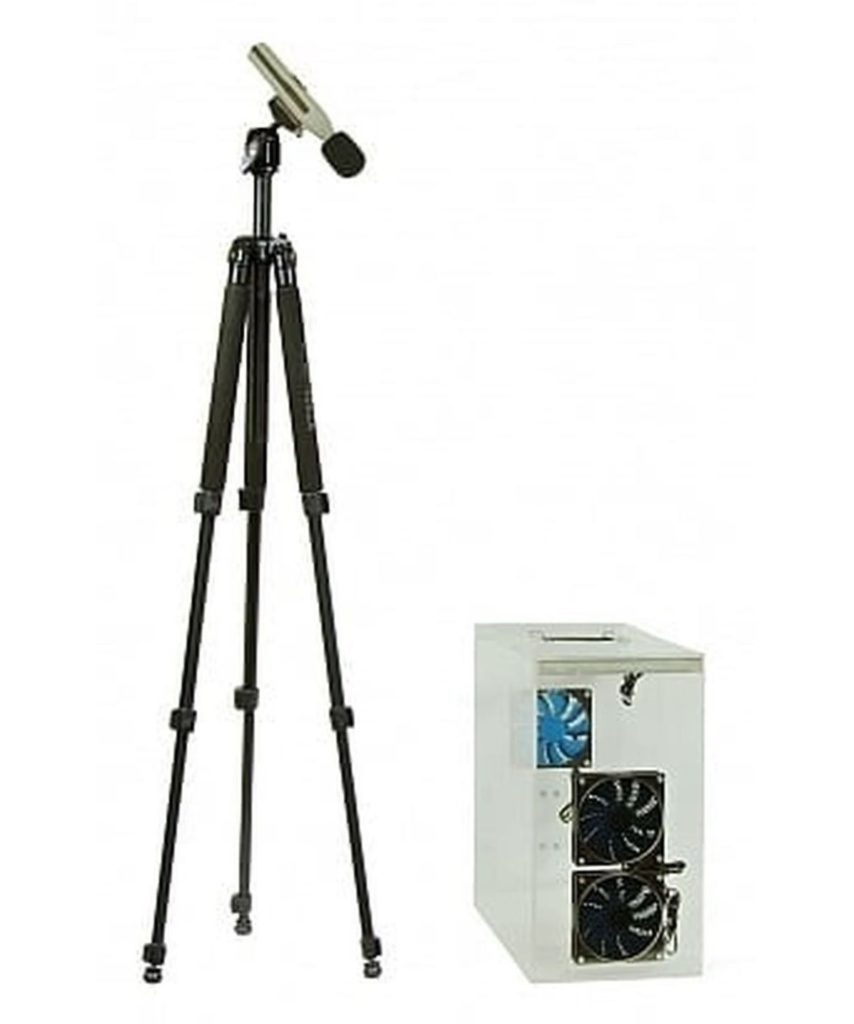
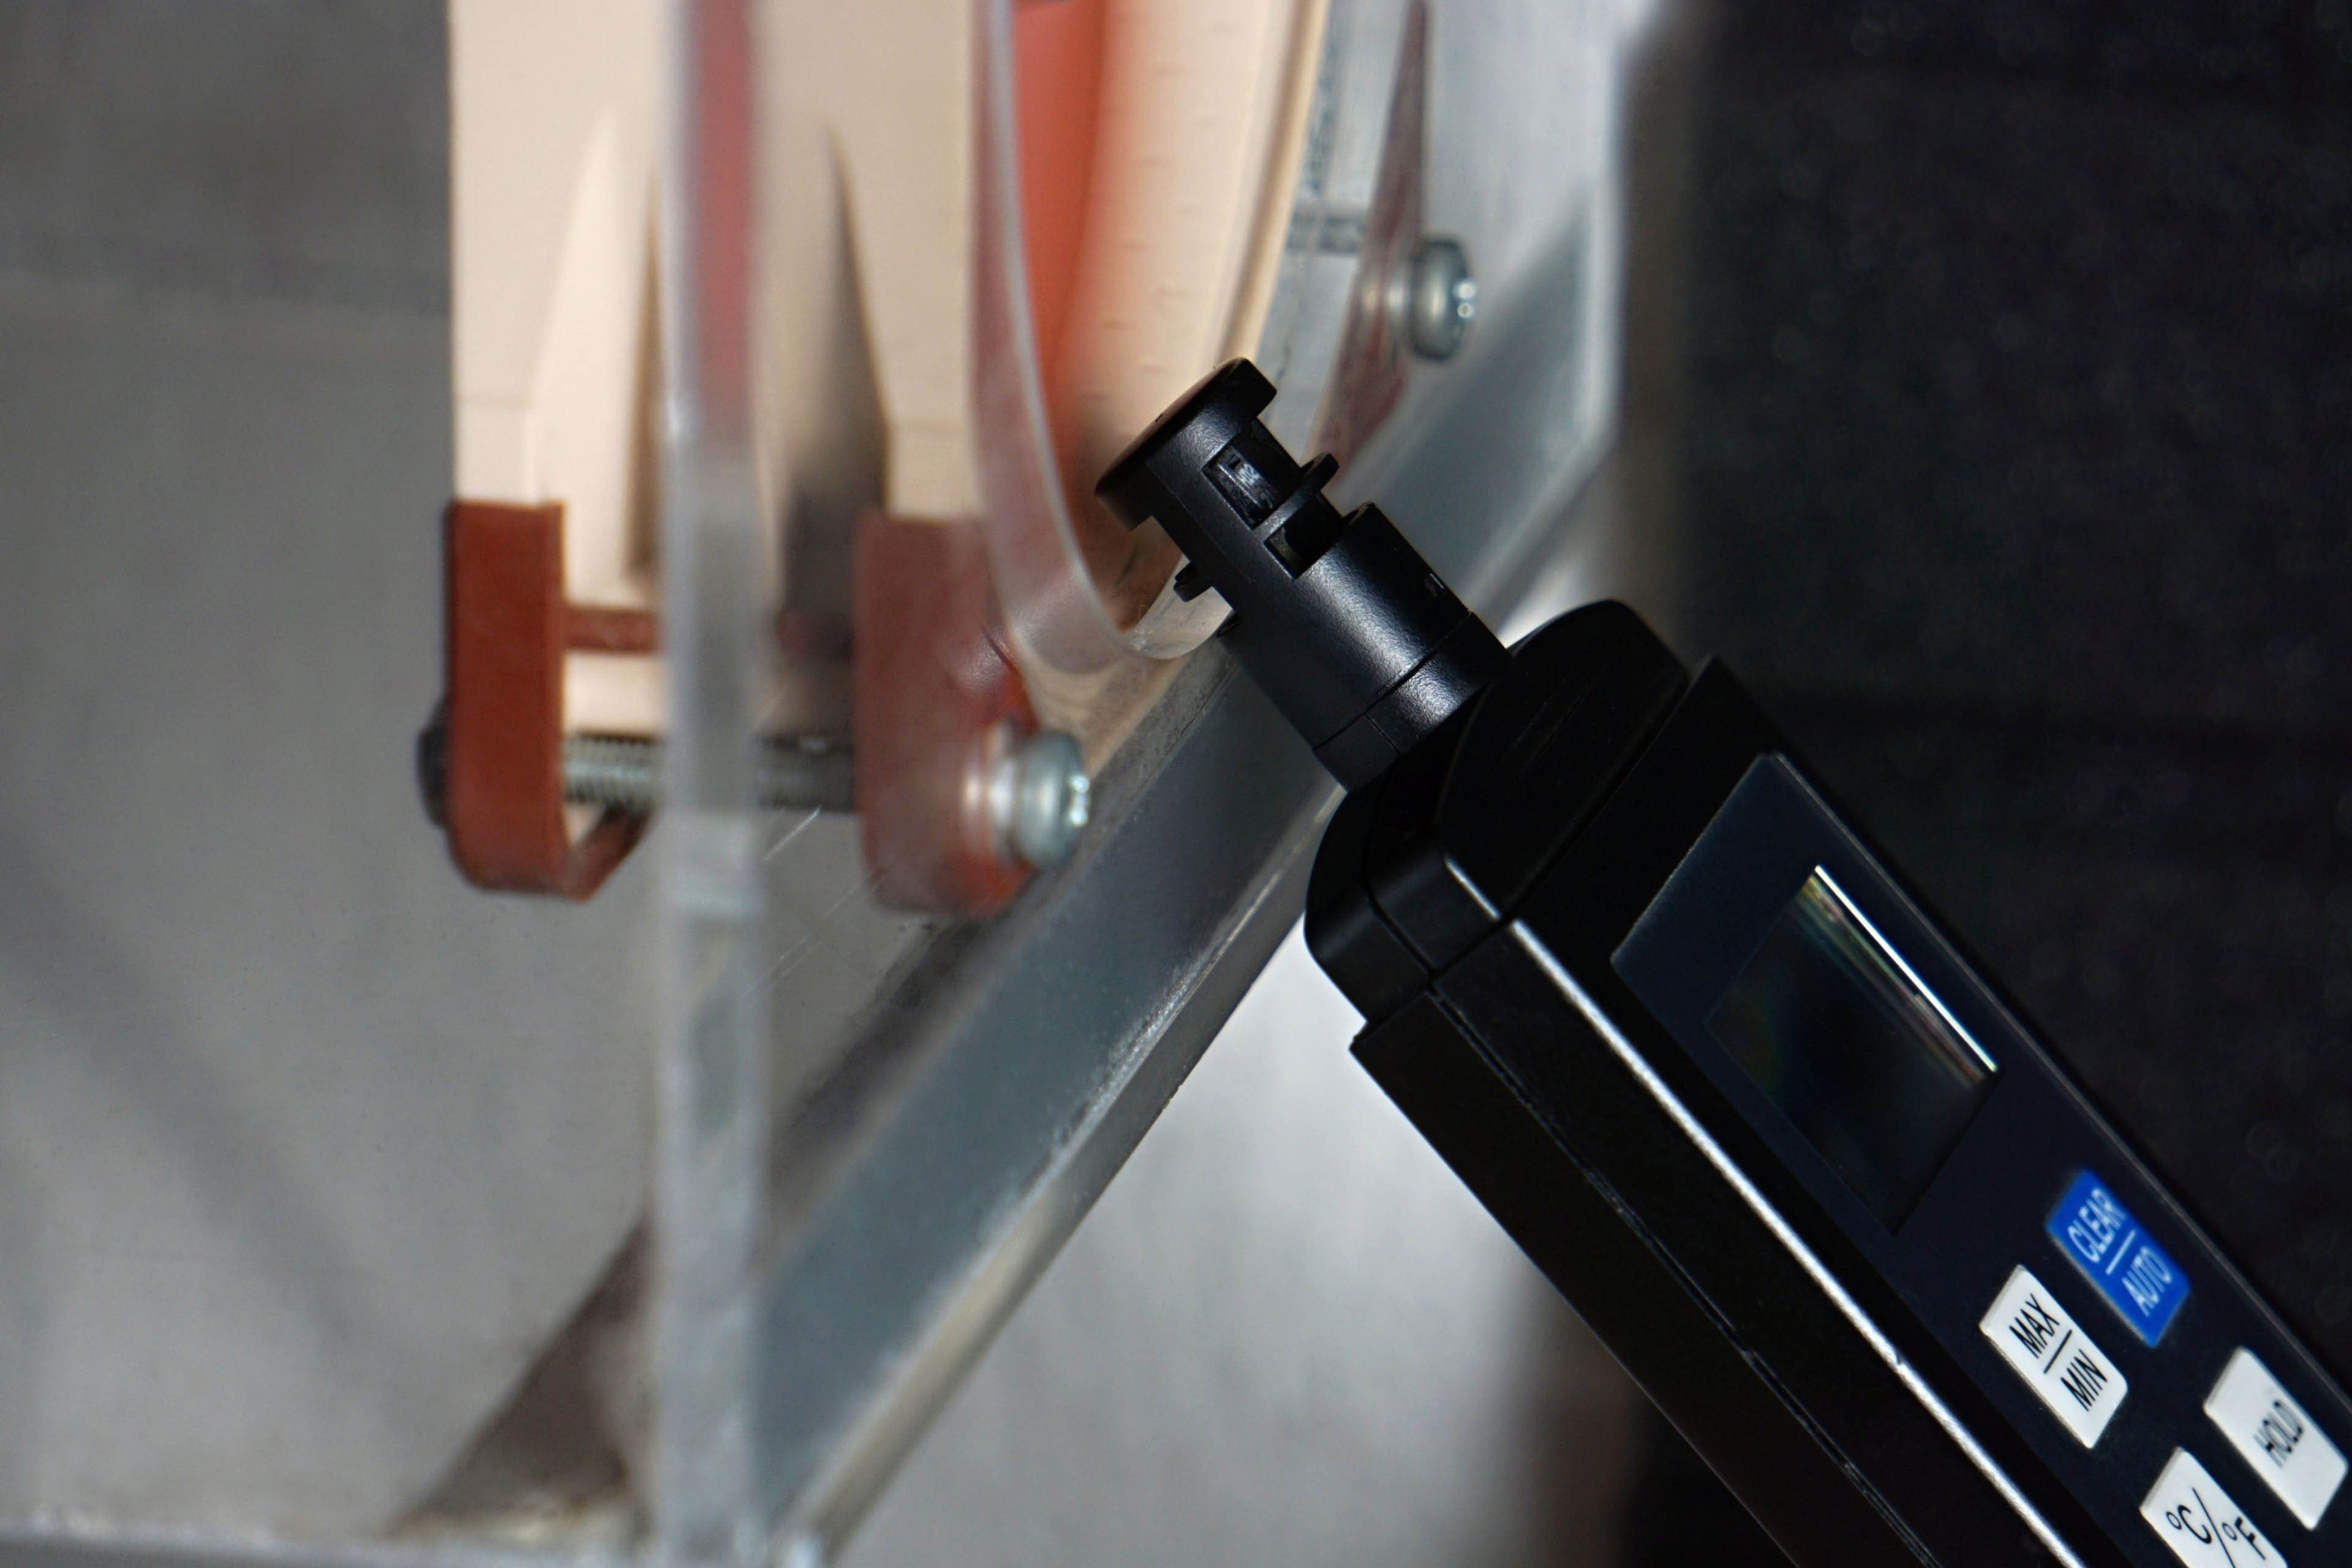
The noise level is measured with a Voltcraft SL-100 noise meter 70 cm from the longitudinal edge of the tunnel at a 30-degree angle, as you can see in the photo below. In the results chapters you will also find charts with the fan speeds that correspond to each fan, but only approximately. An accurate laser tachometer was not used for the reading, but the signal from the third pin of the connector, which is evaluated and interpreted by the Scythe Kaze Master Pro controller on a rather coarse scale with relatively larger divisions.
For completeness, it is also important to add that SilverStone SST-FF121 dust filters are used at the intake positions, the design of which also includes a hexagonal grille. The latter is characterised by a relatively large open area (certainly over 70%). These filters reduce airflow while increasing noise, but this also occurs in common practice – sometimes to a lesser extent, sometimes to a greater extent, depending on the design of the filters.
… and which models
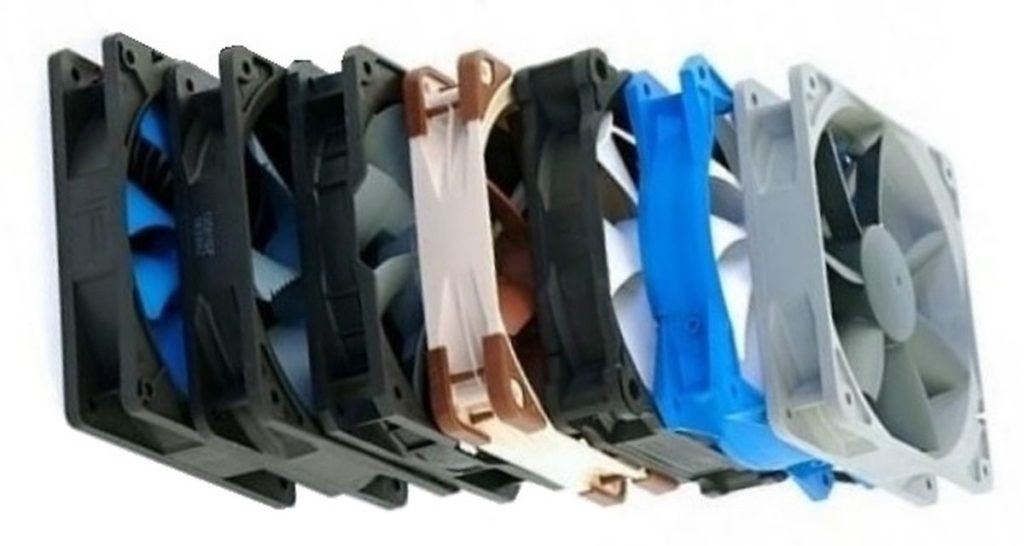
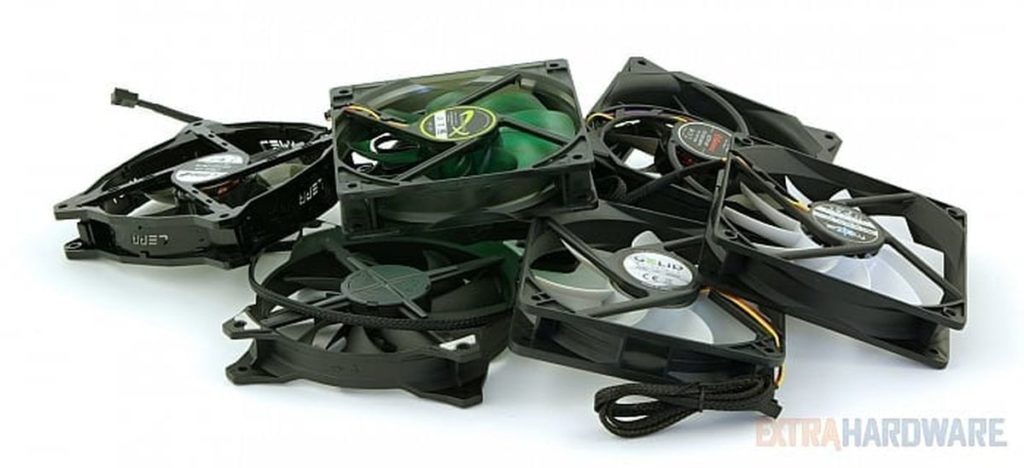
Considering the fact that this is an old test, which was created roughly eight years ago on the now defunct ExtraHardware.cz server, most of the fans are practically unavailable anymore. But there are still a few of them in stores, even in abundance. Such fans include the Noctua NF-S12A (FLX) and Noctua NF-S12B (redux-1200), which is kind of what this is all about, the point of digging this test out of the archives. Otherwise, there are also the Akasa Piranha, Enermax Twister Pressure, Fractal Design Silent R2, Gelid Silent 12, Lepa BOL.Quiet, Nanoxia Deep Silence, Phanteks PH-F120MP, Scythe Grand Flex, SilentiumPC Zephyr 120, SilverStone SST-AP123, SilverStone SST-FW122 and Zalman ZM-DF12 fans represented in the test. It is thus a comparative test of fourteen different models in 120 mm format.

| Brand and model of fan | Paper specicifations * | ||||||||
| Format (and thickness) in mm | Connecting | Speed [rpm] | Airflow [m3/h] | Static pressure [mm H2O] | Noise level [dBA] | Bearings | MTBF [h] | ||
| Motor | RGB LED | ||||||||
| Akasa Piranha | 120 (25) | 4-pin (PWM) | N/A | 600–1900 | 134.44 | 3,04 | 6.4–27.2 | hydrodynamic | 50 000 |
| Enermax Twister Pressure | 120 (25) | 4-pin (PWM) | N/A | 500–1800 | 33.36–135.85 | 0,67–3,85 | 14.0–25.0 | „Twister“ | 160 000 |
| Fractal Design Silent R2 | 120 (25) | 3-pin (DC) | N/A | 850–1200 | 48.93–69.98 | 0,54–1,07 | 12.0–15.0 | hydraulic | N/A |
| Gelid Silent 12 | 120 (25) | 3-pin (DC) | N/A | 1000 | 62.86 | 1,07 | 20.2 | hydrodynamic | 50 000 |
| Lepa BOL.Quiet | 120 (25) | 3-pin (DC) | N/A | 800–1600 | 69.18–138.38 | 0,83–1,92 | 8.0–18.0 | BOL | 160 000 |
| Nanoxia Deep Silence | 120 (25) | 3-pin (DC) | N/A | 1300 | 102.11 | 1,27 | 14.2 | rifle | 80 000 |
| Noctua NF-S12A FLX | 120 (25) | 3-pin (DC) | N/A | 1200 | 107.50 | 1,19 | 17.8 | SSO2 | 150 000 |
| Noctua NF-S12B redux-1200 | 120 (25) | 3-pin (DC) | N/A | 1200 | 100.58 | 1,31 | 18.1 | SSO | 50 000 |
| Phanteks PH-F120MP | 120 (25) | 4-pin (PWM) | N/A | 500–1800 | 90.56 | 1,72 | 25.0 | UFB | 150 000 |
| Scythe Grand Flex | 120 (25) | 4-pin (PWM) | N/A | 600–2400 | 41.12–164.46 | 0,28–4,55 | 13.5–39.5 | fluid | 120 000 |
| SilentiumPC Zephyr 120 | 120 (25) | 3-pin (DC) | N/A | 1100 | 67.28 | N/A | 13.6 | hydraulic | 50 000 |
| SilverStone SST-AP123 | 120 (25) | 3-pin (DC) | N/A | 1500 | 96.84 | 1,46 | 23.8 | fluid | 50 000 |
| SilverStone SST-FW122 | 120 (25) | 4-pin (PWM) | N/A | 1000–1800 | 72.38–129.97 | 0,31–1,52 | 18.4–28,1 | sleeve | 40 000 |
| Zalman ZM-DF12 | 120 (25) | 3-pin (DC) | N/A | 800–1600 | 108.33 | 1,20 | 18.0–33.0 | ANB | 500 000 |
* When reading performance values, a certain amount of tolerance must always be taken into account. For maximum speeds, ±10 % is usually quoted, minimum speeds can vary considerably more from piece to piece, sometimes manufacturers will overlap by as much as ±50 %. This must then also be adequately taken into account for air flow, static pressure and noise levels. If only one value is given in a table entry, this means that it always refers to the situation at maximum speed, which is achieved at 12 V or 100 % PWM intensity. The manufacturer does not disclose the lower limit of the performance specifications in its materials in that case. The price in the last column is always approximate.

Test setup
The “heating elements” used are an overclocked Intel Core i7-920 processor and a Sapphire HD 5870 graphics card. The power draw in the combined load of the FurMark stress test and IntelBurn Test (5 GB) is around 400 W. We also test in these conditions, each mode for 15 minutes, where the maximum temperatures reached are logged at the end (from GPU-Z and Core Temp). There are always pauses between each test to ensure that the tunnel temperature always reaches the baseline. The latter, by the way, is properly controlled at the intake so that it does not fall outside the range of 21–21.4 °C.
In order for the system fans to have the greatest possible effect, coolers with a large finning area are used and their fans are set to low speed. The CPU cooler is a Noctua NH-D15S@750rpm (i.e. the single fan variant where the front tower is also overly dependent on airflow through the case) and on the graphics card is the Thermalright T-Rad2 with two Noctua NF-A9x14 PWM fans connected via a deceleration adapter (LNA).
On the power delivery of the graphics card there is also a large additional heatsink Thermalright VRM R4 (without a fan). We also take temperature readings from these locations (from the VRM), referred to as “Graphics card VRM sensor 1” and “Graphics card VRM sensor 2” in the charts. In addition, the GPU temperature and of course the CPU temperature are recorded. These are four variously positioned points, which can be used as a guide to evaluate which fans are achieving what cooling effectiveness.
Here and there we come across the opinion that it is advisable to test fans in real life conditions, which we can easily refute. At the same time, we understand that a layman can best identify with the differences in component temperatures that arise precisely due to different fan airflows. To help you see the correlations of such tests with results from “unnatural” environments, here’s something we remembered.
Results: Medium noise level

| Fans | Speed (rpm)@36 dBA |
| Akasa Piranha | 900 |
| Enermax Twister Pressure | 810 |
| Fractal Design Silent R2 | 720 |
| Gelid Silent 12 | 840 |
| Lepa BOL.Quiet | 810 |
| Nanoxia Deep Silence | 840 |
| Noctua NF-S12A FLX | 930 |
| Noctua NF-S12B redux-1200 | 720 |
| Phanteks PH-F120MP | 780 |
| Scythe Grand Flex | 780 |
| SilentiumPC Zephyr 120 | 840 |
| SilverStone SST-AP123 | 840 |
| SilverStone SST-FW122 | 780 |
| Zalman ZM-DF12 | 780 |
Here and there we come across the opinion that it is advisable to test fans in real life conditions, which we can easily refute. At the same time, we understand that a layman can best identify with the differences in component temperatures that arise precisely due to different fan airflows. To help you see the correlations of such tests with results from “unnatural” environments, here’s something we remembered.
Results: Low noise level (33 dBA)
| Fans | Speed (rpm)@33 dBA |
| Akasa Piranha | N/A |
| Enermax Twister Pressure | 570 |
| Fractal Design Silent R2 | 540 |
| Gelid Silent 12 | 630 |
| Lepa BOL.Quiet | 570 |
| Nanoxia Deep Silence | 600 |
| Noctua NF-S12A FLX | 750 |
| Noctua NF-S12B redux-1200 | 570 |
| Phanteks PH-F120MP | 600 |
| Scythe Grand Flex | 510 |
| SilentiumPC Zephyr 120 | 630 |
| SilverStone SST-AP123 | 660 |
| SilverStone SST-FW122 | 450 |
| Zalman ZM-DF12 | 570 |
Here and there we come across the opinion that it is advisable to test fans in real life conditions, which we can easily refute. At the same time, we understand that a layman can best identify with the differences in component temperatures that arise precisely due to different fan airflows. To help you see the correlations of such tests with results from “unnatural” environments, here’s something we remembered.
Results: Very low noise level (31,5 dBA)
| Fans | Speed (rpm)@31,5 dBA |
| Akasa Piranha | N/A |
| Enermax Twister Pressure | N/A |
| Fractal Design Silent R2 | N/A |
| Gelid Silent 12 | 330 |
| Lepa BOL.Quiet | N/A |
| Nanoxia Deep Silence | 300 |
| Noctua NF-S12A FLX | 570 |
| Noctua NF-S12B redux-1200 | 330 |
| Phanteks PH-F120MP | 360 |
| Scythe Grand Flex | N/A |
| SilentiumPC Zephyr 120 | 330 |
| SilverStone SST-AP123 | N/A |
| SilverStone SST-FW122 | N/A |
| Zalman ZM-DF12 | N/A |
Here and there we come across the opinion that it is advisable to test fans in real life conditions, which we can easily refute. At the same time, we understand that a layman can best identify with the differences in component temperatures that arise precisely due to different fan airflows. To help you see the correlations of such tests with results from “unnatural” environments, here’s something we remembered.
Conclusion
This time the aim was not to create a comparative database from which the right fan could be selected according to the results. Certainly, a sort of ranking from the most efficient fan to the least efficient fan has emerged from the meticulously worked out tests in the real-life environment. But it should be noted that these results apply to this one particular model situation (of the components used) and even after replacing the case itself, the relationships between fans will more or less diverge as they always do in this type of tests.
That’s why the results from various tests in real-life environments don’t scale too much, and sorting out that this or that fan is a hair more efficient than another is always irrelevant, and we won’t resort to it either. However, if we reduce the resolution and talk about, say, three levels of efficiency (more efficient, moderately efficient, less efficient) within the fans under consideration, that might not be quite as misleading. Still, we’re treading a fine line, but it’s unlikely that a Noctua NF-S12B redux-1200 fan at the tail of the charts, for example, will perform as well as its official specs might make it appear.
By pointing out these results we certainly don’t want to harm Noctua (they really don’t deserve it for doing such a great job on fans, especially the more modern ones) or make them angry, but we need to keep things in order. That’s all we care about. Everything needs to have a clear explanation.
A detailed analysis of the NF-S12B with testing using standard methodology will not be long in coming, and then these materials (tests in a real-life environment) may be very useful. Surely you can already guess that we know that this fan, like the more modern NF-S12A design, will not be among the most efficient as many people consider them to be when it comes to system fans for the case.
The NF-S12A performs better (than the NF-S12B), as you can see in these tests – it’s usually at the front of the peloton among the tested fans. However, it is important to understand the fans it faces. They’re all old, long-outdated designs, and none of them come close in efficiency to the current cutting edge, where Noctua has long had the NF-A12x25. In some of the thermal tests from this article, the NF-S12A is matched by the SilverStone SST-AP123, which occupies the bottom rungs of efficiency results in the competition of current fans.
At the moment, we won’t go into the design details and the reasons why Noctua S-Series fans have some weaknesses aerodynamically, let’s say. But everything will come and you will understand everything. We’ve released this test as a teaser for those who would try to contradict the conclusions of standard tests by saying “but in a real-life environment…”… no, even there, miracles don’t happen.
English translation and edit by Jozef Dudáš