


MSI RTX 3090 Gaming X Trio – details
No compromises in performance! If this is your motto, then you cannot miss the test of the graphics card GeForce RTX 3090. It will also feed 4K resolution, has the fastest ray tracing and OptiX acceleration, huge video memory and, the review sample from MSI also has many more attractive features. The biggest drawback, as is usual with high-end hardware, is the price. It is really high.
Under the Ampere architecture, Nvidia has released a GeForce graphics card where the last two digits exceed 80 after a very long time. The last time it was the GTX 690 (Maxwell) with two graphics cores on the PCB. It seems multi-GPU configurations are definitely behind us, and the GeForce 3090 has one huge GA102 core with 628.4 mm². This is, interestingly, a larger area than twice the GK104 in the mentioned GTX 690, but less than the sum of the areas of two Antilles XT GPUs in the HD 6990. With this Radeon, the RTX 3090 has a similar TDP. It also significantly exceeds 300 W, with the FE card Nvidia states 350 W, and with the Gaming X Trio, which we will discuss in this article, MSI states up to 370 W in the specs table. And that’s a huge one!
It is worth mentioning that the RTX 3080 also uses the GA102 core. However, the variant (300-A1) in the 3090 is better equipped and has 14 SM extra (82 in total) and proportionally other units, listed in the detailed table in the following chapter. The RTX 3090 also has a wider memory bus (384-bit), with the extreme 24 GB of GDDR6X memory and 19.5 GHz effective clock.
MSI RTX 3090 Gaming X Trio – details
The RTX 3090 Gaming X Trio is a good chunk of hardware. It is 323 mm long, which is already a length where you need to increase your attention and measure the free space in the case. In some (cases) it could happen that such a long graphics card will collide with drive bays or today rather with a radiator of the liquid cooler, which is currently installed most often behind the front panel. Most cases will not let you down, but in the shorter or generally smaller atypical ones, it can be very close.
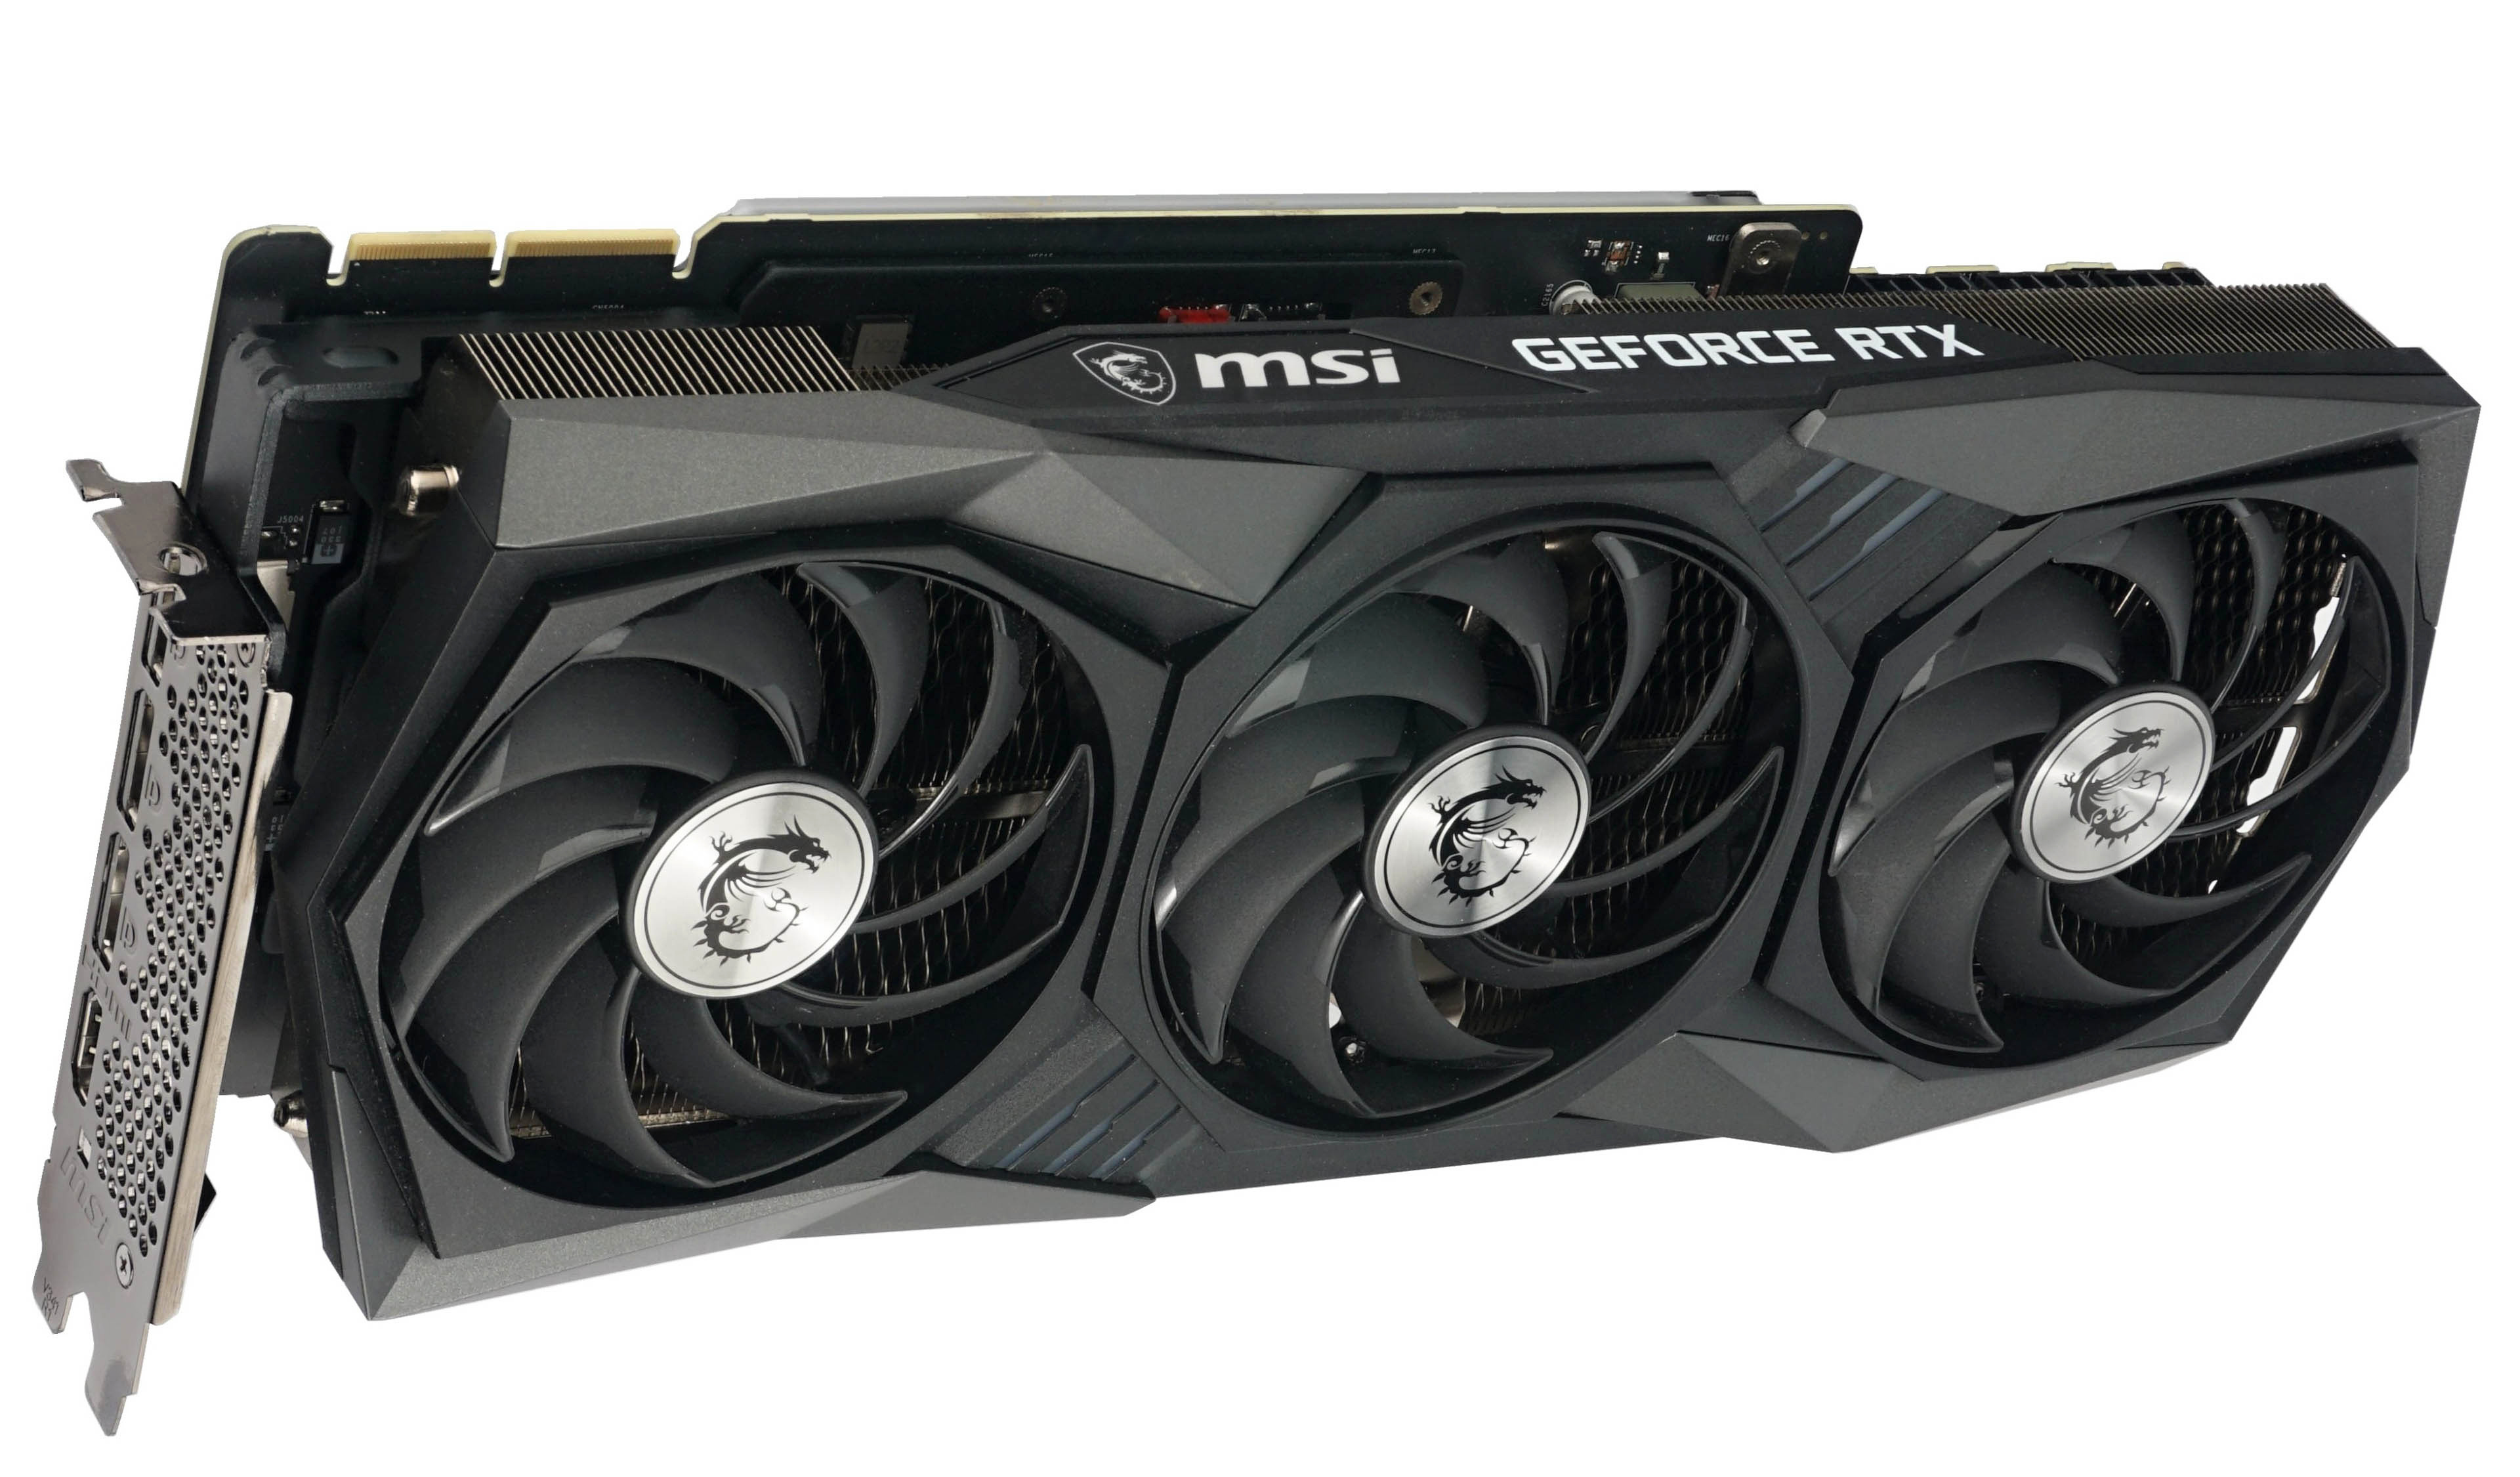
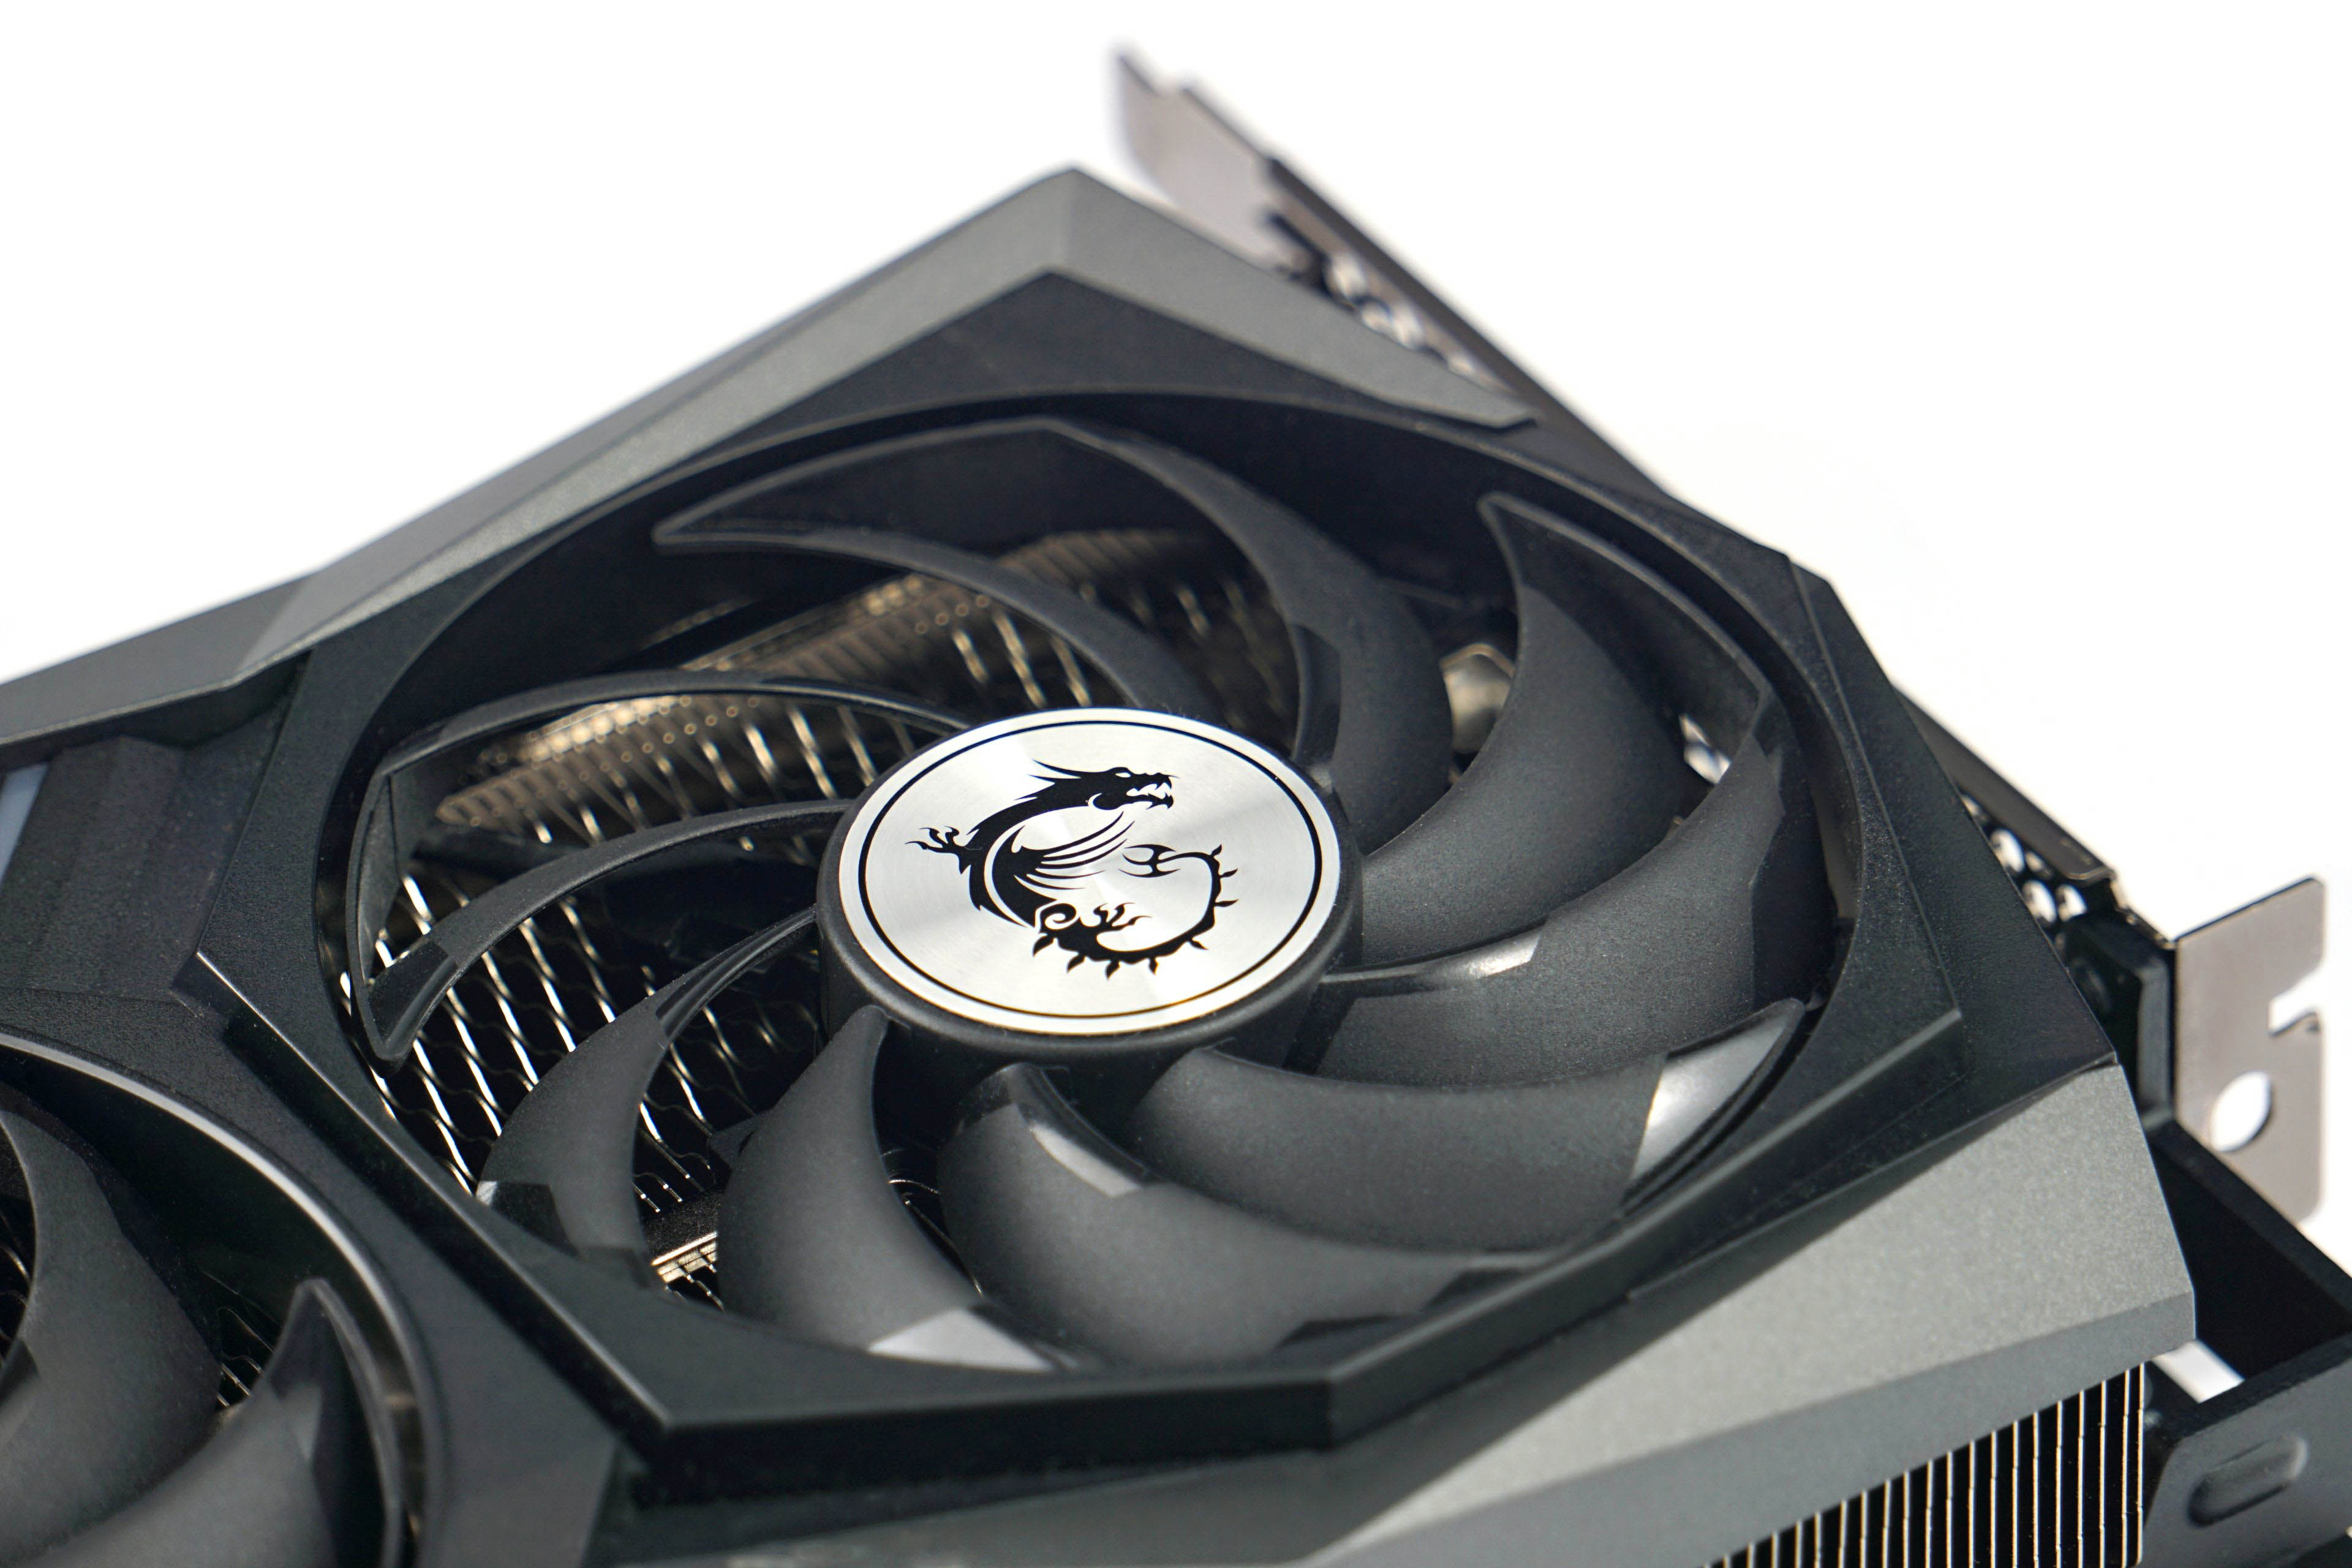
The new generation of the cooler Tri Frozr (2) with Torx 4.0 fans is characterized by a few changes, which mainly concern the fans themselves. After testing different formats and combinations on previous generations of MSI graphics cards, all fans now have a uniform 90 mm format, with all of them rotating in the same direction from right to left. But the main thing that has changed is the shape of the rotor. It did not change much in the last two generations of Tri Frozr and has not undergone significant adjustments until now.
The blades are straight (previously curved in the middle) and smooth-surfaced, without ridges, which contributed to a more laminar air flow across the heatsink. MSI wants to achieve this now, but in a different way. Namely, so that the blades are joined in pairs at the ends, which is also supported by a shiny surface. On a very theoretical level, this could help to achieve higher static pressure required to effectively push air through a massive radiator. The leading edges of the radiator fins are, by the way, jagged to achieve the most favorable cooling performance/noise ratio.
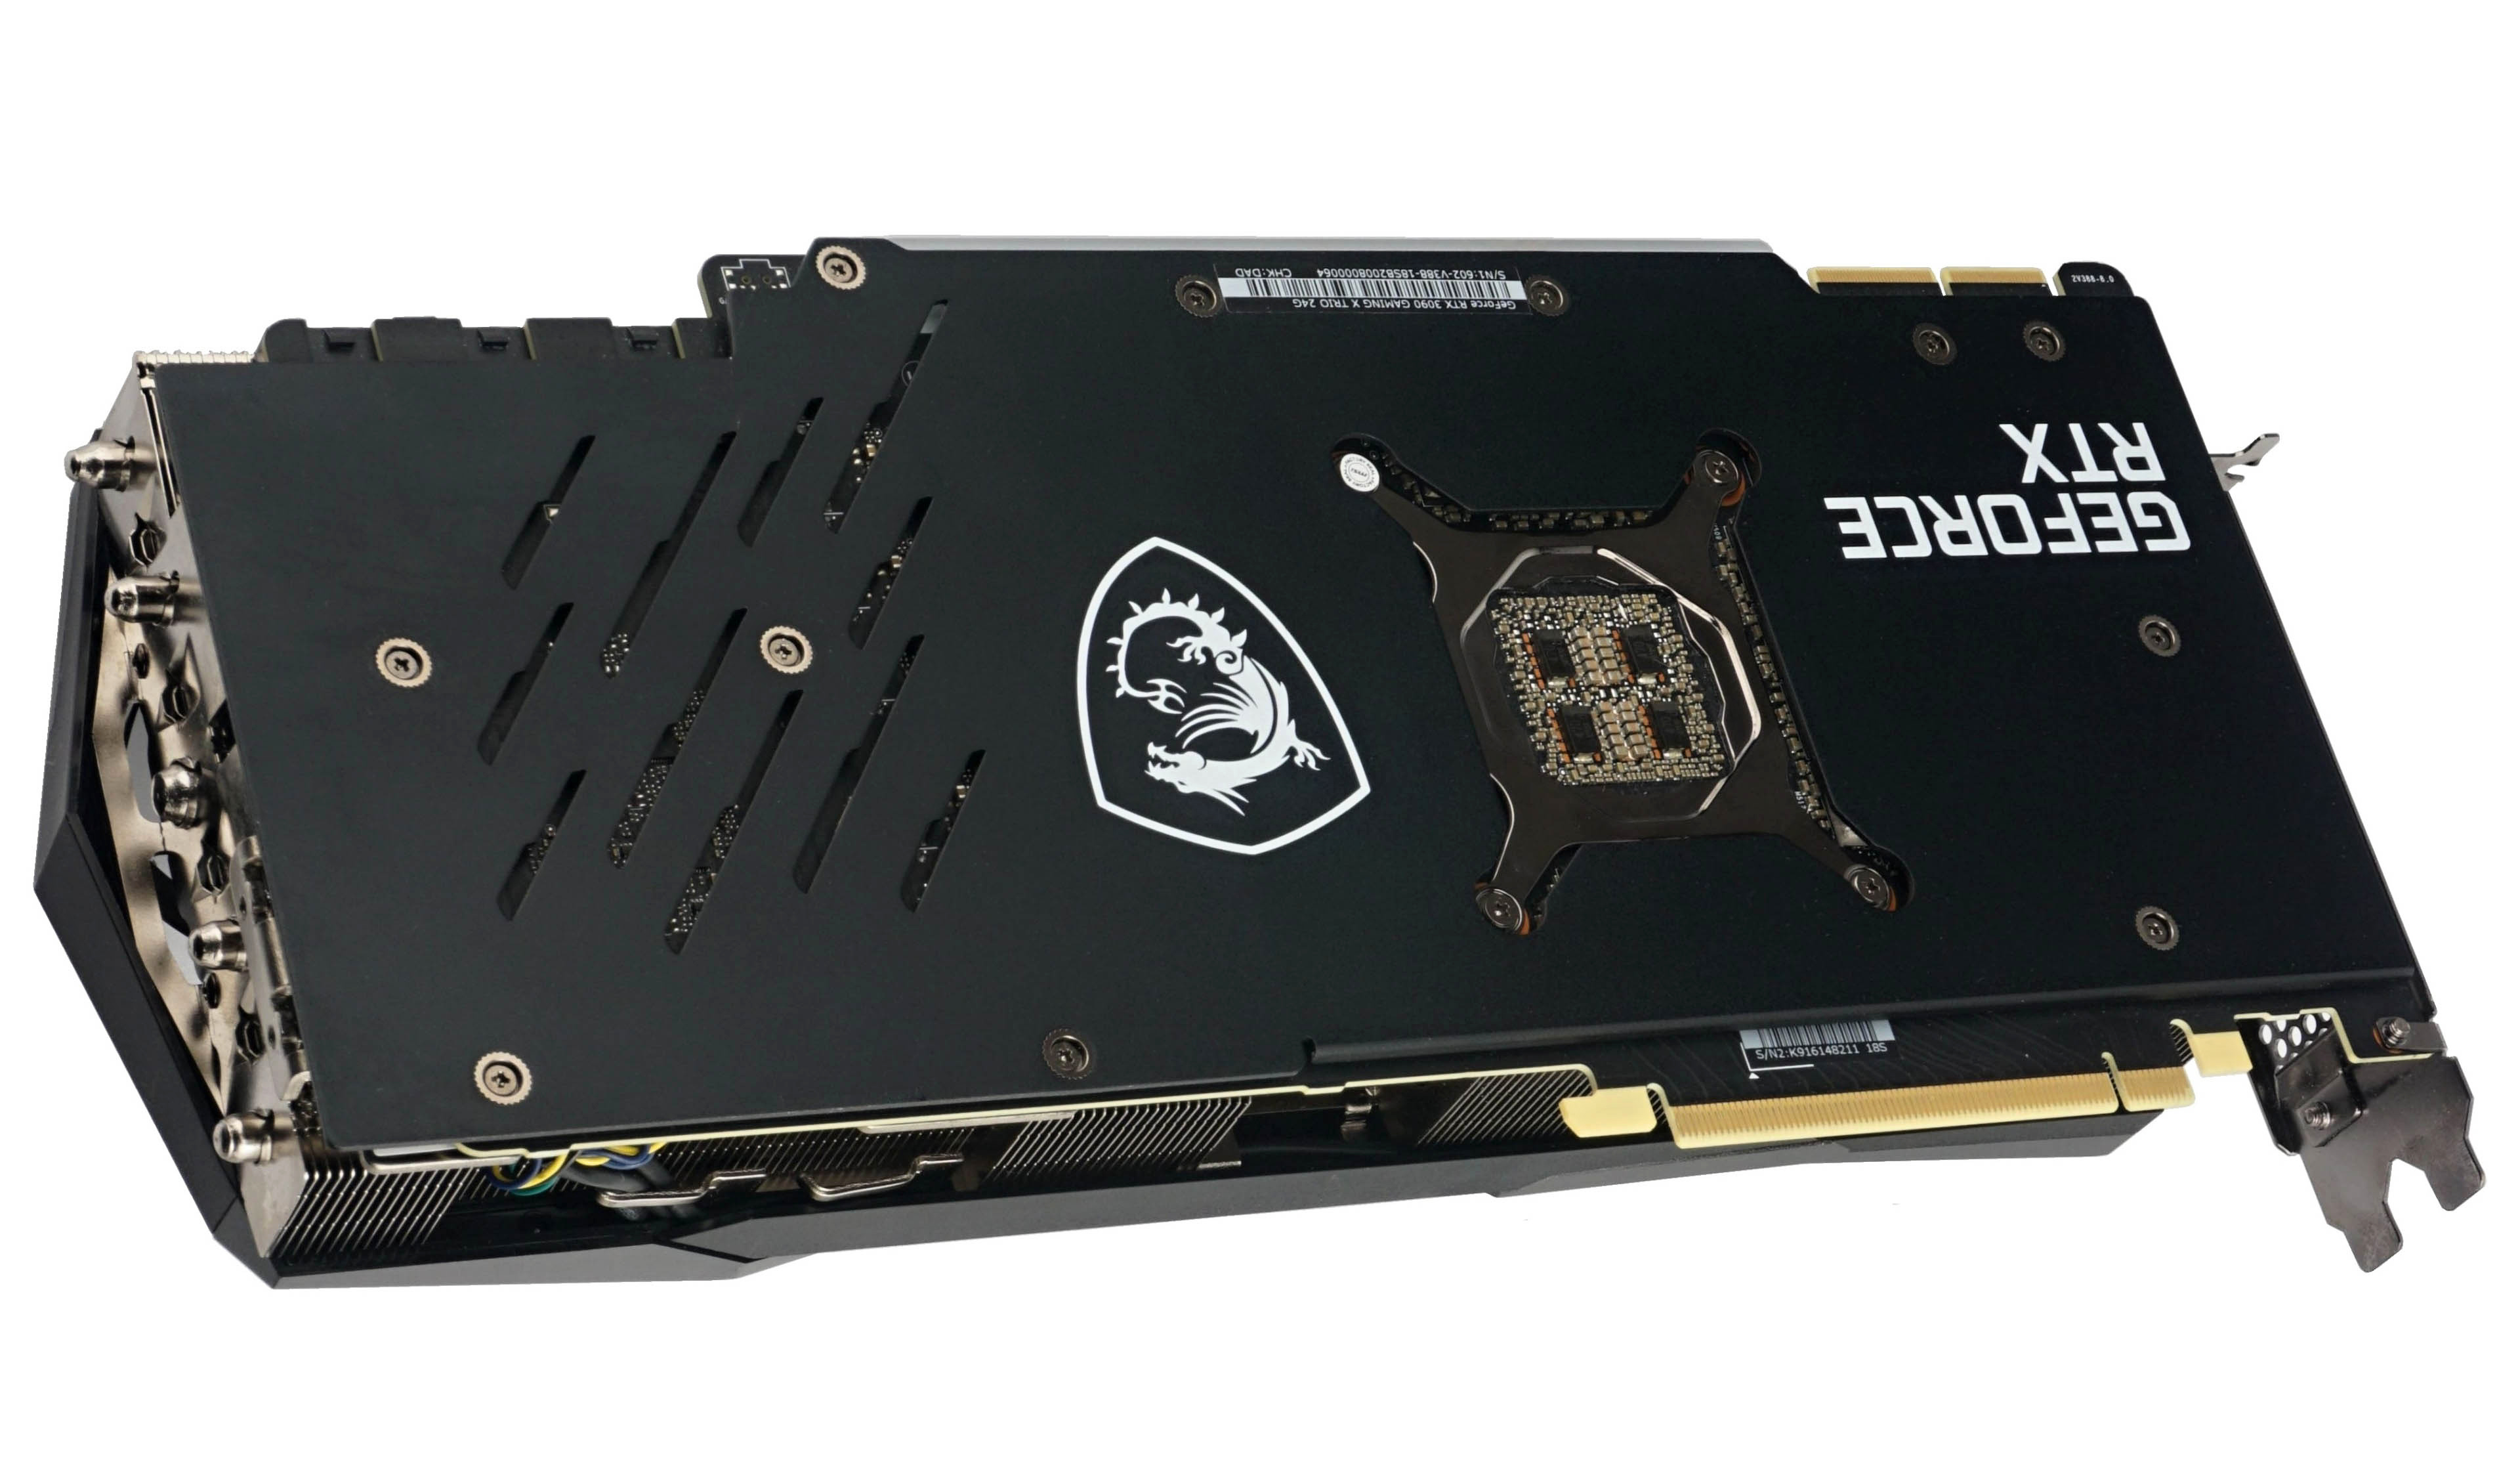
The back of the graphics card is covered by a massive backplate with a perforated back. However, it is implemented differently than it was on the recently tested RTX 3070 Gaming X. The PCB is significantly longer in this case and no longer allows the fan to blow the air along the whole structure. The perforated parts are thus here rather for more or less spontaneous heat escape from behind the space of the power phase design.
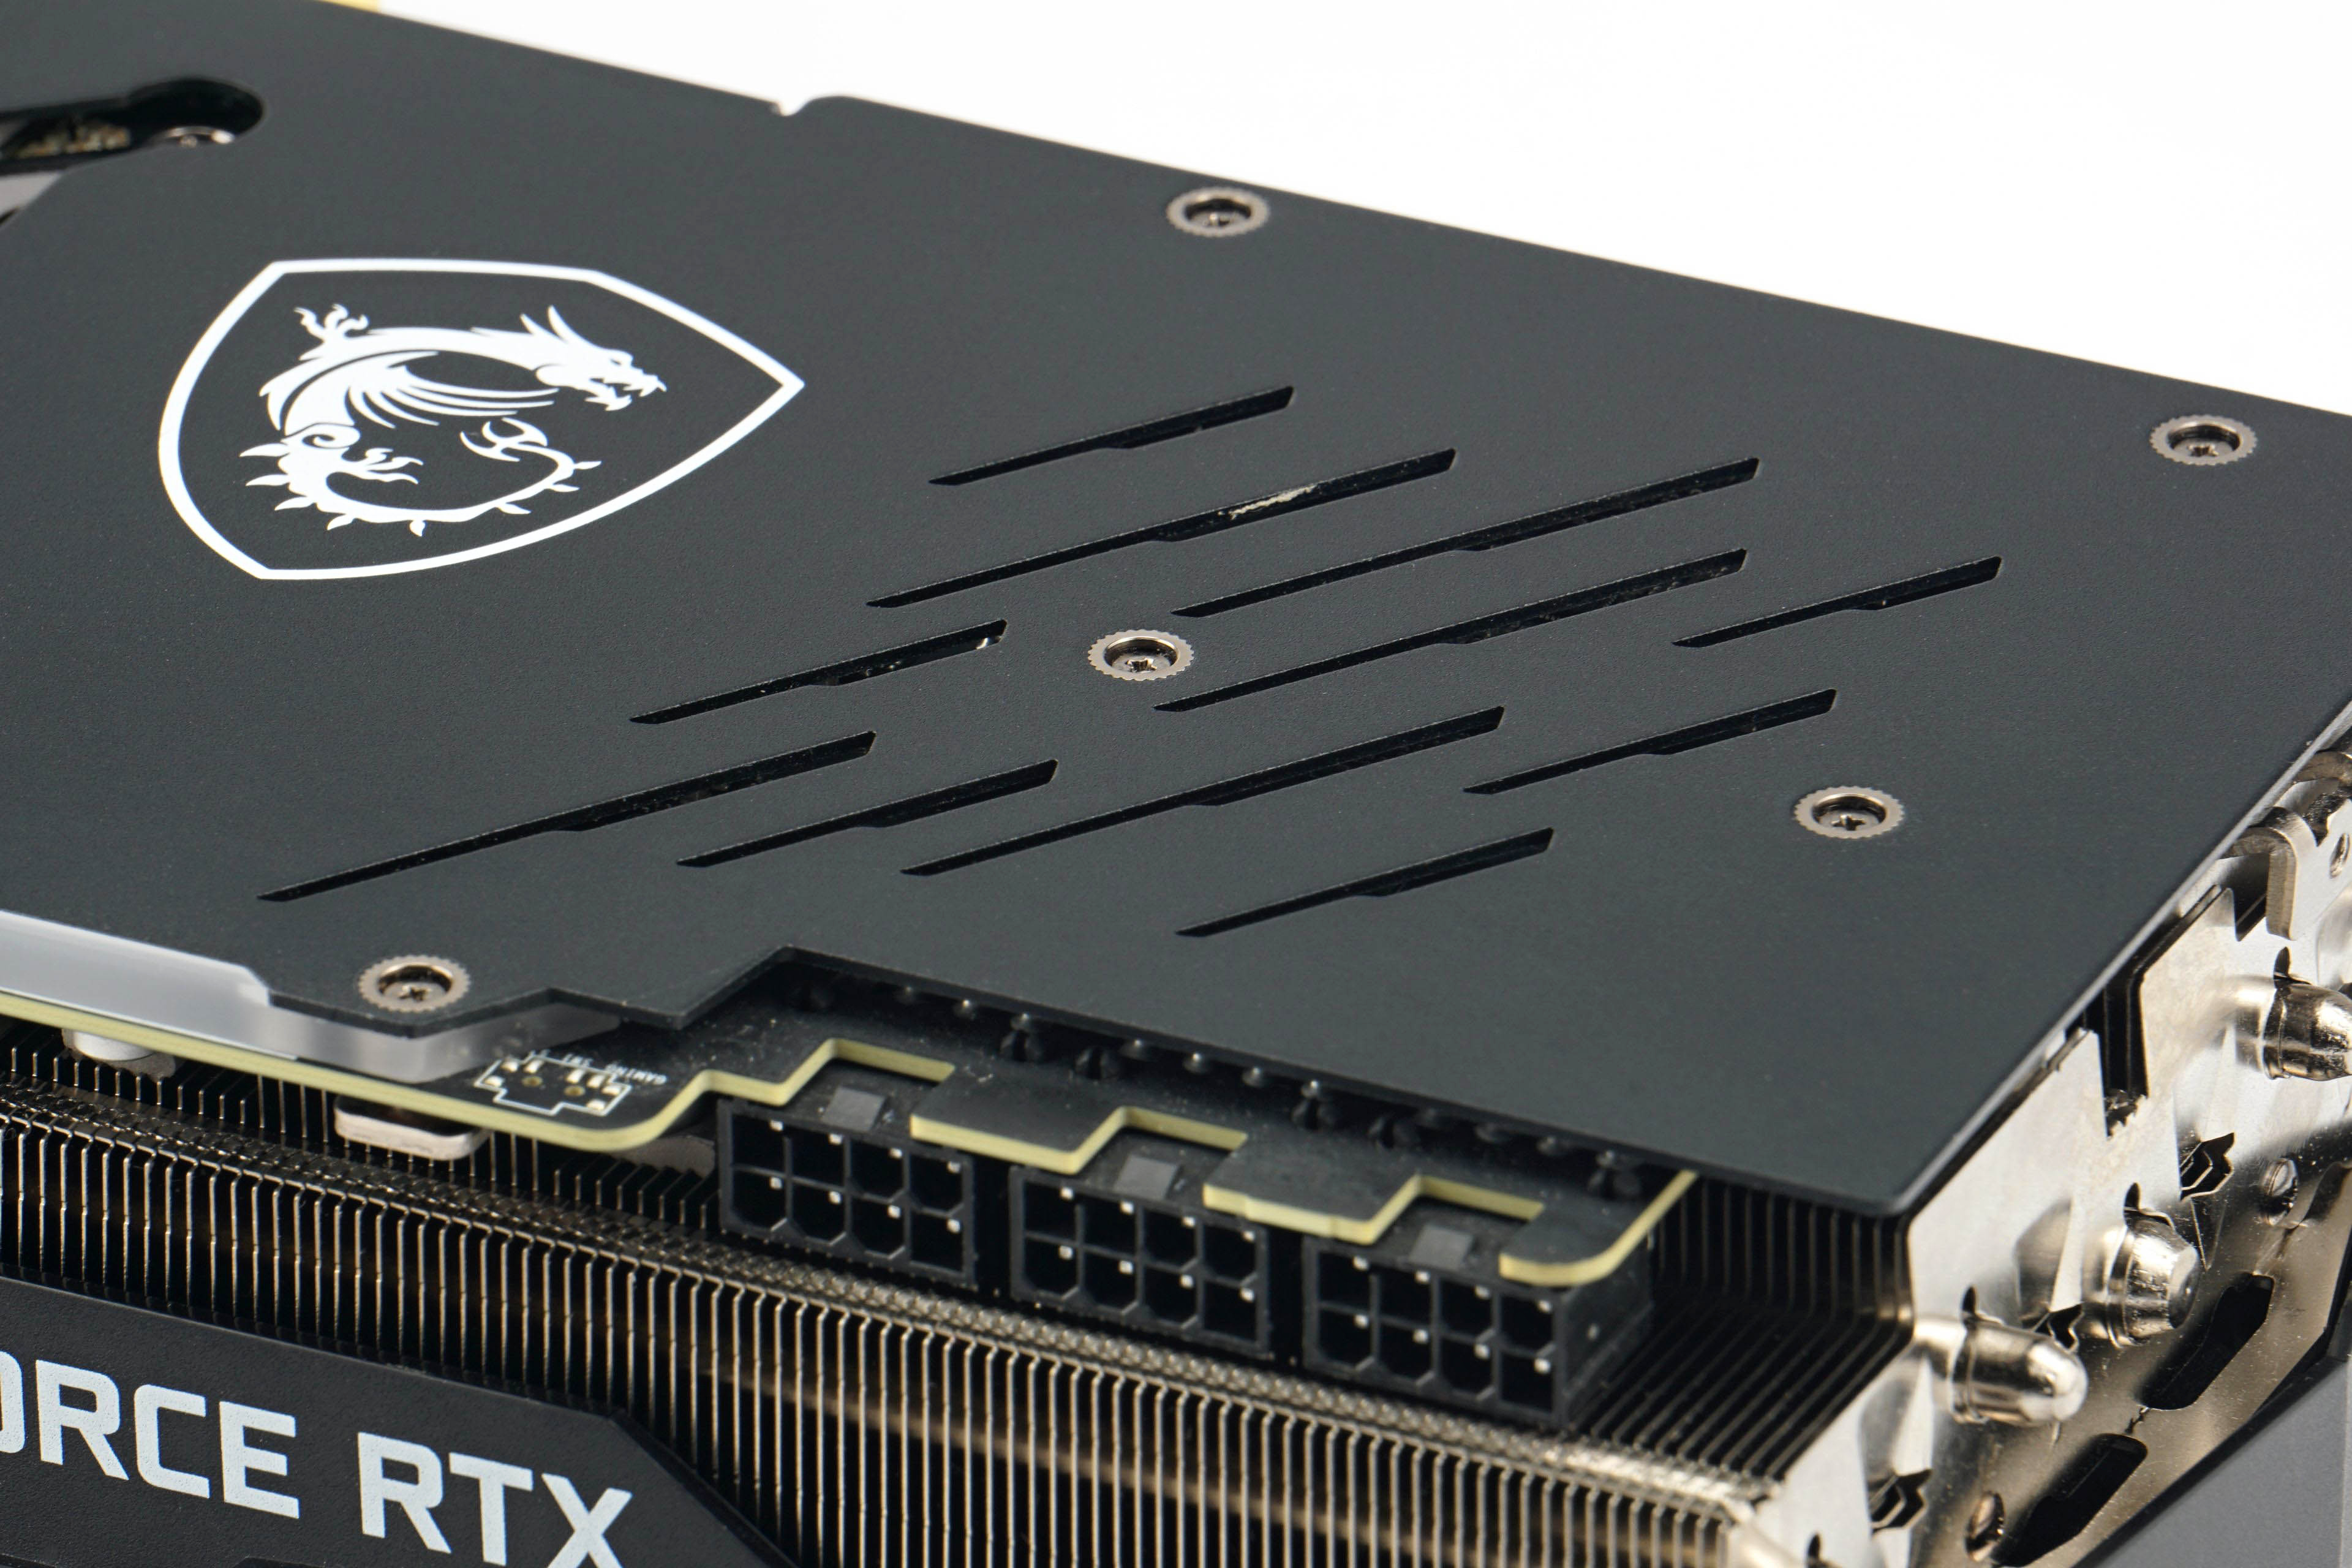
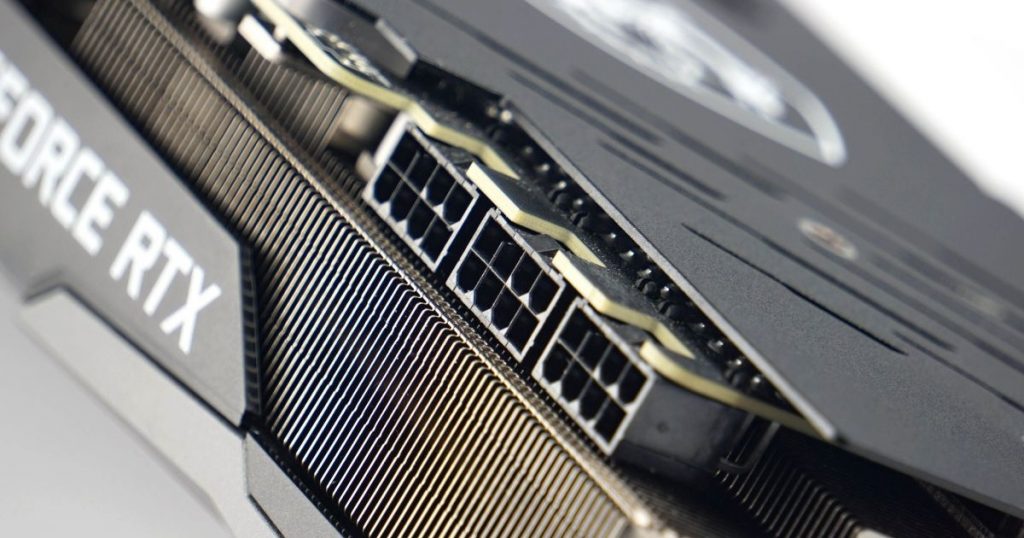
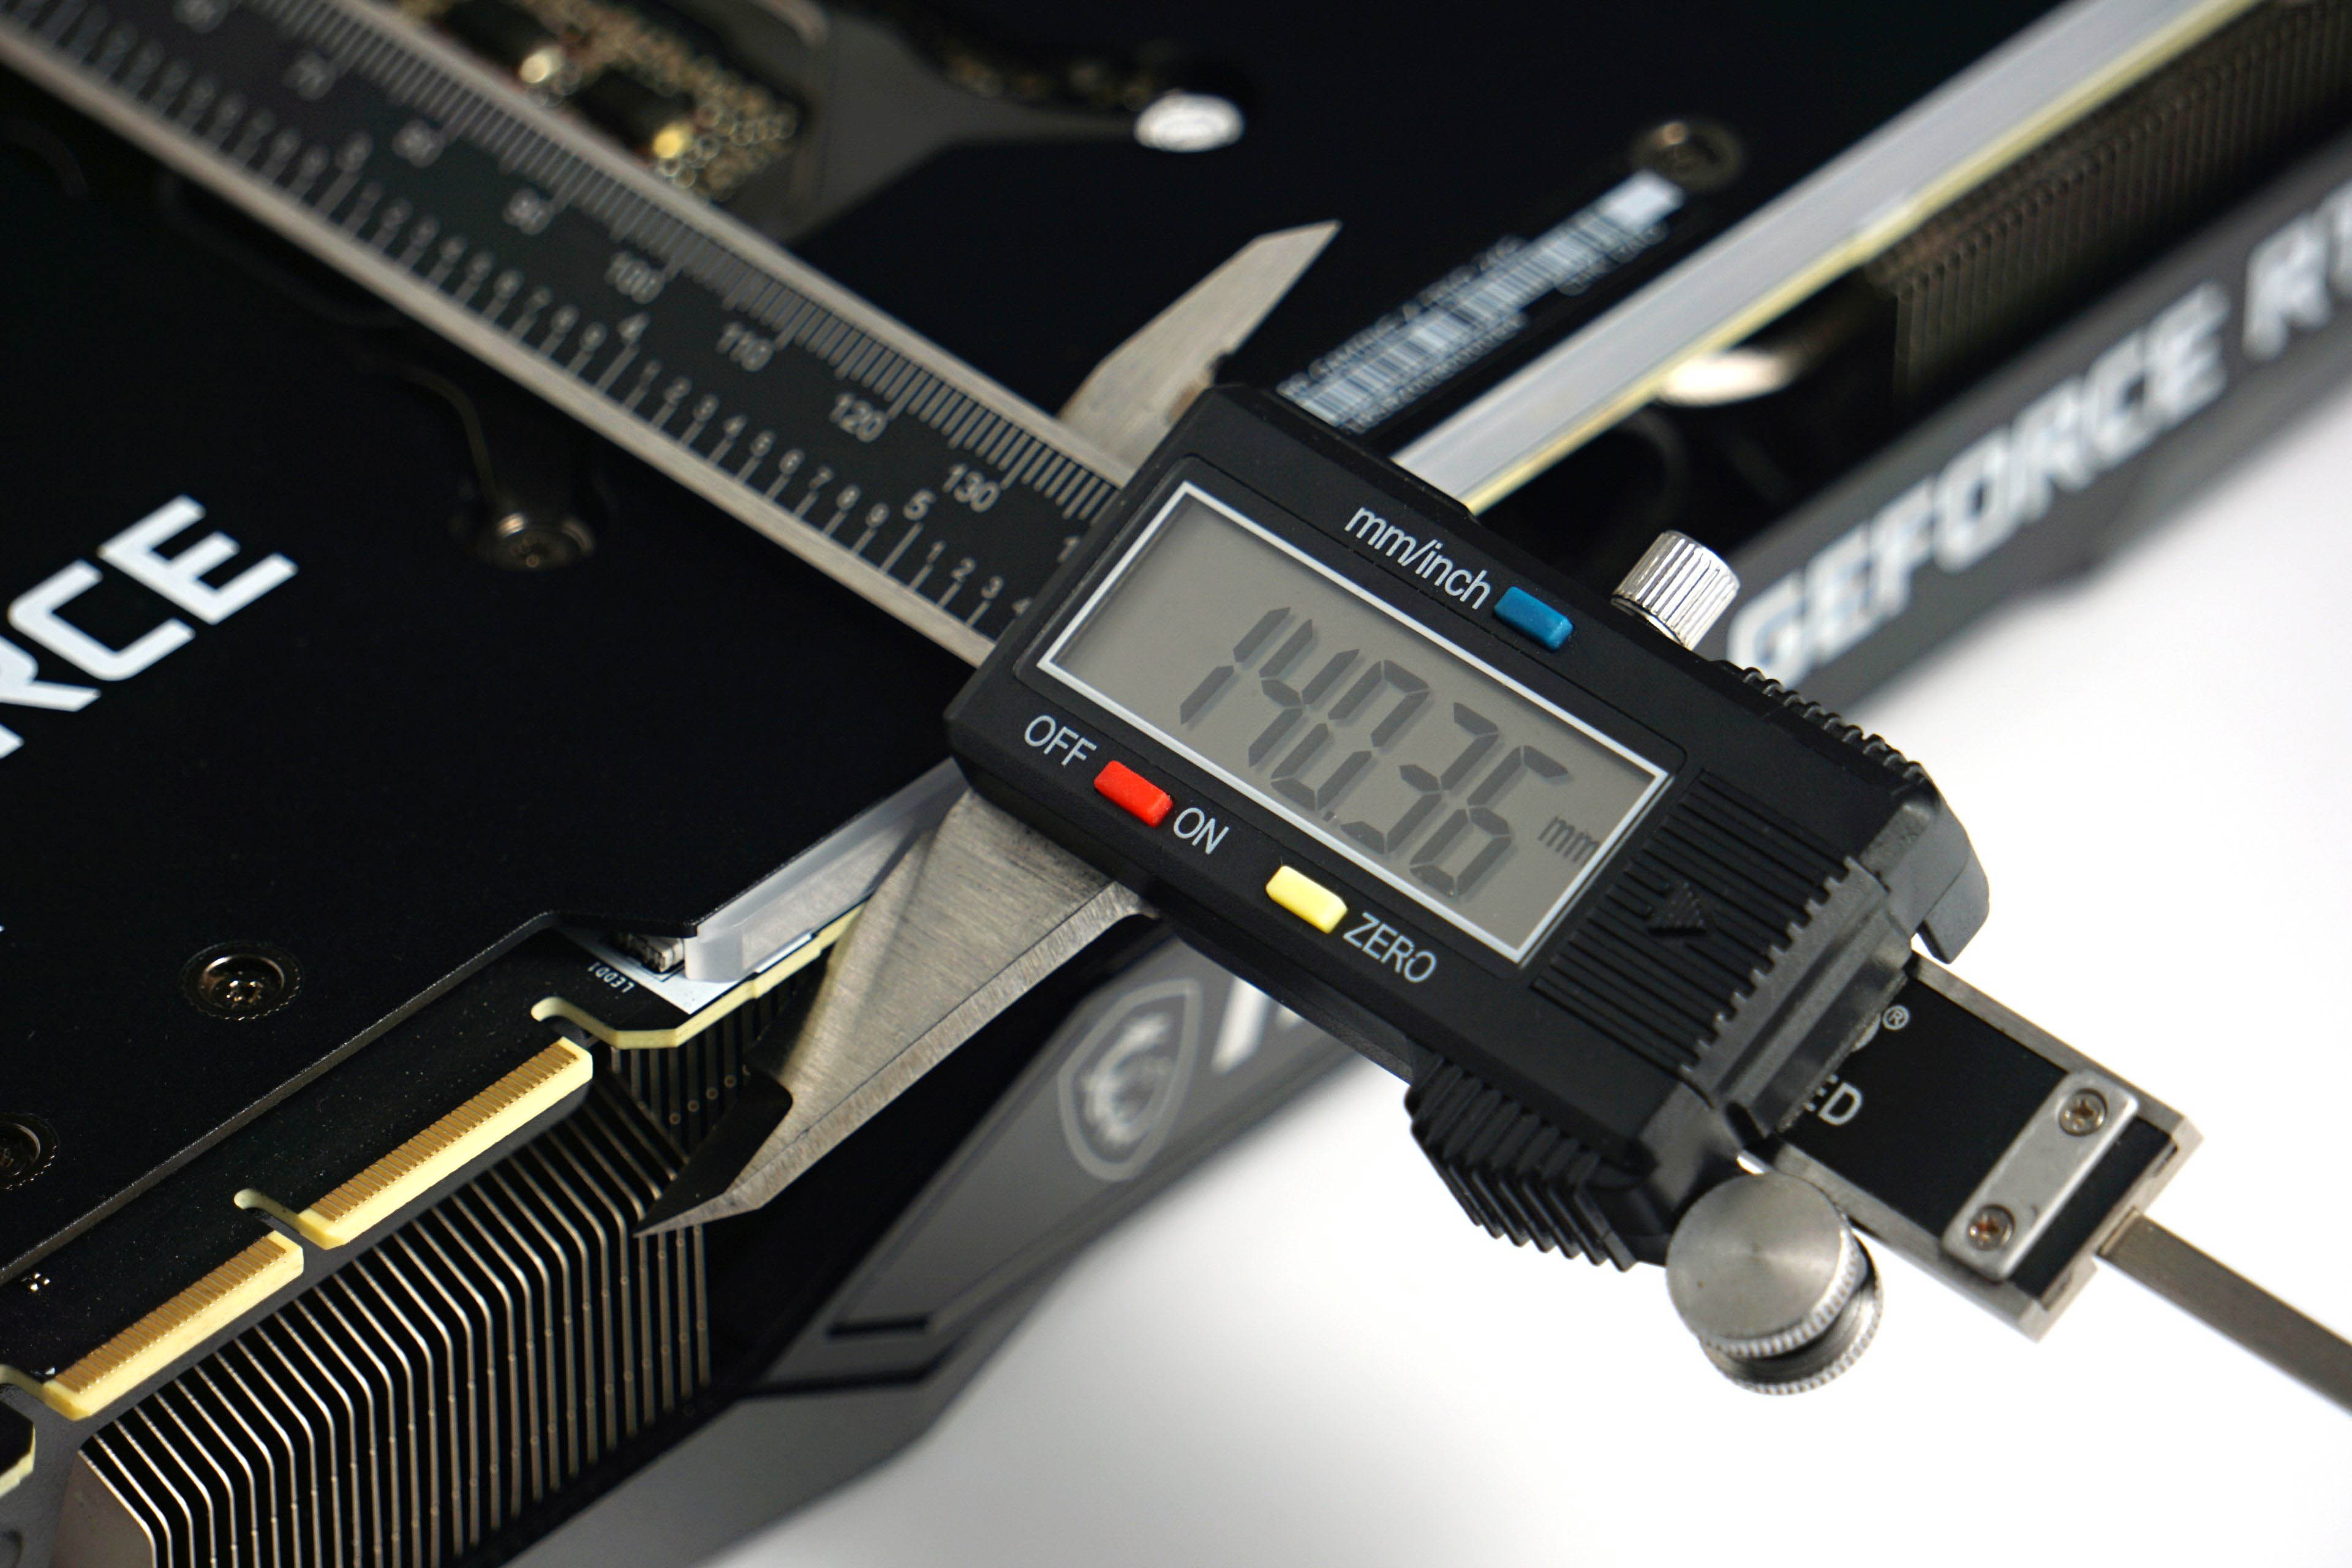
The RTX 3090 Gaming X has three 6+2-pin connectors for external power supply, which are located on the side of the card and are also slightly embedded in the body. And that’s good, because this graphics card with 140 mm is extra wide. The construction of the connectors and the bending of the cables adds roughly one and half centimeters, which must be taken into account before choosing a smaller case. In many dual-chamber cases, which have the interior divided by a vertical partition, you will not succeed with the RTX 3090 Gaming X.
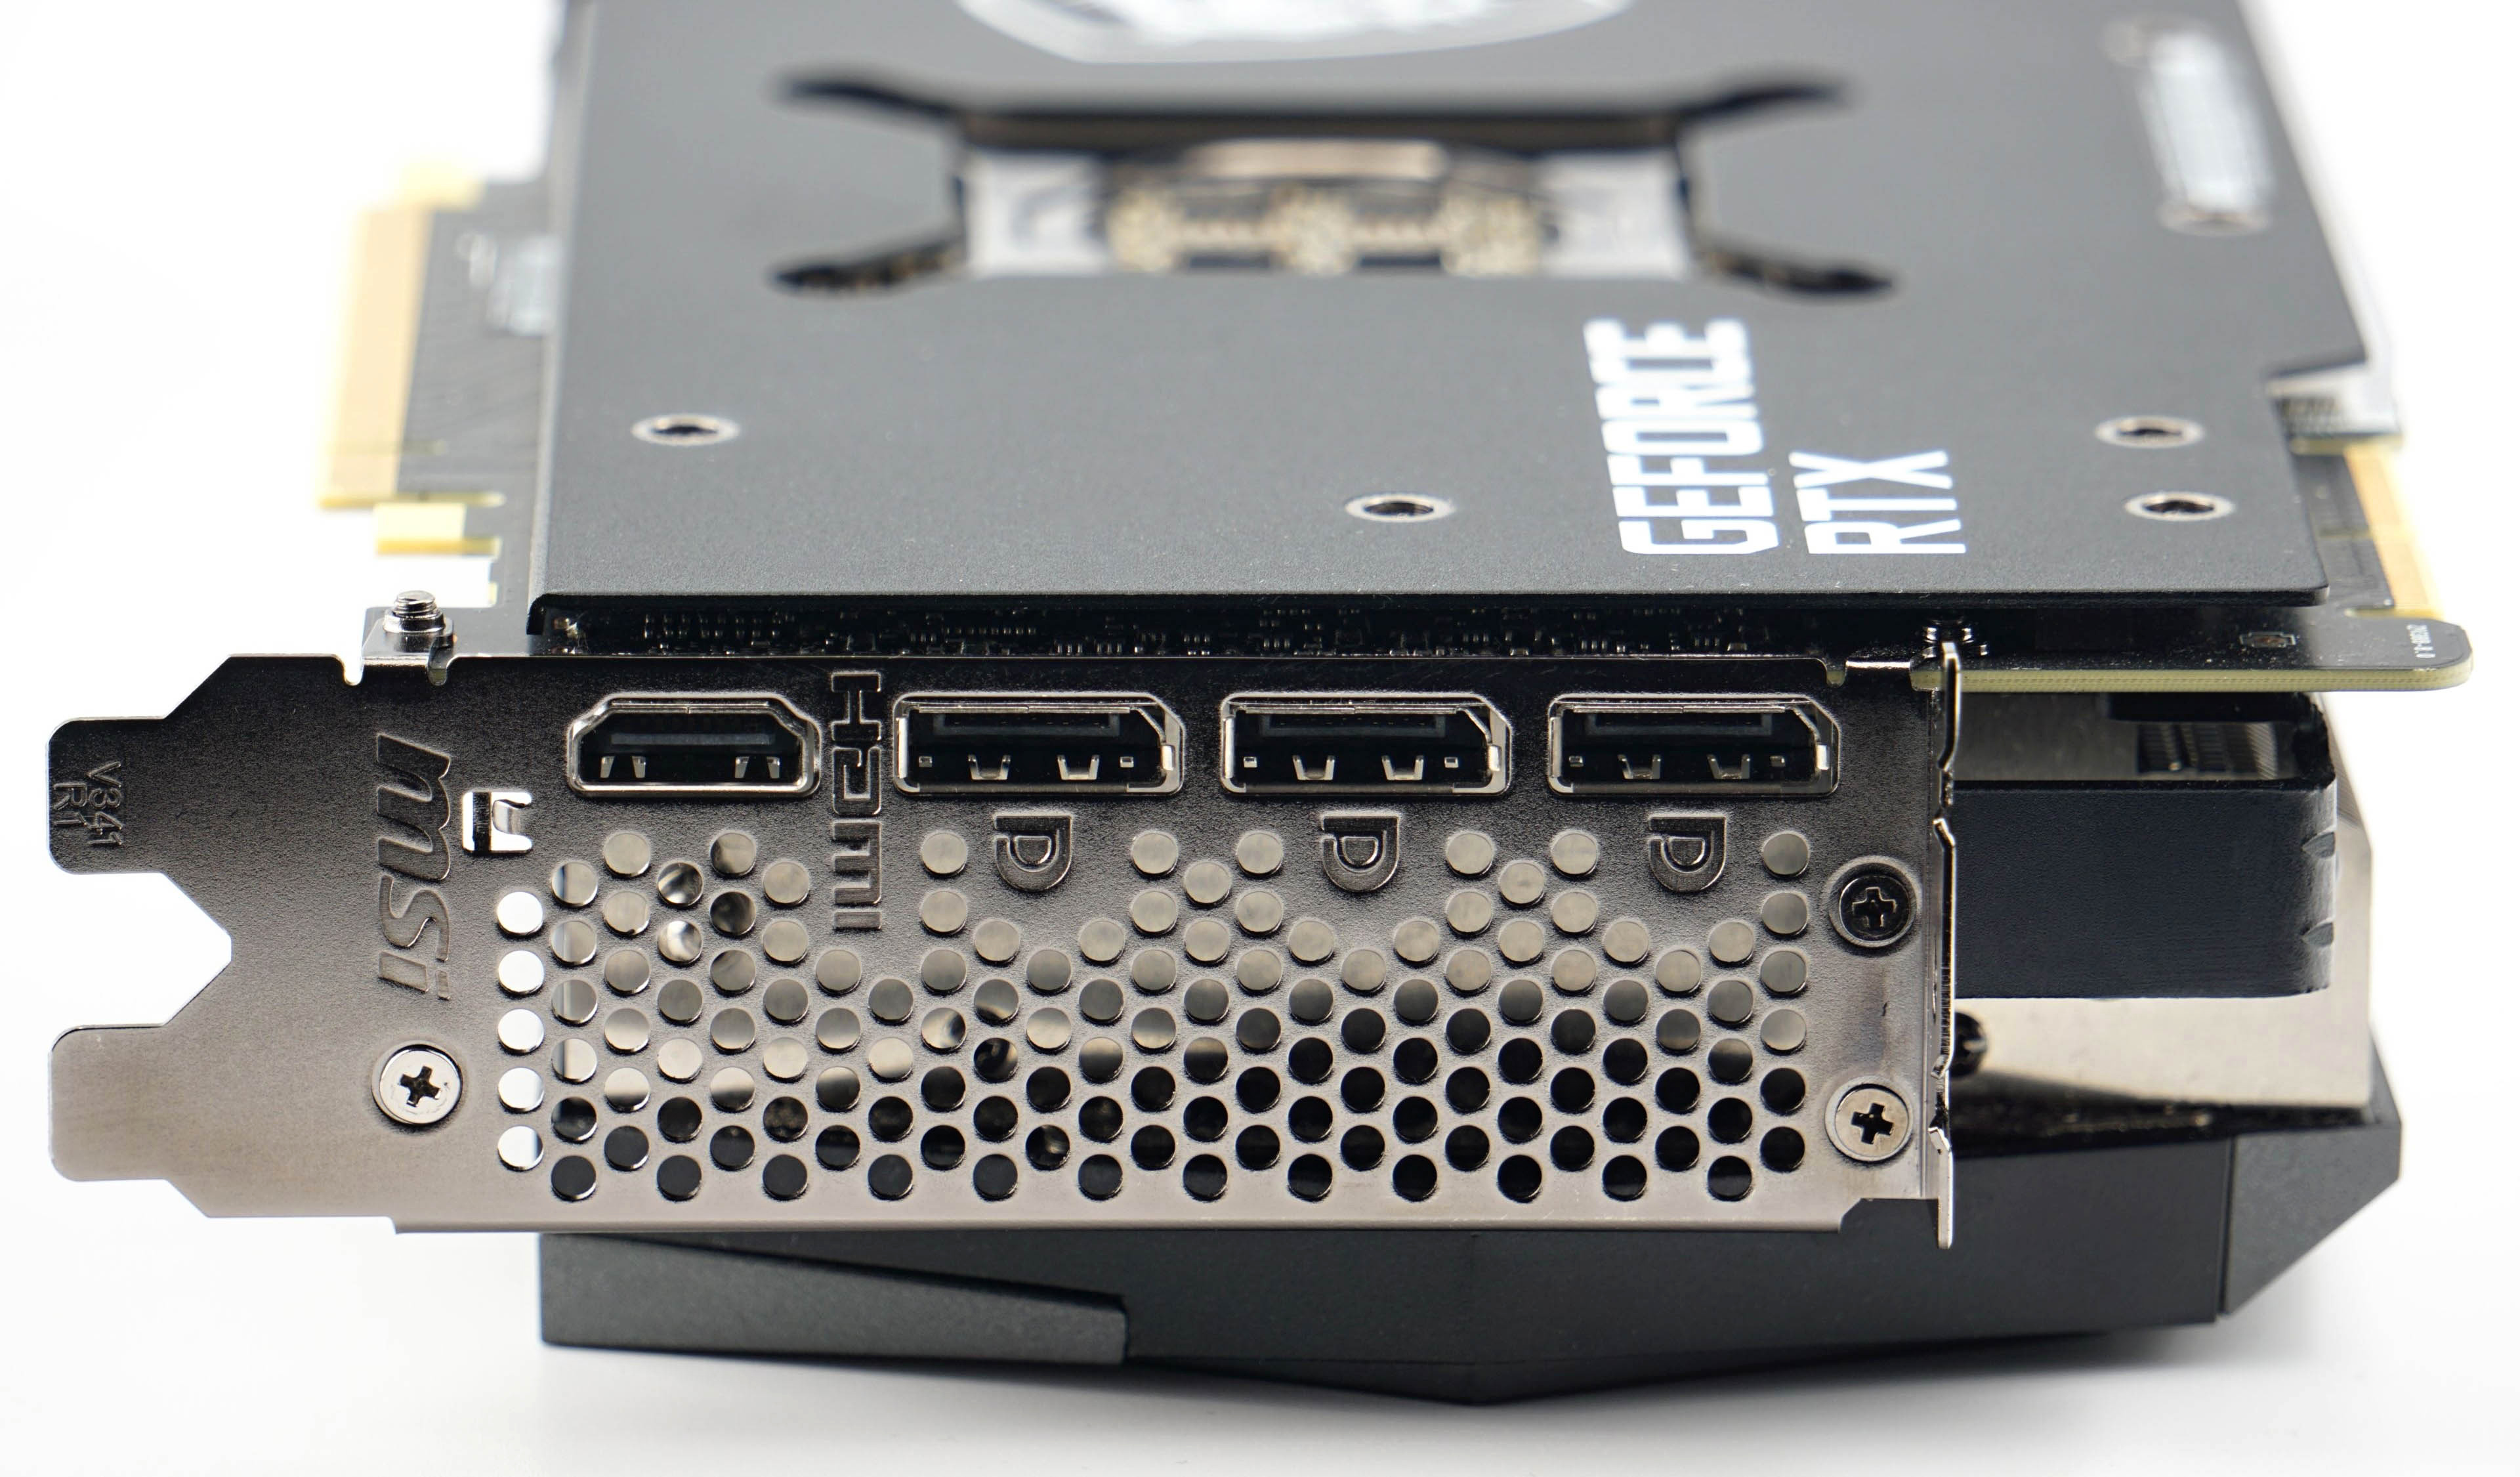
The output selection is represented by three DisplayPorts (1.4a) and one HDMI (1.4a). All four connectors can be used simultaneously, and as we’re near the blanking plate, it should be noted that it is perforated, which can be beneficial for cooling as it’s a 370-watt card.
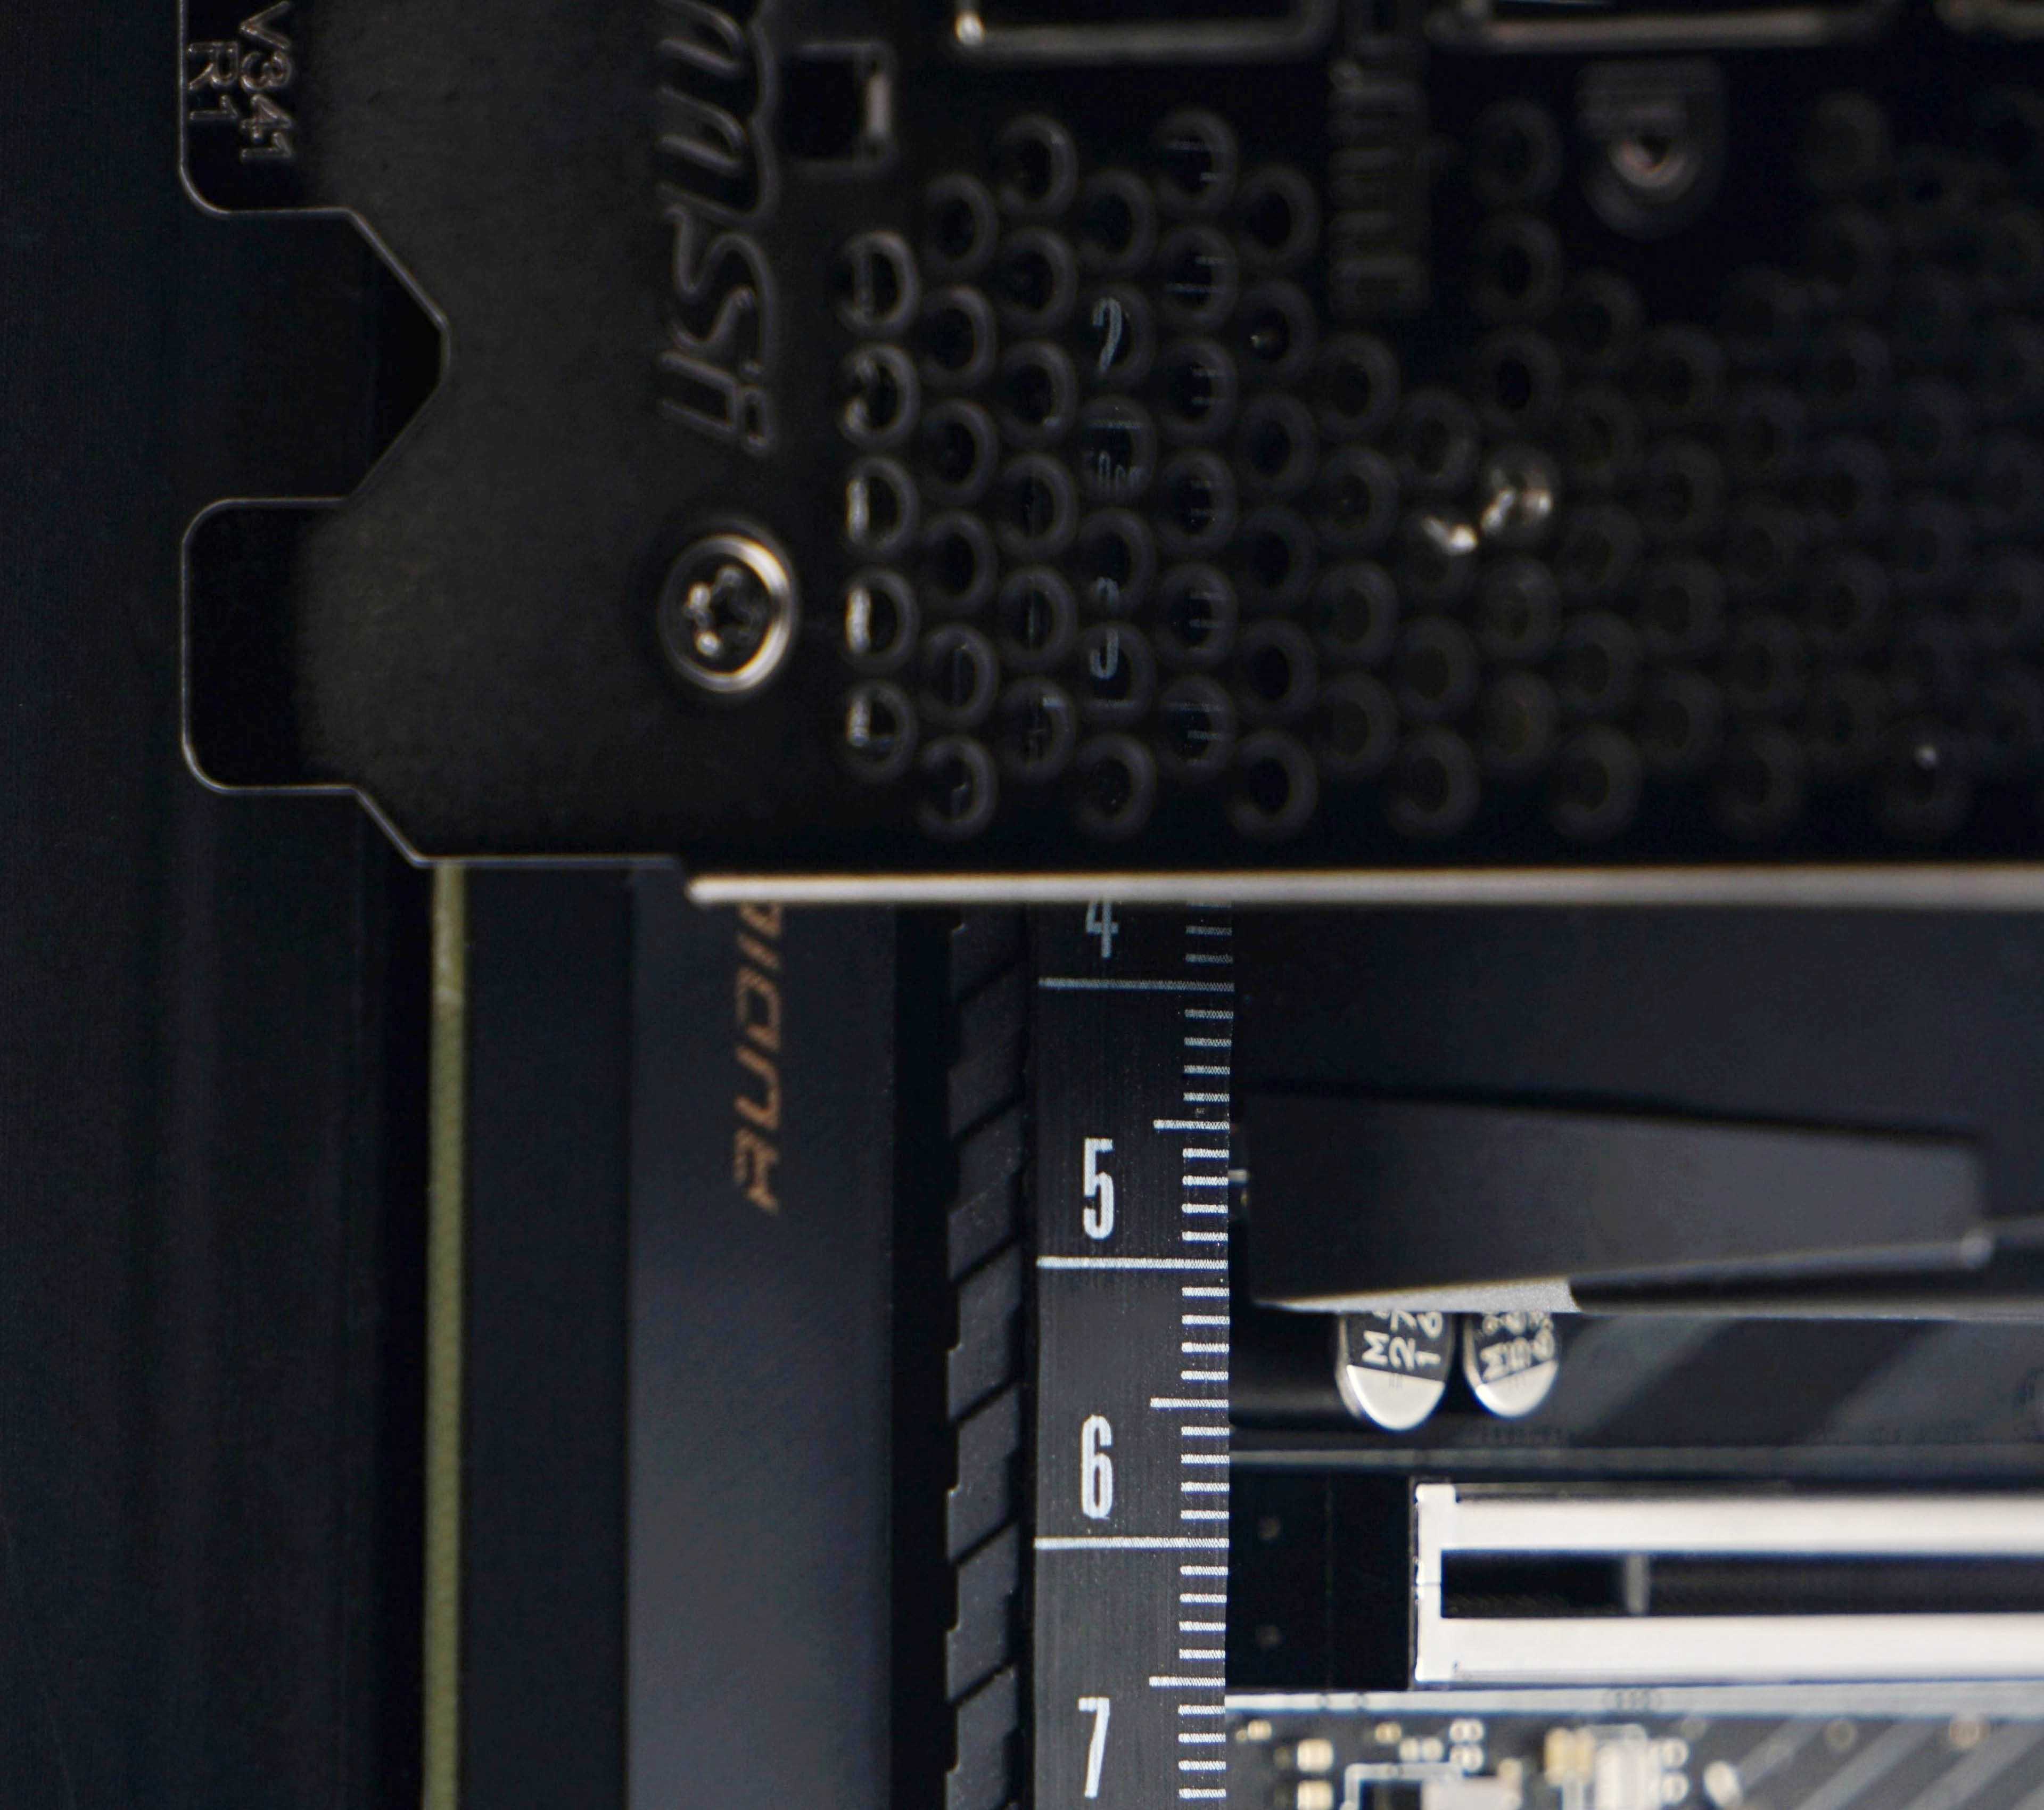
Although the card is large, it should be noted that among the RTX 3090 series it has “only” an average height. This means that although it successfully blocks the third slot, it no longer interferes with the fourth, which is not limited it in any way. In other words, there are also higher RTX 3090 cards, where it can be a bigger struggle when installing expansion cards.
The weight on the MSI RTX 3090 Gaming X stopped at 1,579 g (3.48 lb), which already includes the PCI Express holder. It is supplied as an accessory, either for aesthetic tuning (without it you will not achieve flawless horizontal plane) or because you want the load on the slot to be as low as possible. Aj keď tým spevnené, ktoré má každá čo i len trochu lepšia doska, ani takáto ťažia karta neublíži.

No compromises in performance! If this is your motto, then you cannot miss the test of the graphics card GeForce RTX 3090. It will also feed 4K resolution, has the fastest ray tracing and OptiX acceleration, huge video memory and, the review sample from MSI also has many more attractive features. The biggest drawback, as is usual with high-end hardware, is the price. It is really high.
| Parameters | MSI RTX 3090 Gaming X Trio | |
| Architecture | Architecture | Ampere |
| Die | Die | GA102 |
| Manufacturing node | Manufacturing node | 8 nm Samsung |
| Die size | Die size | 628,4 mm² |
| Transistor count | Transistor count | 28,3 mld. |
| Compute units | Compute units | 82 SM |
| Shaders/CUDA cores | Shaders/CUDA cores | 10496 |
| Base Clock | Base Clock | 1395 MHz |
| Game Clock (AMD) | Game Clock (AMD) | – |
| Boost Clock | Boost Clock | 1785 MHz |
| RT units | RT units | 82 |
| AI/tensor cores | AI/tensor cores | 328 |
| ROPs | ROPs | 112 |
| TMUs | TMUs | 328 |
| L2 Cache | L2 Cache | 6 MB |
| Infinity Cache | Infinity Cache | – |
| Interface | Interface | PCIe 4.0 ×16 |
| Multi-GPU interconnect | Multi-GPU interconnect | – |
| Memory | Memory | 24 GB GDDR6X |
| Memory clock (effective) | Memory clock (effective) | 19,5 GHz |
| Memory bus | Memory bus | 384 bitov |
| Memory bandwidth | Memory bandwidth | 936,2 GB/s |
| Pixel fillrate | Pixel fillrate | 189,8 Gpx/s |
| Texture fillrate | Texture fillrate | 556,0 Gtx/s |
| FLOPS (FP32) | FLOPS (FP32) | 35,58 TFLOPS |
| FLOPS (FP64) | FLOPS (FP64) | 556,0 GFLOPS |
| FLOPS (FP16) | FLOPS (FP16) | 35,58 TFLOPS |
| AI/tensor TOPS (INT8) | AI/tensor TOPS (INT8) | 284,64 TOPS |
| AI/tensor FLOPS (FP16) | AI/tensor FLOPS (FP16) | 142,32 TFLOPS |
| TDP | TDP | 370 W |
| Power connectors | Power connectors | 3× 8pin |
| Card lenght | Card lenght | 323 mm |
| Card slots used | Card slots used | 56 mm |
| Shader Model | Shader Model | 6.5 |
| DirectX/Feature Level | DirectX/Feature Level | DX 12 Ultimate (12_2) |
| OpenGL | OpenGL | 4.6 |
| Vulkan | Vulkan | 1.2 |
| OpenCL | OpenCL | 2.0 |
| CUDA | CUDA | 8.6 |
| Video encoder engine | Video encoder engine | NVEnc 7 |
| Encoding formats | Encoding formats | HEVC, H.264 |
| Encoding resolution | Encoding resolution | 8K |
| Video decoder engine | Video decoder engine | NVDec 5 |
| Decoding formats | Decoding formats | HEVC,H.264,VP9, AV1 |
| Decoding resolution | Decoding resolution | 8K |
| Max. Monitor resolution | Max. Monitor resolution | 7680 × 4320 px |
| HDMI | HDMI | 1.4a (3×) |
| DisplayPort | DisplayPort | 2.1 (1×) |
| USB-C | – |
No compromises in performance! If this is your motto, then you cannot miss the test of the graphics card GeForce RTX 3090. It will also feed 4K resolution, has the fastest ray tracing and OptiX acceleration, huge video memory and, the review sample from MSI also has many more attractive features. The biggest drawback, as is usual with high-end hardware, is the price. It is really high.
Gaming tests
The largest sample of tests is from games. This is quite natural given that GeForce and Radeons, i.e. cards primarily intended for gaming use, will mostly be tested.
We chose the test games primarily to ensure the balance between the titles better optimized for the GPU of one manufacturer (AMD) or the other one (Nvidia). But we also took into account the popularity of the titles so that you could find your own results in the charts. Emphasis was also placed on genre diversity. Games such as RTS, FPS, TPS, car racing as well as a flight simulator, traditional RPG and sports games are represented by the most played football game. You can find a list of test games in the library of chapters (9–32), with each game having its own chapter, sometimes even two (chapters) for the best possible clarity, but this has its good reason, which we will share with you in the following text.
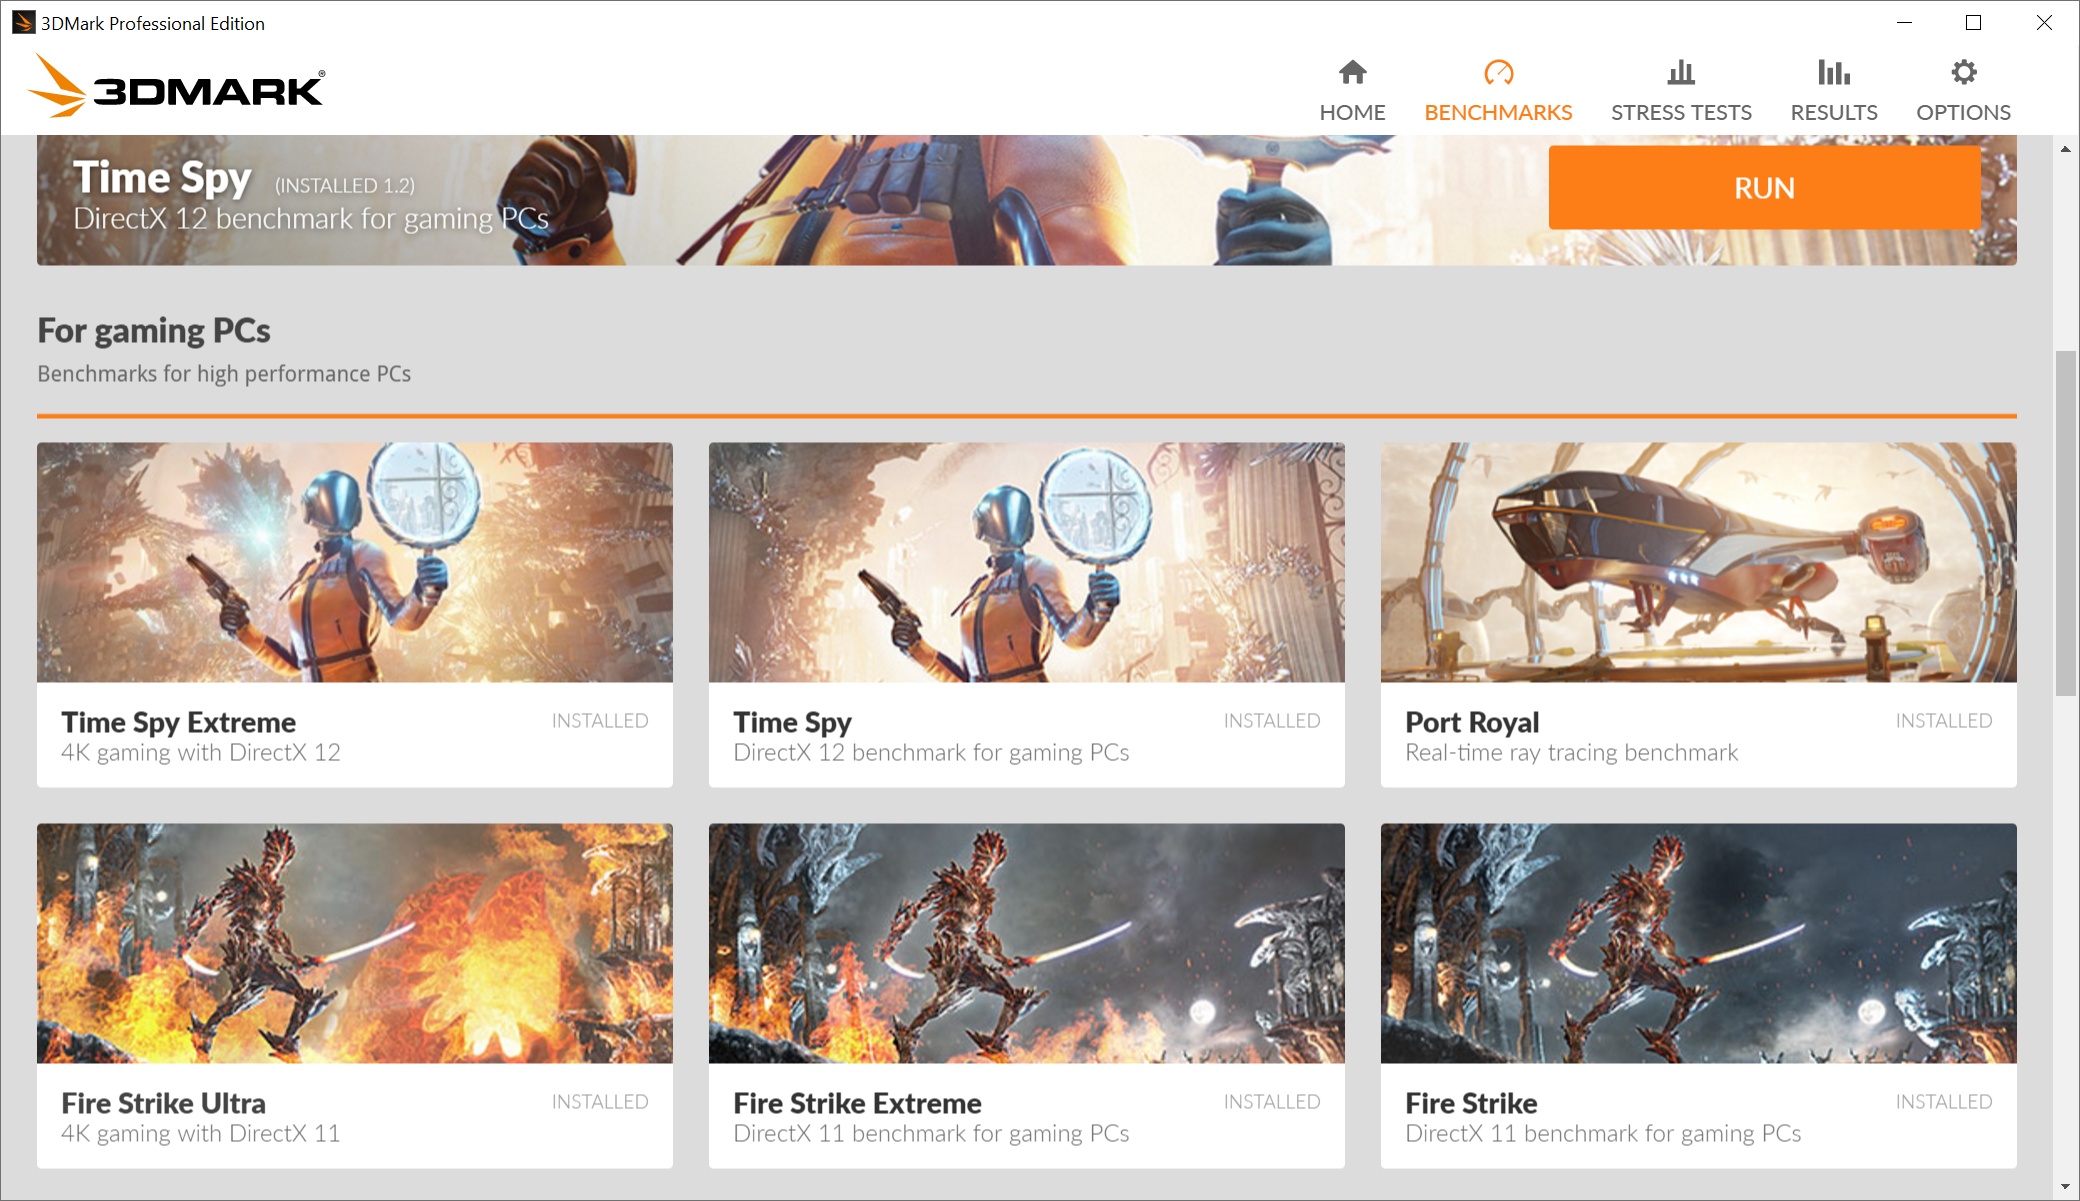
Before we start the gaming tests, each graphics card will pass the tests in 3D Mark to warm up to operating temperature. That’s good synthetics to start with.
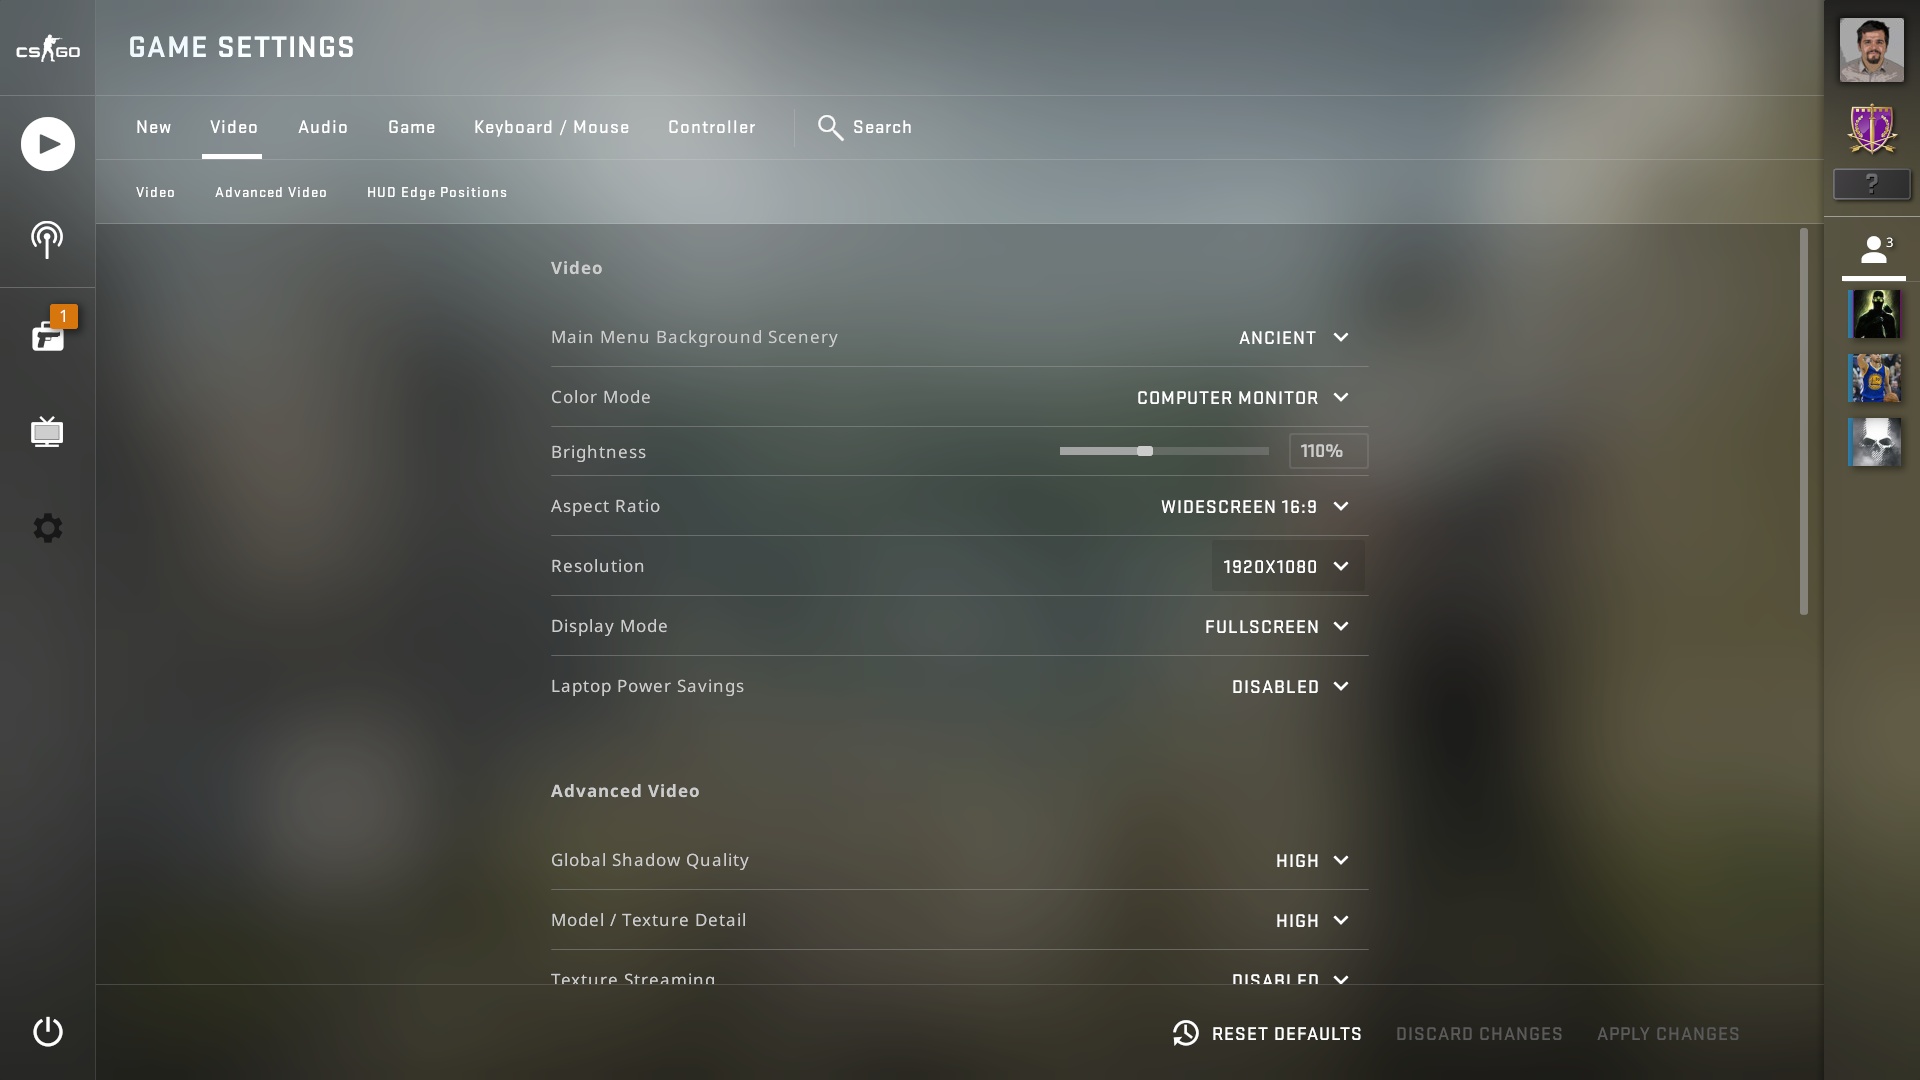
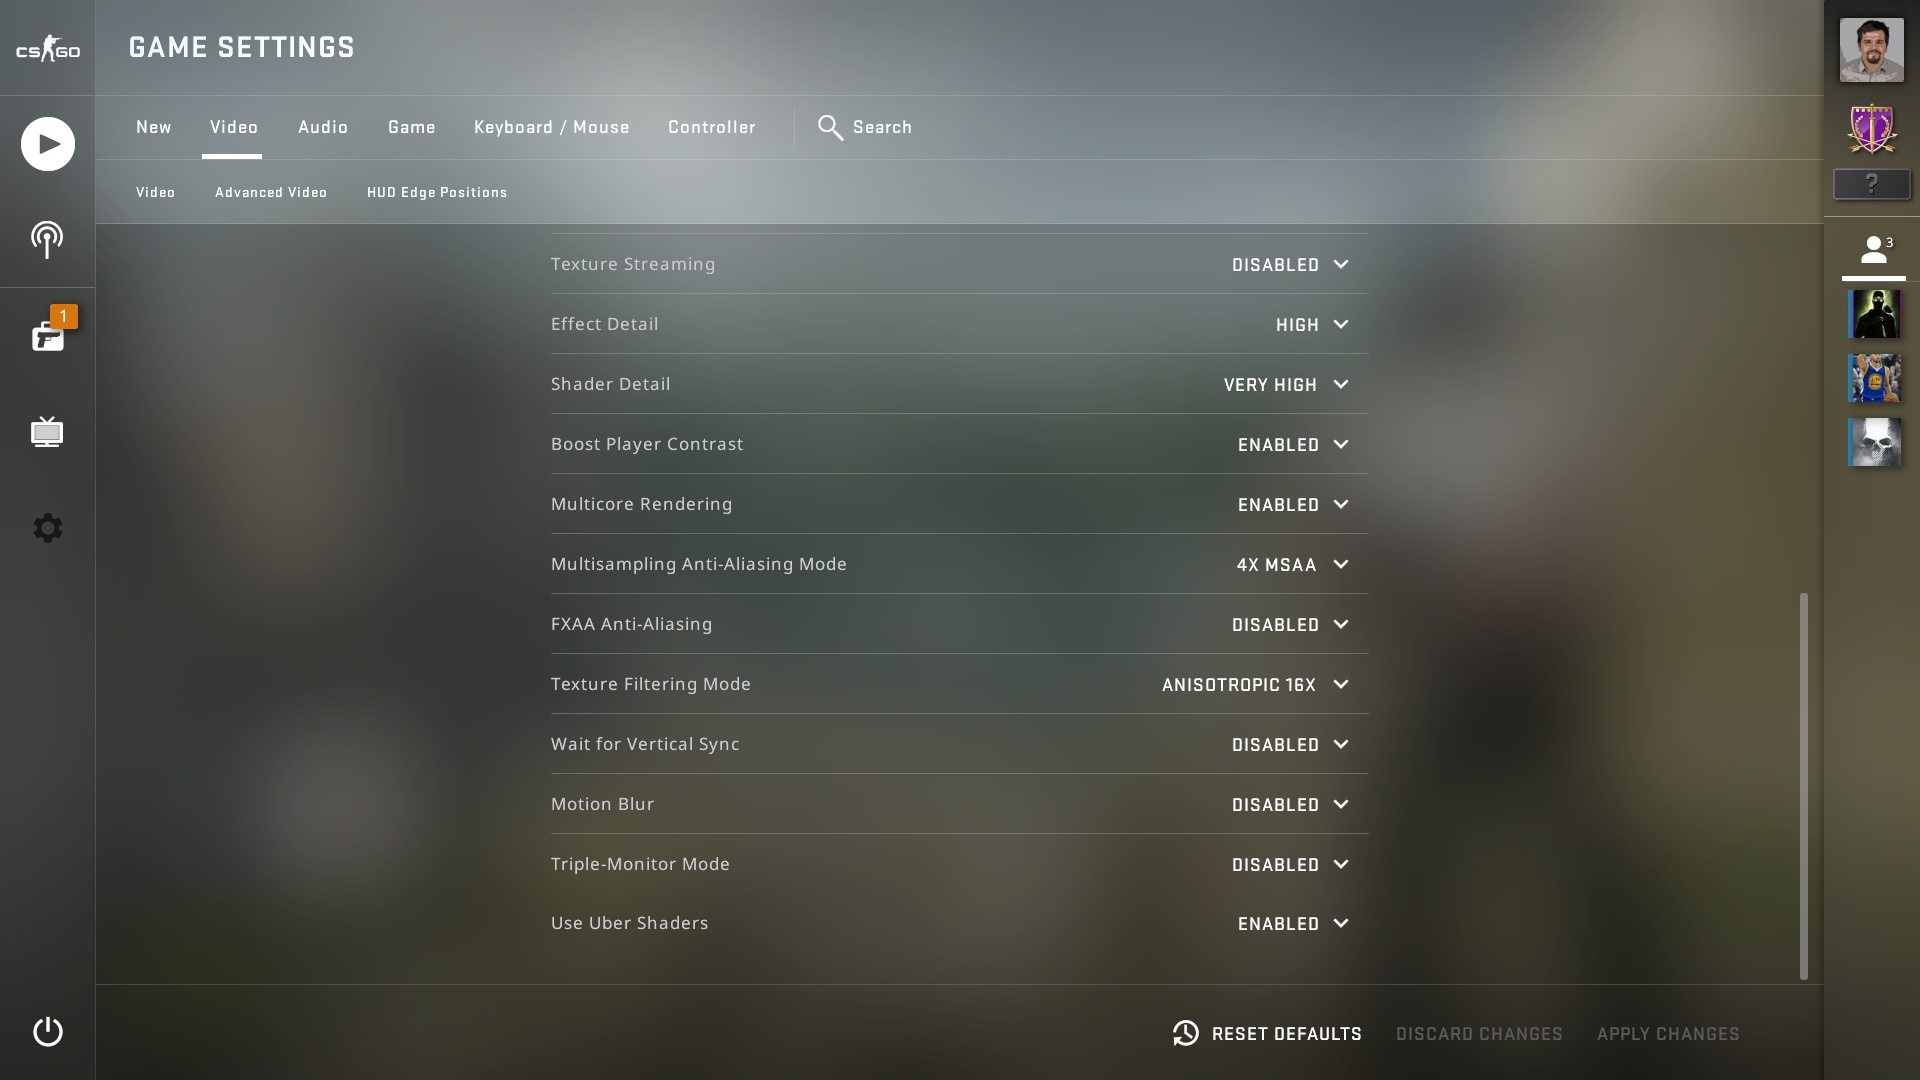
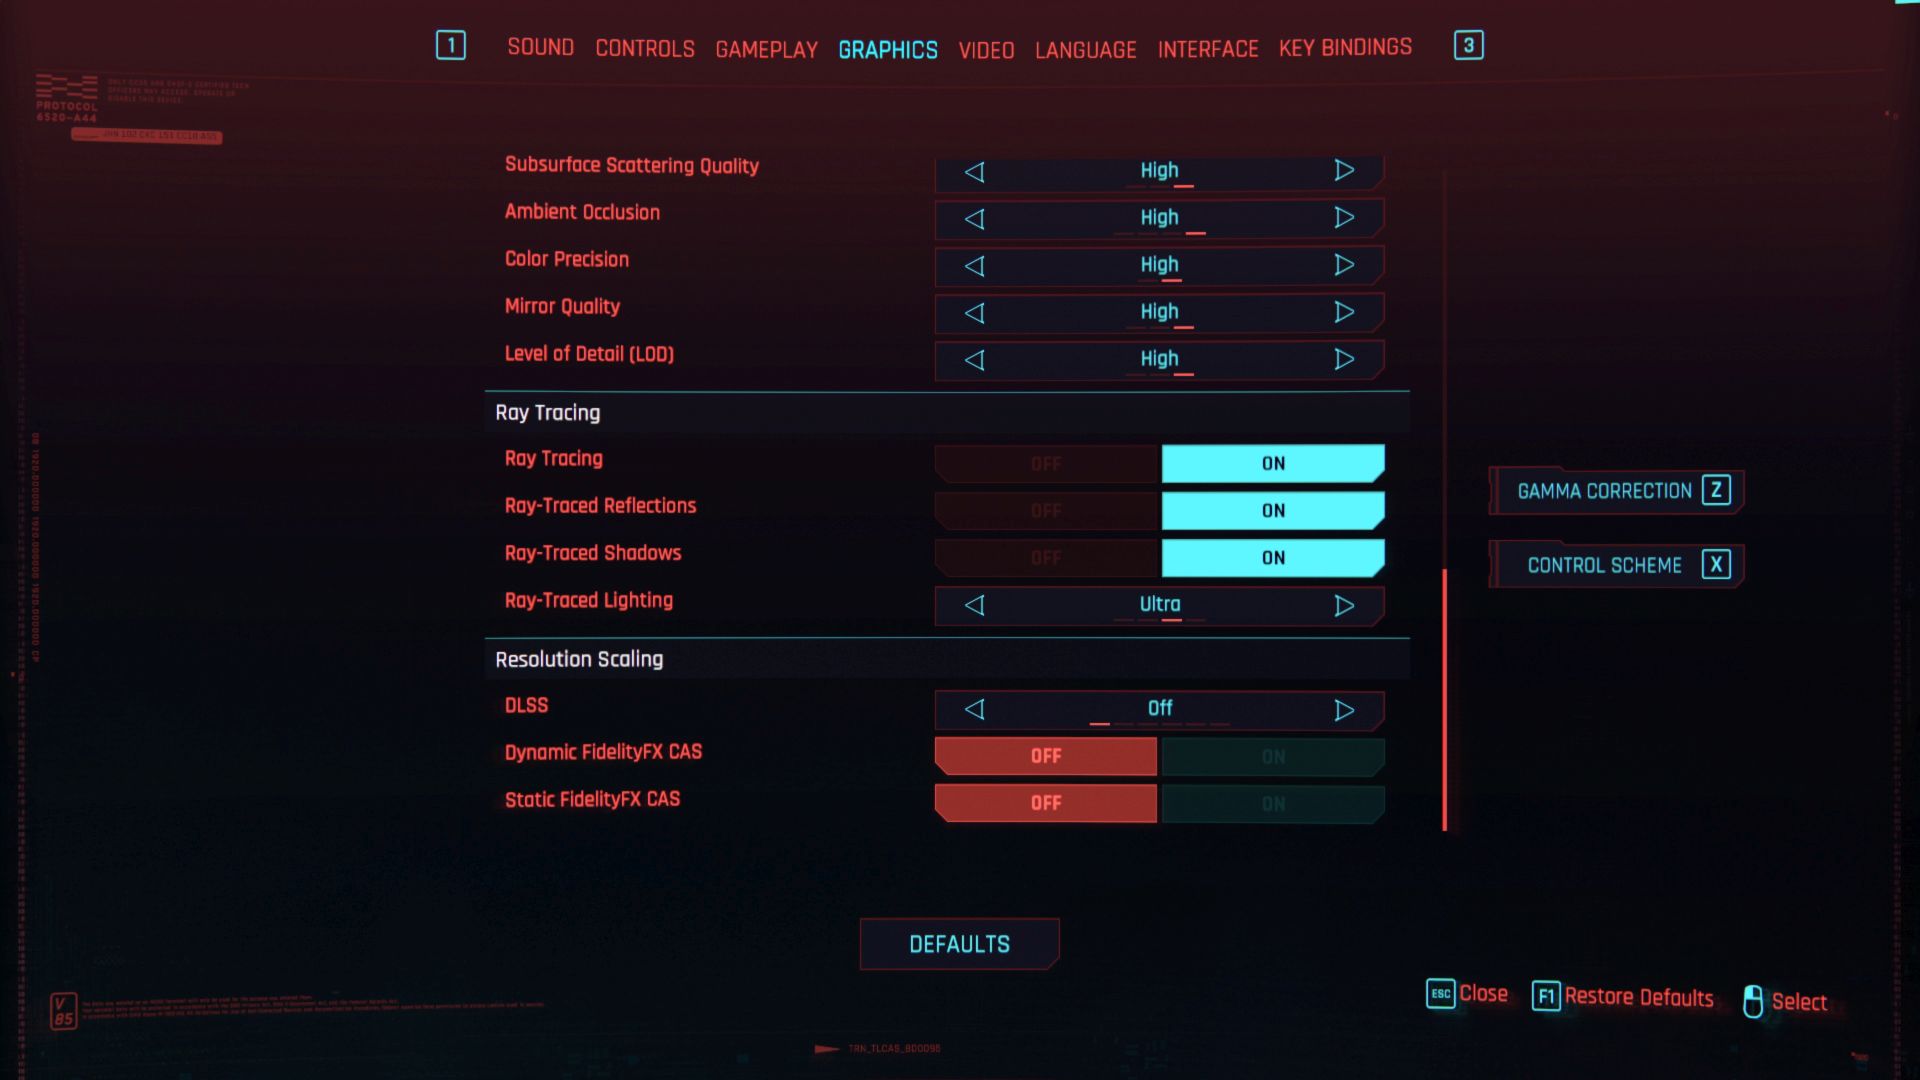
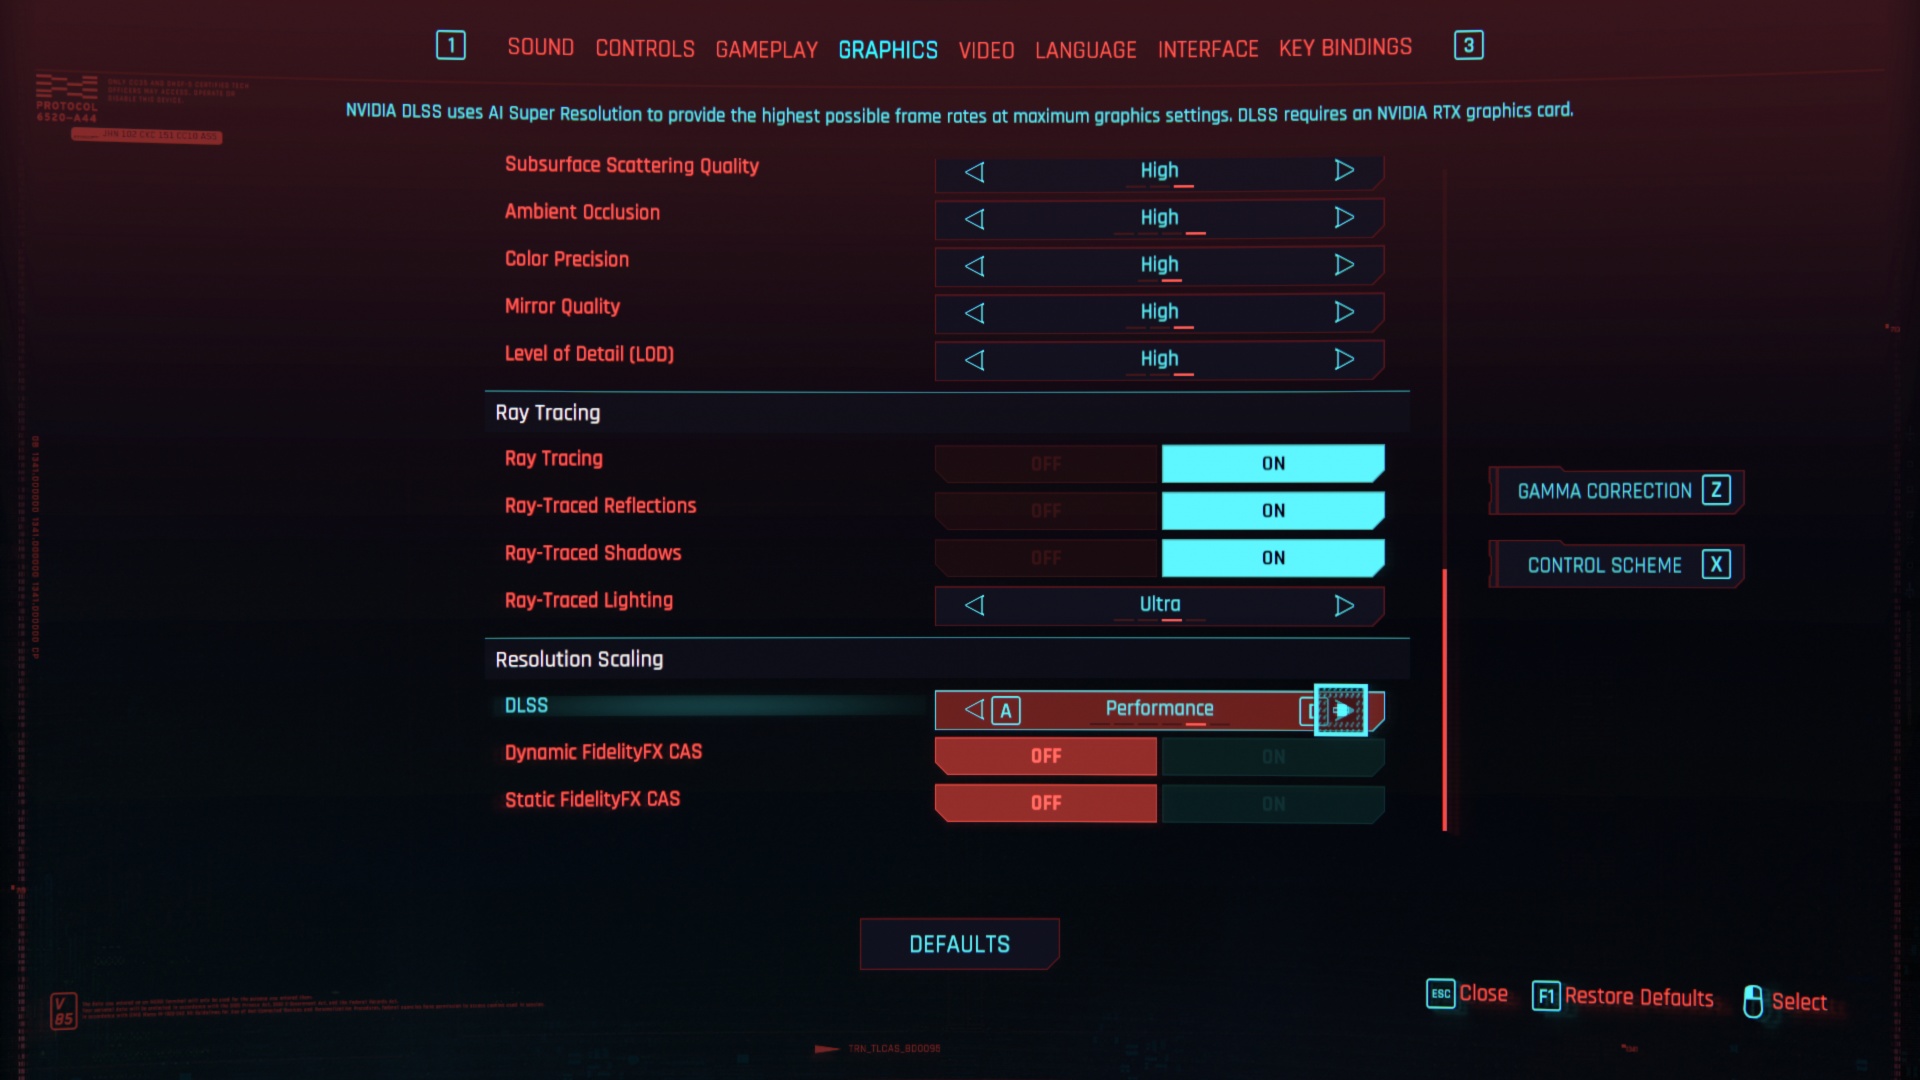
We’re testing performance in games across three resolutions with an aspect ratio of 16:9 – FHD (1920 × 1080 px), QHD (2560 × 1440 px) and UHD (3840 × 2160 px) and always with the highest graphic settings, which can be set the same on all current GeForce and Radeon graphics cards. We turned off proprietary settings for the objectivity of the conclusions, and the settings with ray-tracing graphics are tested separately, as lower class GPUs do not support them. You will find their results in the complementary chapters. In addition to native ray-tracing, also after deploying Nvidia DLSS (2.0) and AMD FidelityFX CAS.
If the game has a built-in benchmark, we use that one (the only exception is Forza Horizon 4, where due to its instability – it used to crash here and there – we drive on our track), in other cases the measurements take place on the games’ own scenes. From those we capture the times of consecutive frames in tables (CSV) via OCAT, which FLAT interprets into intelligible fps speech. Both of these applications are from the workshop of colleagues from the gpureport.cz magazine. In addition to the average frame rate, we also write the minimum in the graphs. That contributes significantly to the overall gaming experience. For the highest possible accuracy, all measurements are repeated three times and the final results form their average value.
Tests with active AMD Smart Access Memory will not be part of the standard methodology yet. Of course, we will focus on SAM, but for better orientation, we will include these tests in a separate article. But we’re doing this just temporarily, until GeForce graphics supports it as well. Then we switch to the opposite model and all cards will be tested with SAM turned on. Until then, however, SAM will be turned off in standard tests, and we will publish the performance increase under its influence separately. No one will be cut short by anything (neither those who have pure AMDs in their cases, nor the owners of Intel platforms) and the clarity of the results will be nicely preserved. Still, putting multiple modes of one card into the same chart (or having 500 charts per article instead of 300) would no longer do any good.
We plan to do one more thing – once a quarter to measure the impact of various updates (drivers, OS, games, BIOS) on performance. This will result in percentage increases or drops in performance that you can work with when studying older tests. It’s a bit of a compromise, but it’s definitely a better option than releasing new tests with out-of-date software. Of course, it would be ideal to test all previous cards before doing every new test, but this is unrealistic. But we believe that you will also appreciate the continuous measurement with one GeForce graphics card and one Radeon and the inclusion of the appropriate coefficient in the criteria of interactive graphs.
Computational tests
Testing the graphics card comprehensively, even in terms of computing power, is more difficult than drawing conclusions from the gaming environment. Just because such tests are usually associated with expensive software that you don’t just buy for the editorial office. On the other hand, we’ve found ways to bring the available computing performance to you. On the one hand, thanks to well-built benchmarks, on the other hand, there are also some freely available and at the same time relevant applications, and thirdly, we have invested something in the paid ones
The tests begin with ComputeBench, which computes various simulations (including game graphics). Then we move on to the popular SPECviewperf benchmark (2020), which integrates partial operations from popular 2D and 3D applications, including 3Ds max and SolidWorks. Details on this test package can be found at spec.org. From the same team also comes SPECworkstation 3, where GPU acceleration is in the Caffe and Folding@Home tests. You can also find the results of the LuxMark 3.1 3D render in the graphs, and the remarkable GPGPU theoretical test also includes AIDA64 with FLOPS, IOPS and memory speed measurements.
For obvious reasons, 3D rendering makes the largest portion of the tests. This is also the case, for example, in the Blender practical tests (2.91). In addition to Cycles, we will also test the cards in Eevee and radeon ProRender renderers (let AMD have a related test, as most are optimized for Nvidia cards with proprietary CUDA and OptiX frameworks). Of course, an add-on for V-ray would also be interesting, but at the moment the editorial office can’t afford it, we may manage to get a “press” license in time, though, we’ll see. We want to expand application tests in the future. Definitely with some advanced AI testing (we haven’t come up with a reasonable way yet), including noise reduction (there would be some ideas already, but we haven’t incorporated those due to time constraints).
Graphics cards can also be tested well in photo editing. To get an idea of the performance in the popular Photoshop, we’re using a script in PugetBench, which simulates real work with various filters. Among them are those that use GPU acceleration. A comprehensive benchmark suggesting the performance of raster and vector graphics is then also used in alternative Affinity Photo. In Lightroom, there are remarkable color corrections (Enhance Details) of raw uncompressed photos. We apply these in batches to a 1 GB archive. All of these tasks can be accelerated by both GeForce and Radeon.
From another perspective, there are decryption tests in Hashcat with a selection of AES, MD5, NTLMv2, SHA1, SHA2-256/512 and WPA-EAPOL-PBKDF2 ciphers. Finally, in the OBS and XSplit broadcast applications, we measure how much the game performance will be reduced while recording. It is no longer provided by shaders, but by coders (AMD VCE and Nvidia Nvenc). These tests show how much spare performance each card has for typical online streaming.
There are, of course, more hardware acceleration options, typically for video editing and conversion. However, this is purely in the hands of encoders, which are always the same within one generation of cards from one manufacturer, so there is no point in testing them on every graphics card. It is different across generations and tests of this type will sooner or later appear. Just fine-tuning the metric is left, where the output will always have the same bitrate and pixel match. This is important for objective comparisons, because the encoder of one company/card may be faster in a particular profile with the same settings, but at the expense of the lower quality that another encoder has (but may not have, it’s just an example).
No compromises in performance! If this is your motto, then you cannot miss the test of the graphics card GeForce RTX 3090. It will also feed 4K resolution, has the fastest ray tracing and OptiX acceleration, huge video memory and, the review sample from MSI also has many more attractive features. The biggest drawback, as is usual with high-end hardware, is the price. It is really high.
Methodology: how we measure power draw
We have been tuning the method of measuring power draw for quite a long time and we will also be tuning it for some time. But we already have gimmicks that we can work with happily.
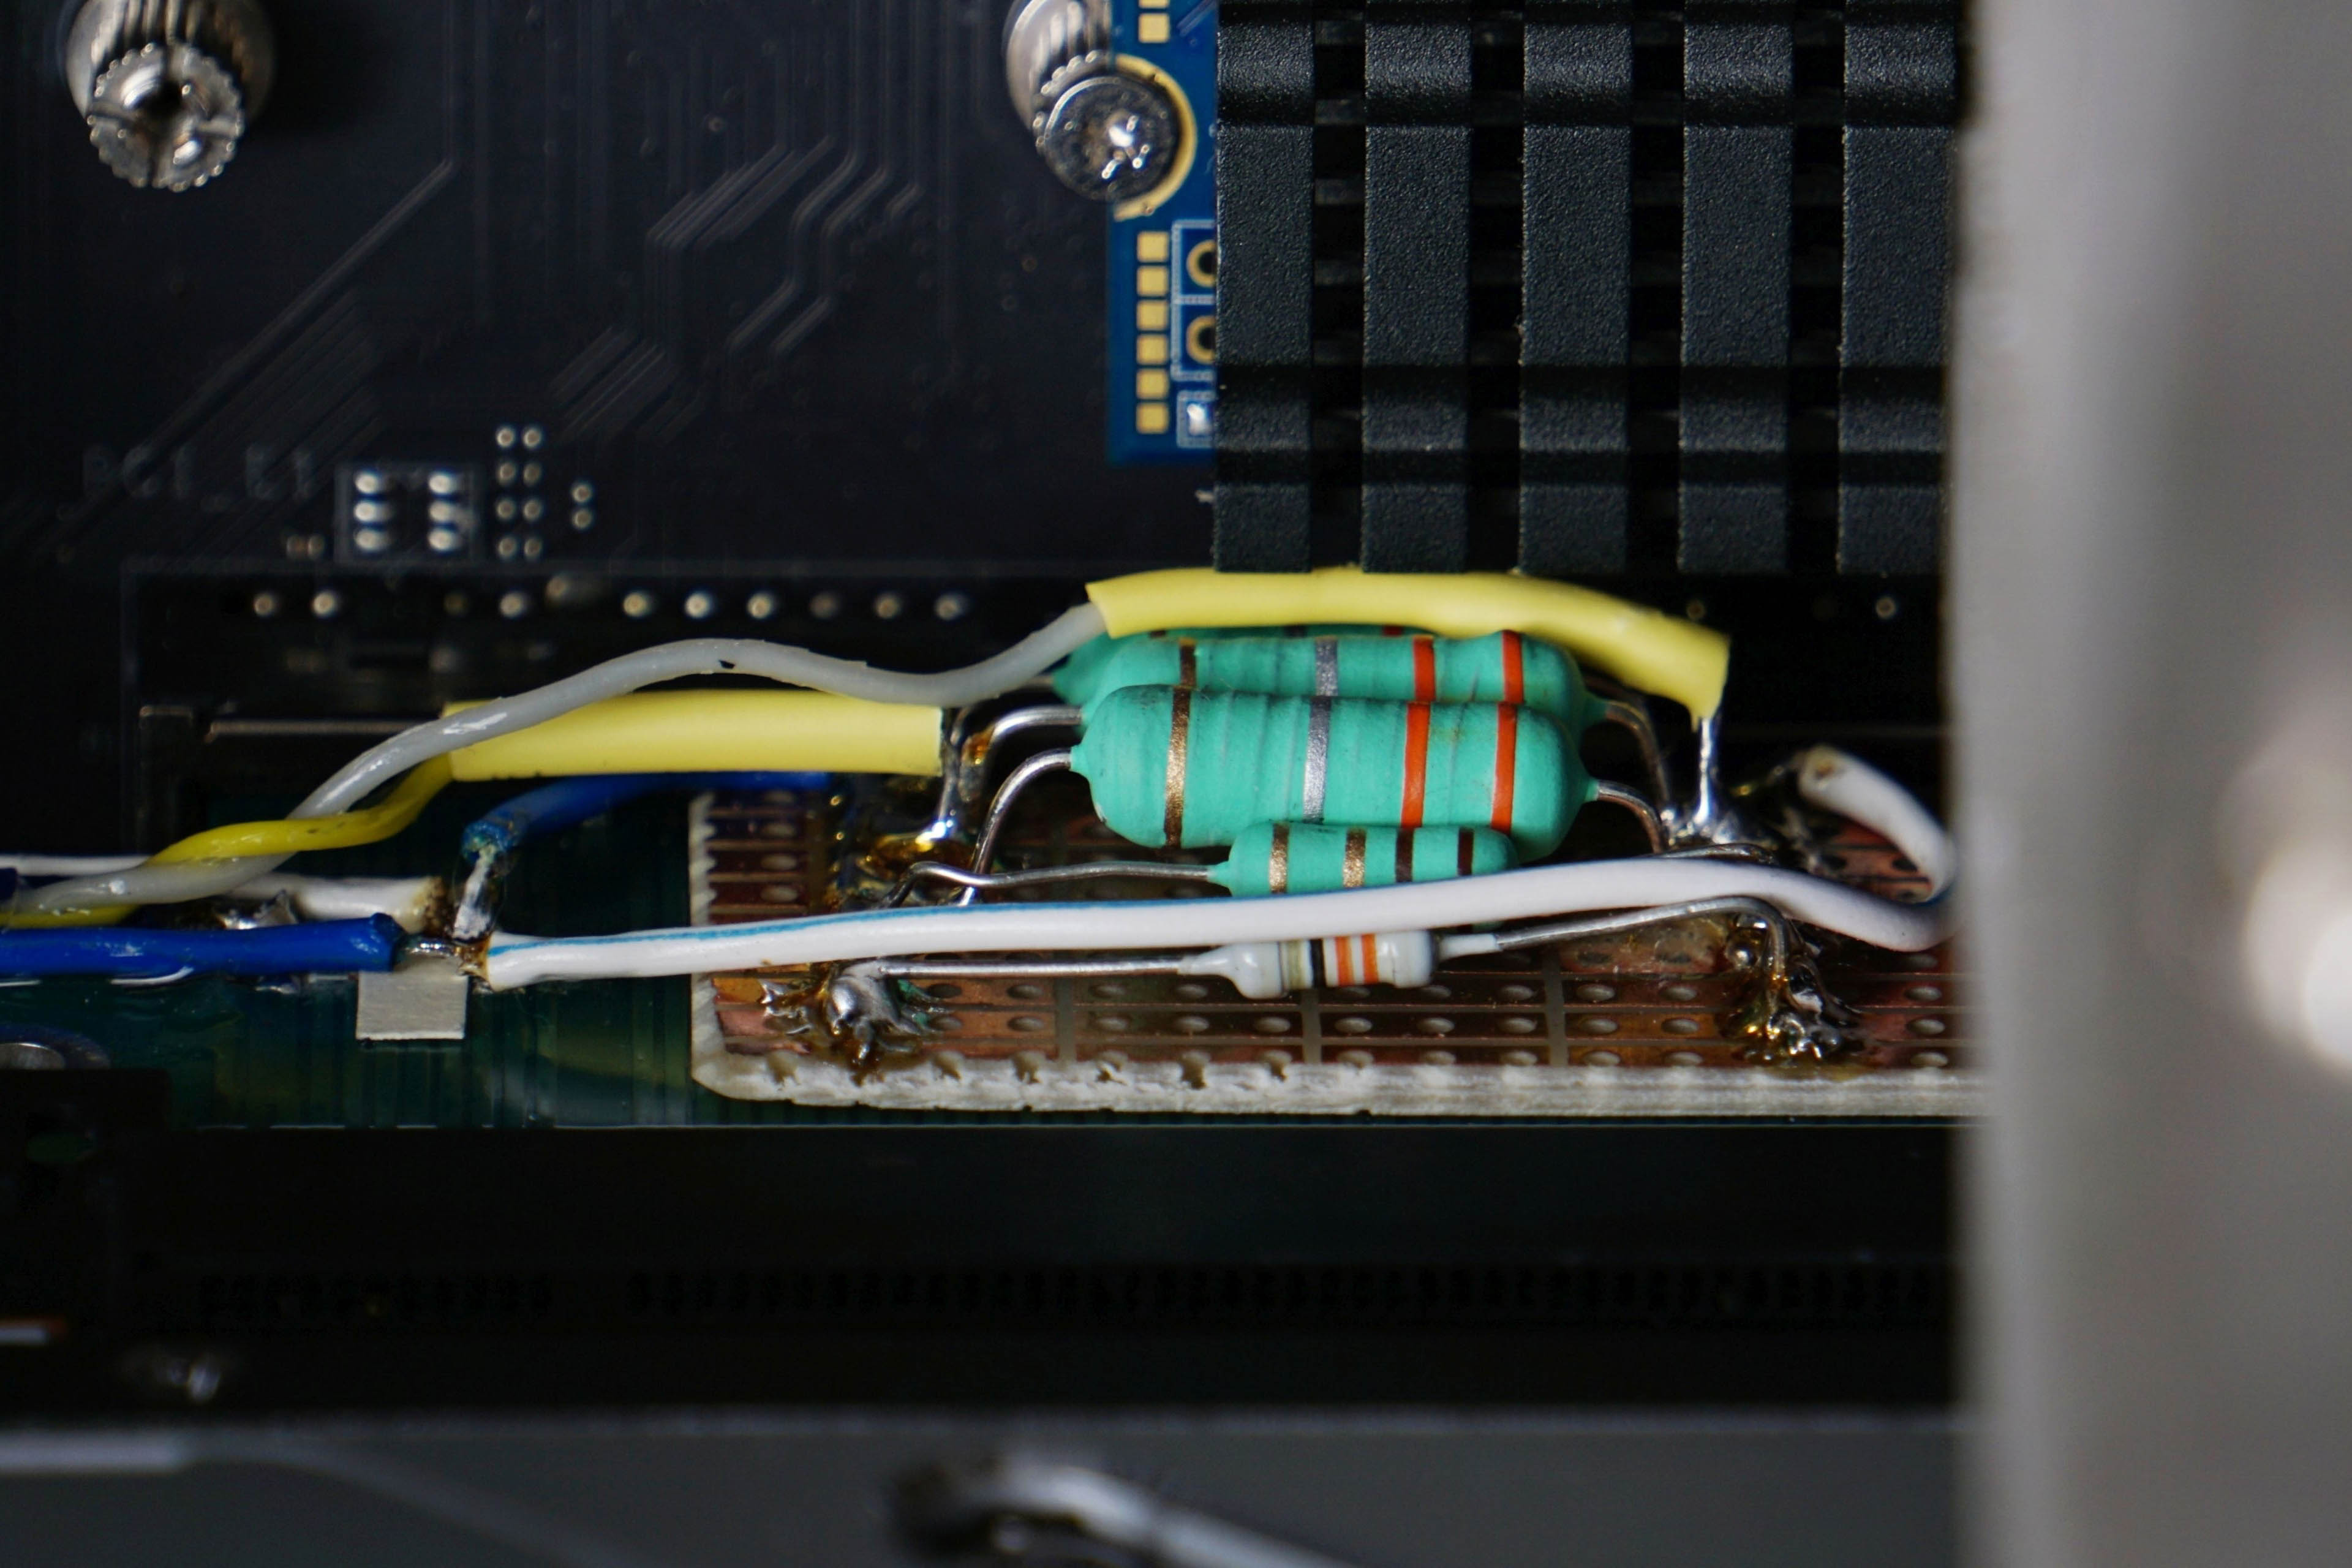
To get the exact value of the total power draw of the graphics card, it is necessary to map the internal power draw on the PCI Express slot and the external one on the additional power supply. For the analysis of the PCIe slot, it was necessary to construct an in-between card on which the power draw measurement takes place. Its basis is resistors calibrated to the exact value (0.1 Ω) and according to the amount of their voltage drop we can calculate the current. We then substitute it into the formula for the corresponding value of the output voltage ~ 12 V and ~ 3.3 V. The voltage drop is so low that it doesn’t make the VRM of the graphics card unstable and the output is still more than 12/3.3 V.

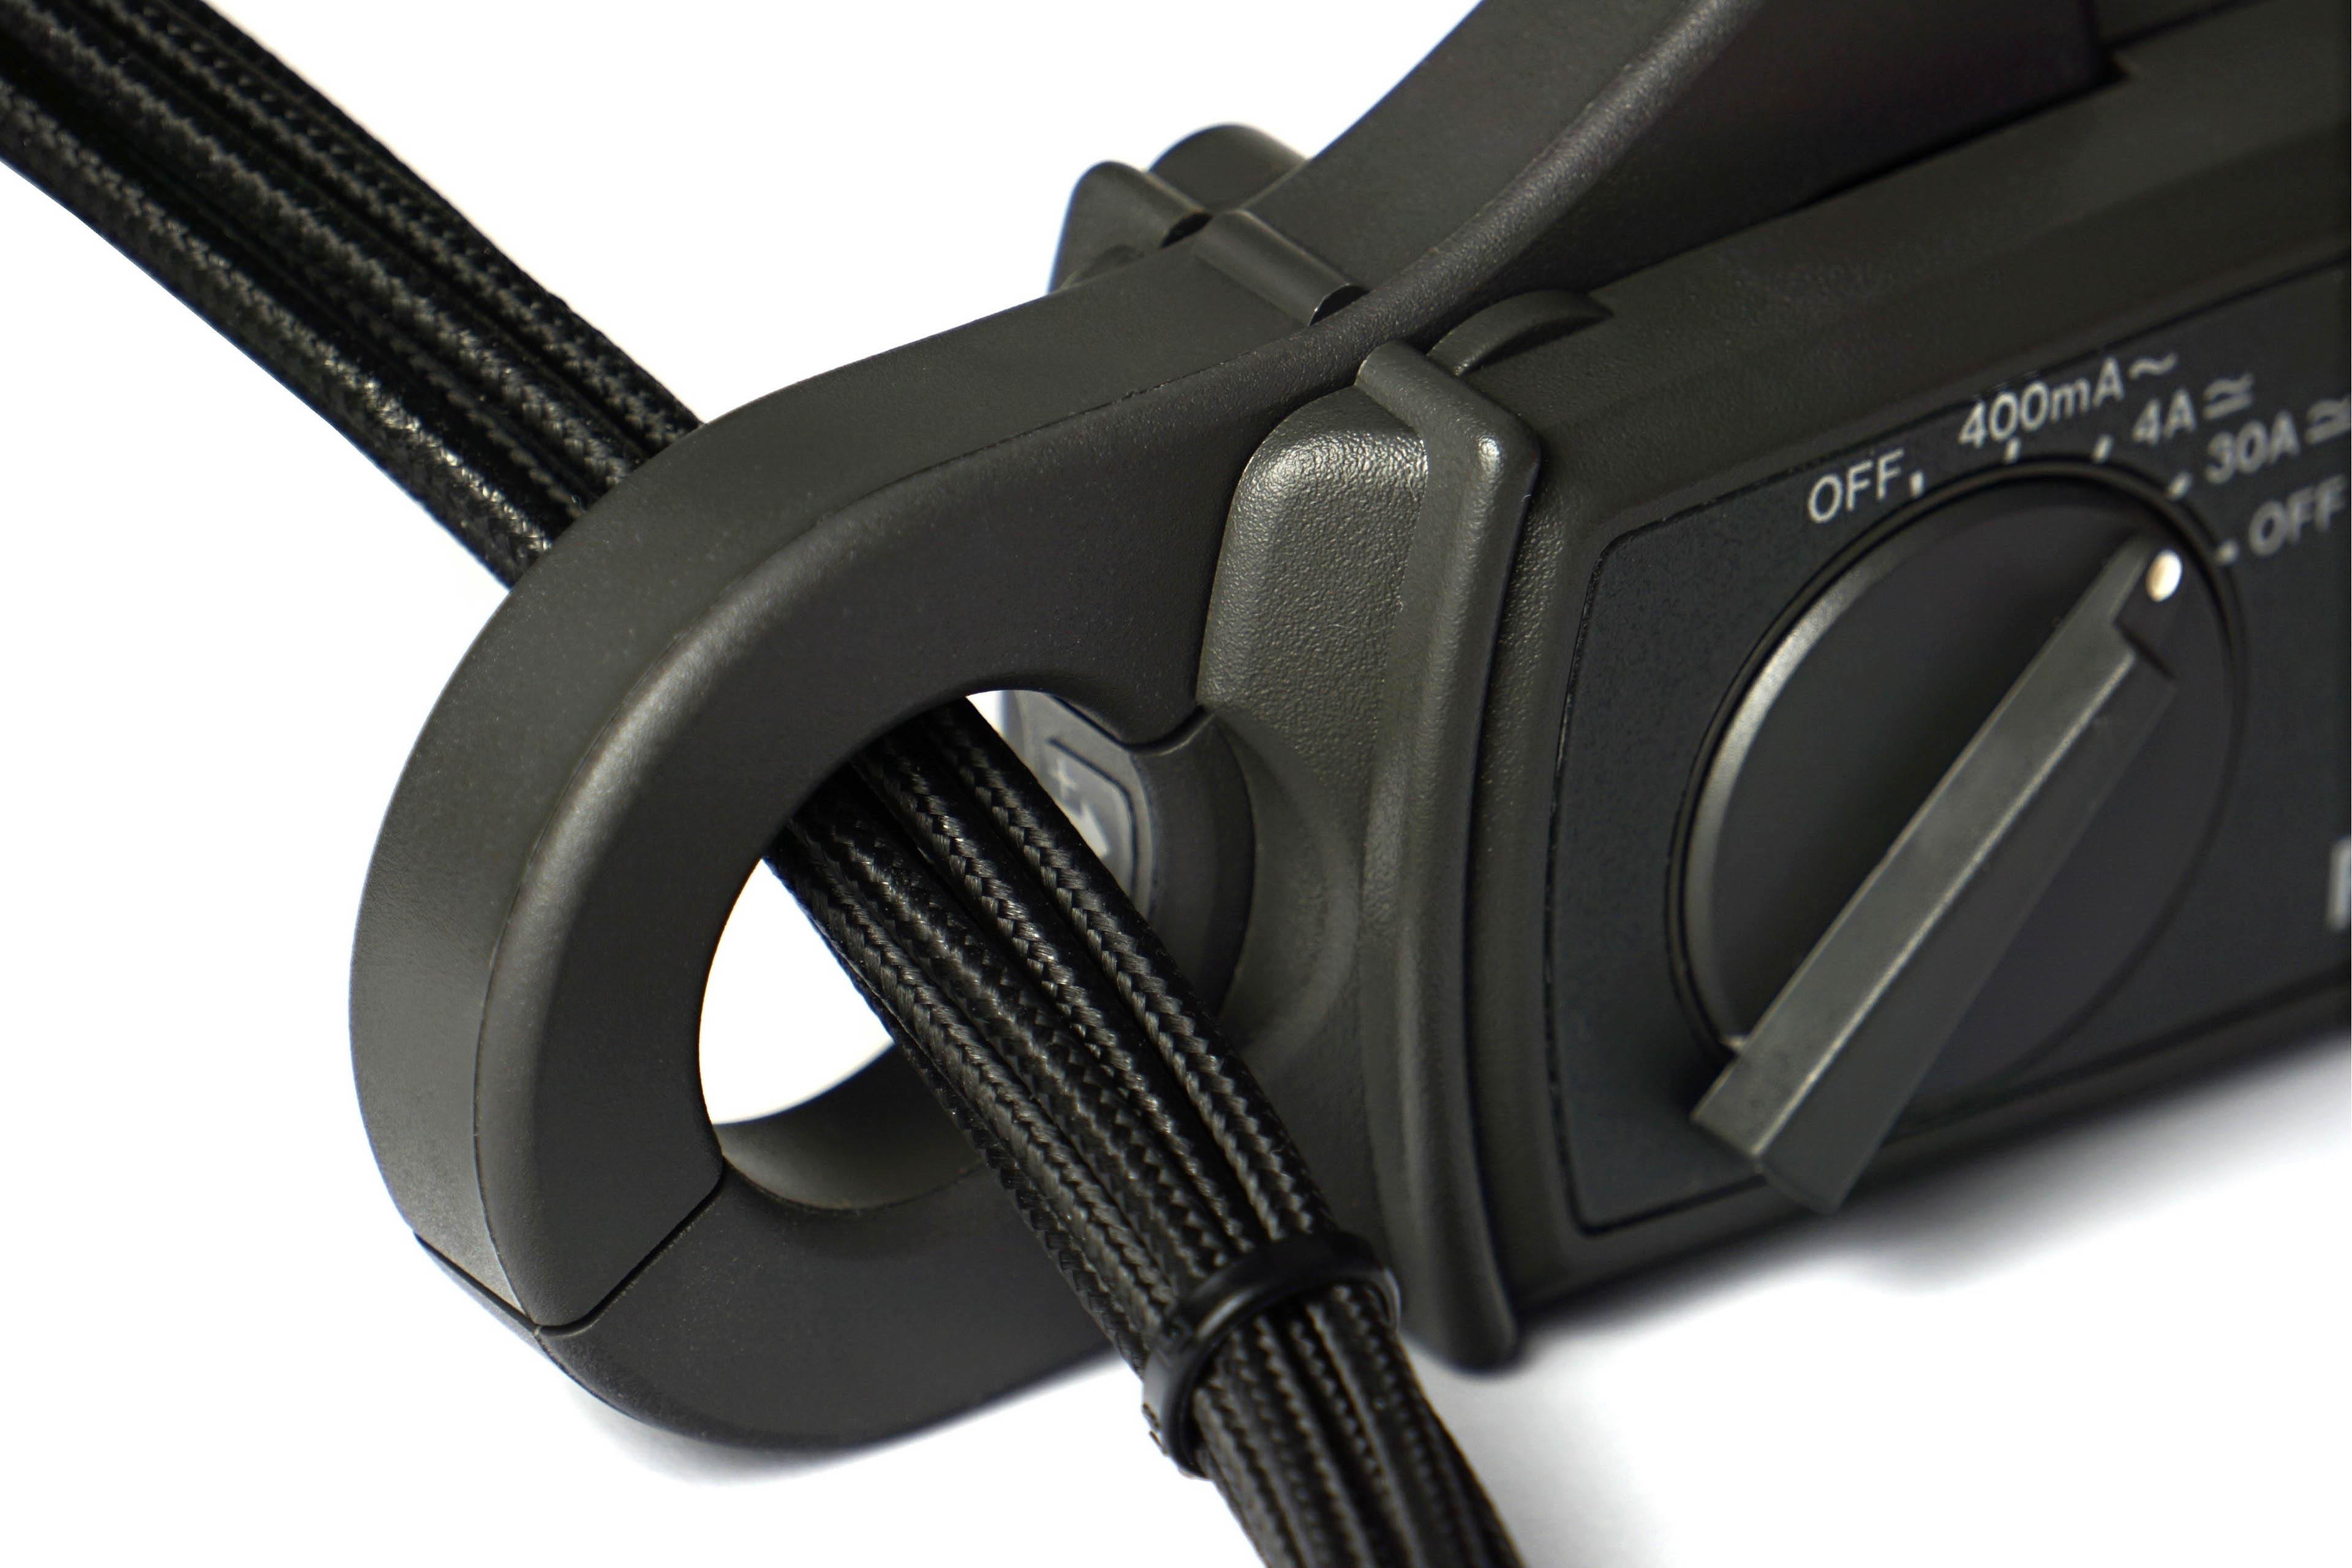
We are also working on a similar device for external power supply. However, significantly higher currents are achieved there, longer cabling and more passages between connectors are necessary, which means that the voltage drop will have to be read on an even smaller resistance of 0.01 Ω, the current state (with 0.1 Ω) is unstable for now. Until we fine-tune it, we will use Prova 15 current clamp for cable measurements, which also measures with good accuracy, they just have a range of up to 30 A. But that is also enough for the OC version of the RTX 3090 Gaming X Trio. If a card is over the range, it is always possible to split the consumption measurement (first into one half and then into the other half of the 12 V conductors).
And why bother with such devices at all when Nvidia has a PCAT power draw analyzer? For complete control over the measurements. While our devices are transparent, the Nvidia’s tool uses the processor that can (but of course does not have to) affect the measurements. After testing the AMD graphics card on the Nvidia’s tool, we probably wouldn’t sleep well.
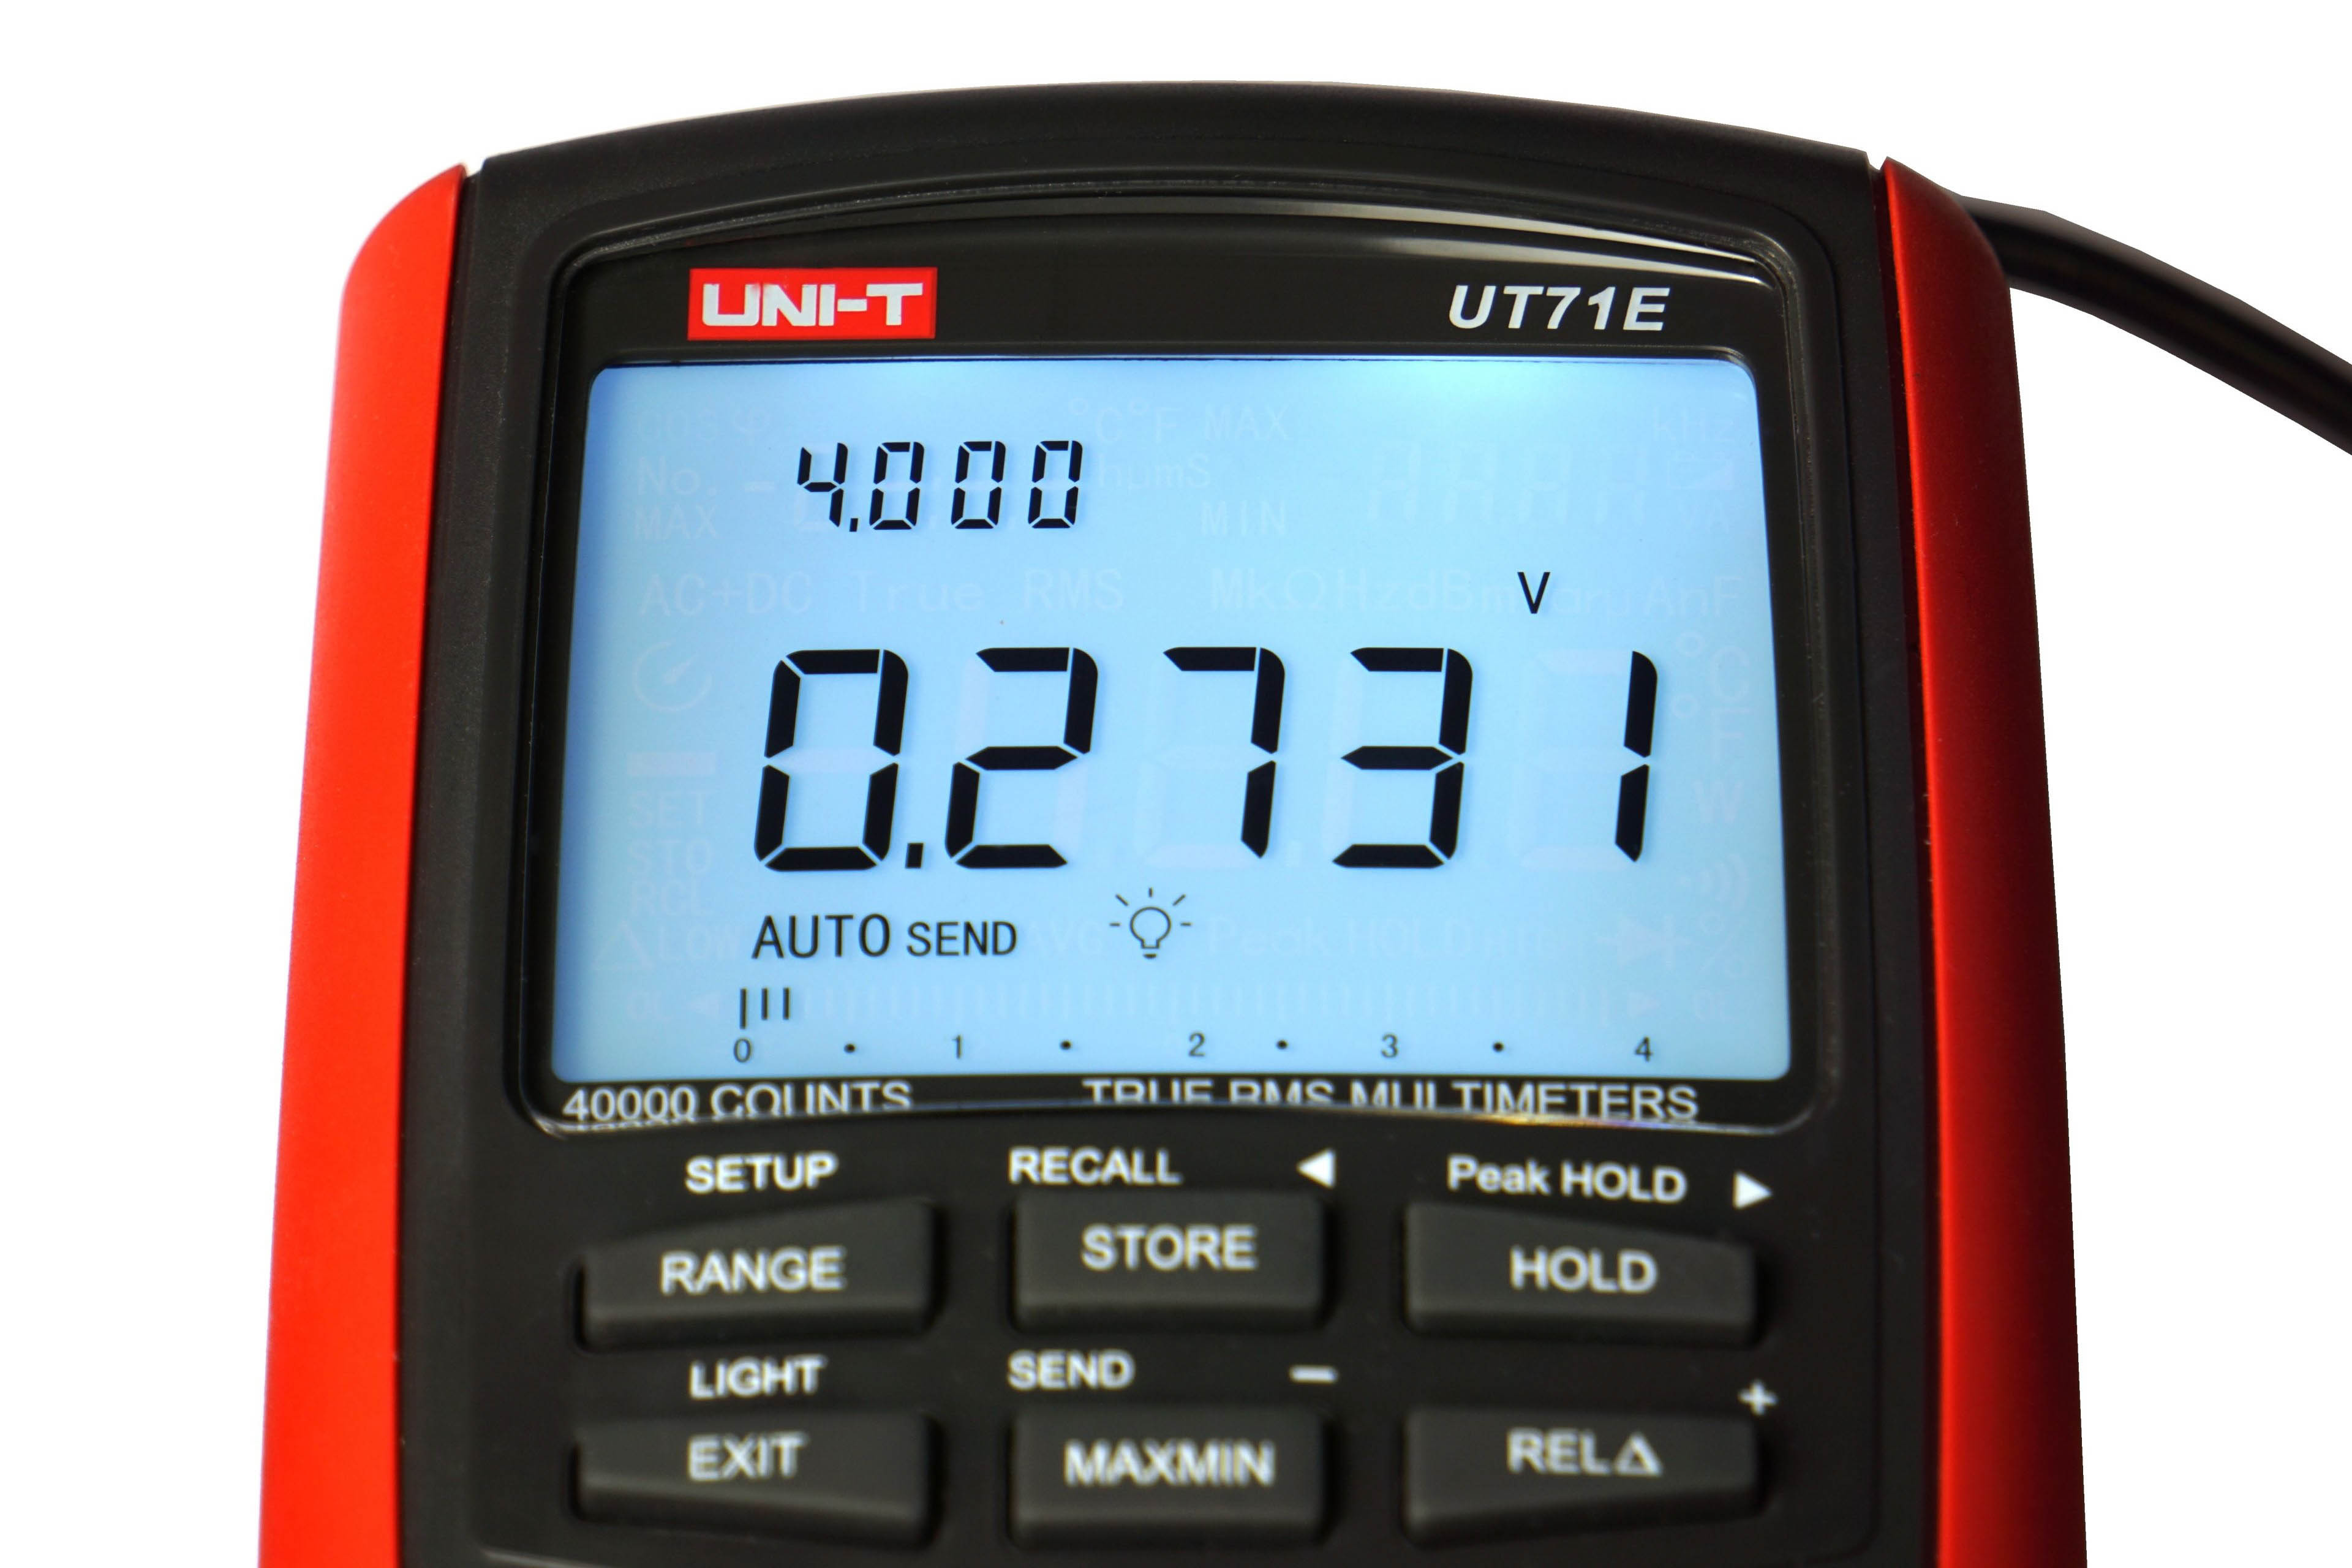
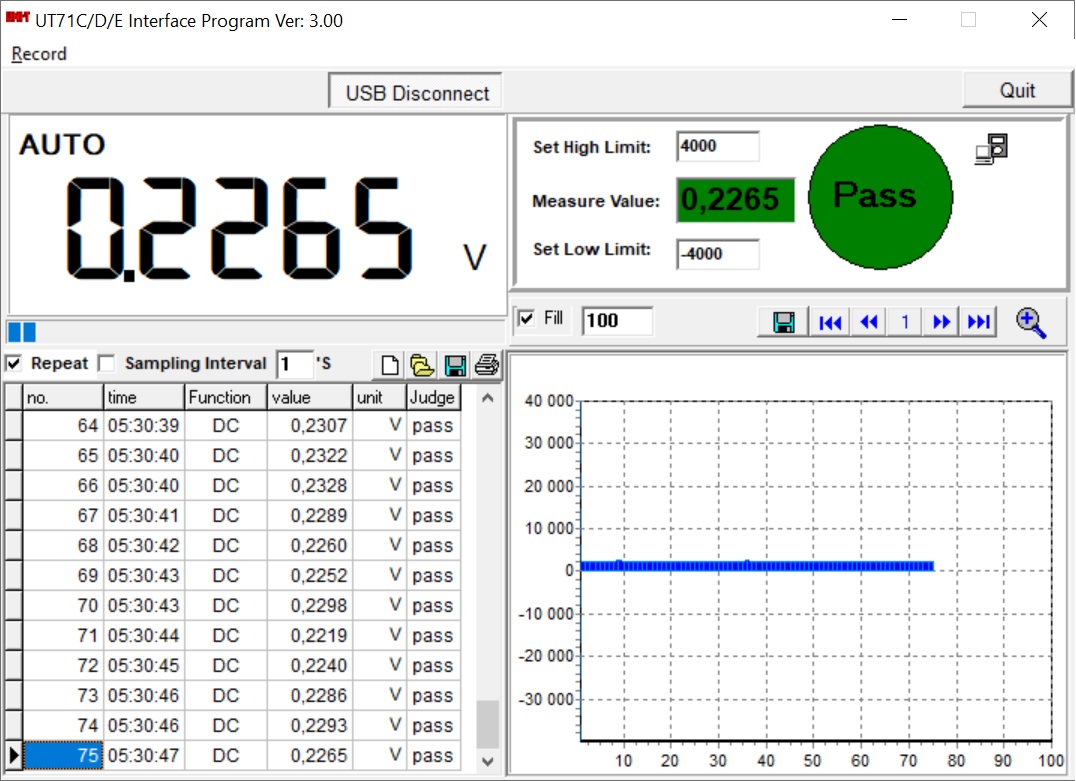
To read and record measurements, we use a properly calibrated multimeter UNI-T UT71E, which exports samples to XLS. From it we obtain the average value and by substituting into the formula with the exact value of the subcircuit output voltages we obtain the data for the graphs.


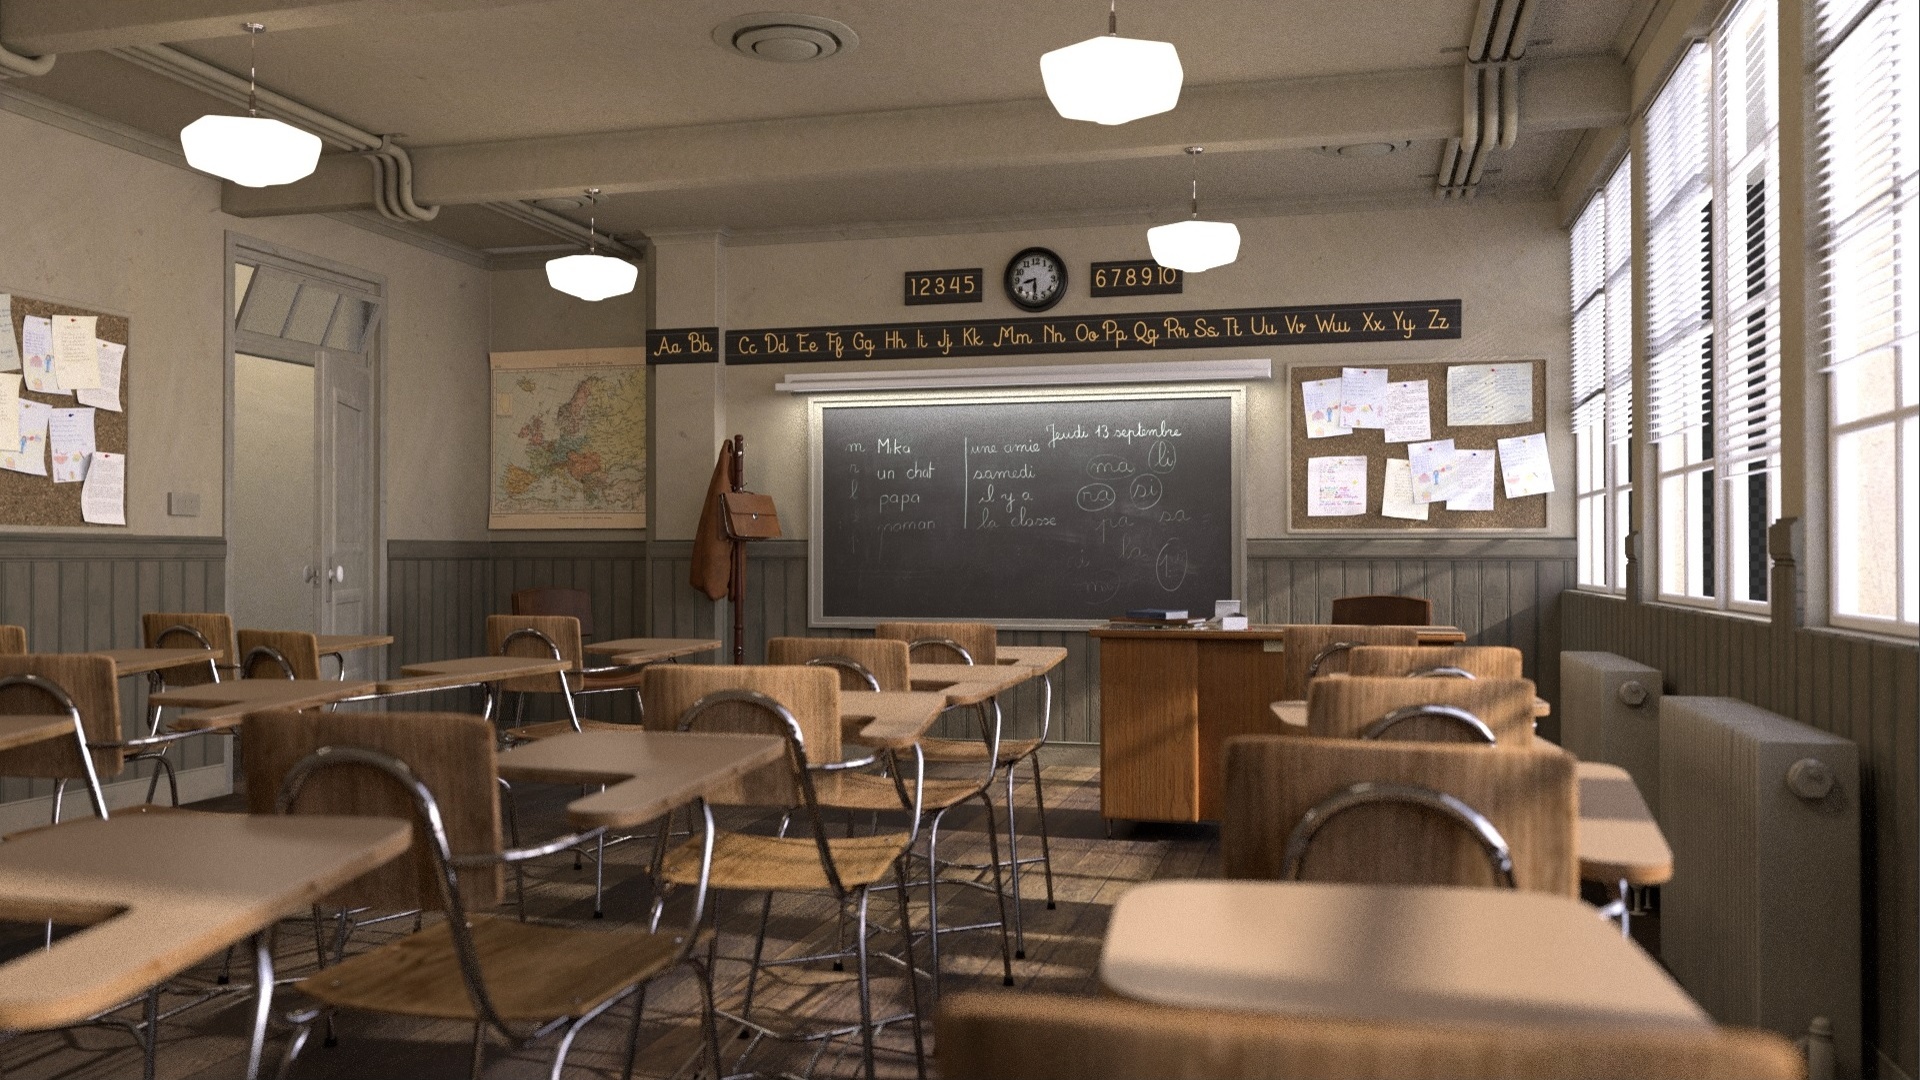
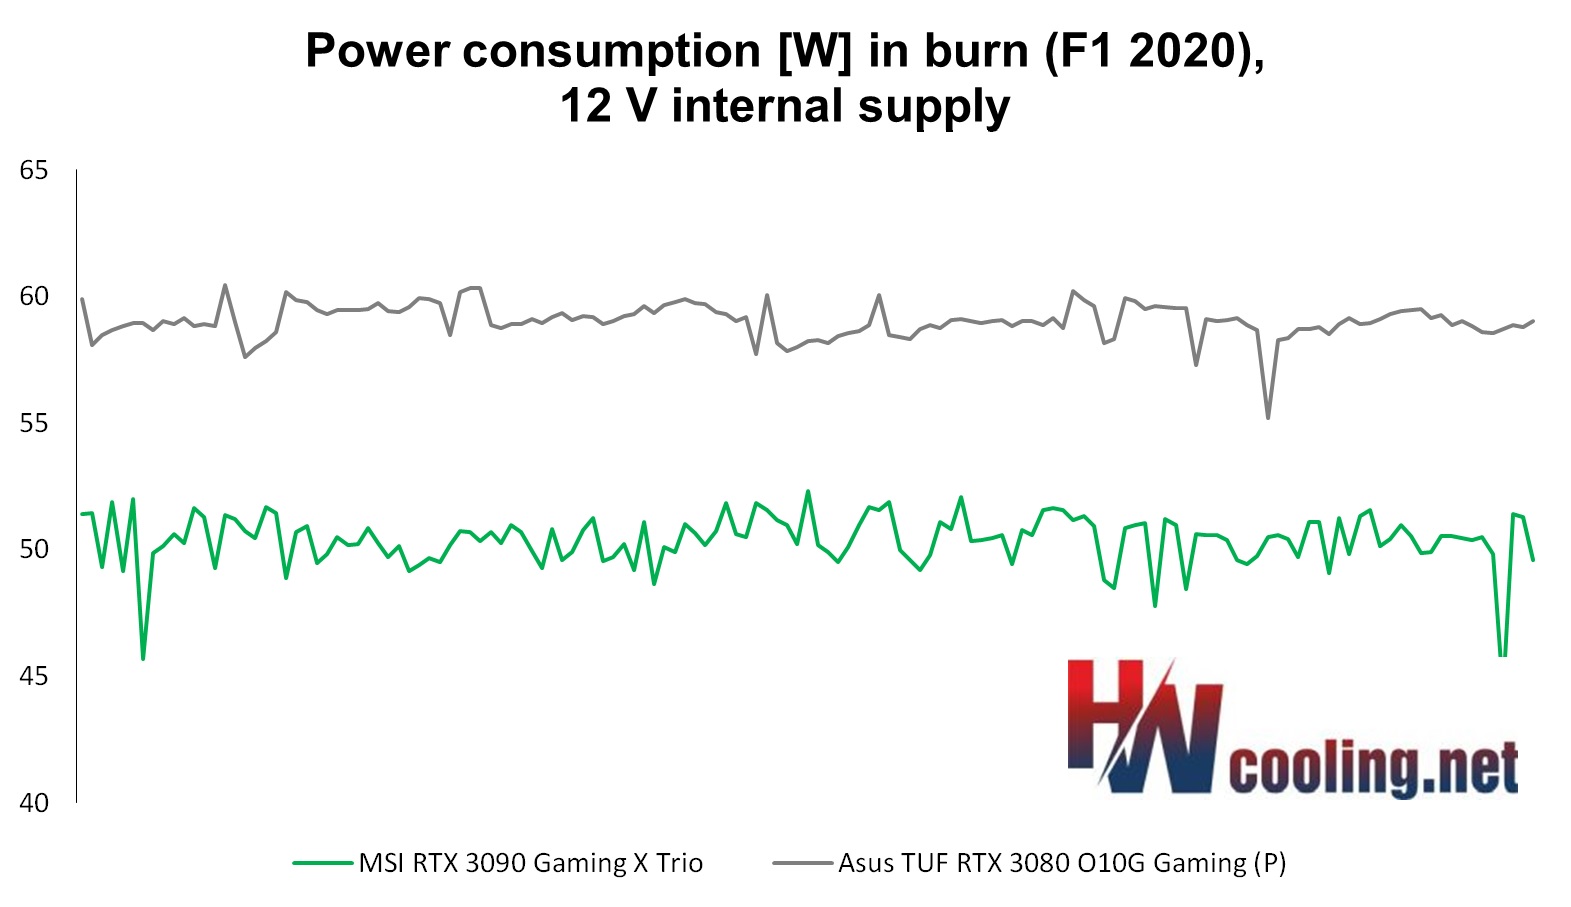
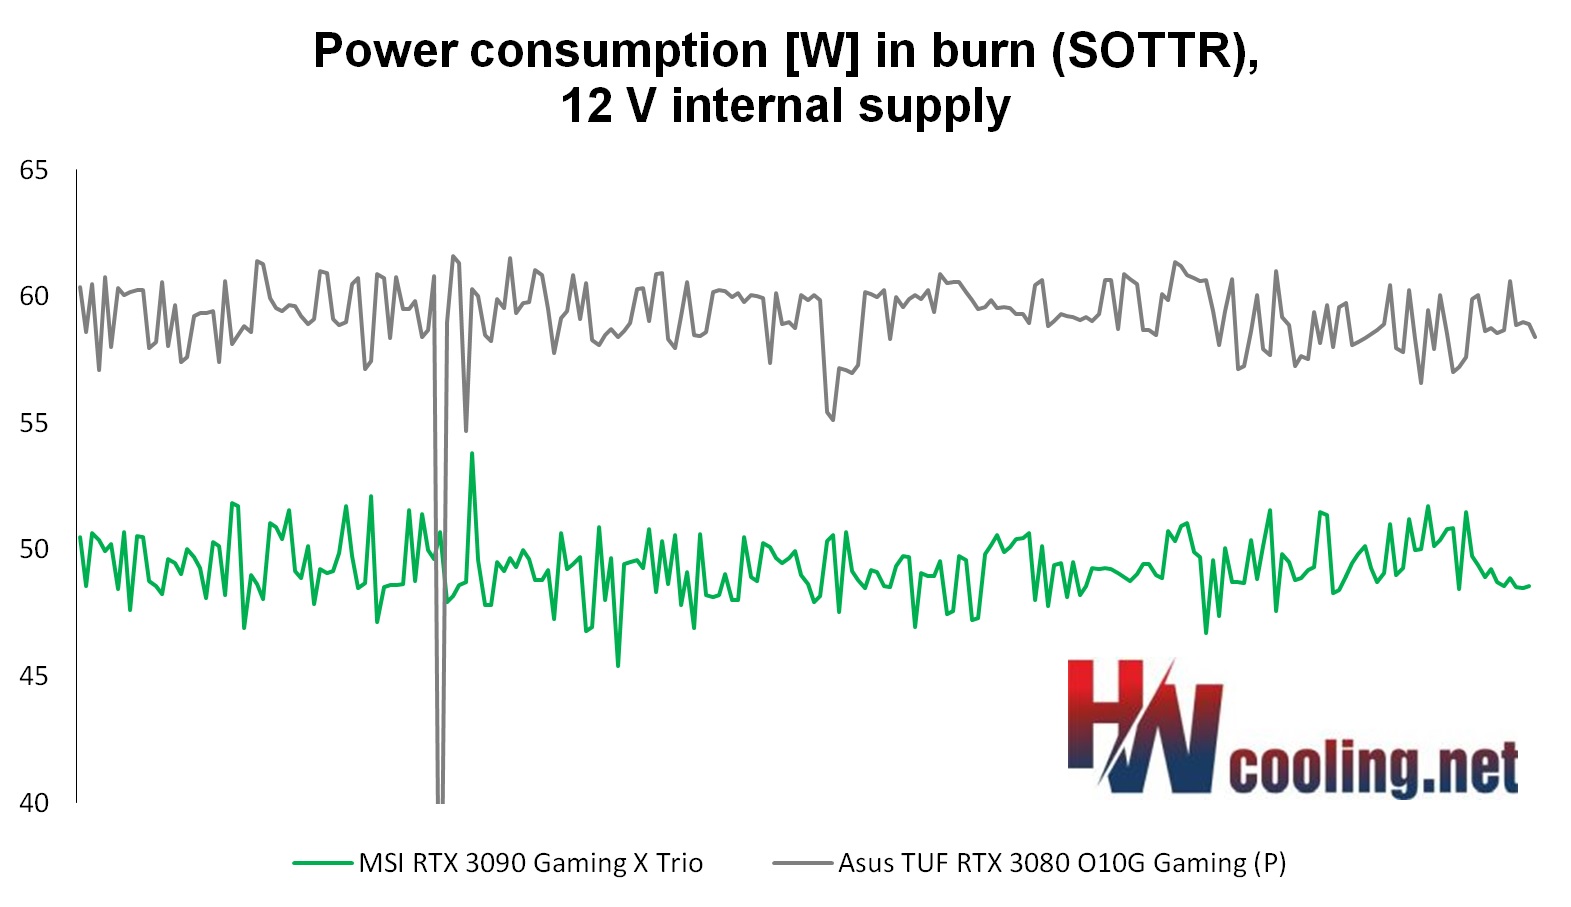
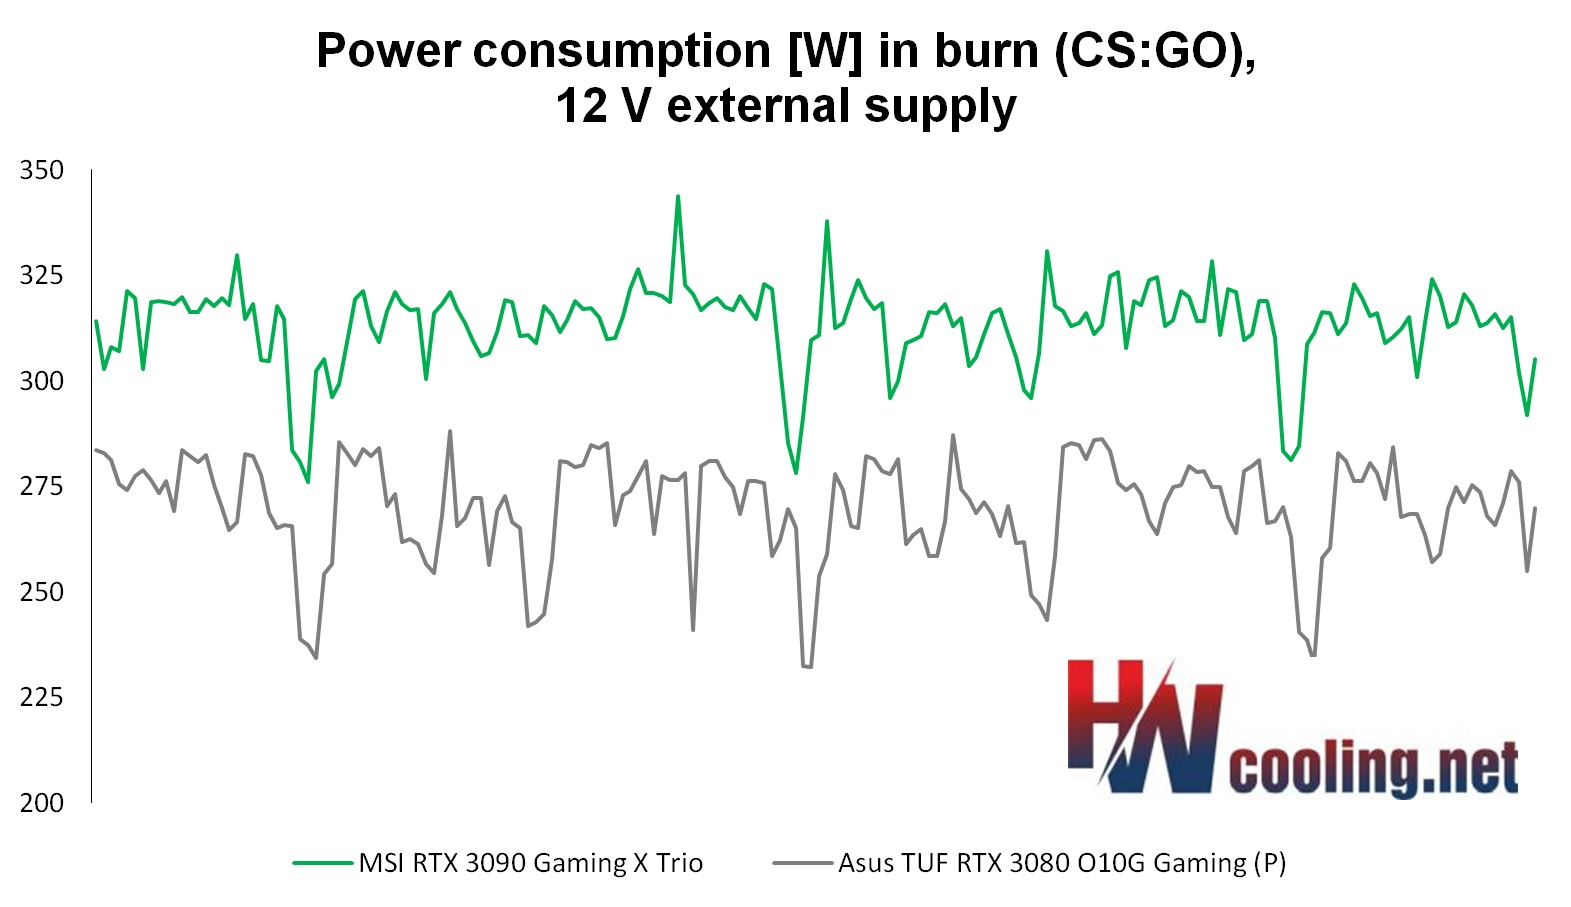
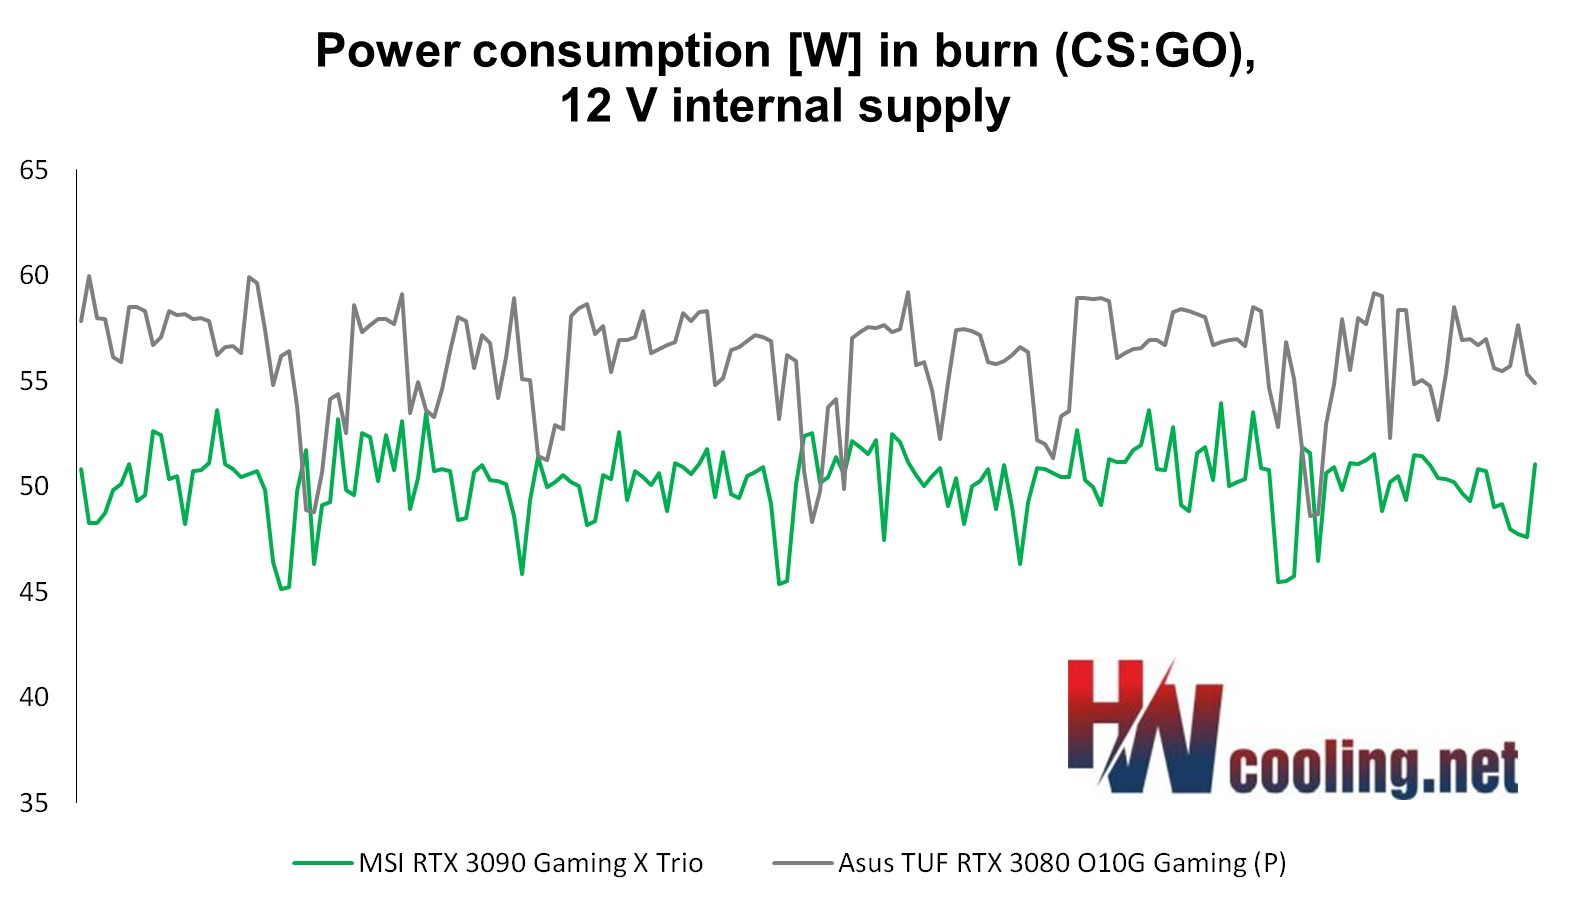
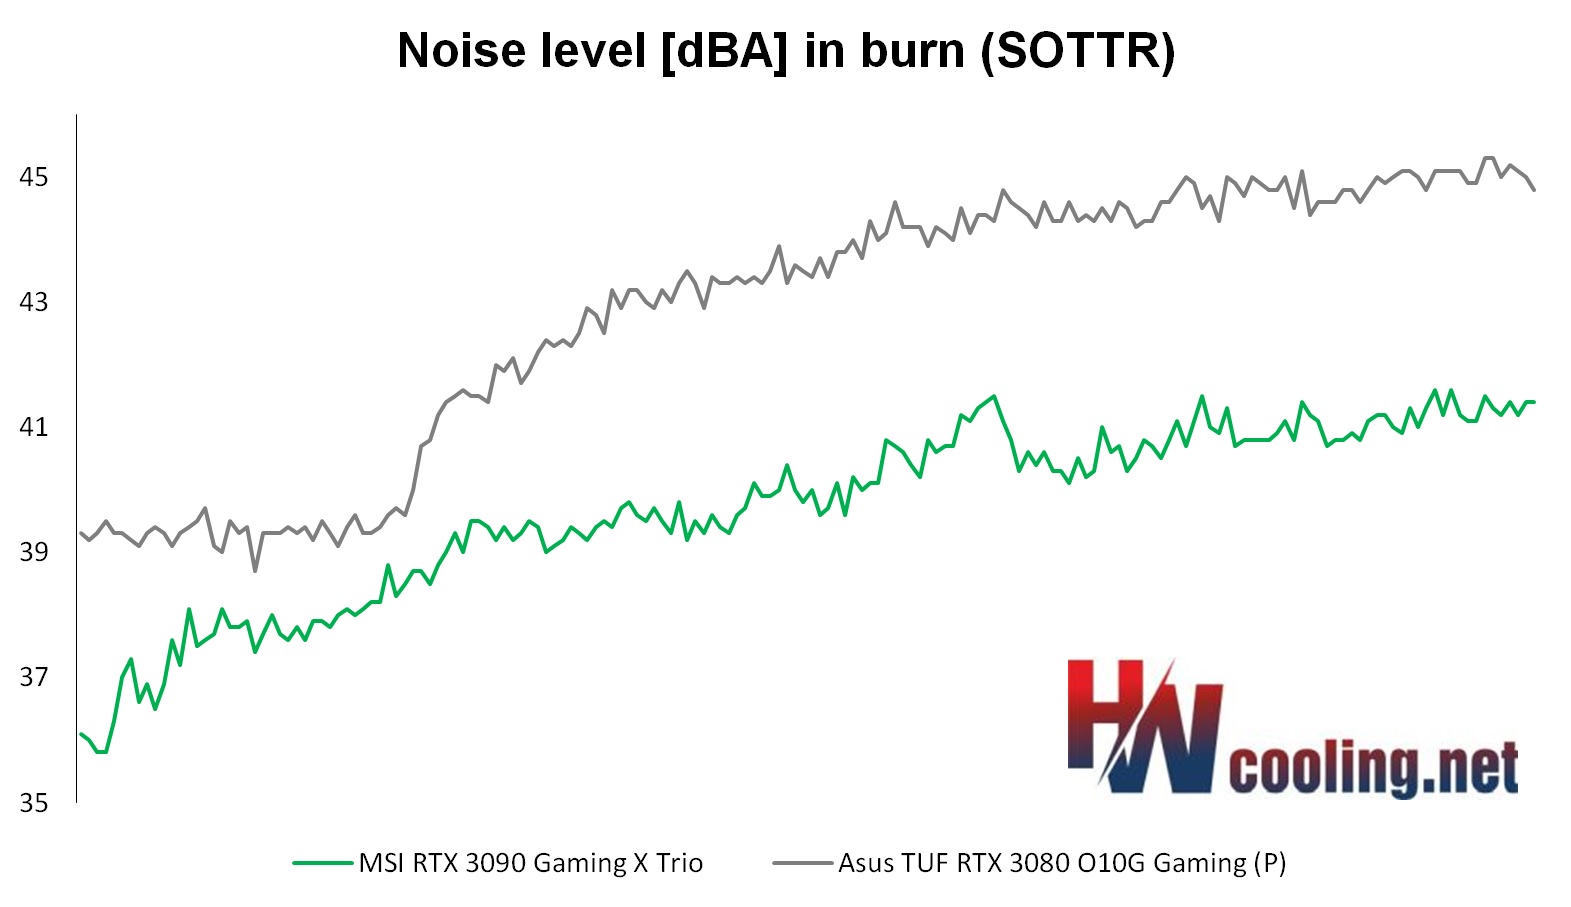
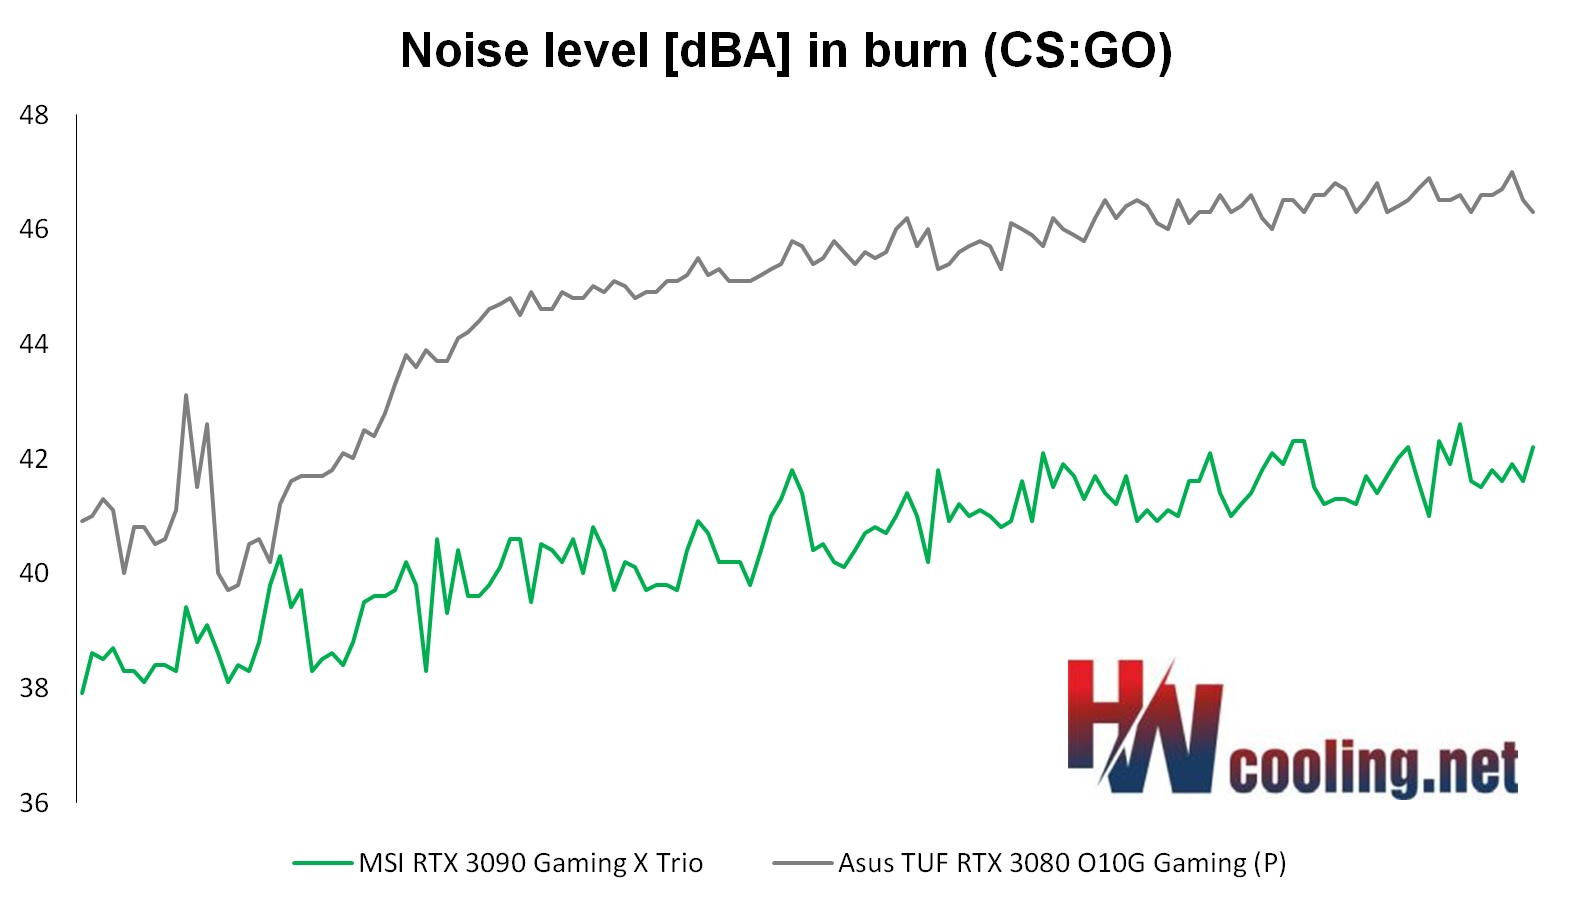
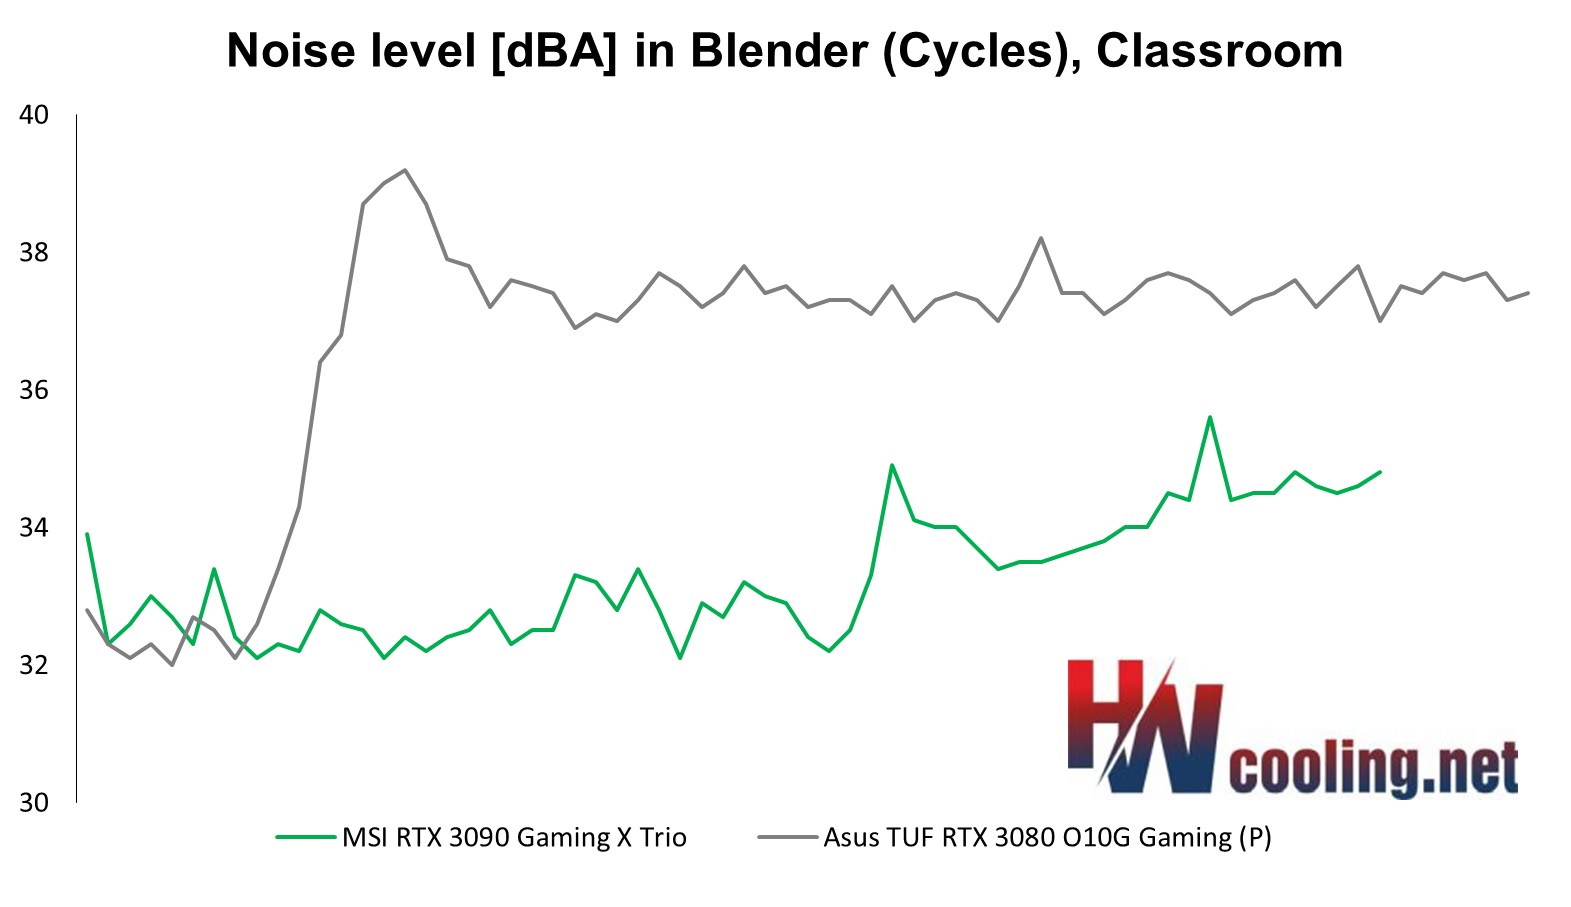
We will analyze the line graphs with the waveforms for each part of the power supply separately. Although the 3.3 V value is usually negligible, it needs to be monitored. It is difficult to say what exactly this subcircuit powers, but usually the consumption on it is constant and when it changes only with regard to whether a static or dynamic image is rendered. We measure consumption in two sort of demanding games (F1 2020 and Shadow of the Tomb Raider) and one less demanding one (CS:GO) with the highest graphic details preset and UHD resolution (3840 × 2560 px). Then in 3D rendering in Blender using the Cycles renderer on the famous Classroom scene. However, in addition to high-load tests, it’s important to know your web browser consumption (which, in our case, is accelerated Google Chrome), where we also spend a lot of time watching videos or browsing the web. The usual average load of this type is represented by the FishIE Tank (HTML5) website with 20 fish and the web video in our power draw tests is represented by a sample with the VP9 codec, data rate of 17.4 mb/s and 60 fps. In contrast, we also test offline video consumption, in VLC player on a 45 HEVC sample (45.7 mb/s, 50 fps). Finally, we also record the power consumption of the graphics card on the desktop of idle Windows 10 with one or two active UHD@60 Hz monitors.
No compromises in performance! If this is your motto, then you cannot miss the test of the graphics card GeForce RTX 3090. It will also feed 4K resolution, has the fastest ray tracing and OptiX acceleration, huge video memory and, the review sample from MSI also has many more attractive features. The biggest drawback, as is usual with high-end hardware, is the price. It is really high.
Noise measurement…
Noise, as well as other operating characteristics, which we will focus on, we’re measuring in the same modes as consumption, so that the individual values overlap nicely. In addition to the level of noise produced, we also record the frequency response of the sound, the course of the GPU frequencies and its heating.
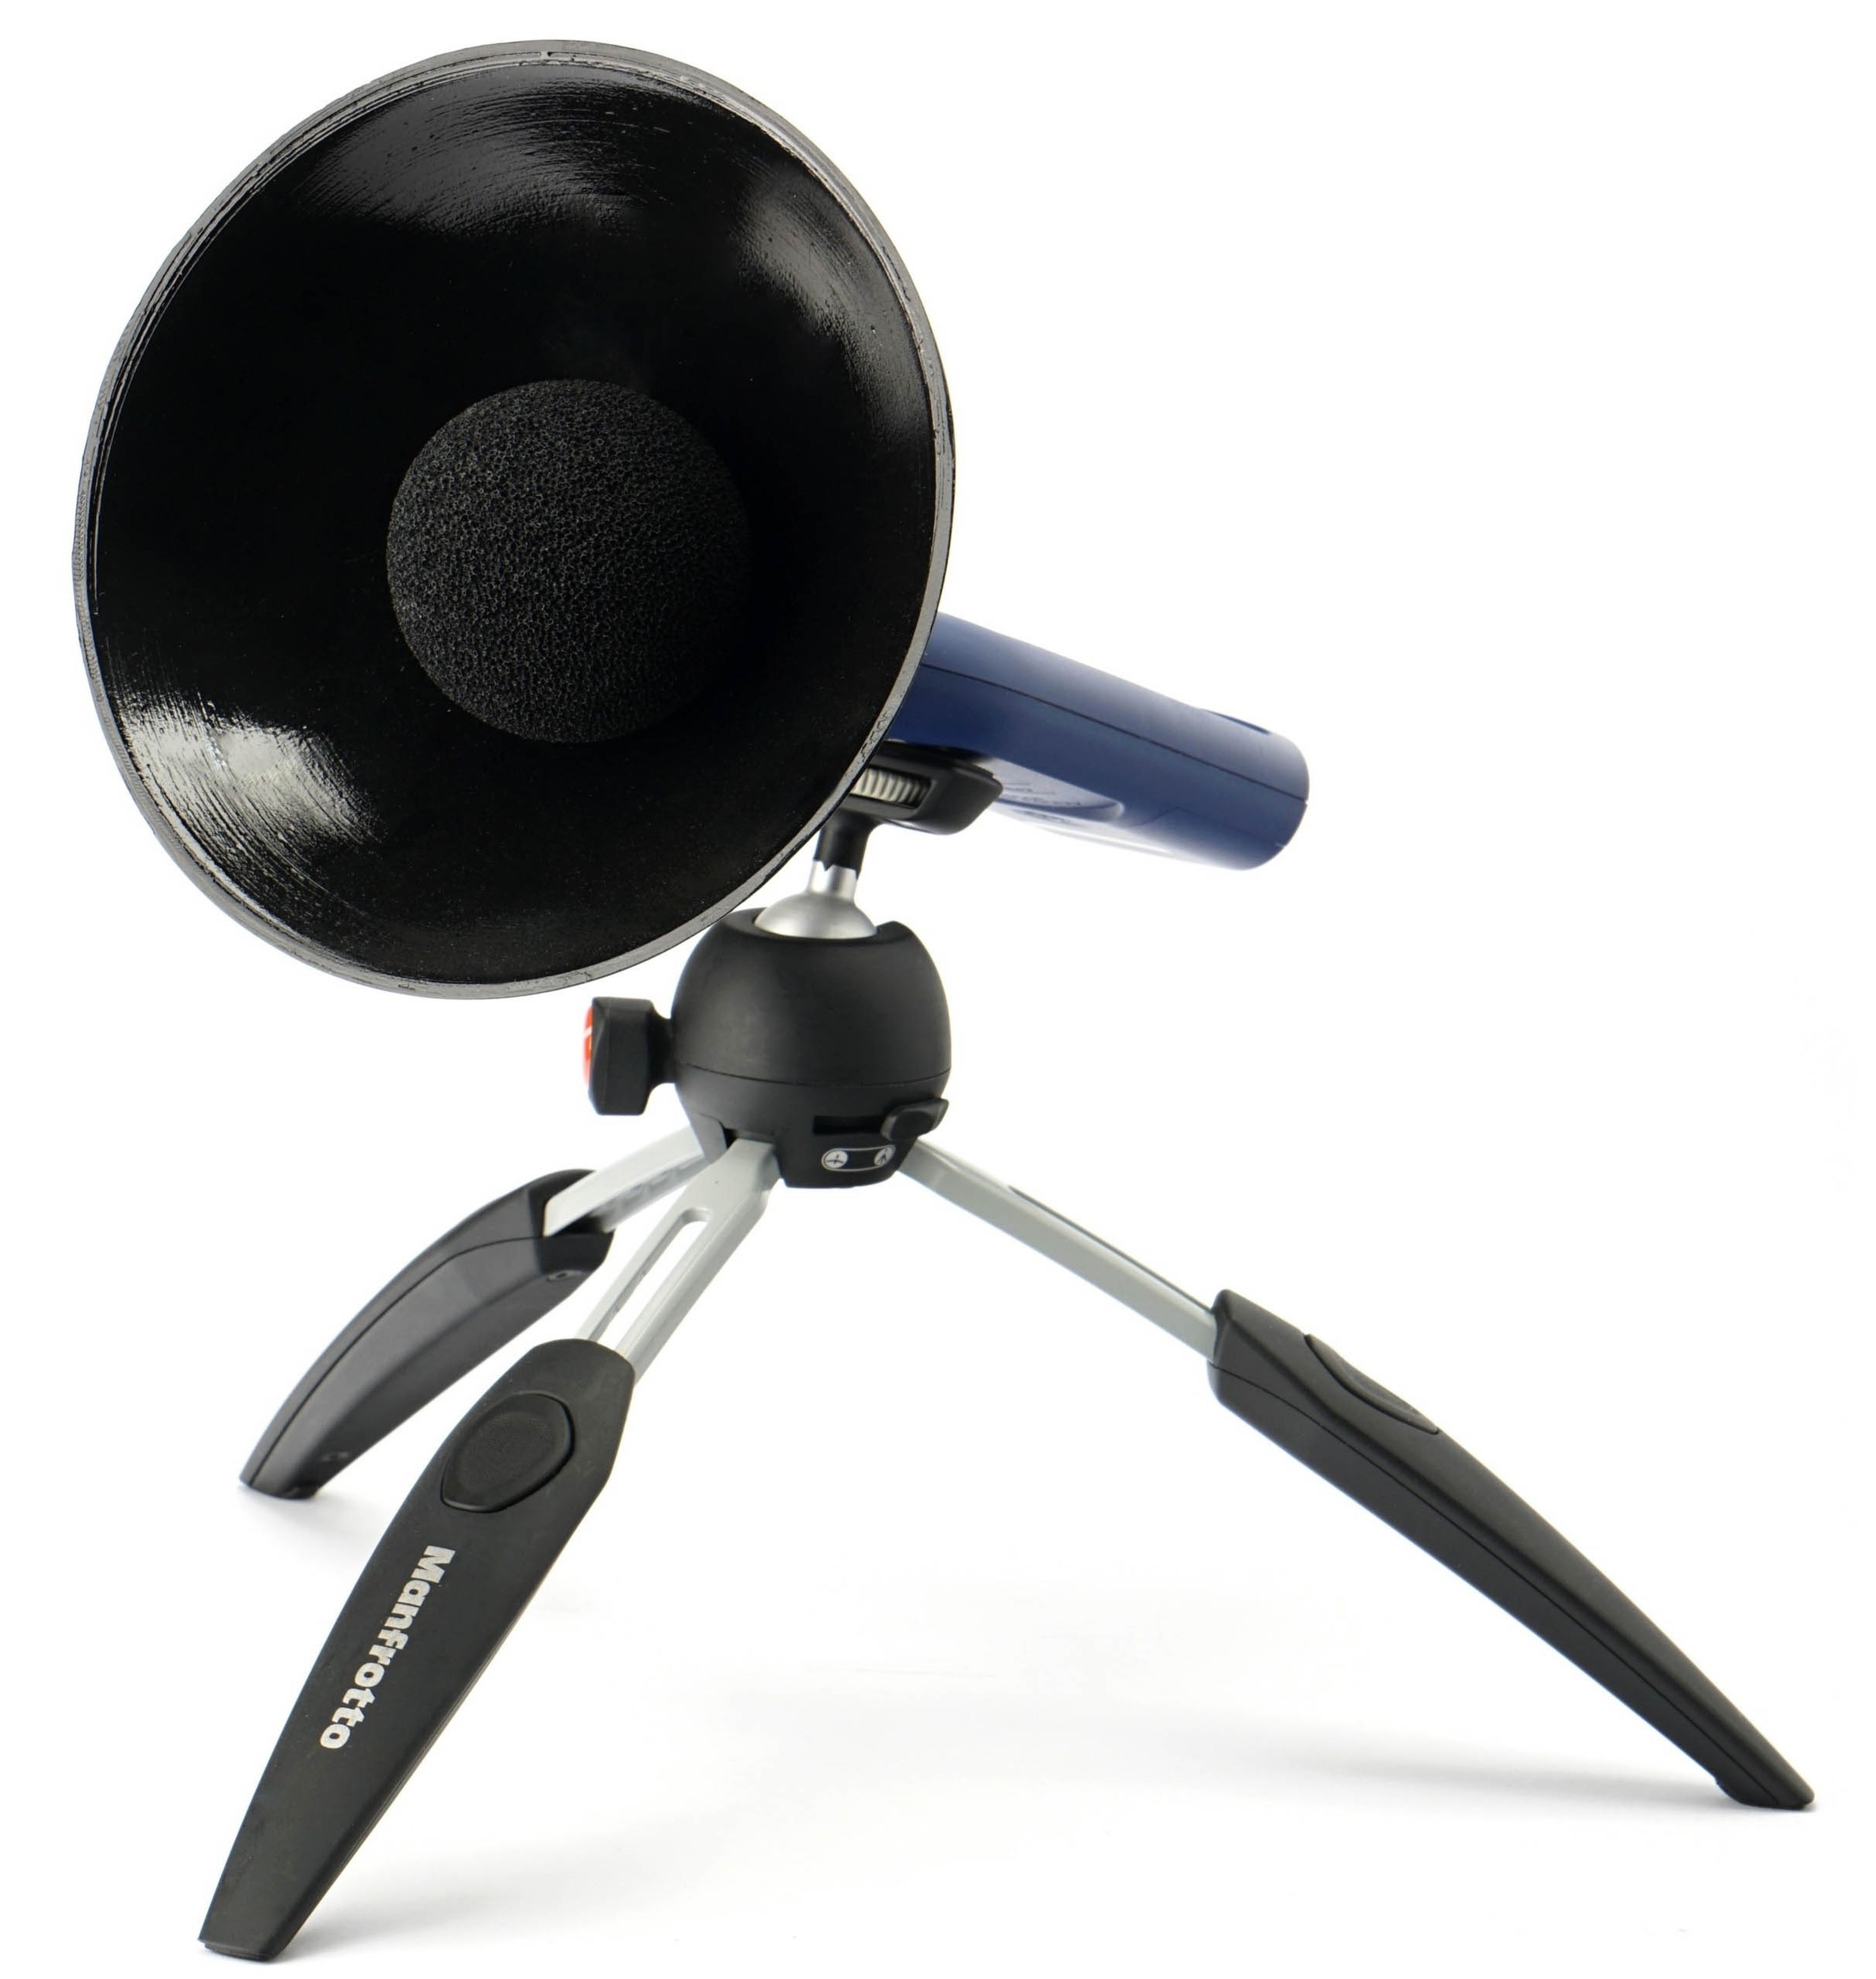
In this part of the methodology description, we will present something about the method of noise measurement. We use a Reed R8080 sound level meter, which we continuously calibrate with a calibrated Voltcraft SLC-100 digital sound level meter. A small addition to the sound level meter is a parabola-shaped collar, which has two functions. Increases the sensitivity to distinguish the sound produced even at very low speeds. It is thus possible to better compare even very quiet cards with the largest possible ratio difference. Otherwise (without this adjustment) it could simply happen that we measured the same noise level across several graphics cards, even though it would actually be a little different. This parabolic shield also makes sense because, from the outer convex side (from the back), it reflects all the parasitic sounds that everyone who really aims for accuracy of the measurements struggles with during the test. These are various cracks of the body or objects in the room during normal human activity.
To ensure the same conditions when measuring the noise level (and later also the sound), we use acoustic panels with a foam surface around the bench-wall. This is so that the sound is always reflected to the sound level meter sensor in the same way, regardless of the current situation of the objects in the test room. These panels are from three sides (top, right and left) and their purpose is to soundproof the space in which we measure the noise of graphics cards. Soundproofing means preventing different reflections of sound and oscillations of waves between flat walls. Don’t confuse it with sound-absorbing, we’ve had that solved well in the test lab for a long time.
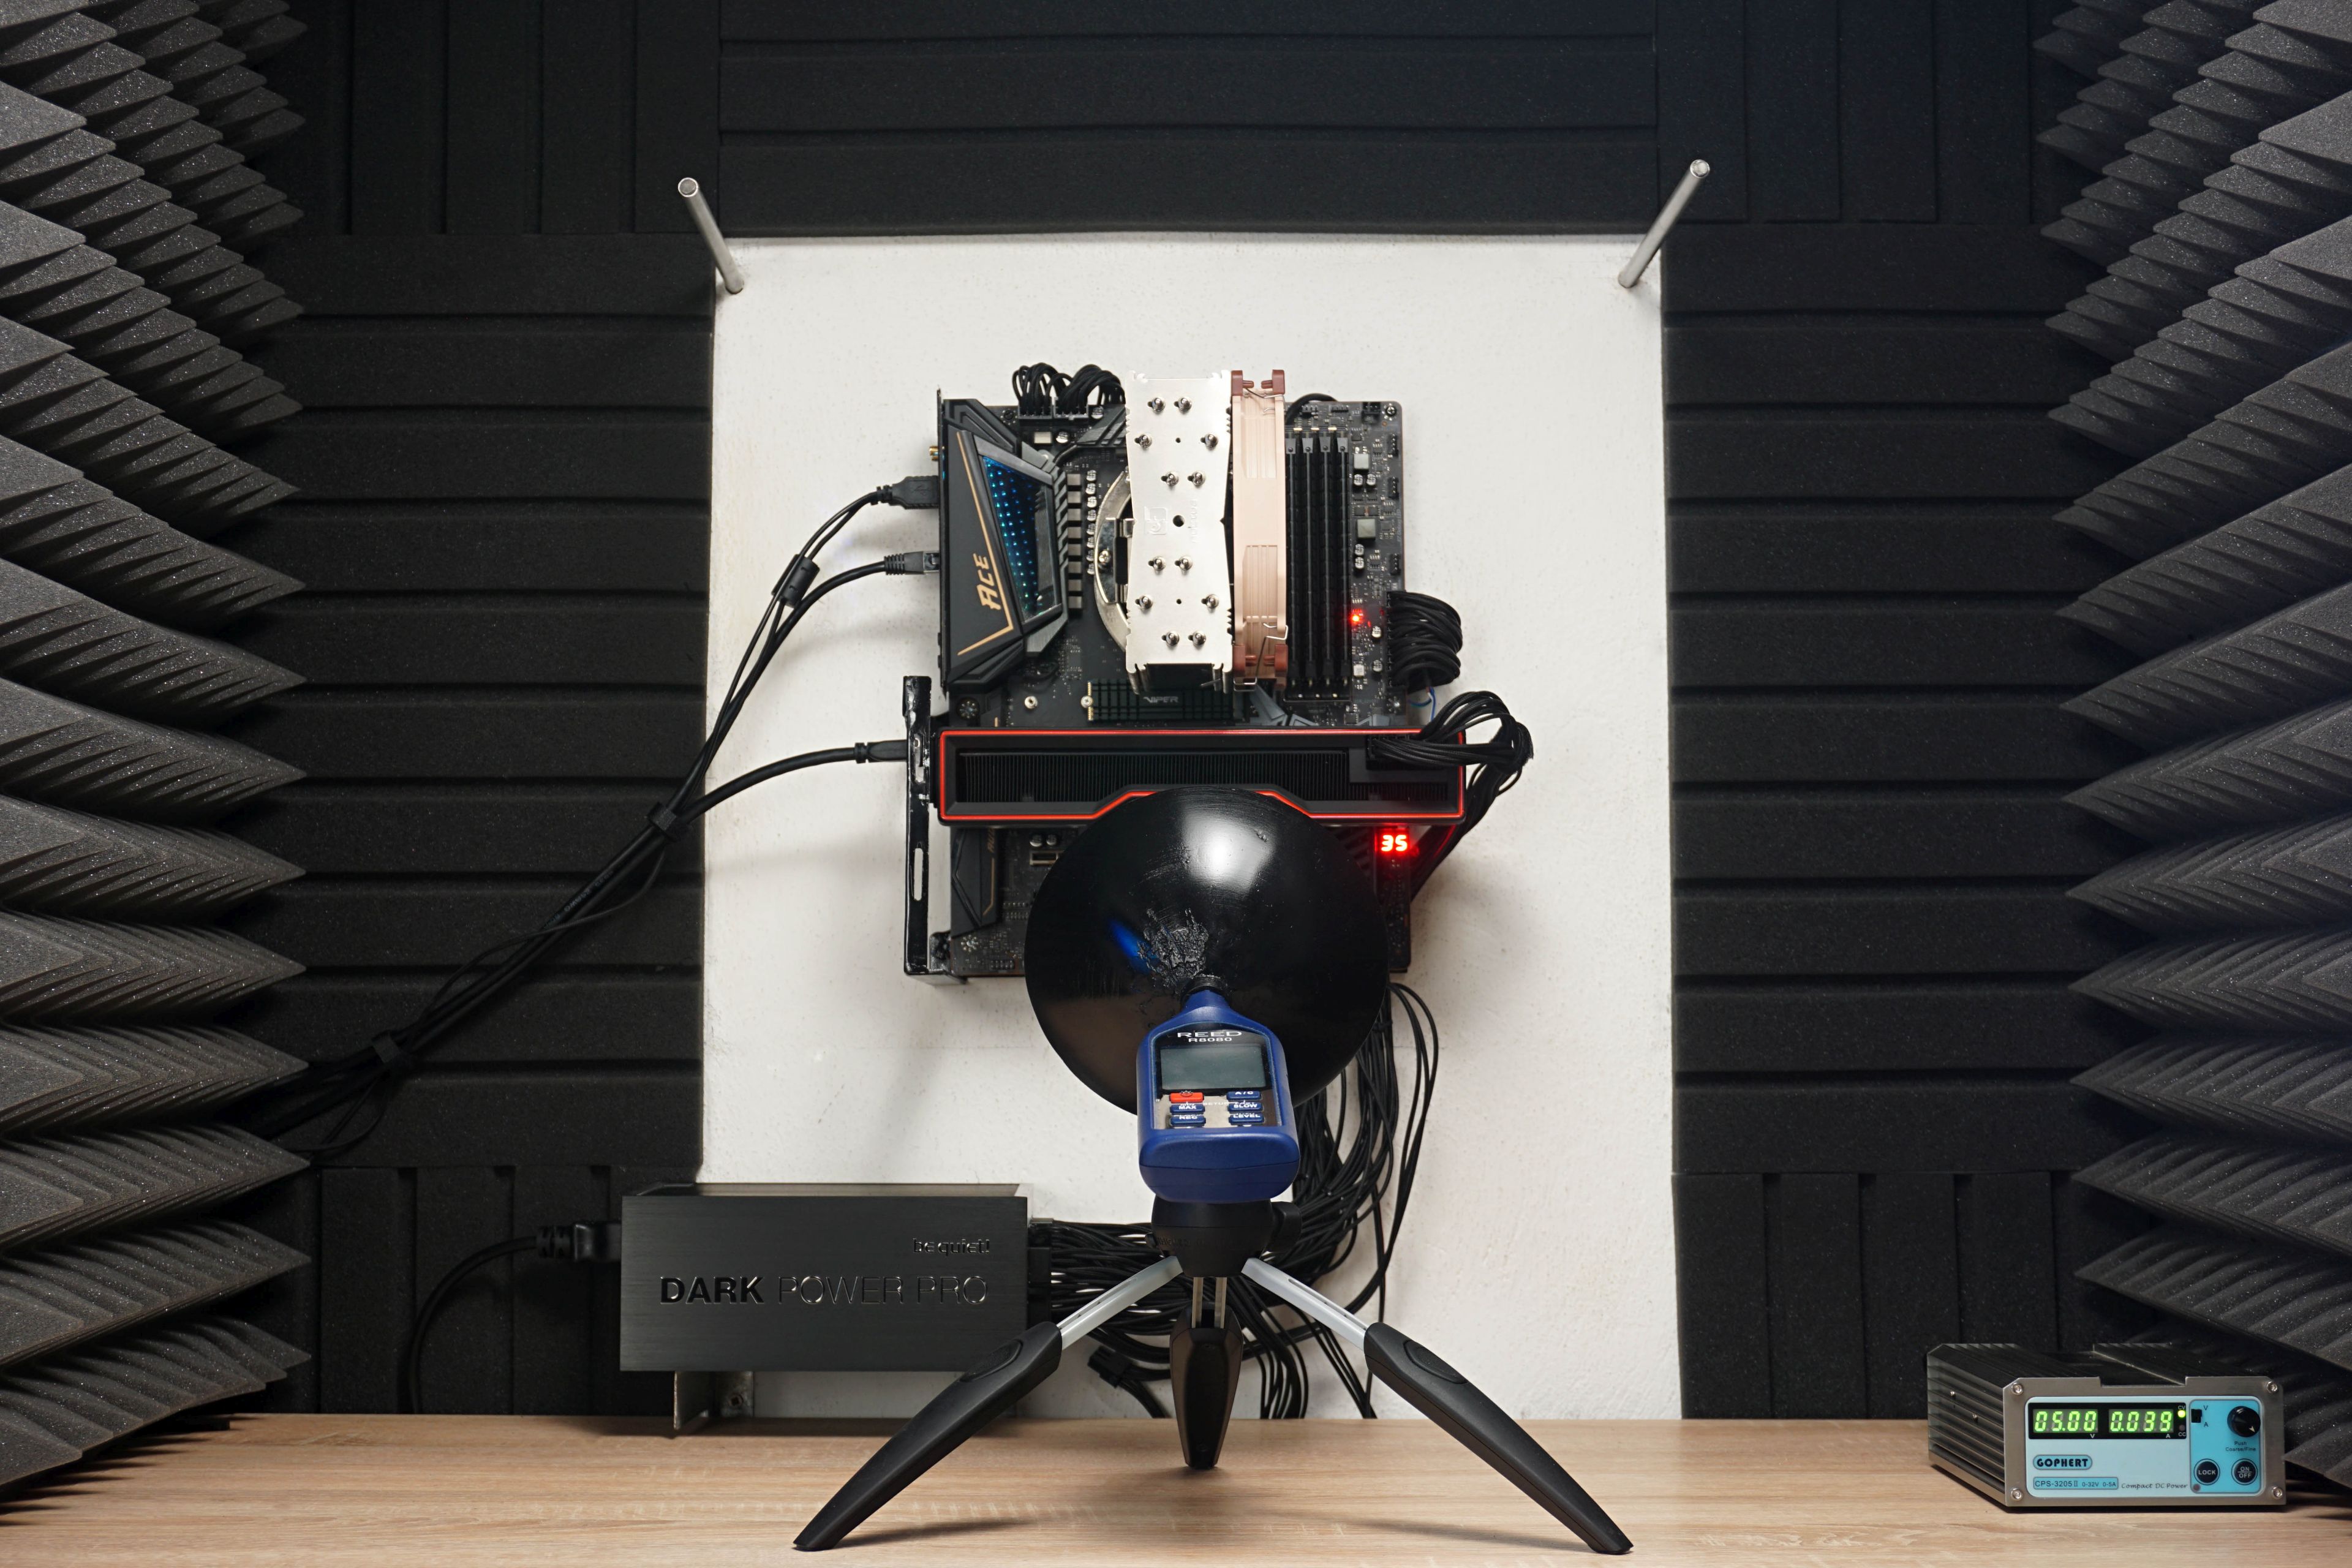
During the measurements, the sound level meter sensor is always placed on a tripod at the same angle and at the same distance (35 cm) from the PCI Express slot in which the graphics card is installed. Of course, it’s always closer to the card itself, depending on its depth. The indicated reference point and the sensor angles are fixed. In addition to the “aerodynamic noise” of the coolers, we also measure the noise level of whining coils. Then we stop the fans for a moment. And for the sake of completeness, it should be added that during sound measurements, we also switch off the power supply fan as well as the CPU cooler fan. Thus, purely the graphics card is always measured without any distortion by other components.
… and the frequency response of the sound
From the same place, we also measure the frequency of the sound produced. One thing is the noise level (or sound pressure level in decibels) and the other thing is its frequency response.
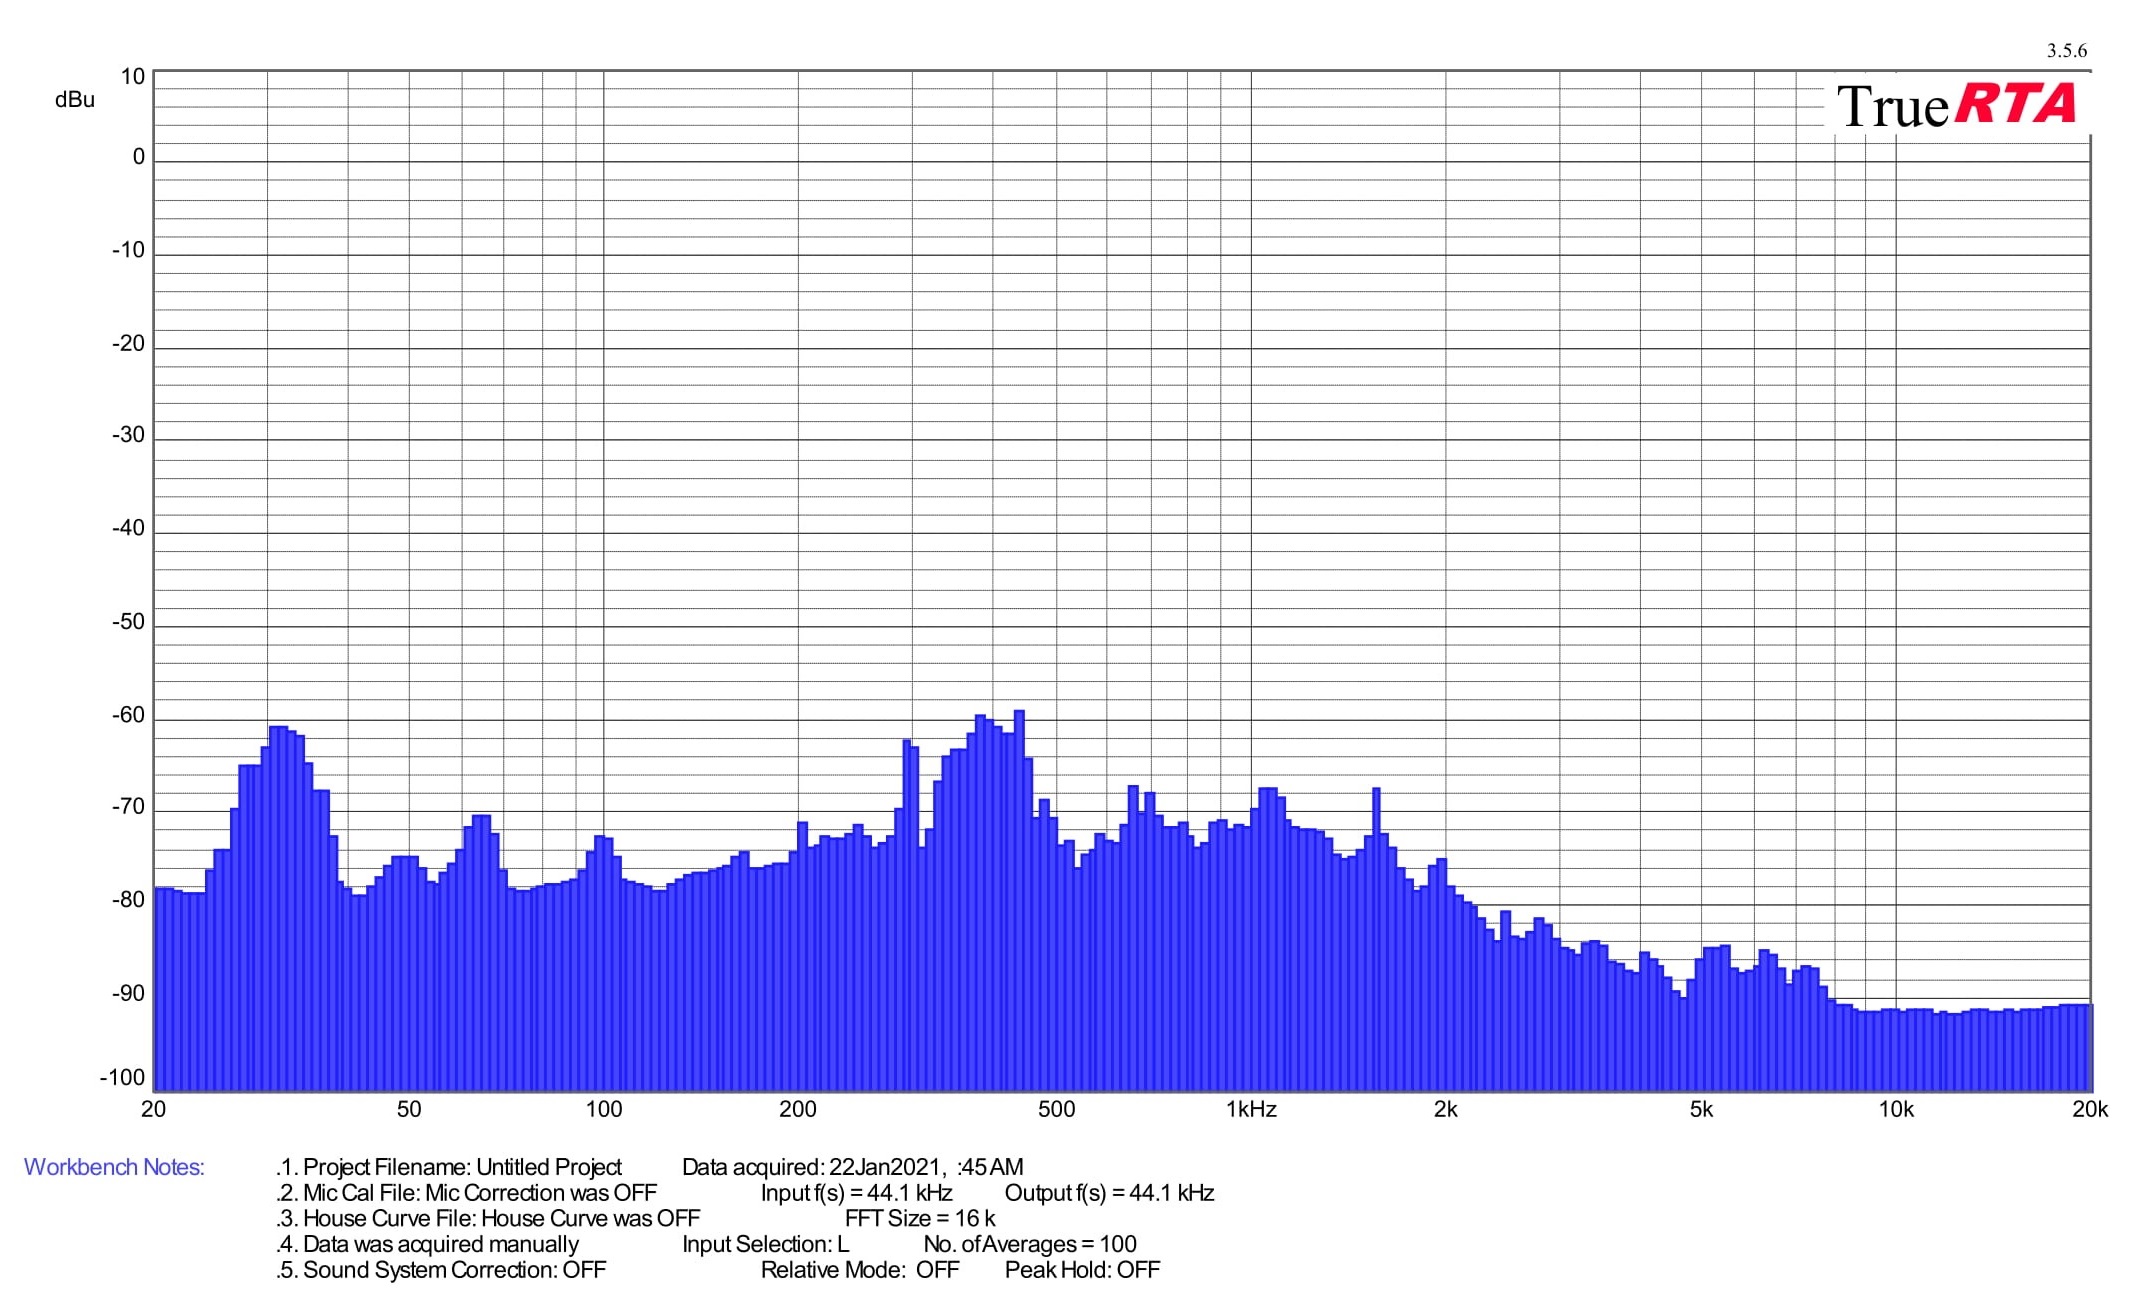
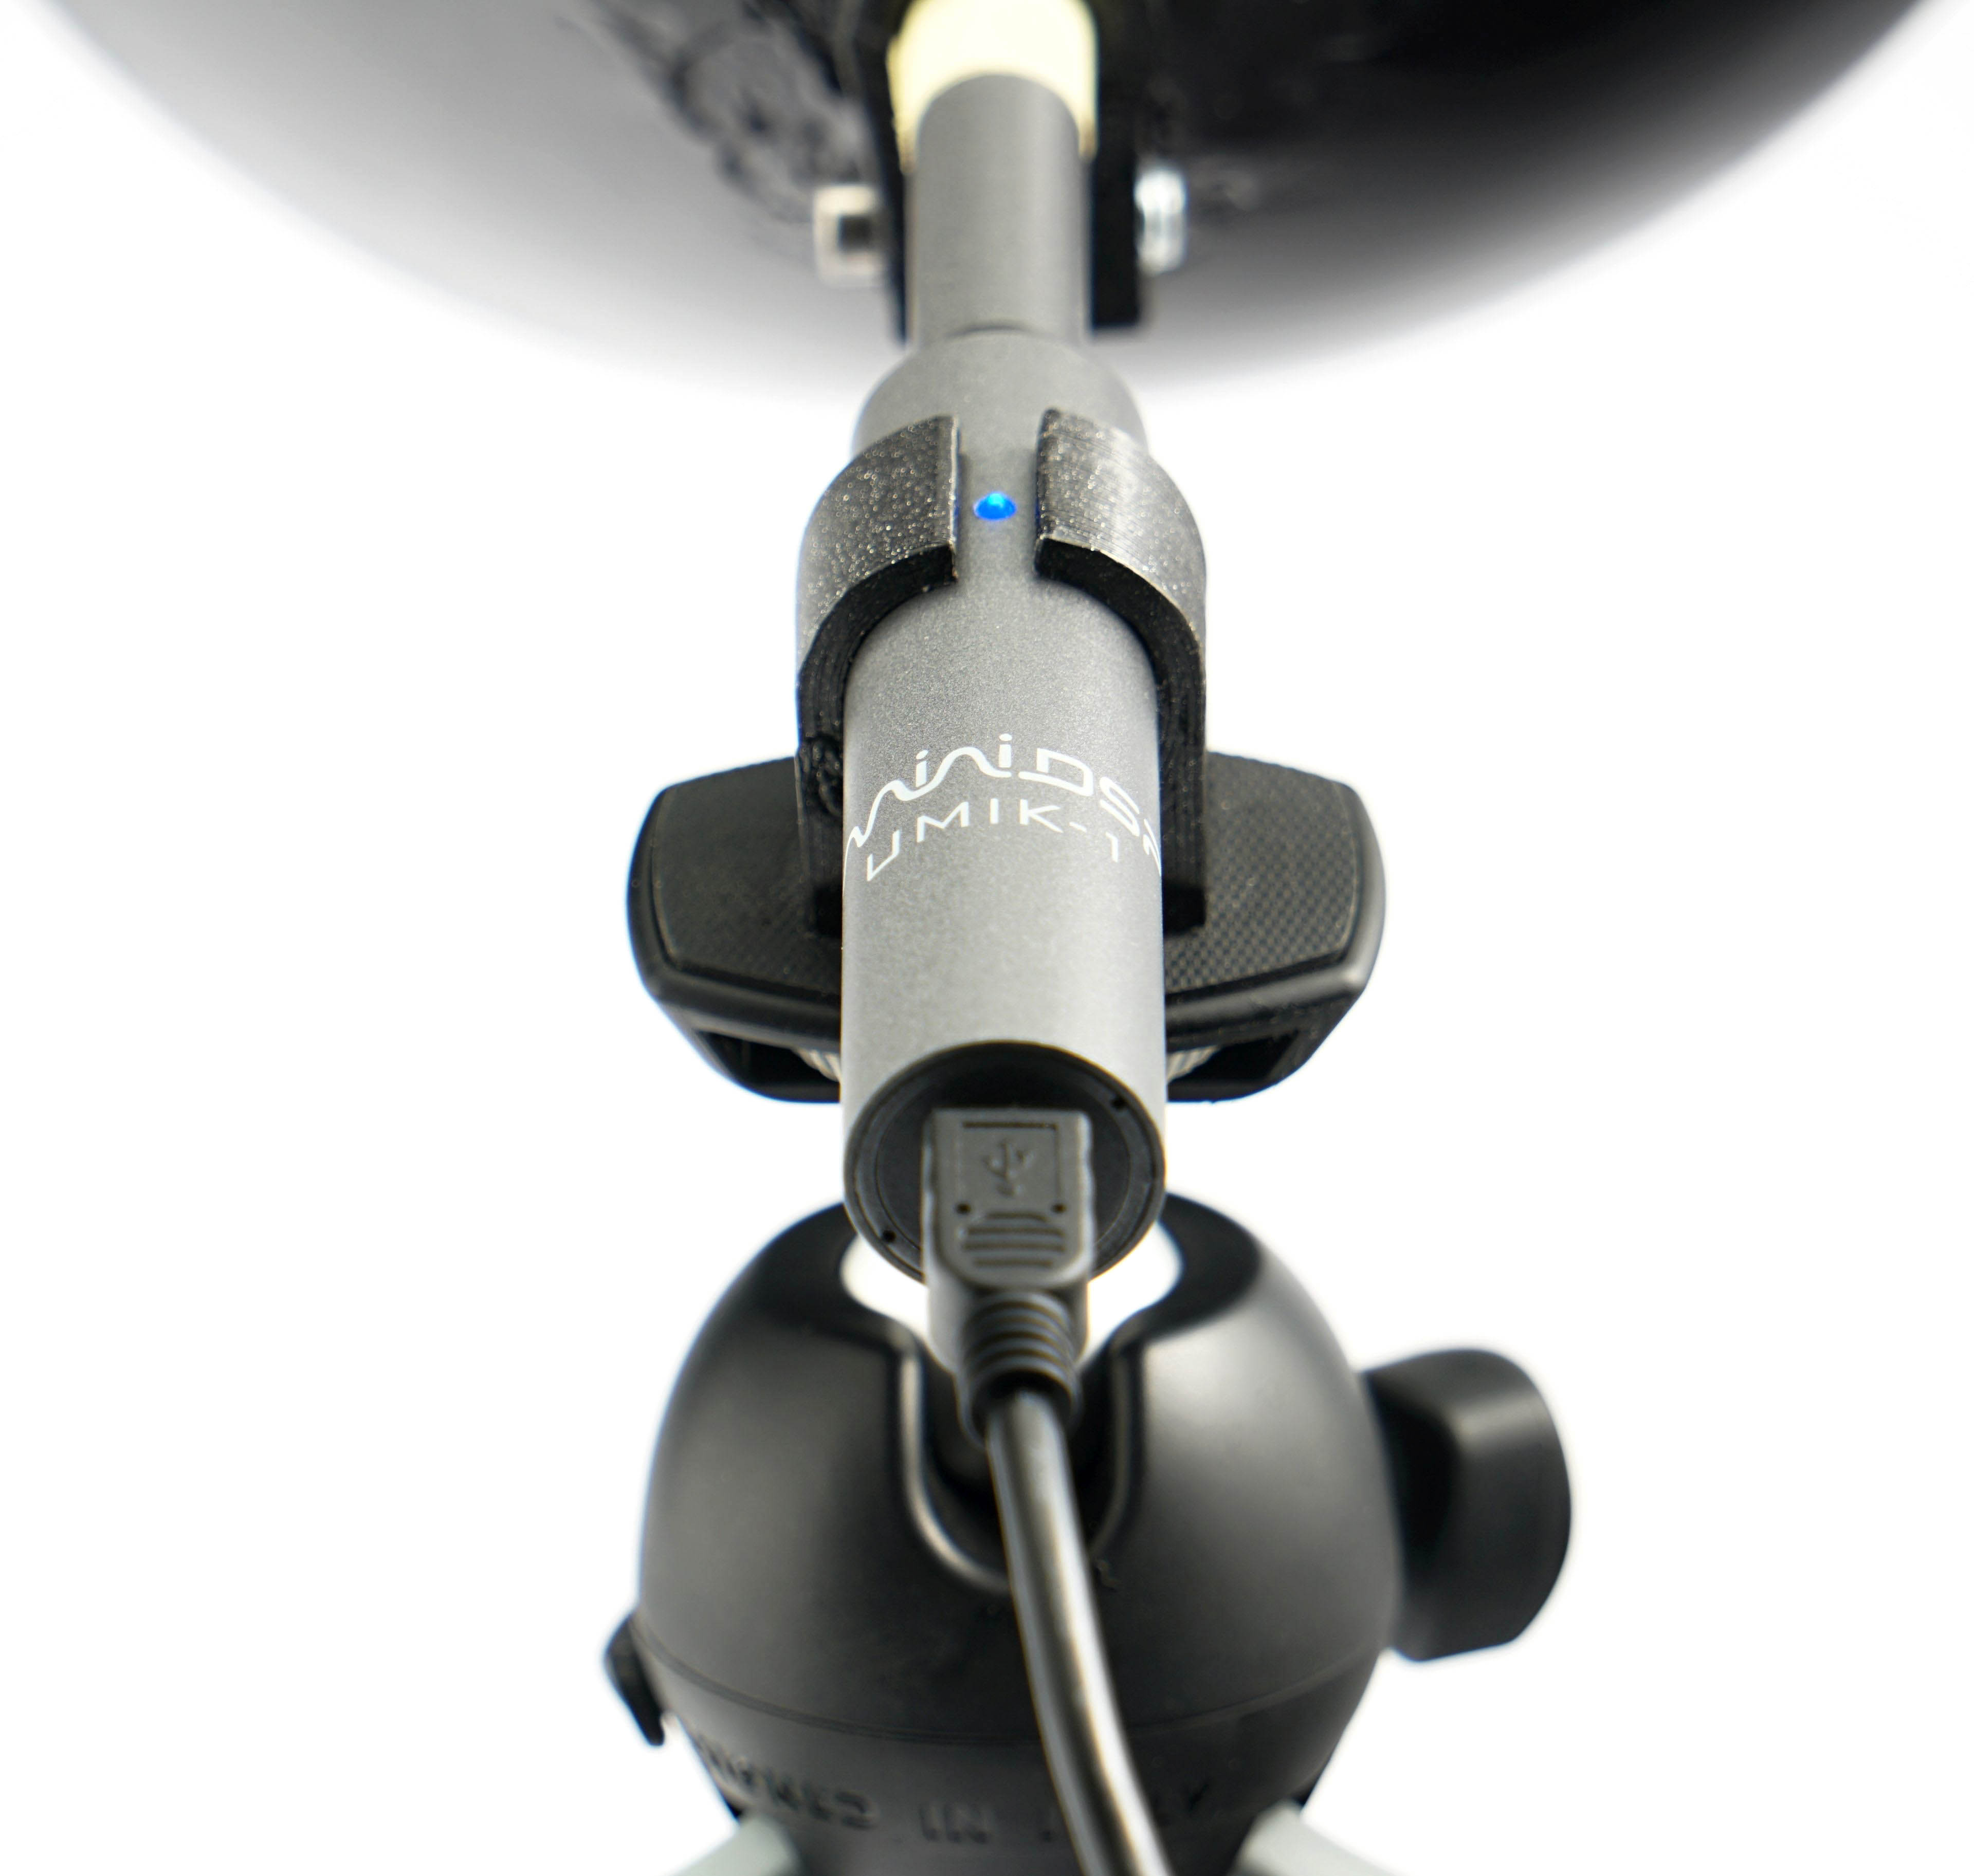
According to the data on the noise level, you can quickly find out whether the graphics card is quieter or noisier, or where it is on the scale, but it is still a mix of different frequencies. Thus, it does not say whether the sound produced is more booming (with a lower frequency) or squeaking (with a high frequency). The same 35 dBA can be pleasant but also unpleasant for you under certain circumstances – it depends on each individual how they perceive different frequencies. For this reason, we will also measure the frequency response of the sound graphics card in addition to the noise level, via the TrueRTA application. The results will be interpreted in the form of a spectrograph with a resolution of 1/24 octave and for better comparison with other graphics cards we will include the dominant frequency of lower (20–200 Hz), medium (201–2,000 Hz) and higher (2,001–20,000 Hz) sound spectrum into standard bar graphs. For measurements, we’re using a calibrated miniDSP UMIK-1 microphone, which accurately copies the position of the sound level meter, but also has a collar, even with the same focal length.
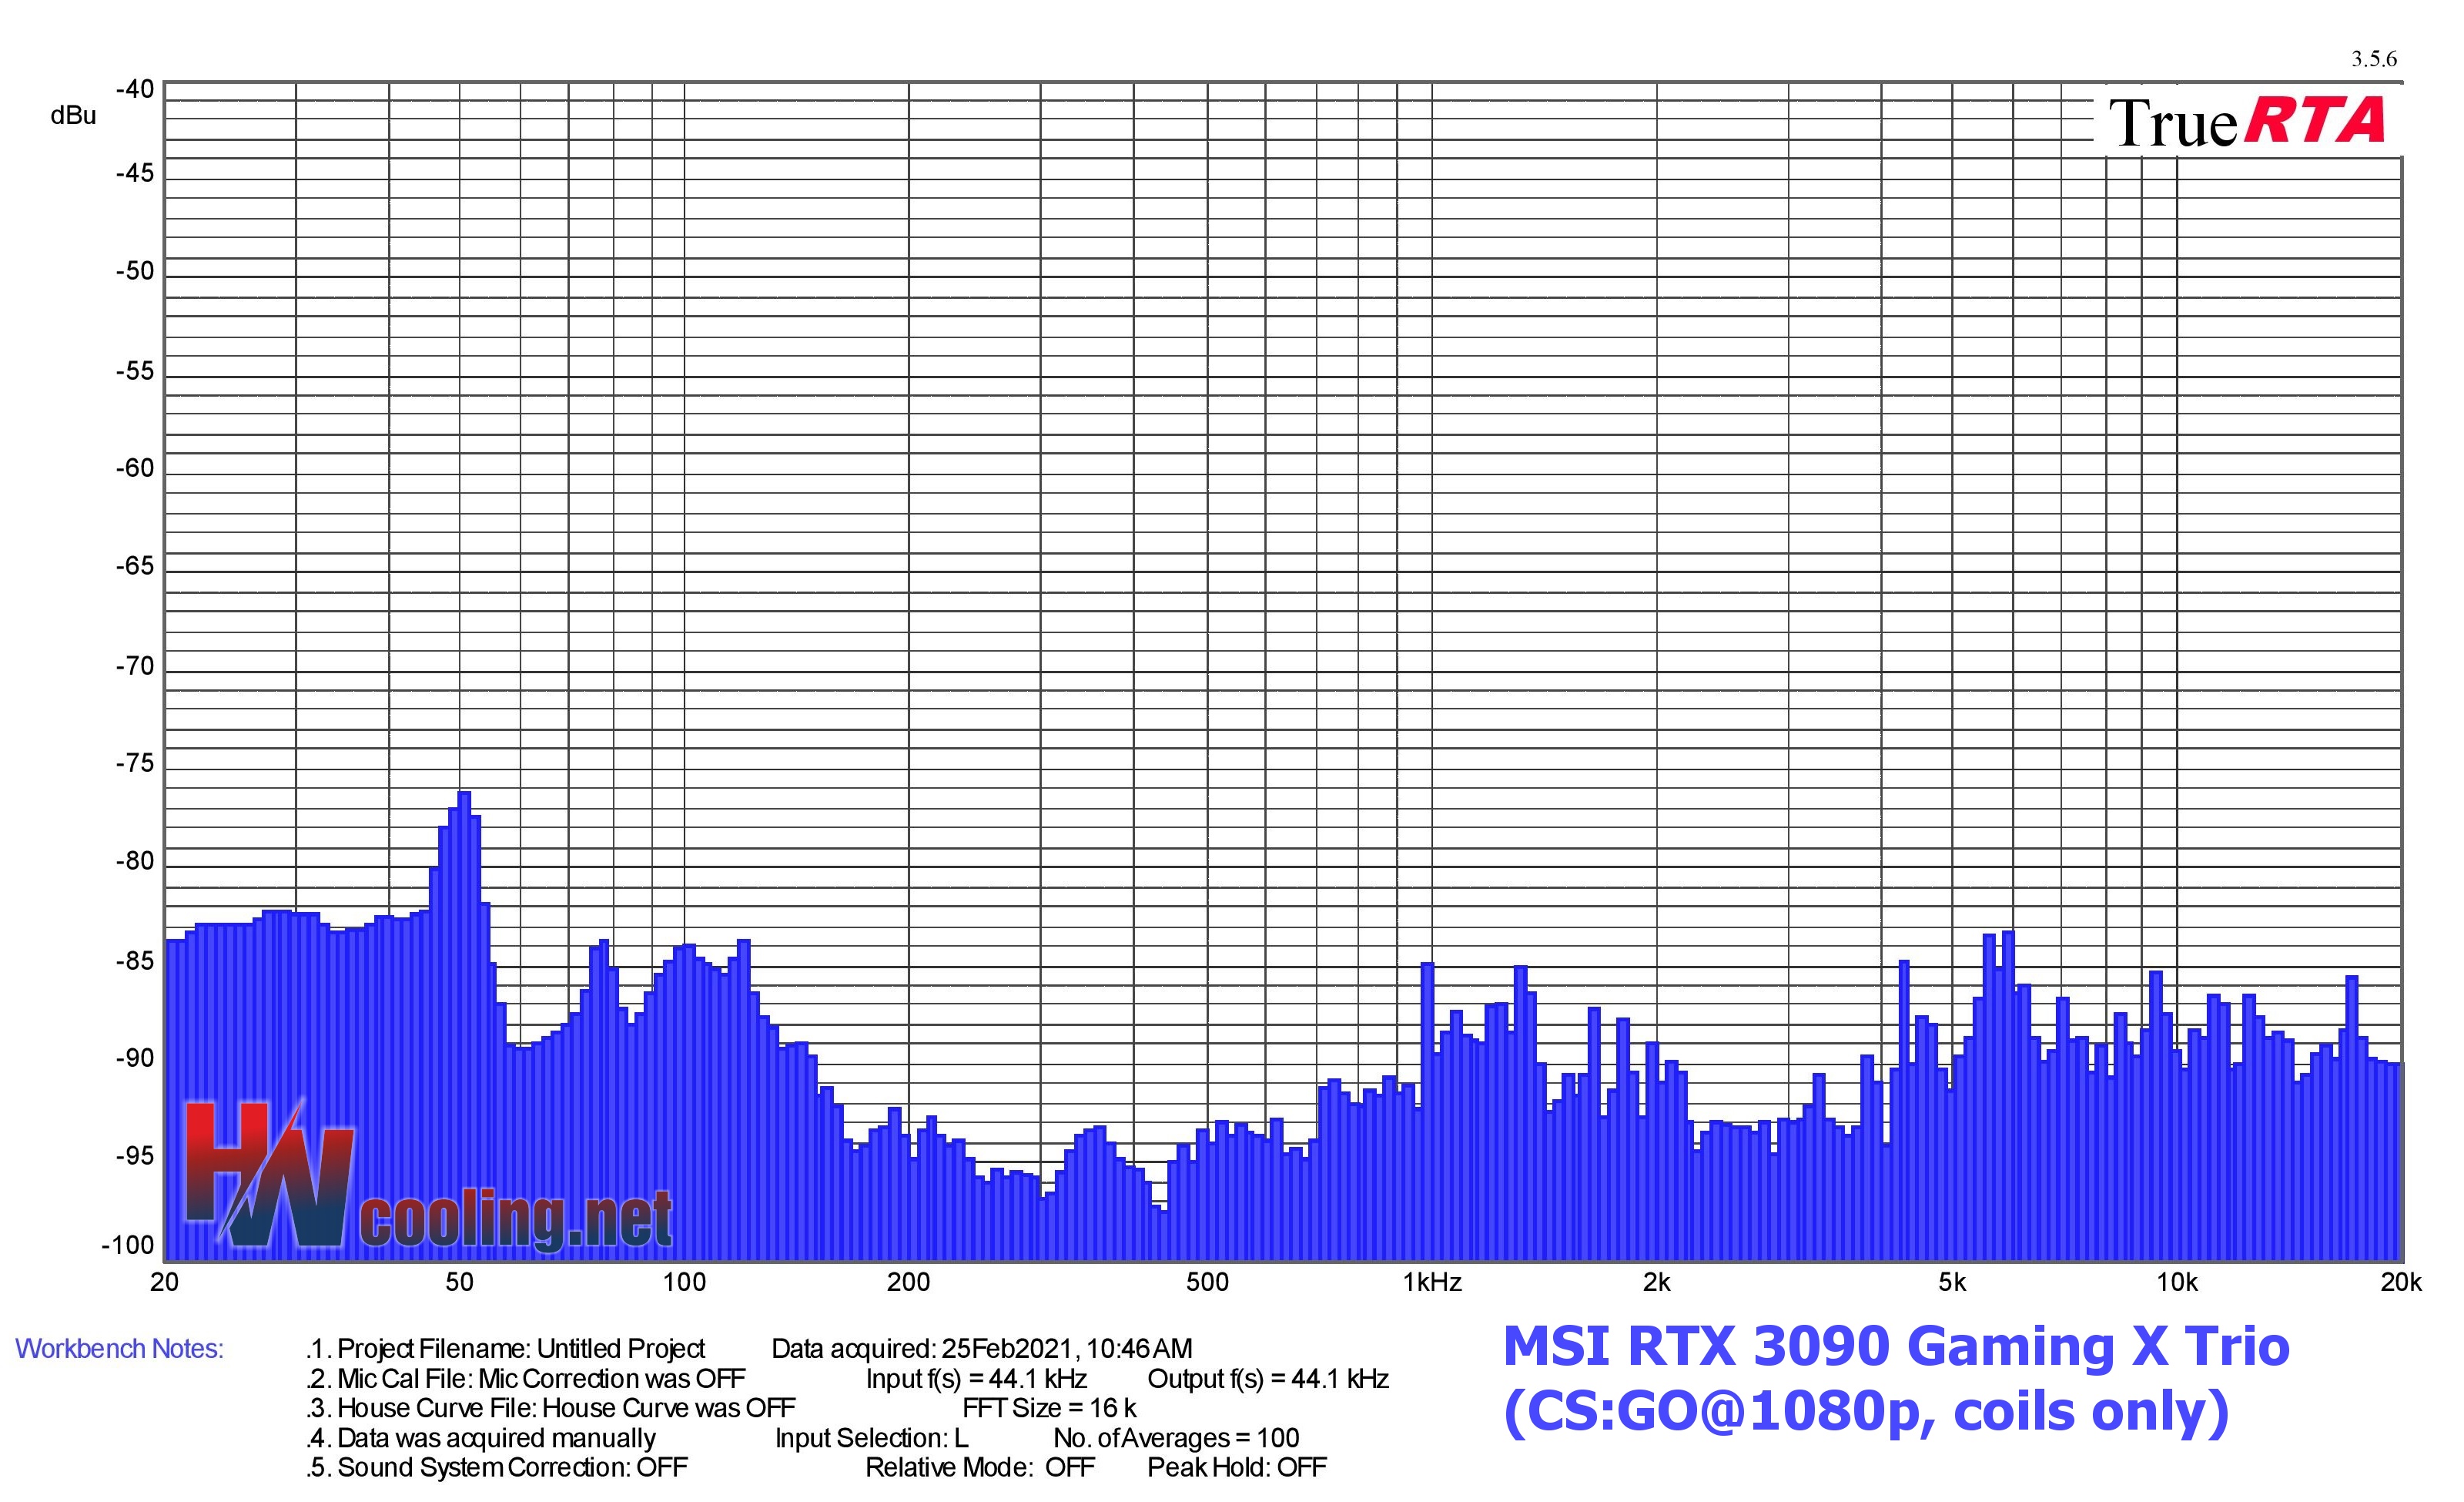
At the end of this chapter, it should be noted that measurements of noise and frequency response of sound will be performed on most cards only in load tests, as out of load and at lower load (including video decoding) operation is usually passive with fans turned off. On the other hand, we must also be prepared for exceptions with active operation in idle or graphics cards with dual BIOS setup, from which the more powerful one never turns off the fans and they run at least at minimum speed. Finally, as with measuring the noise level in one of the tests, we also record the frequency response of whining coils. But don’t expect any dramatic differences here. It will usually be one frequency, and the goal is rather to detect any potential anomalies. The sound of the whining coils is of course variable, depending on the scene, but we always measure in the same scene (in CS:GO@1080p).
No compromises in performance! If this is your motto, then you cannot miss the test of the graphics card GeForce RTX 3090. It will also feed 4K resolution, has the fastest ray tracing and OptiX acceleration, huge video memory and, the review sample from MSI also has many more attractive features. The biggest drawback, as is usual with high-end hardware, is the price. It is really high.
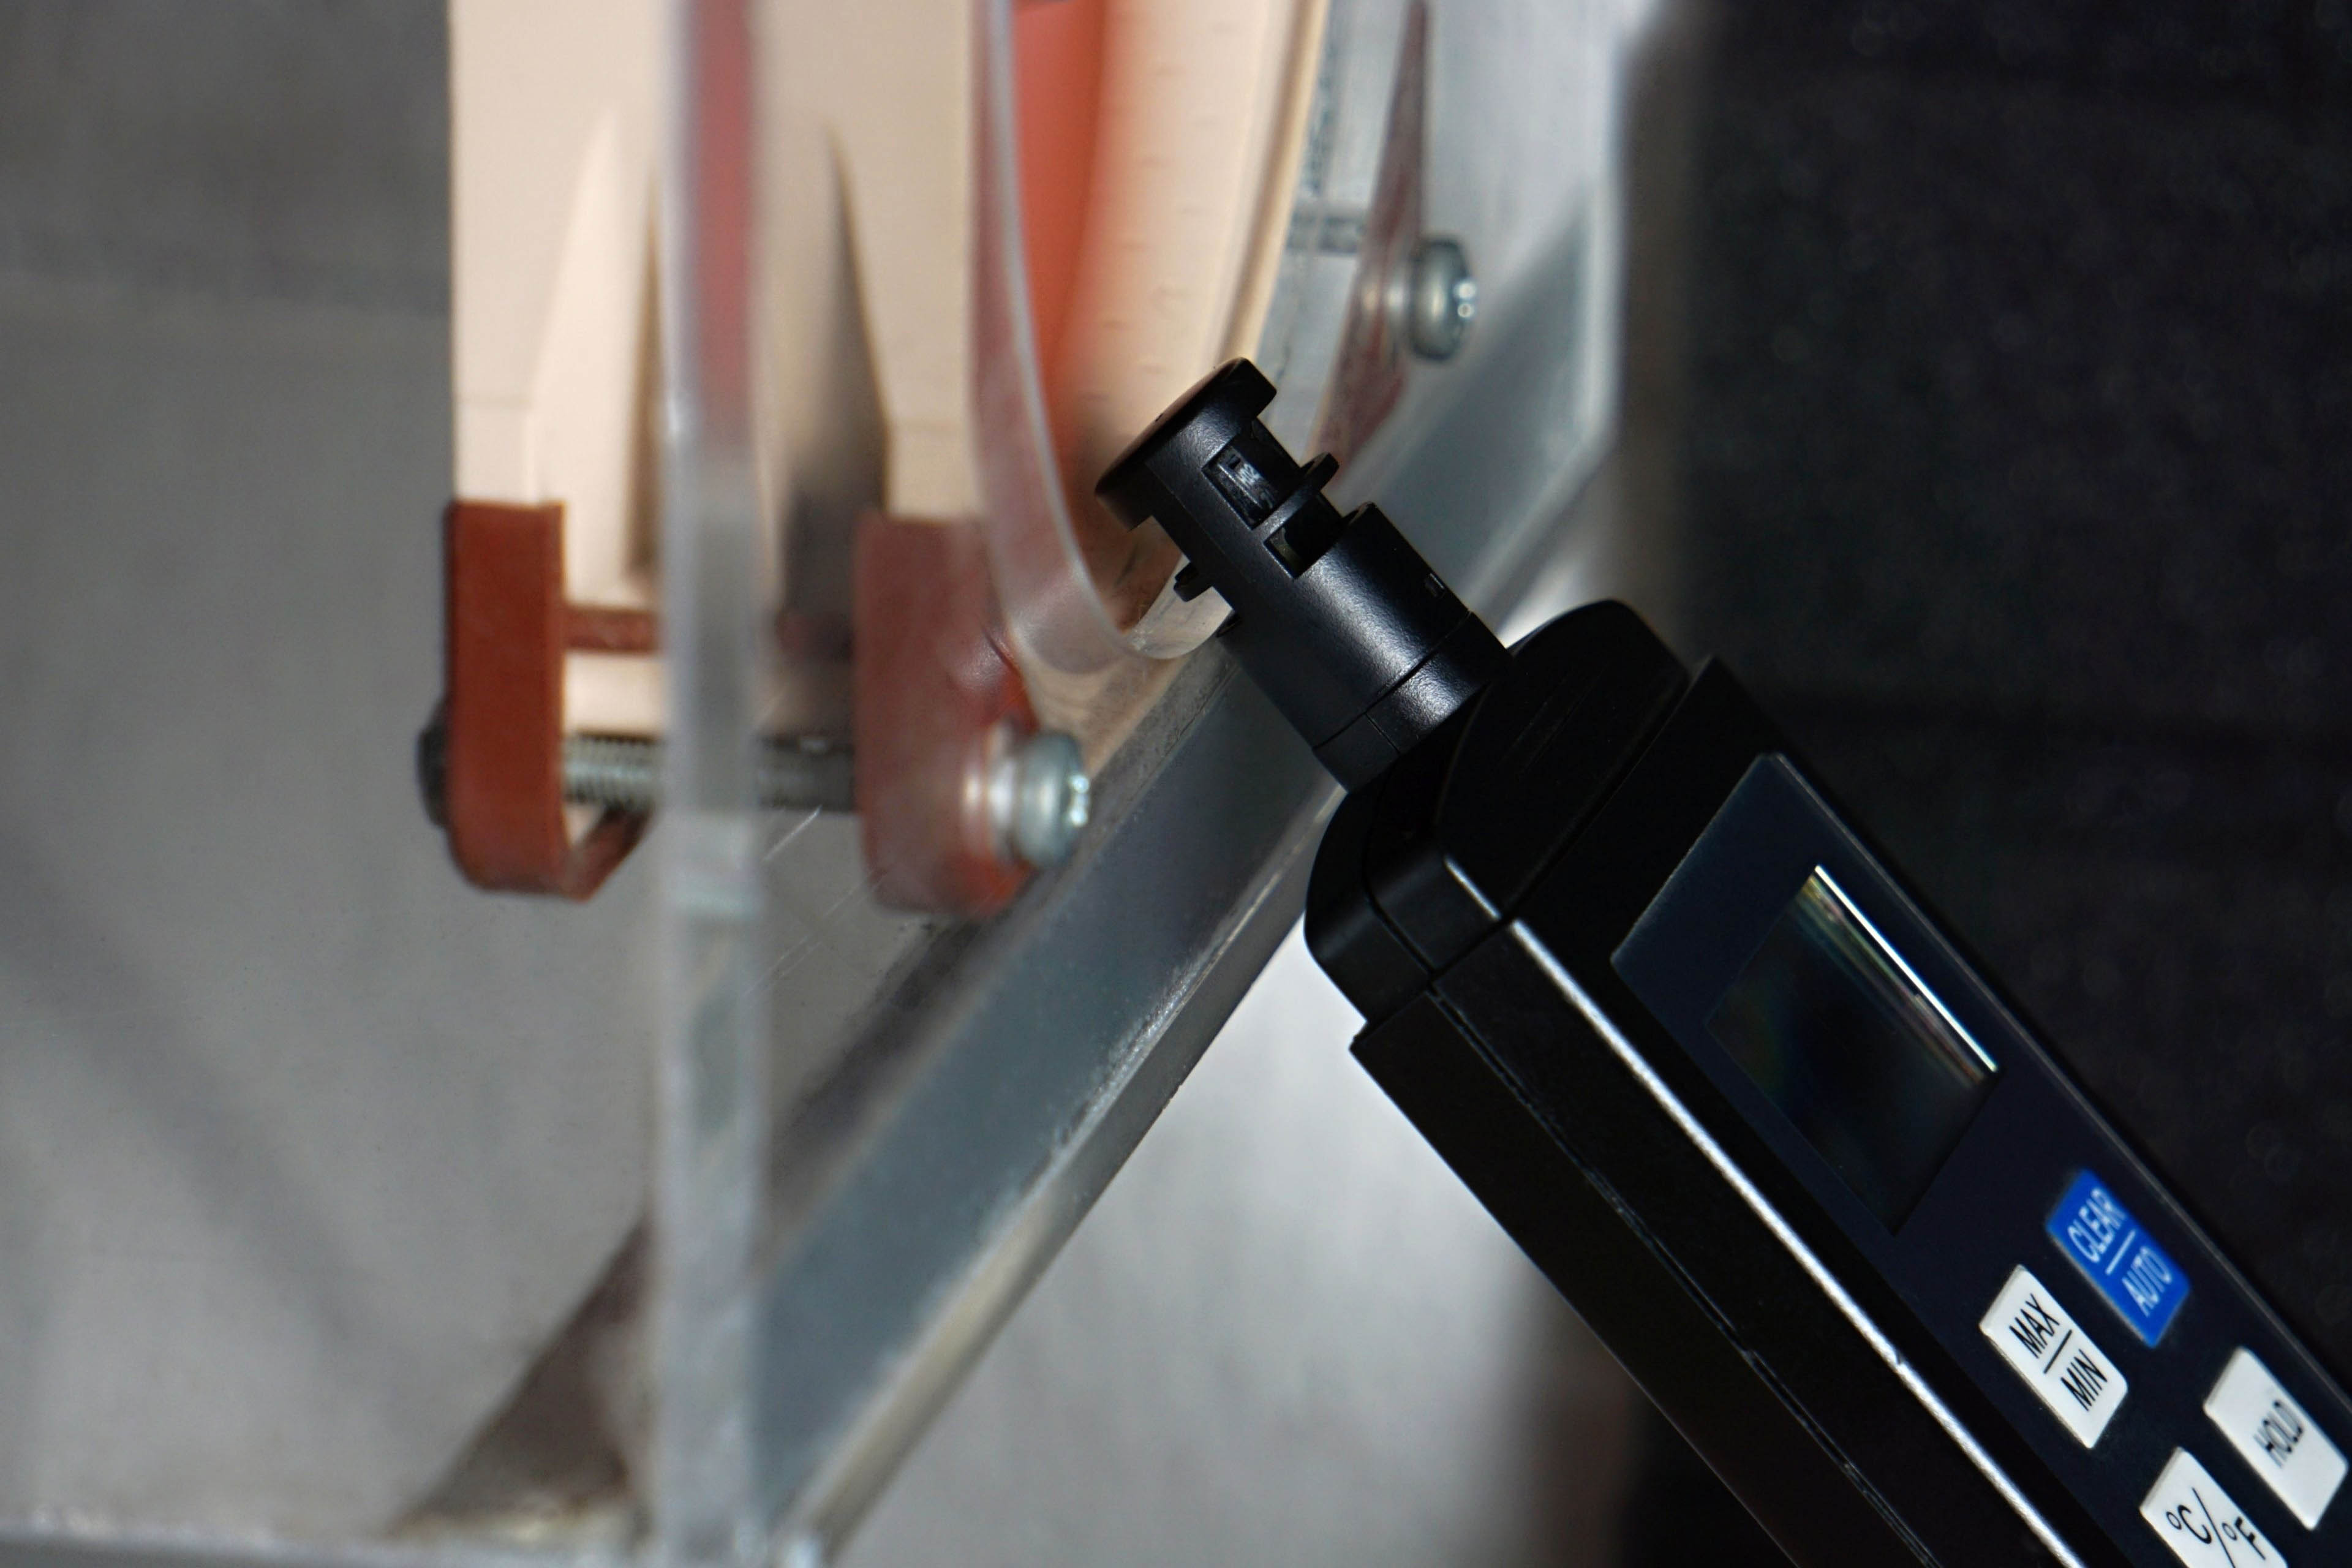
Methodology: temperature tests
We’re also bringing you heat tests. You are at HWCooling after all. However, in order to make it sensible at all to monitor temperatures on critical components not only of the graphics card, but anything in the computer, it is important to simulate a real computer case environment with healthy air circulation. The overall behavior of the graphics card as such then follows from this. In many cases, an open bench-table is inappropriate and results can be distorted. Therefore, during all, not only heat tests, but also measurement of consumption or course of graphics core frequencies, we use a wind tunnel with equilibrium flow.
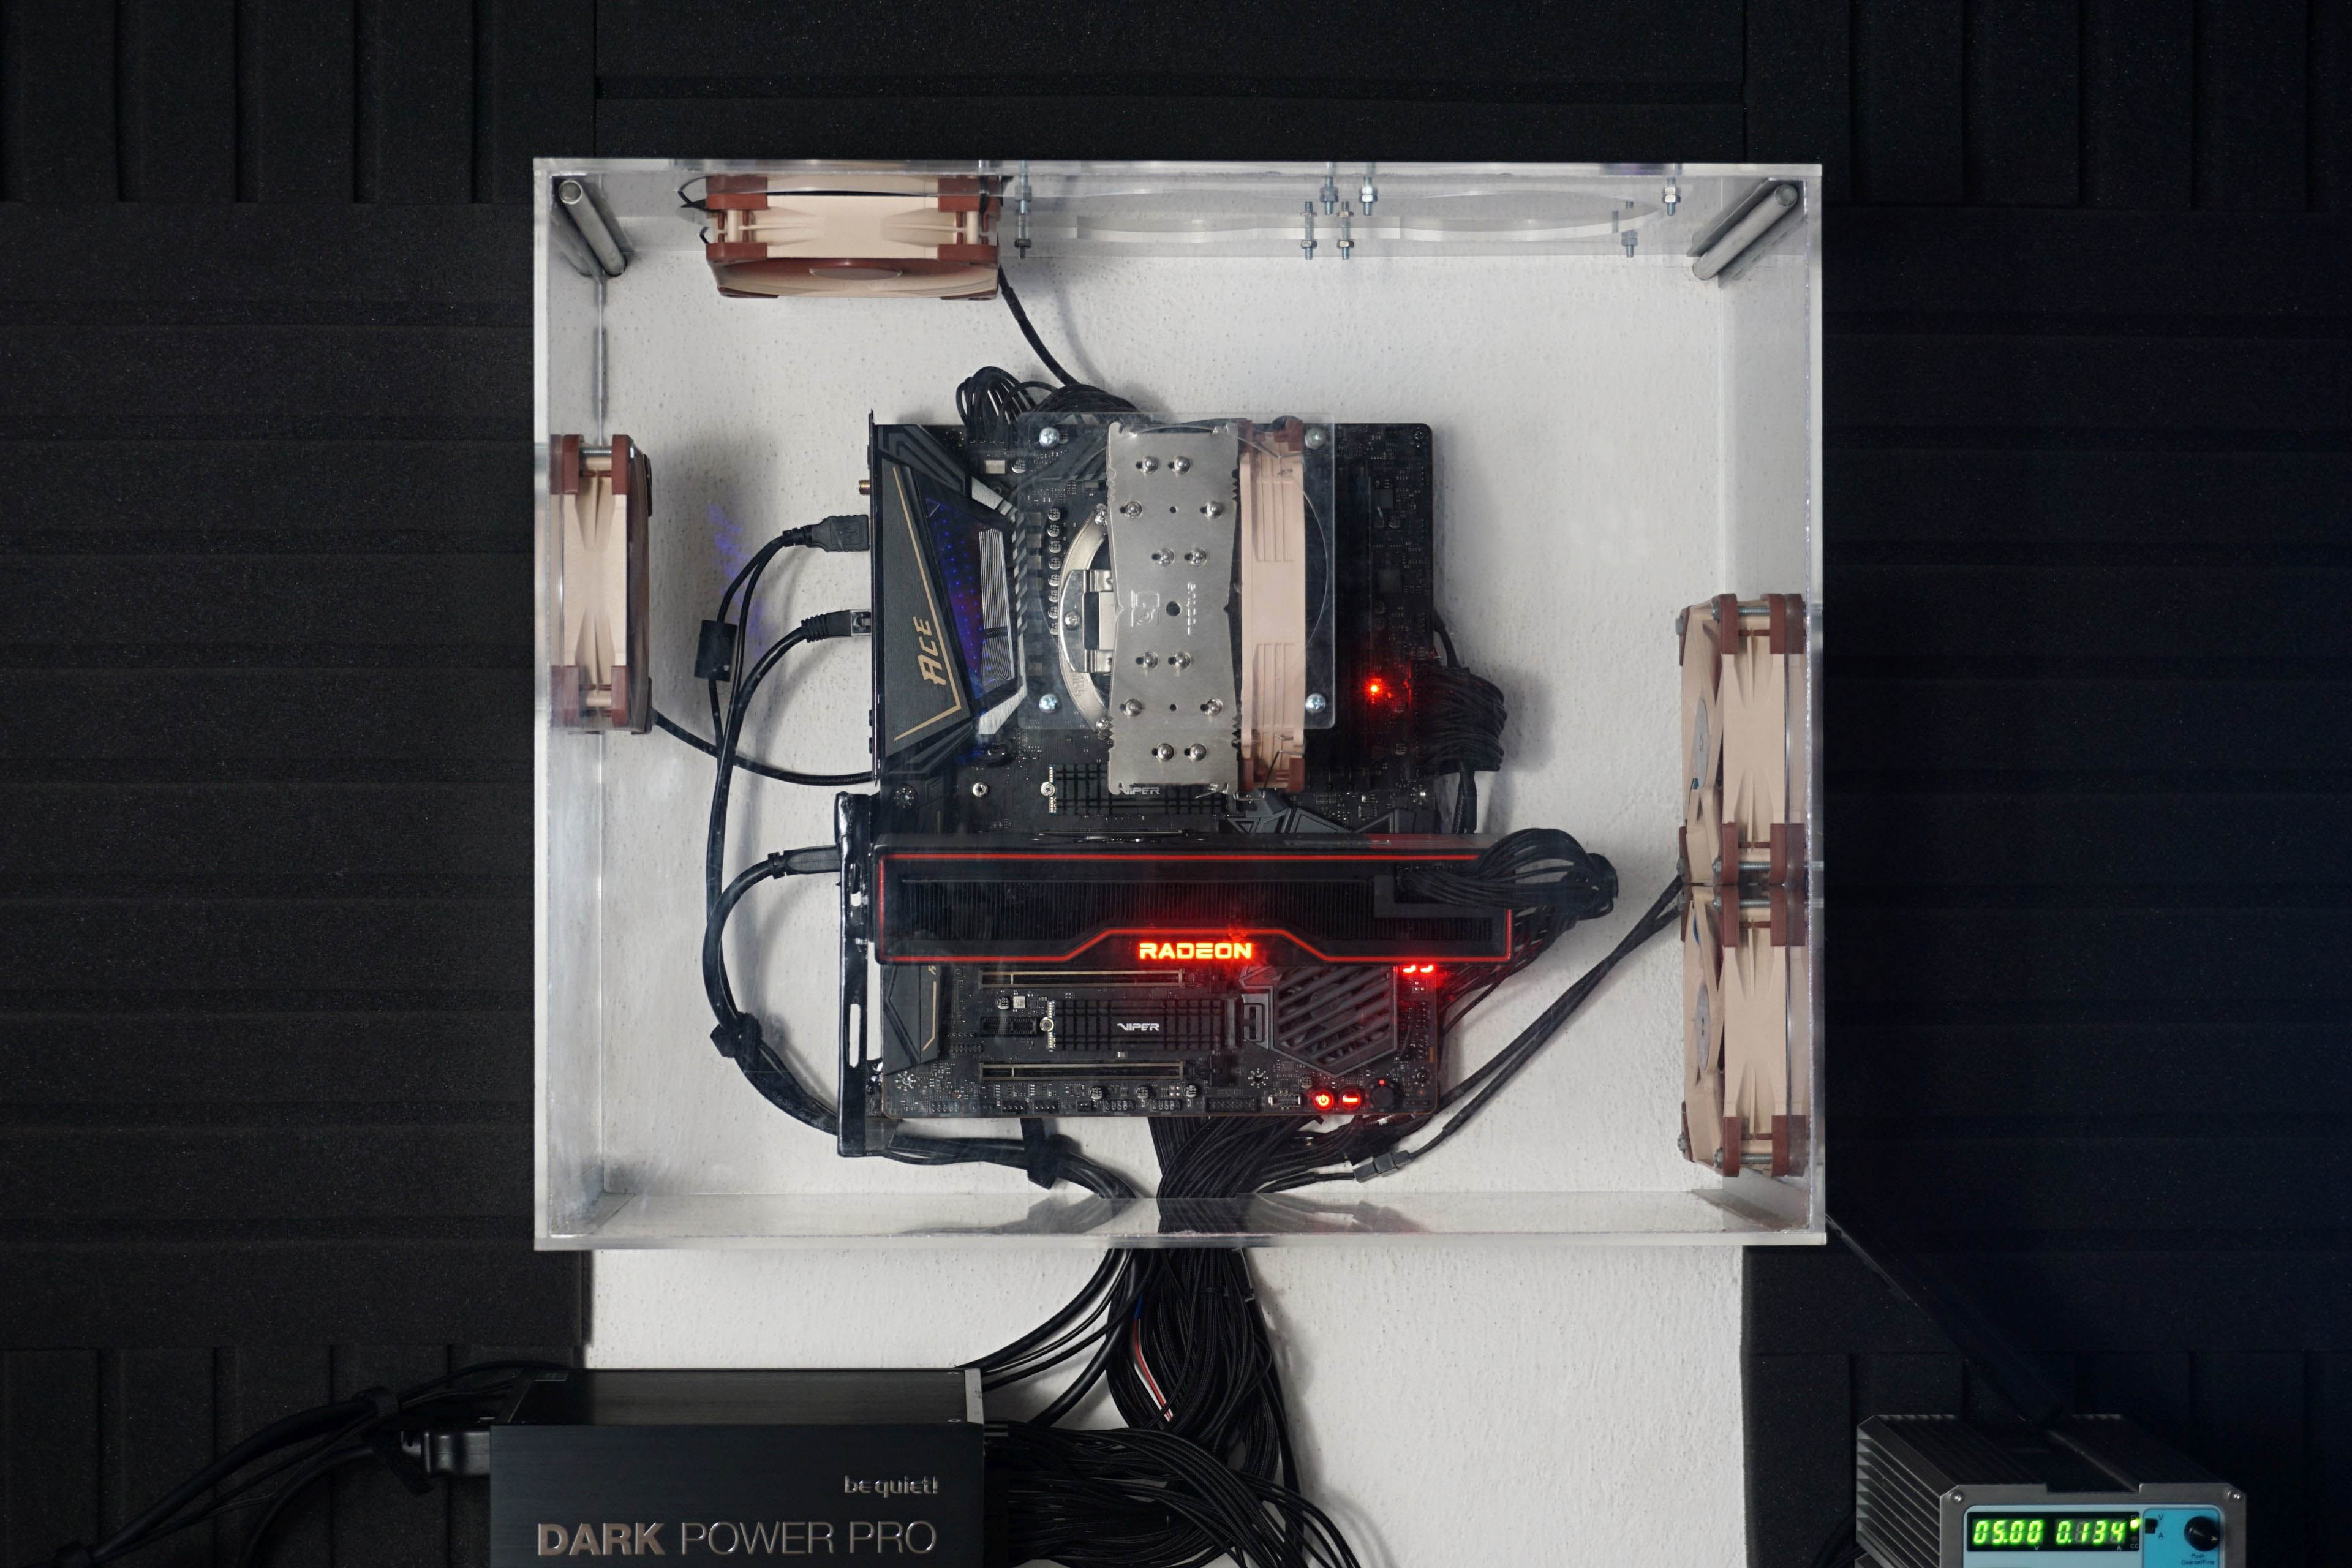
Two Noctua NF-S12A fans are at the inlet and the same number is on the exhaust. When testing various system cooling configurations, this proved to be the most effective solution. The fans are always set to 5 V and the speed corresponds to approx. 550 rpm. The stability of the inlet air is properly controlled during the tests, the temperature being between 21 and 21.3 °C at a humidity of ±40%.
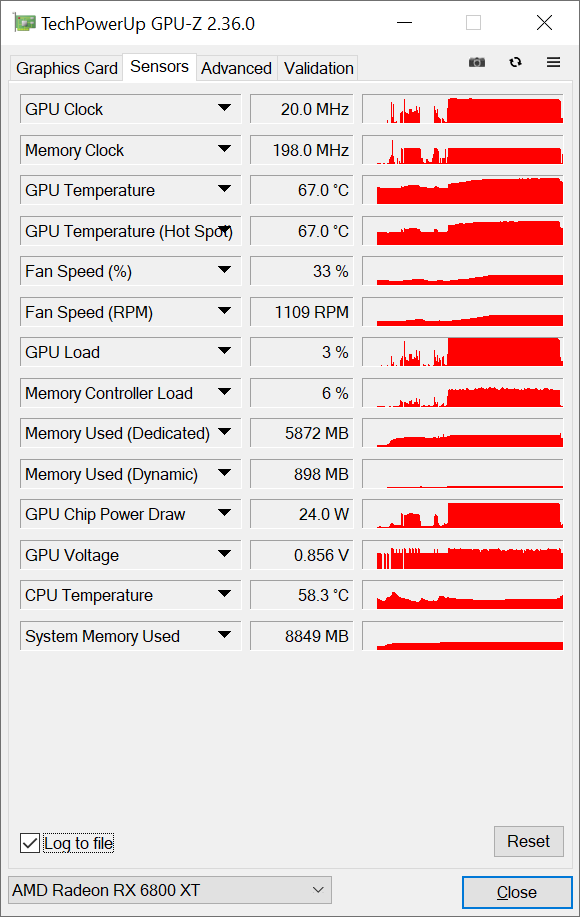
We read the heat from the internal sensors via GPU-Z. This small, single-purpose application also allows you to record samples from sensors in a table. From the table, it is then easy to create line graphs with waveforms or the average value into bar graphs. We will not use the thermal camera very much here, as most graphics cards have a backplate, which makes it impossible to measure the PCB heating. The key for the heating graphs will be the temperature reading by internal sensors, according to which, after all, the GPU frequency control also takes place. It will always be the heating of the graphics core, and if the sensors are also on VRAM and VRM, we will extract these values into the article as well.
No compromises in performance! If this is your motto, then you cannot miss the test of the graphics card GeForce RTX 3090. It will also feed 4K resolution, has the fastest ray tracing and OptiX acceleration, huge video memory and, the review sample from MSI also has many more attractive features. The biggest drawback, as is usual with high-end hardware, is the price. It is really high.
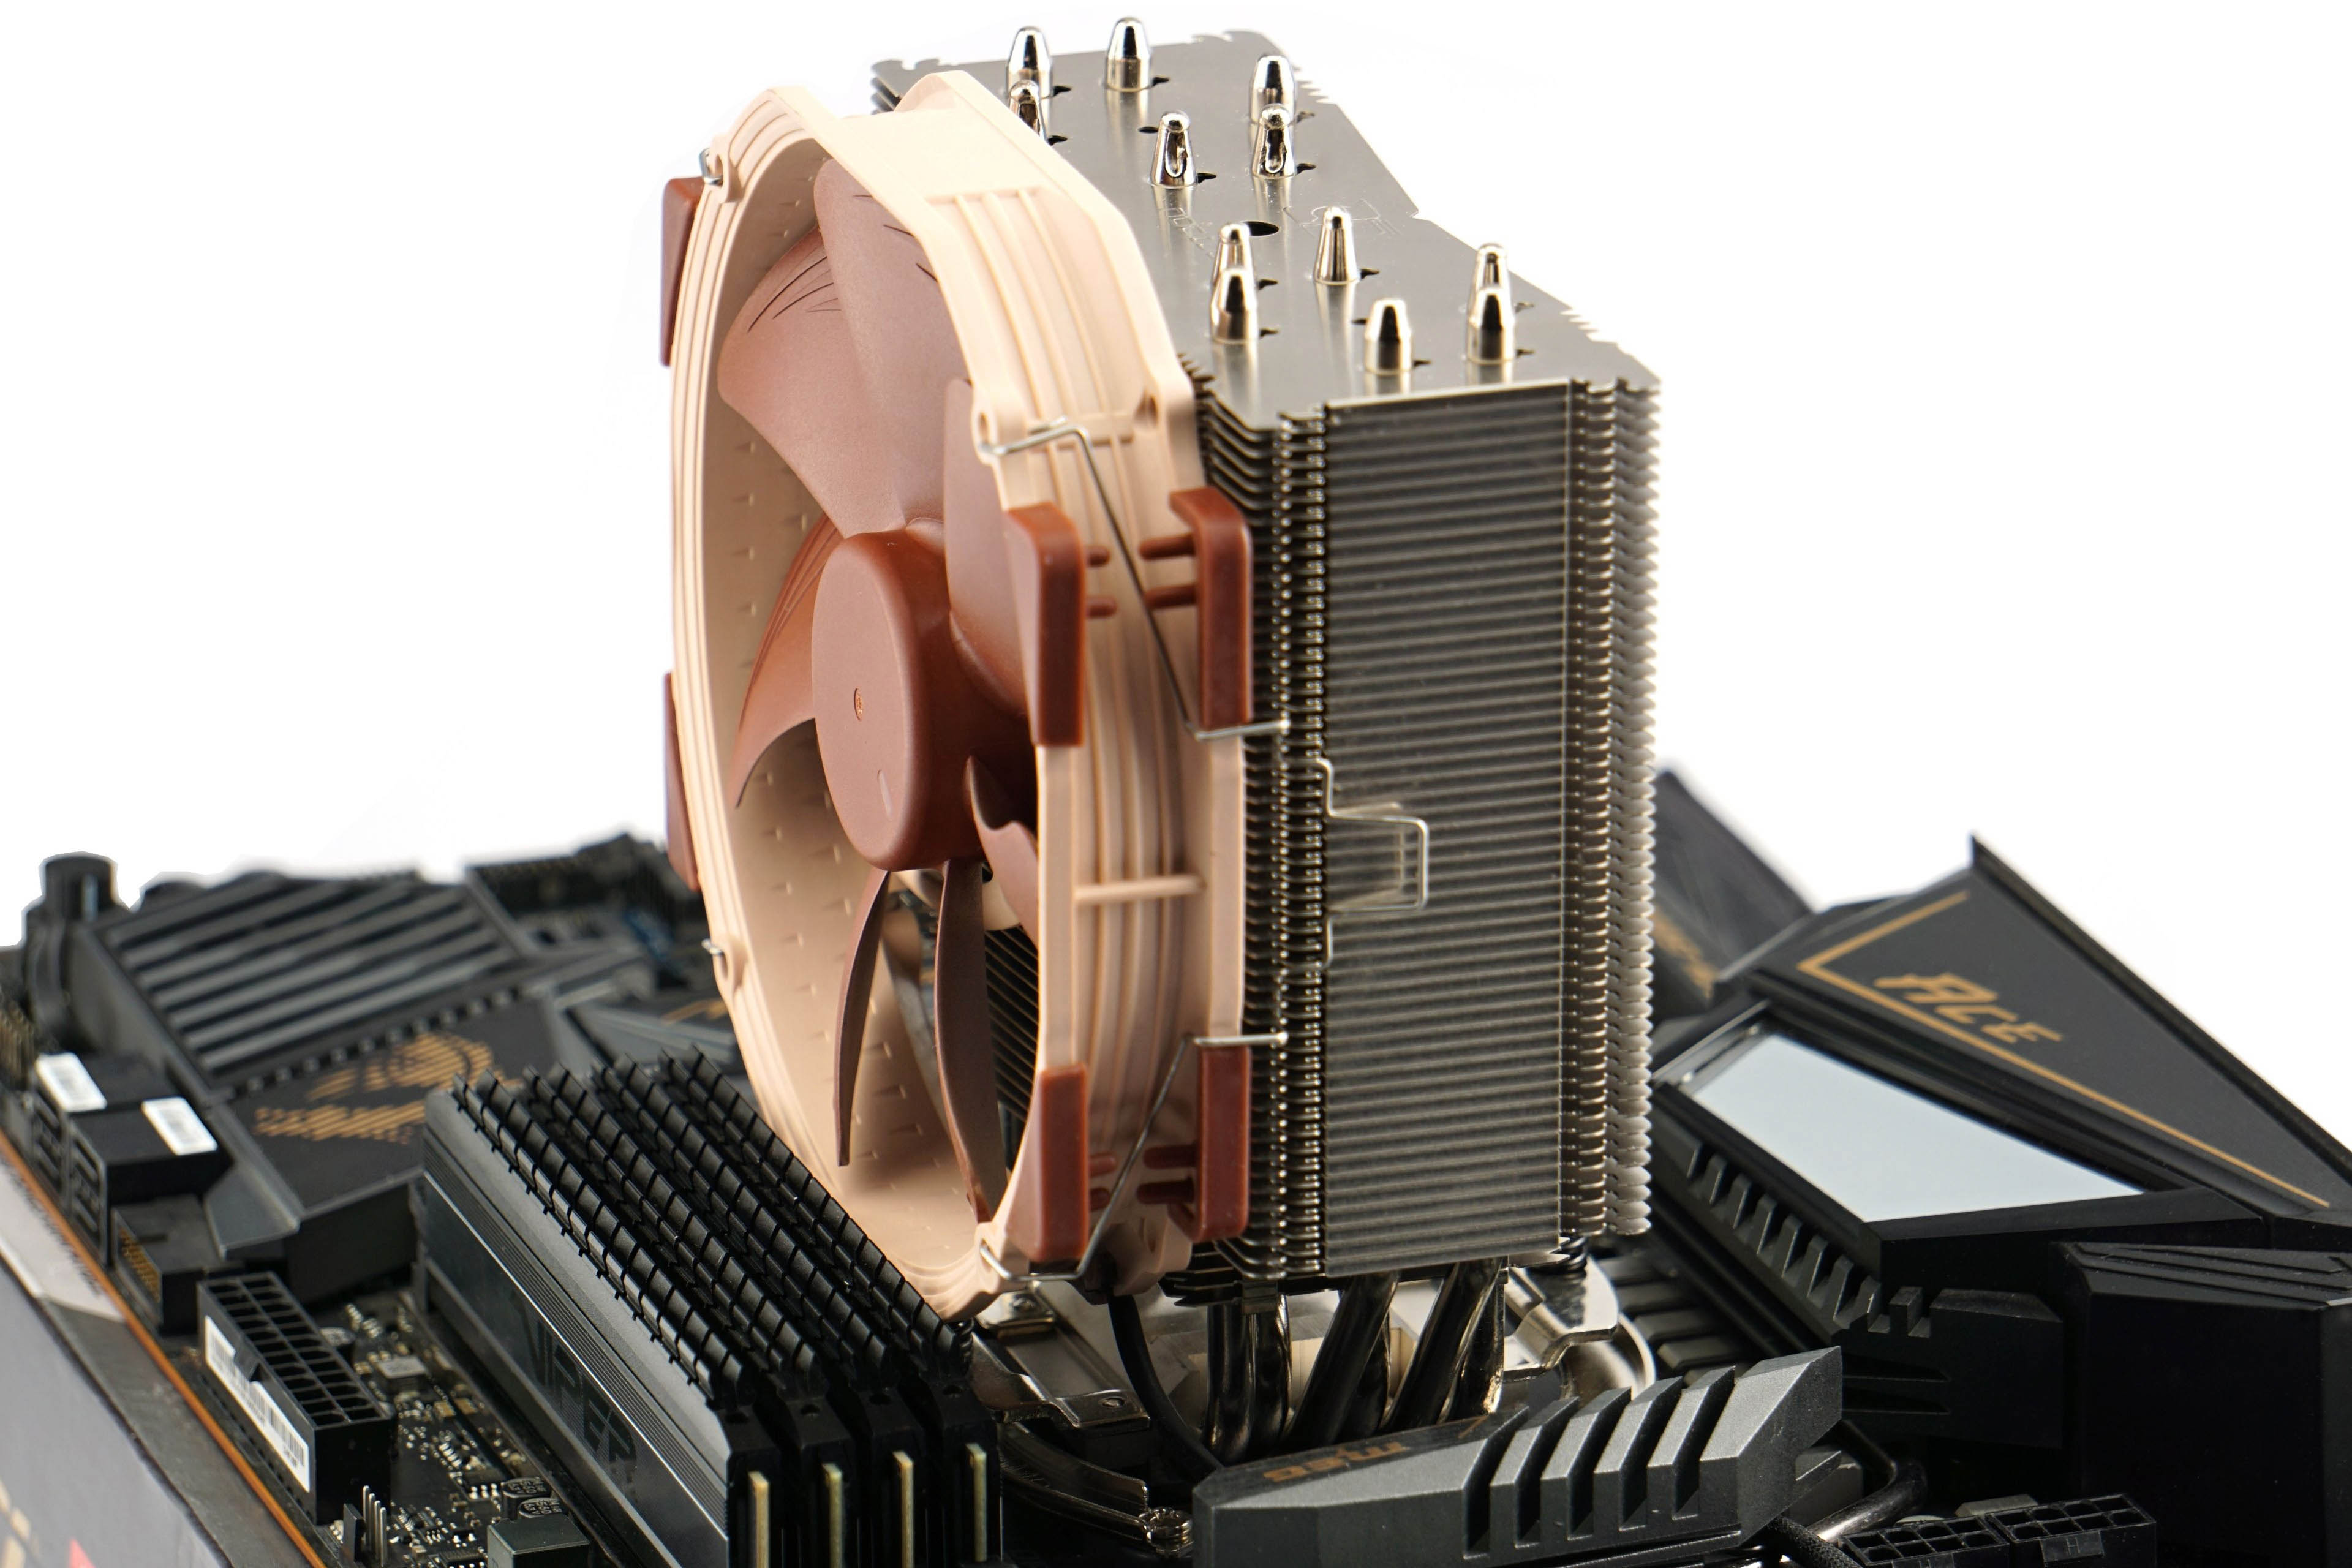
Test rig
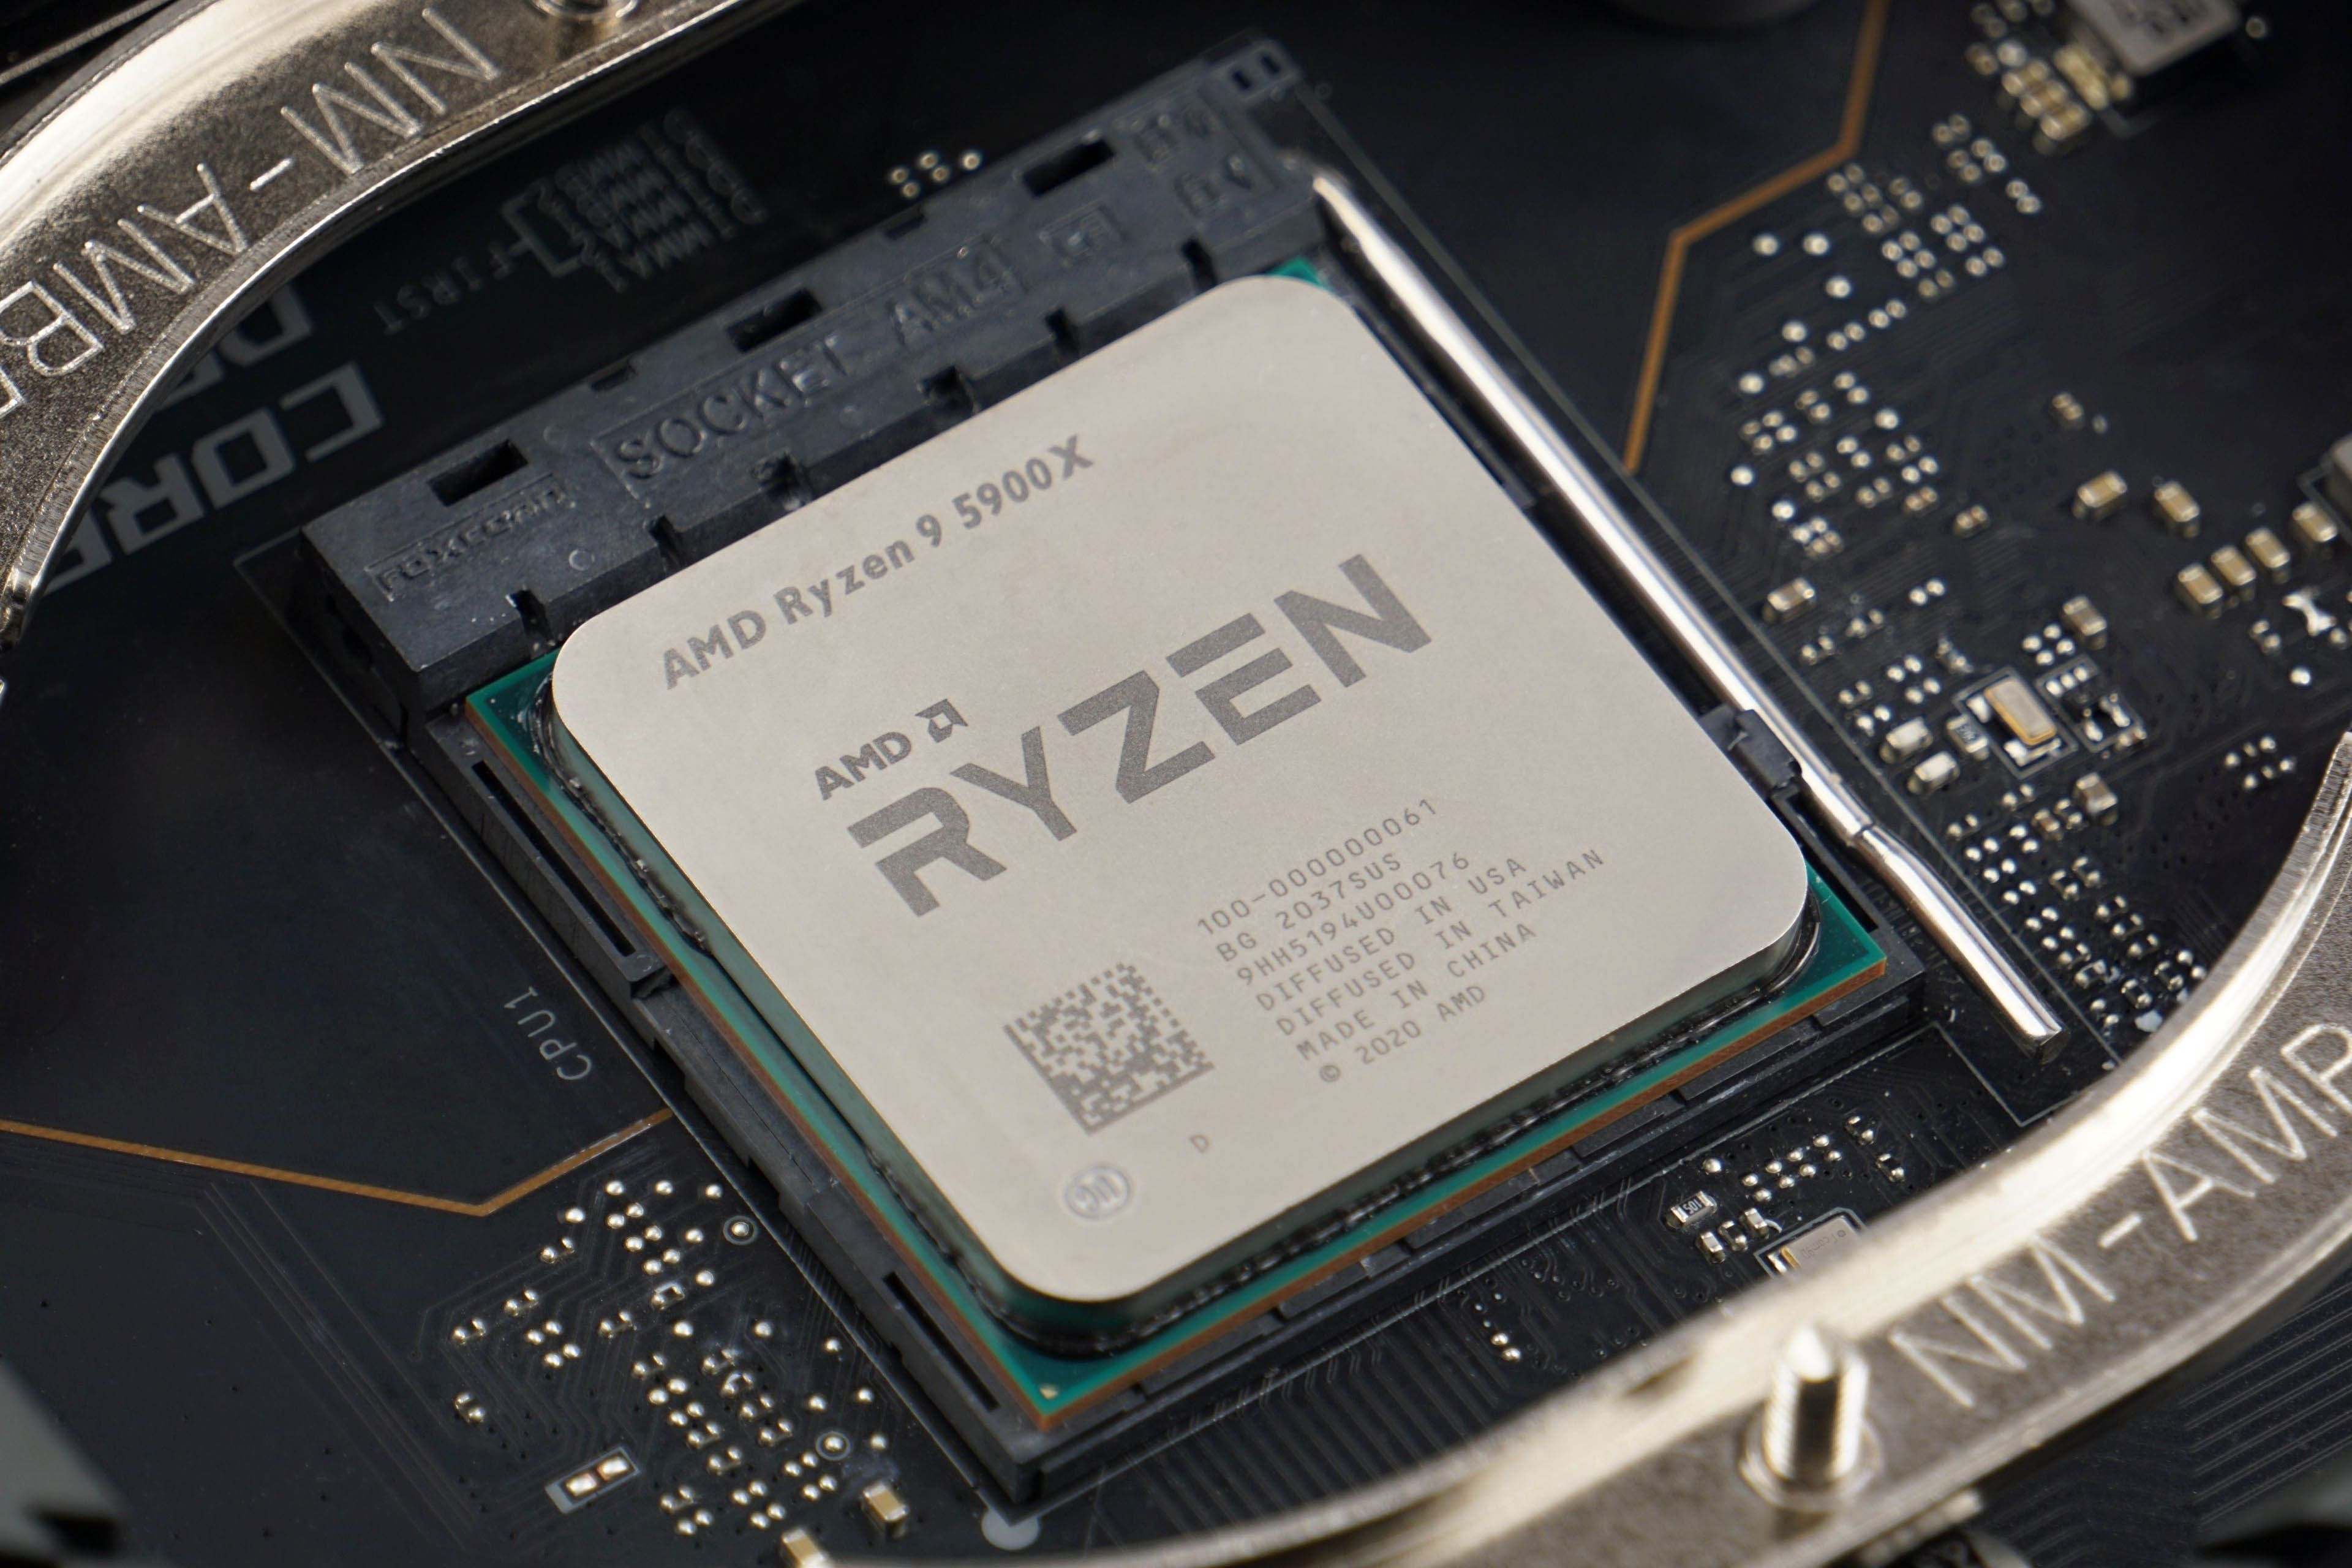
| Test configuration | |
| Processor | AMD Ryzen 9 5900X |
| CPU Cooler | Noctua NH-U14S@12 V s NT-H2 |
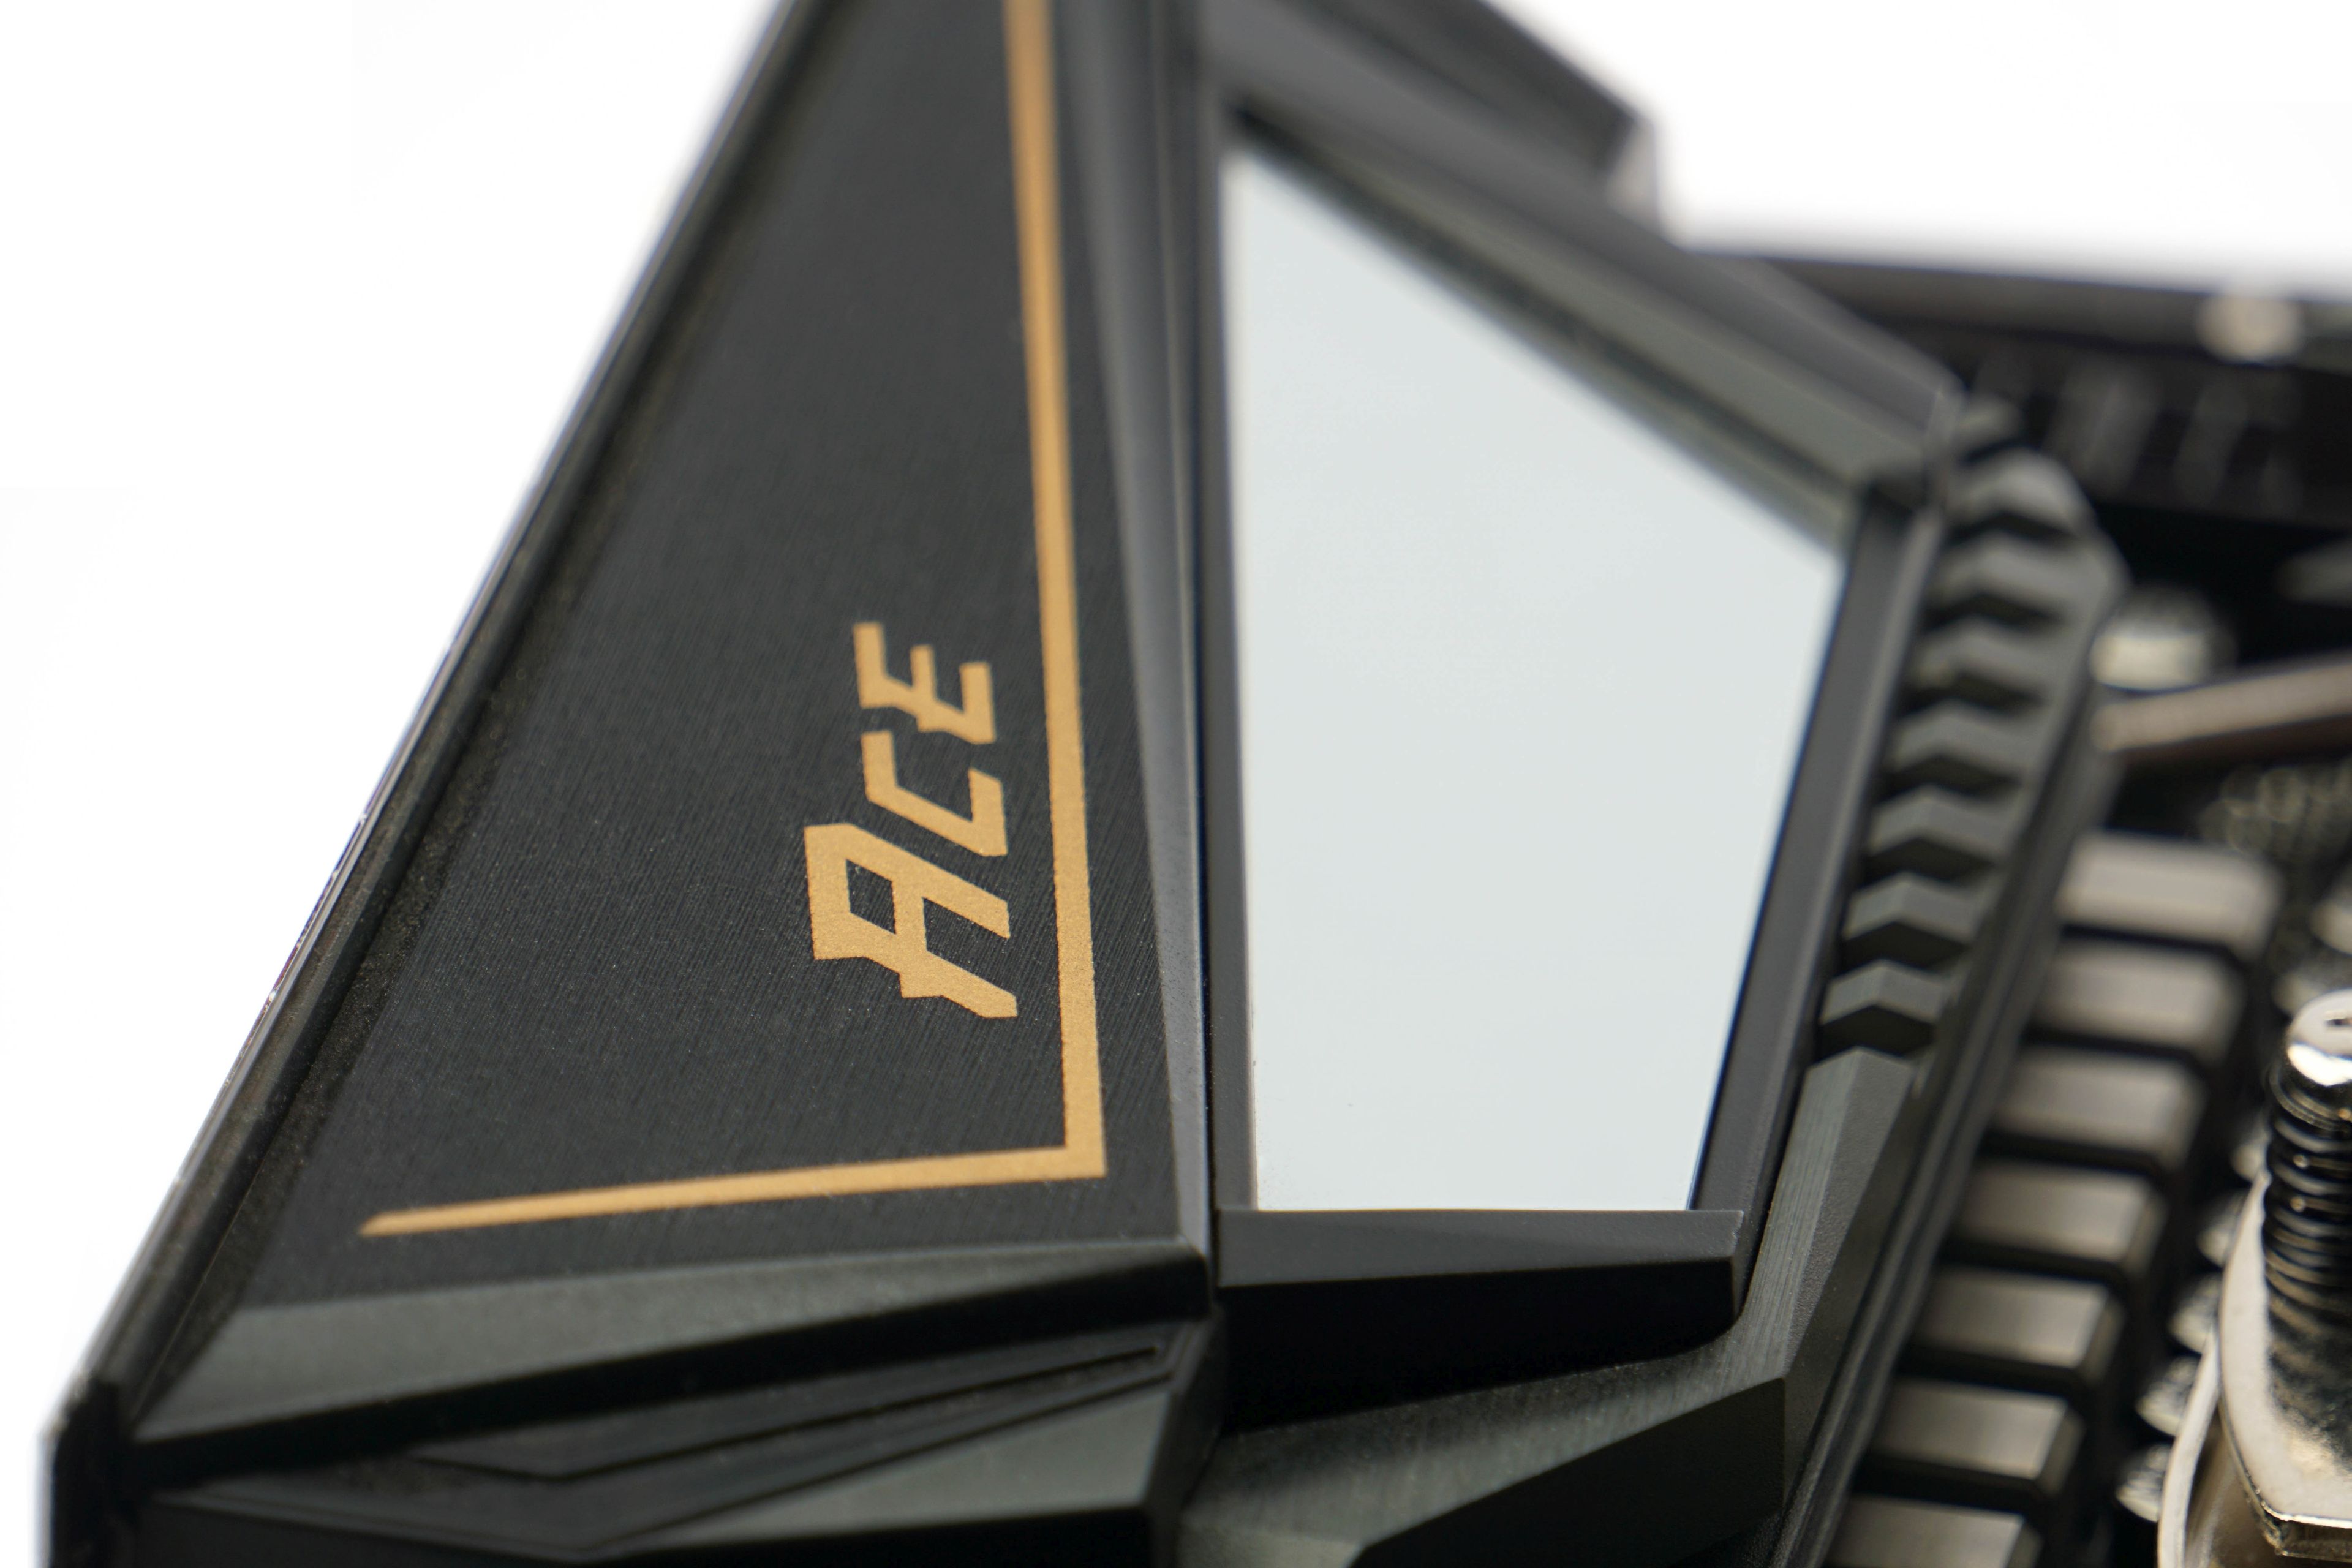
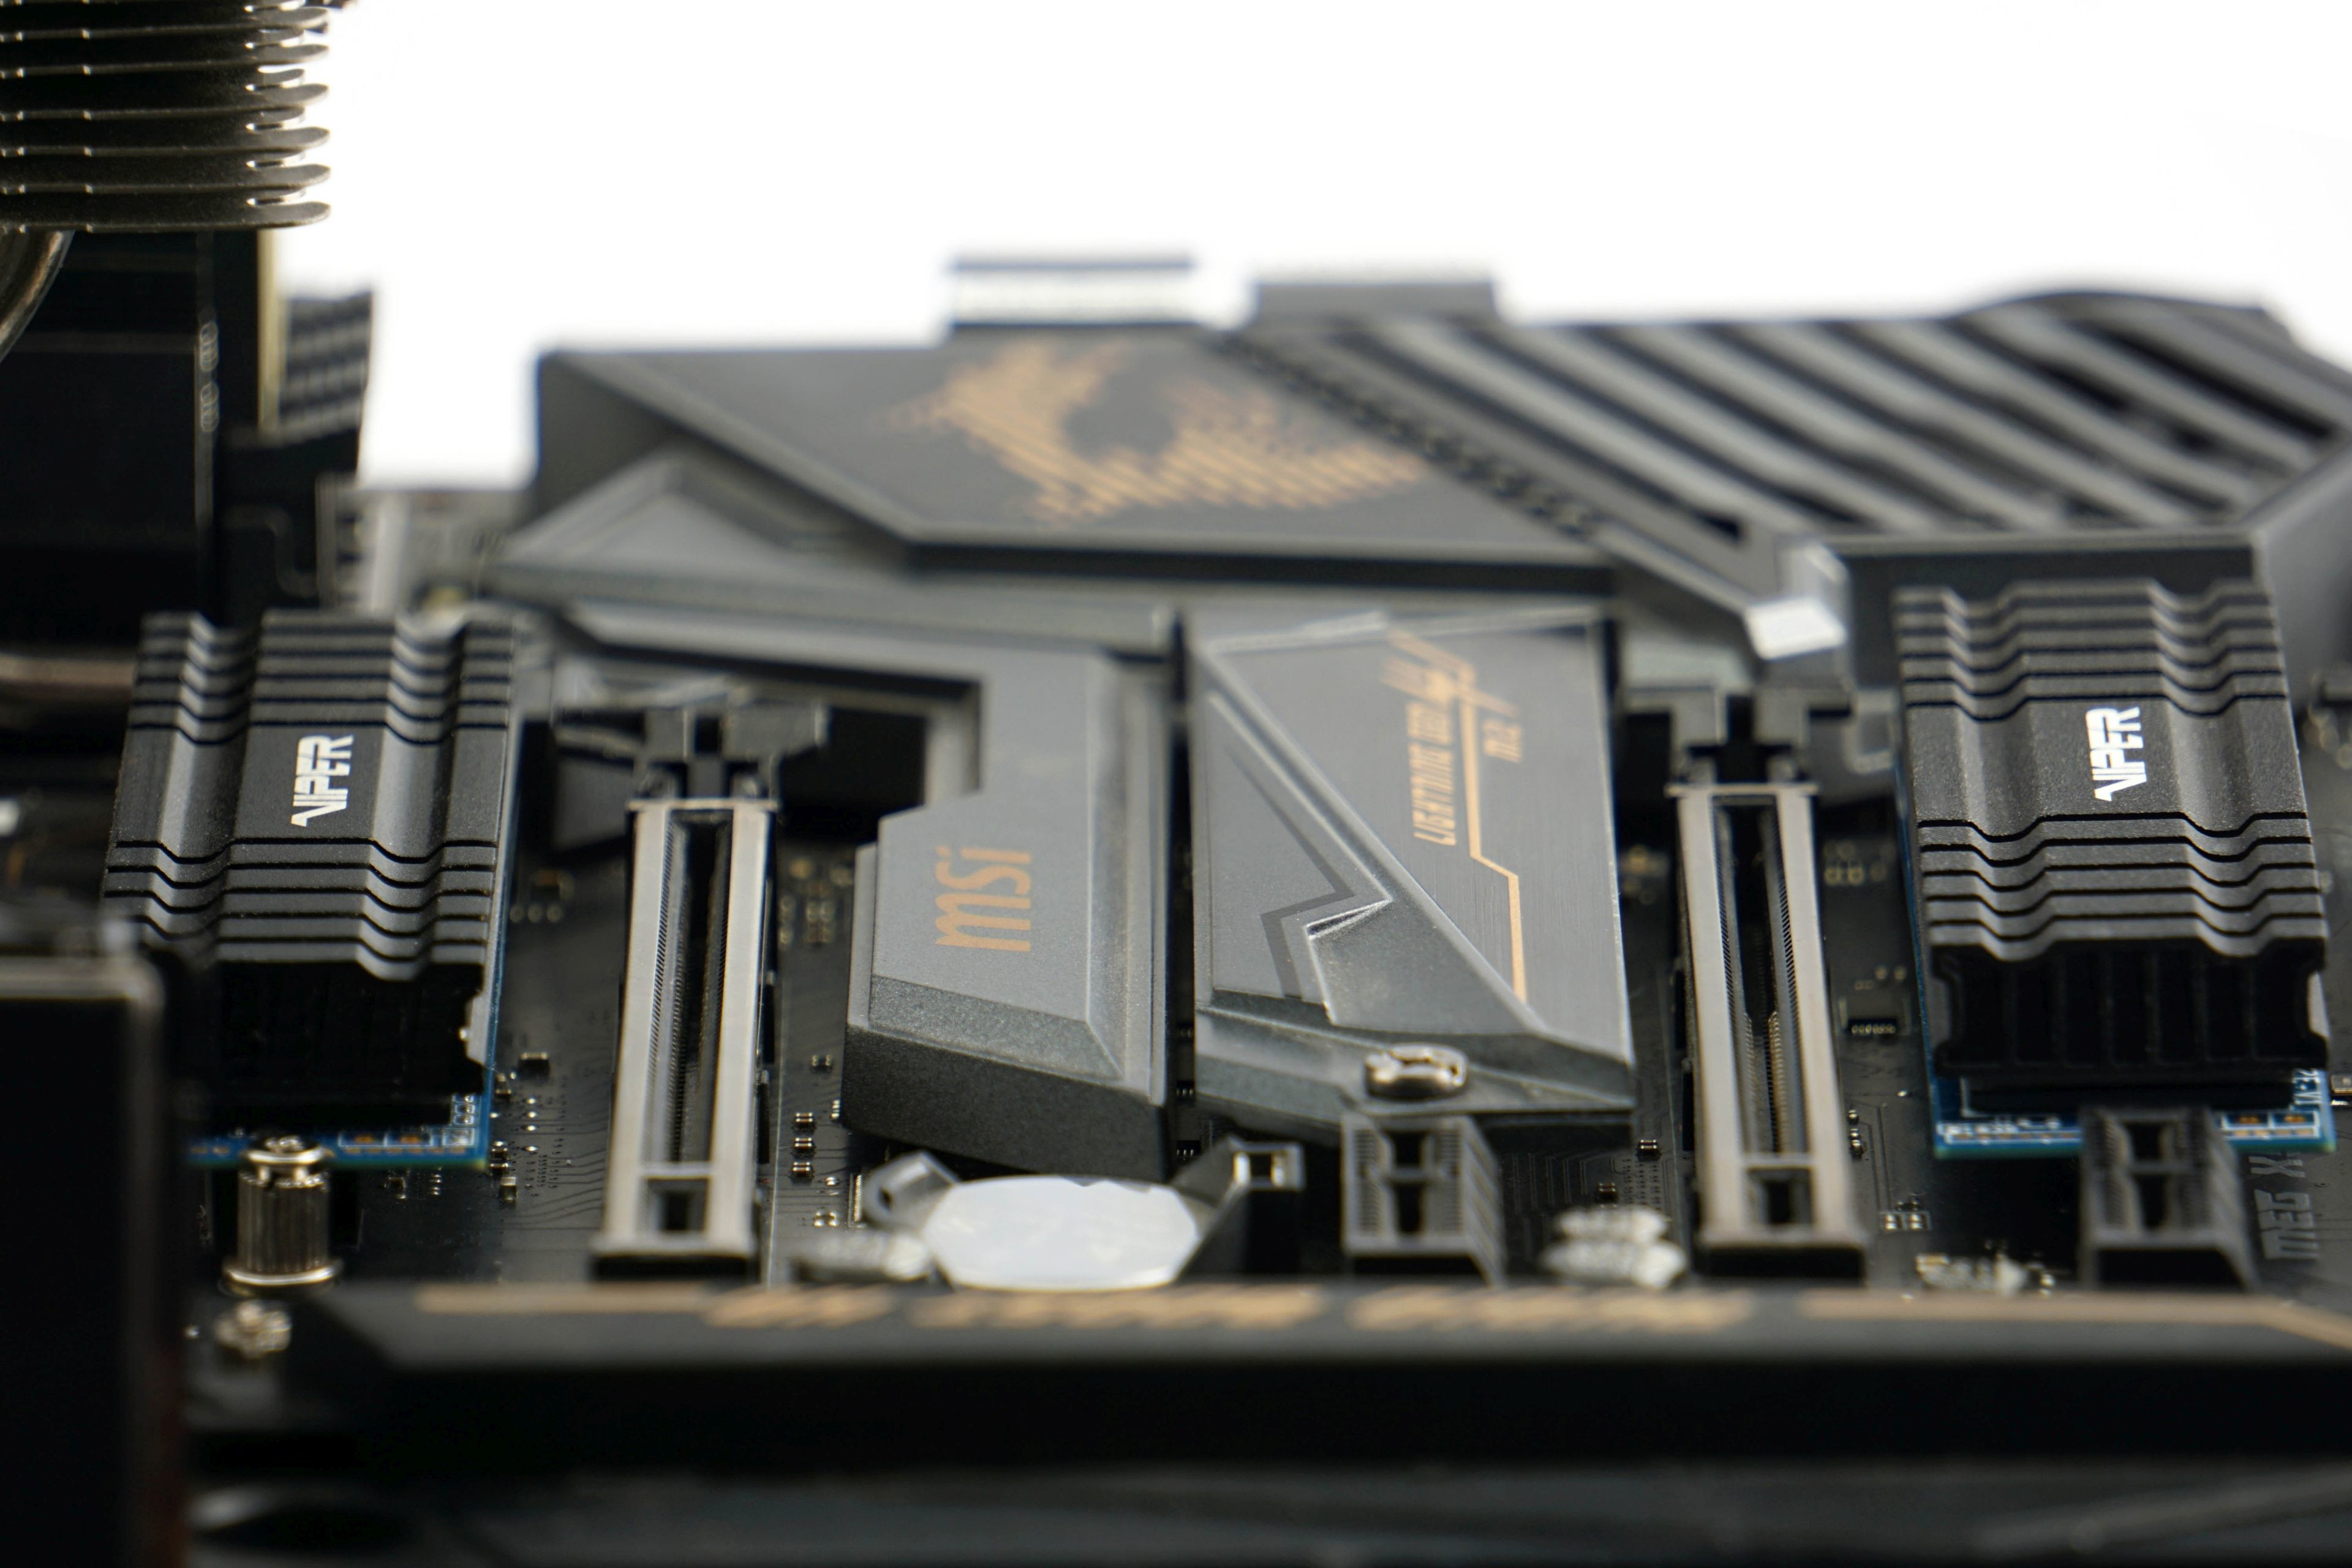
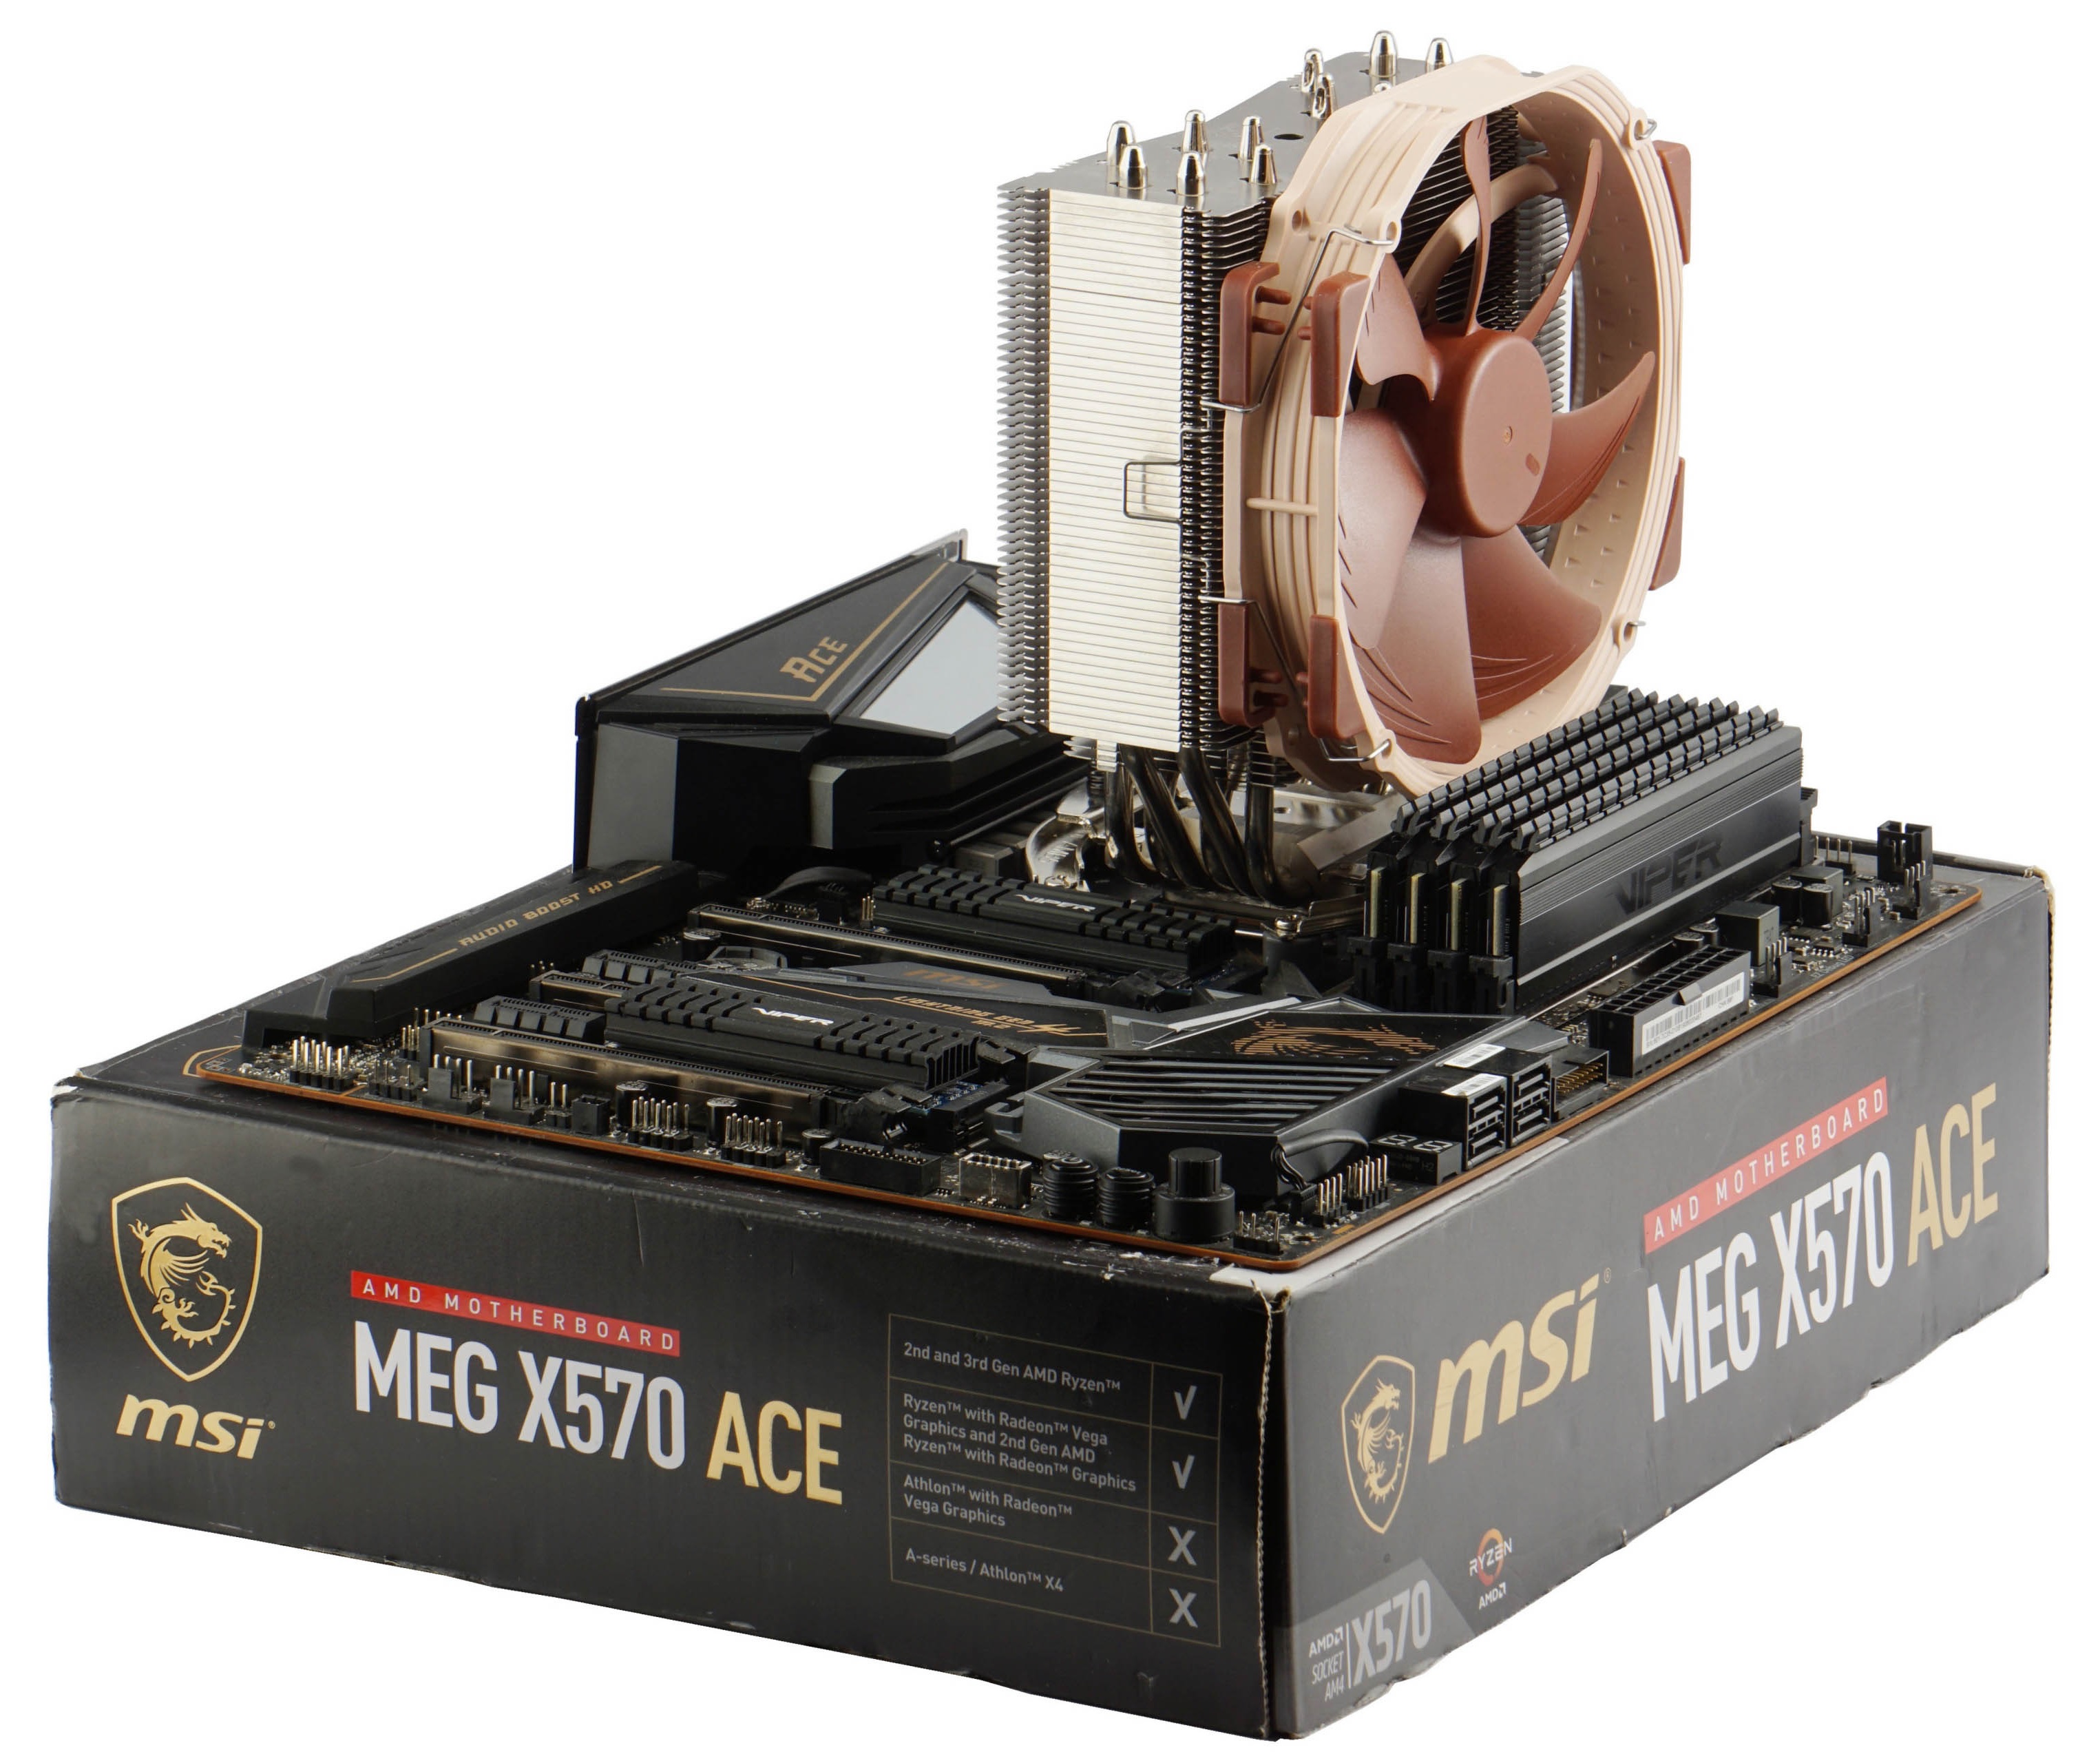
| Motherboard | MSI MEG X570 Ace |
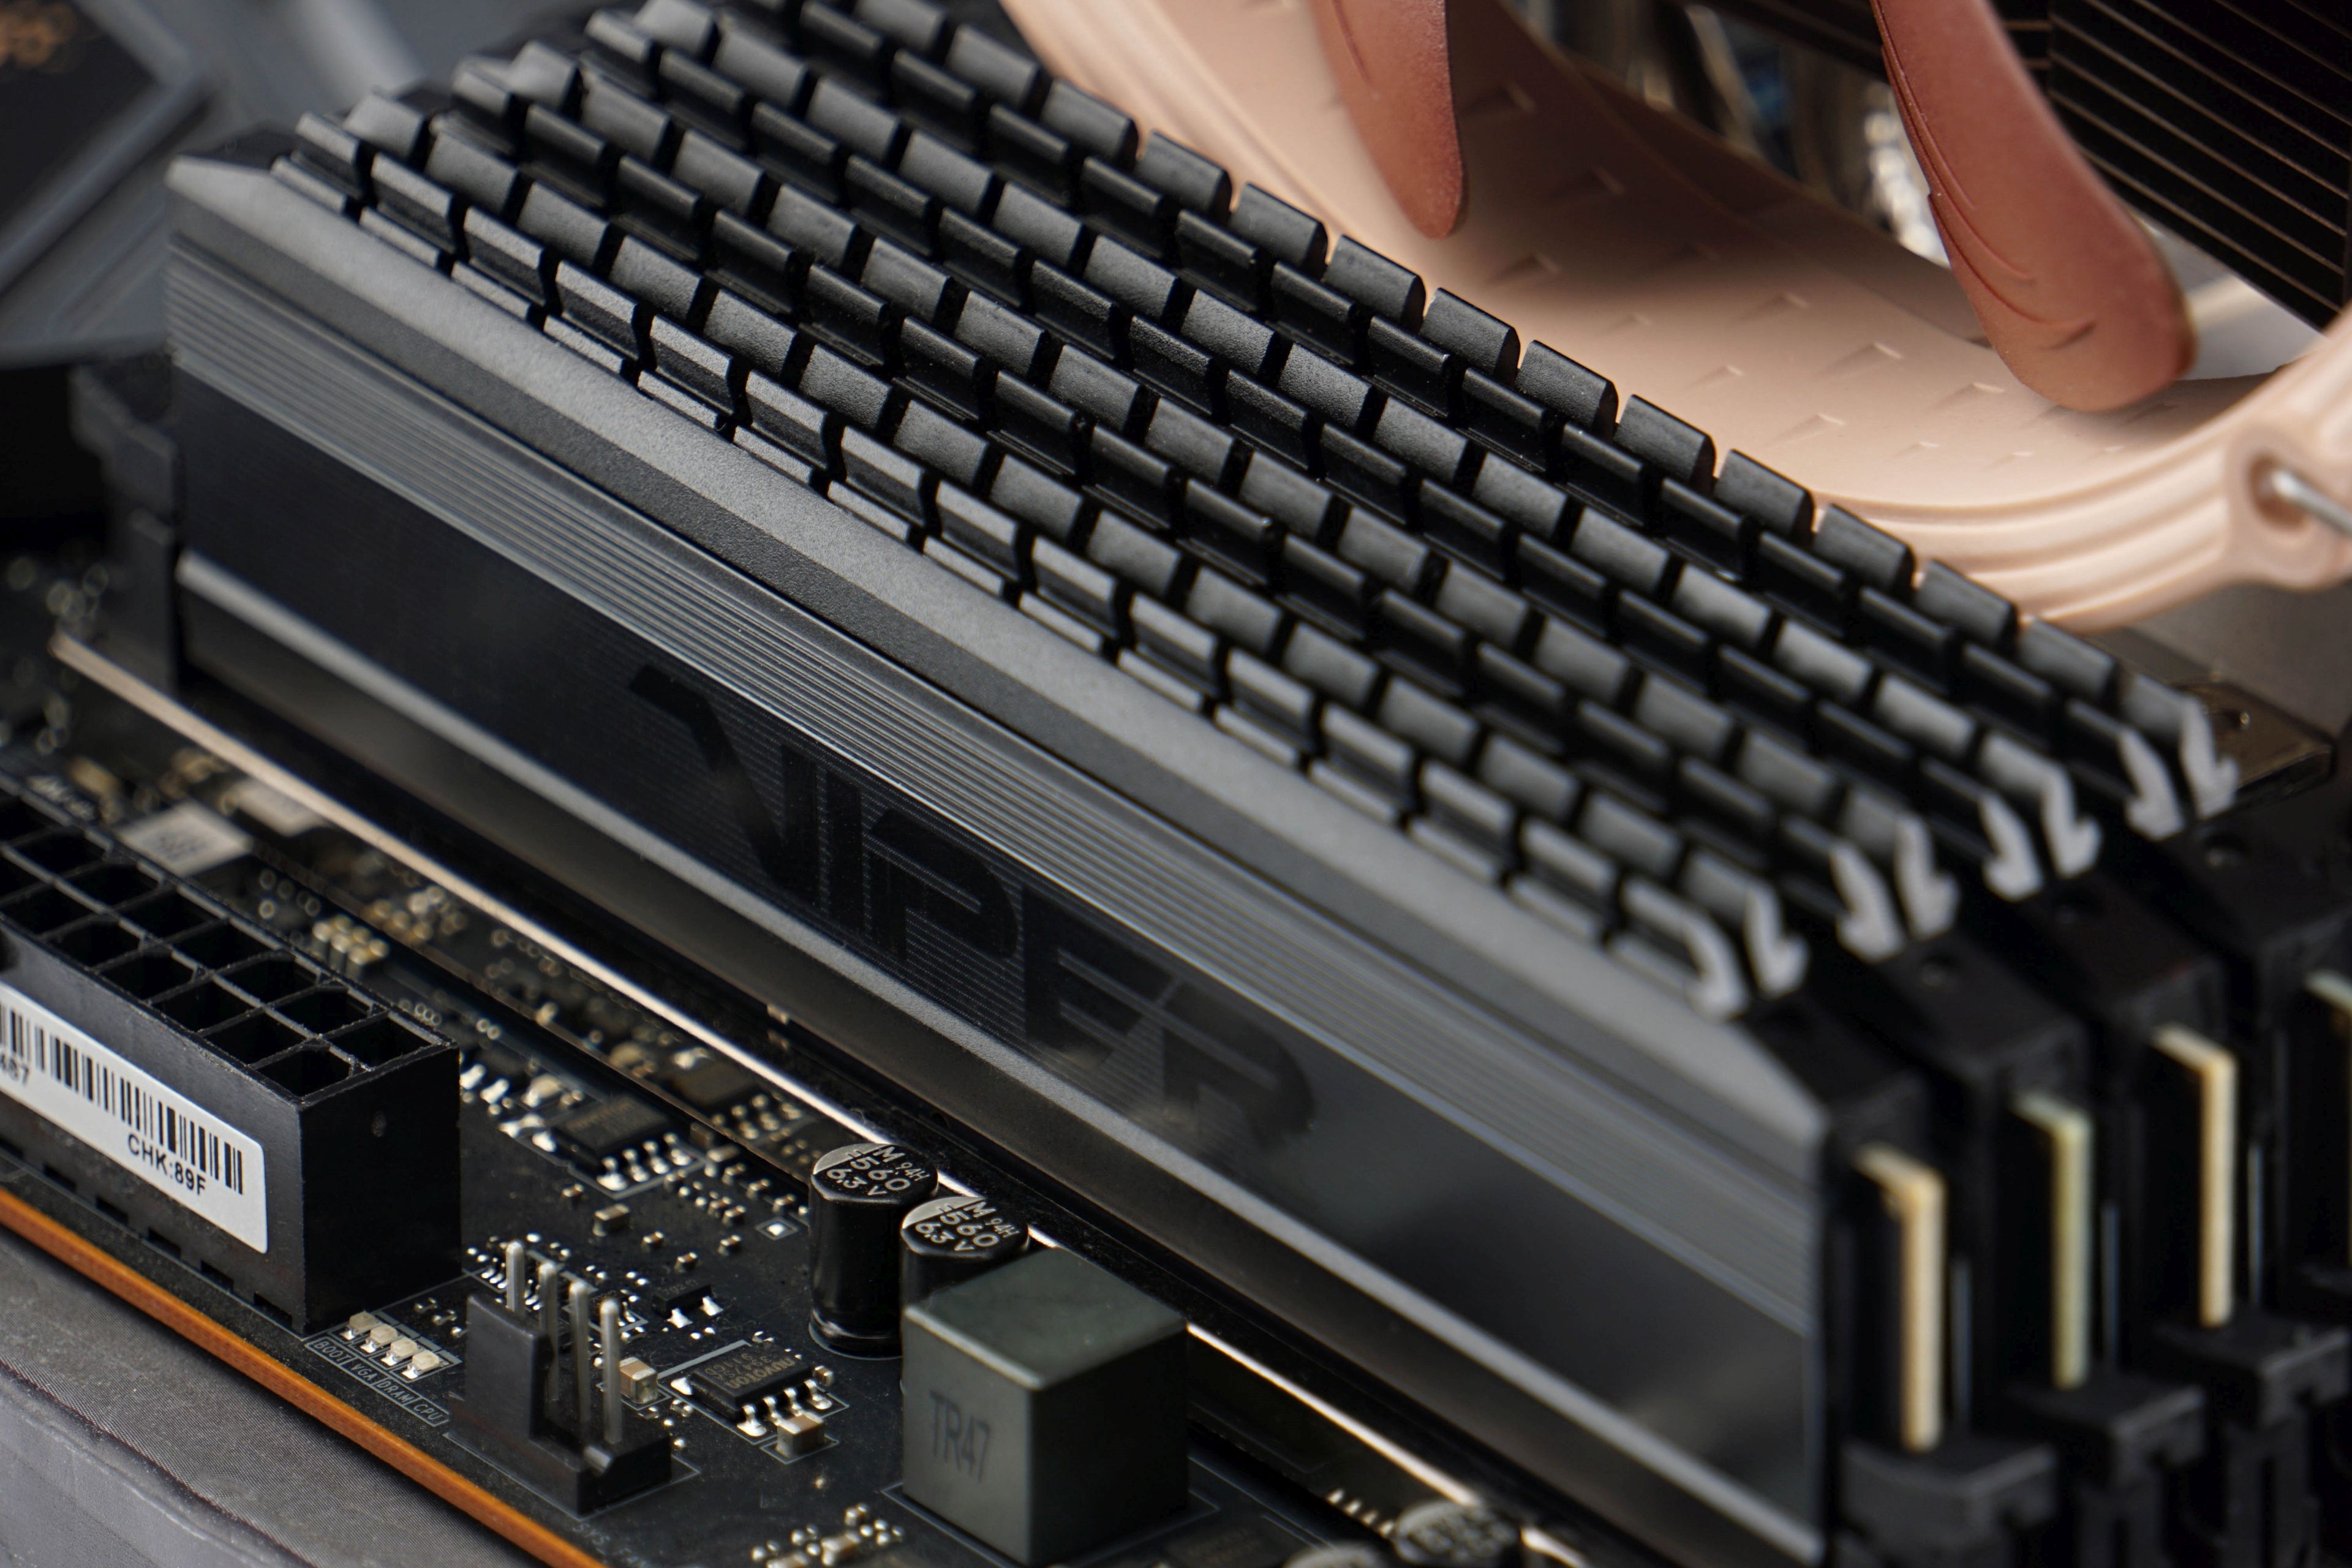
| Memory (RAM) | Patriot Blackout, 4× 8 GB, 3600 MHz/CL18 |
| SSD | 2× Patriot Viper VPN100 (512 GB + 2 TB) |
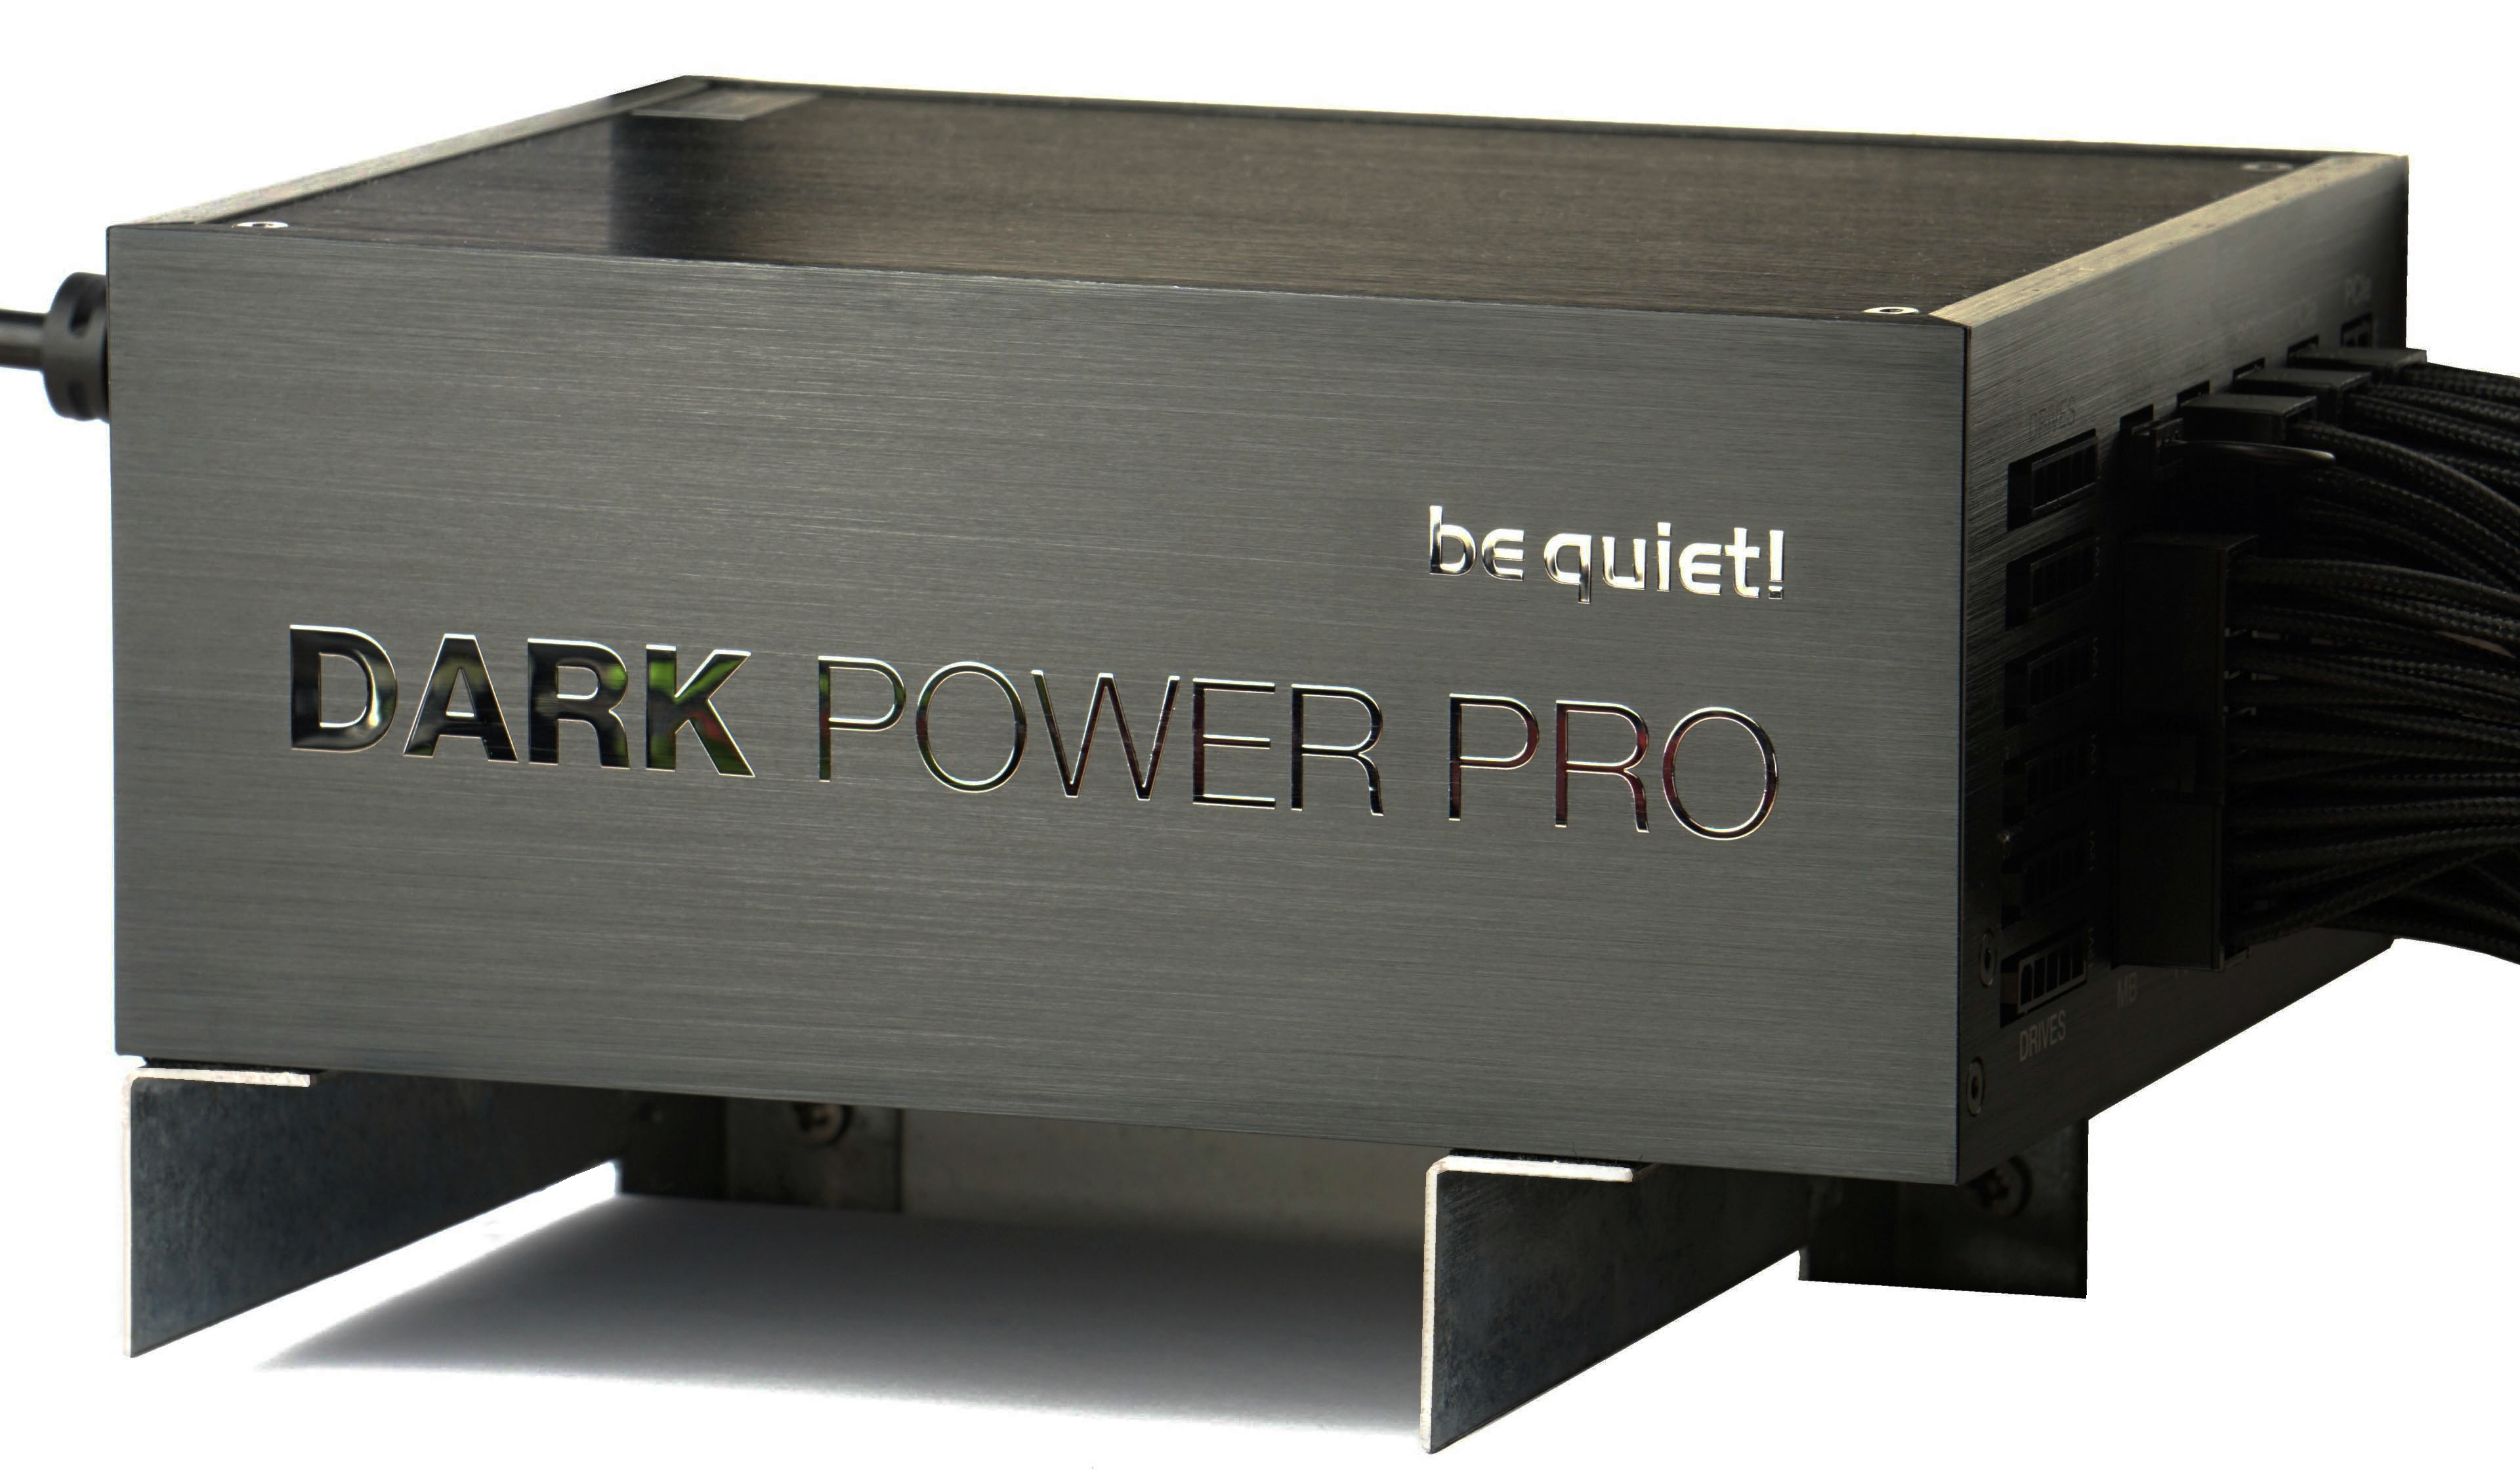
| PSU | BeQuiet! Dark Power Pro 12 (1200 W) |
Note.: At the time of testing, graphics drivers Nvidia GeForce Game Ready 461.09 and AMD Adrenalin 20.12.2 are used, and the OS Windows 10 Enterprise build is 19042.
No compromises in performance! If this is your motto, then you cannot miss the test of the graphics card GeForce RTX 3090. It will also feed 4K resolution, has the fastest ray tracing and OptiX acceleration, huge video memory and, the review sample from MSI also has many more attractive features. The biggest drawback, as is usual with high-end hardware, is the price. It is really high.
3DMark
For the tests we’re using 3DMark Professional and the Night Raid (DirectX12) is suitable for comparing weaker GPUs, for more powerful ones there is Fire Strike (DirectX11) and Time Spy (DirectX12).

No compromises in performance! If this is your motto, then you cannot miss the test of the graphics card GeForce RTX 3090. It will also feed 4K resolution, has the fastest ray tracing and OptiX acceleration, huge video memory and, the review sample from MSI also has many more attractive features. The biggest drawback, as is usual with high-end hardware, is the price. It is really high.
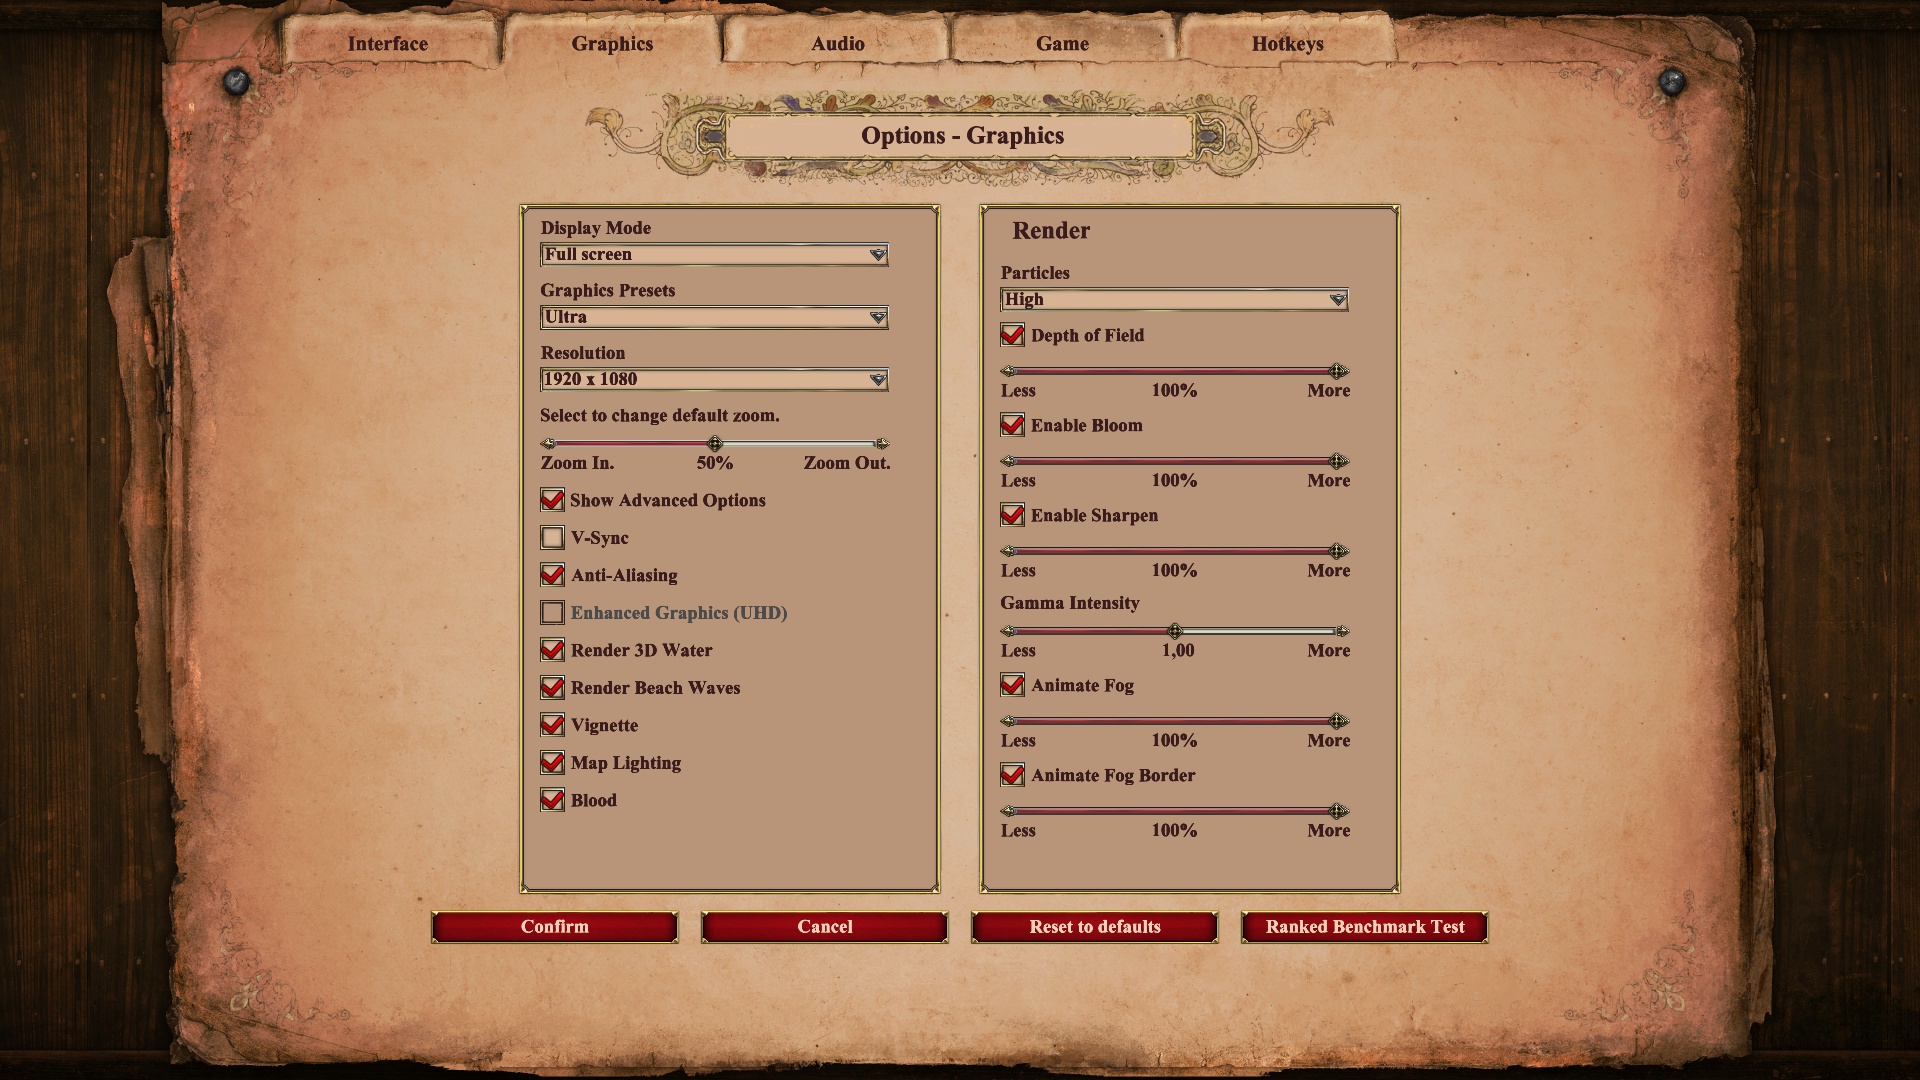
Age of Empires II: DE
Test platform benchmark, API DirectX 11; graphics settings preset Ultra; no extra settings.

No compromises in performance! If this is your motto, then you cannot miss the test of the graphics card GeForce RTX 3090. It will also feed 4K resolution, has the fastest ray tracing and OptiX acceleration, huge video memory and, the review sample from MSI also has many more attractive features. The biggest drawback, as is usual with high-end hardware, is the price. It is really high.
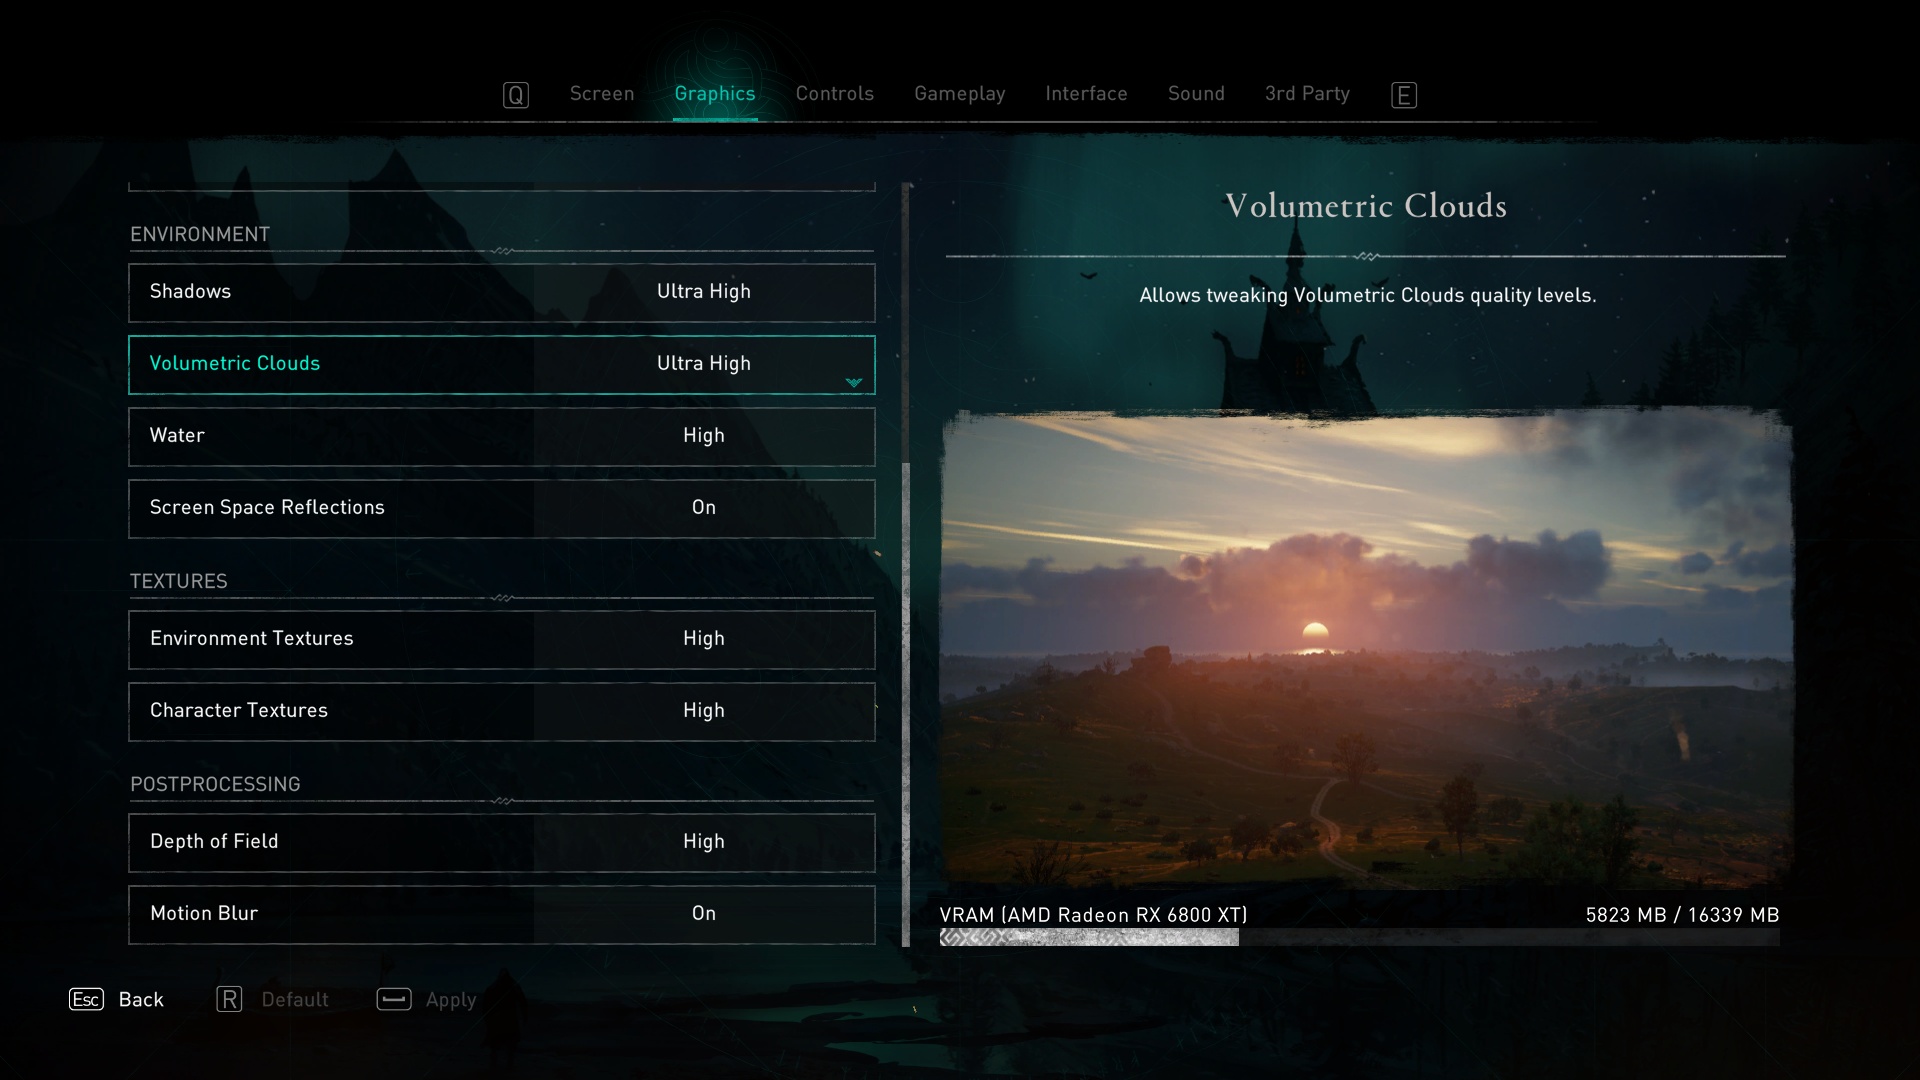
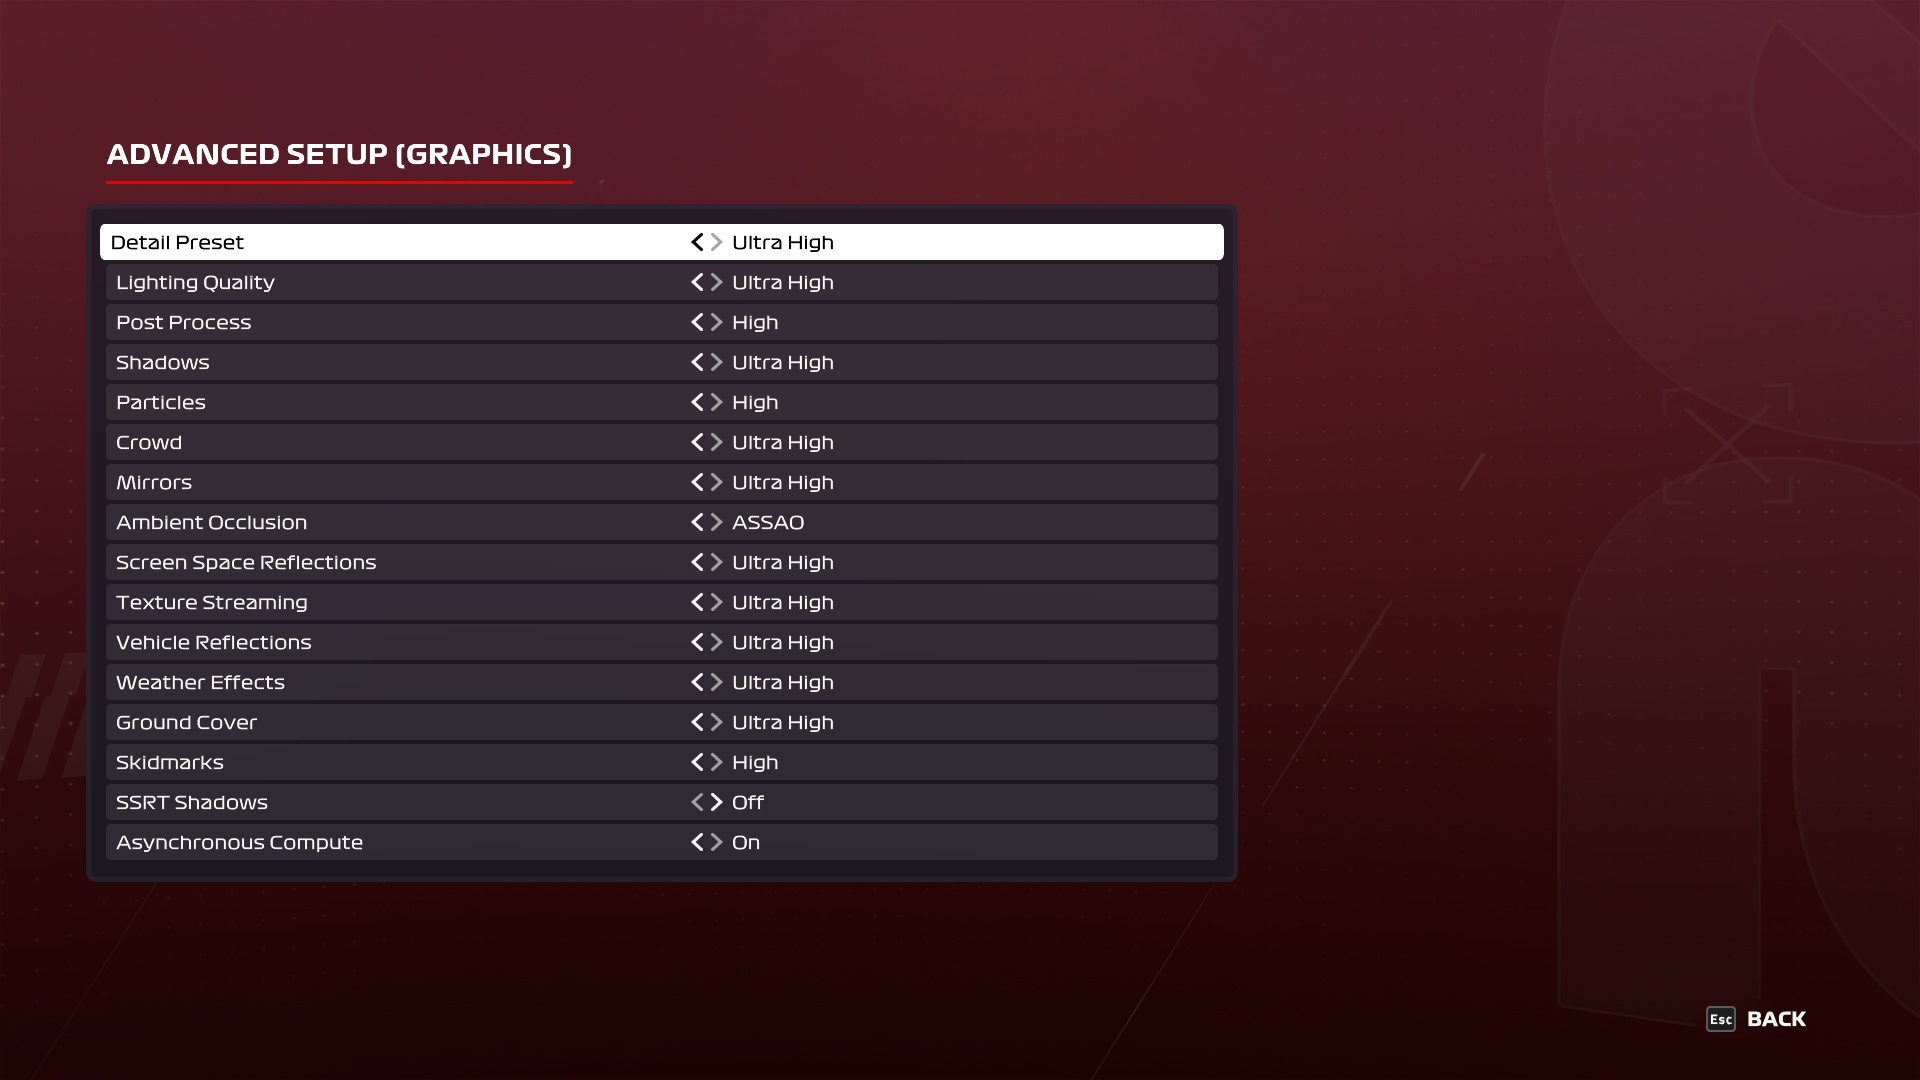
Assassin’s Creed: Valhalla
Test platform benchmark; API DirectX 12; graphics settings preset Ultra High; no extra settings.


No compromises in performance! If this is your motto, then you cannot miss the test of the graphics card GeForce RTX 3090. It will also feed 4K resolution, has the fastest ray tracing and OptiX acceleration, huge video memory and, the review sample from MSI also has many more attractive features. The biggest drawback, as is usual with high-end hardware, is the price. It is really high.
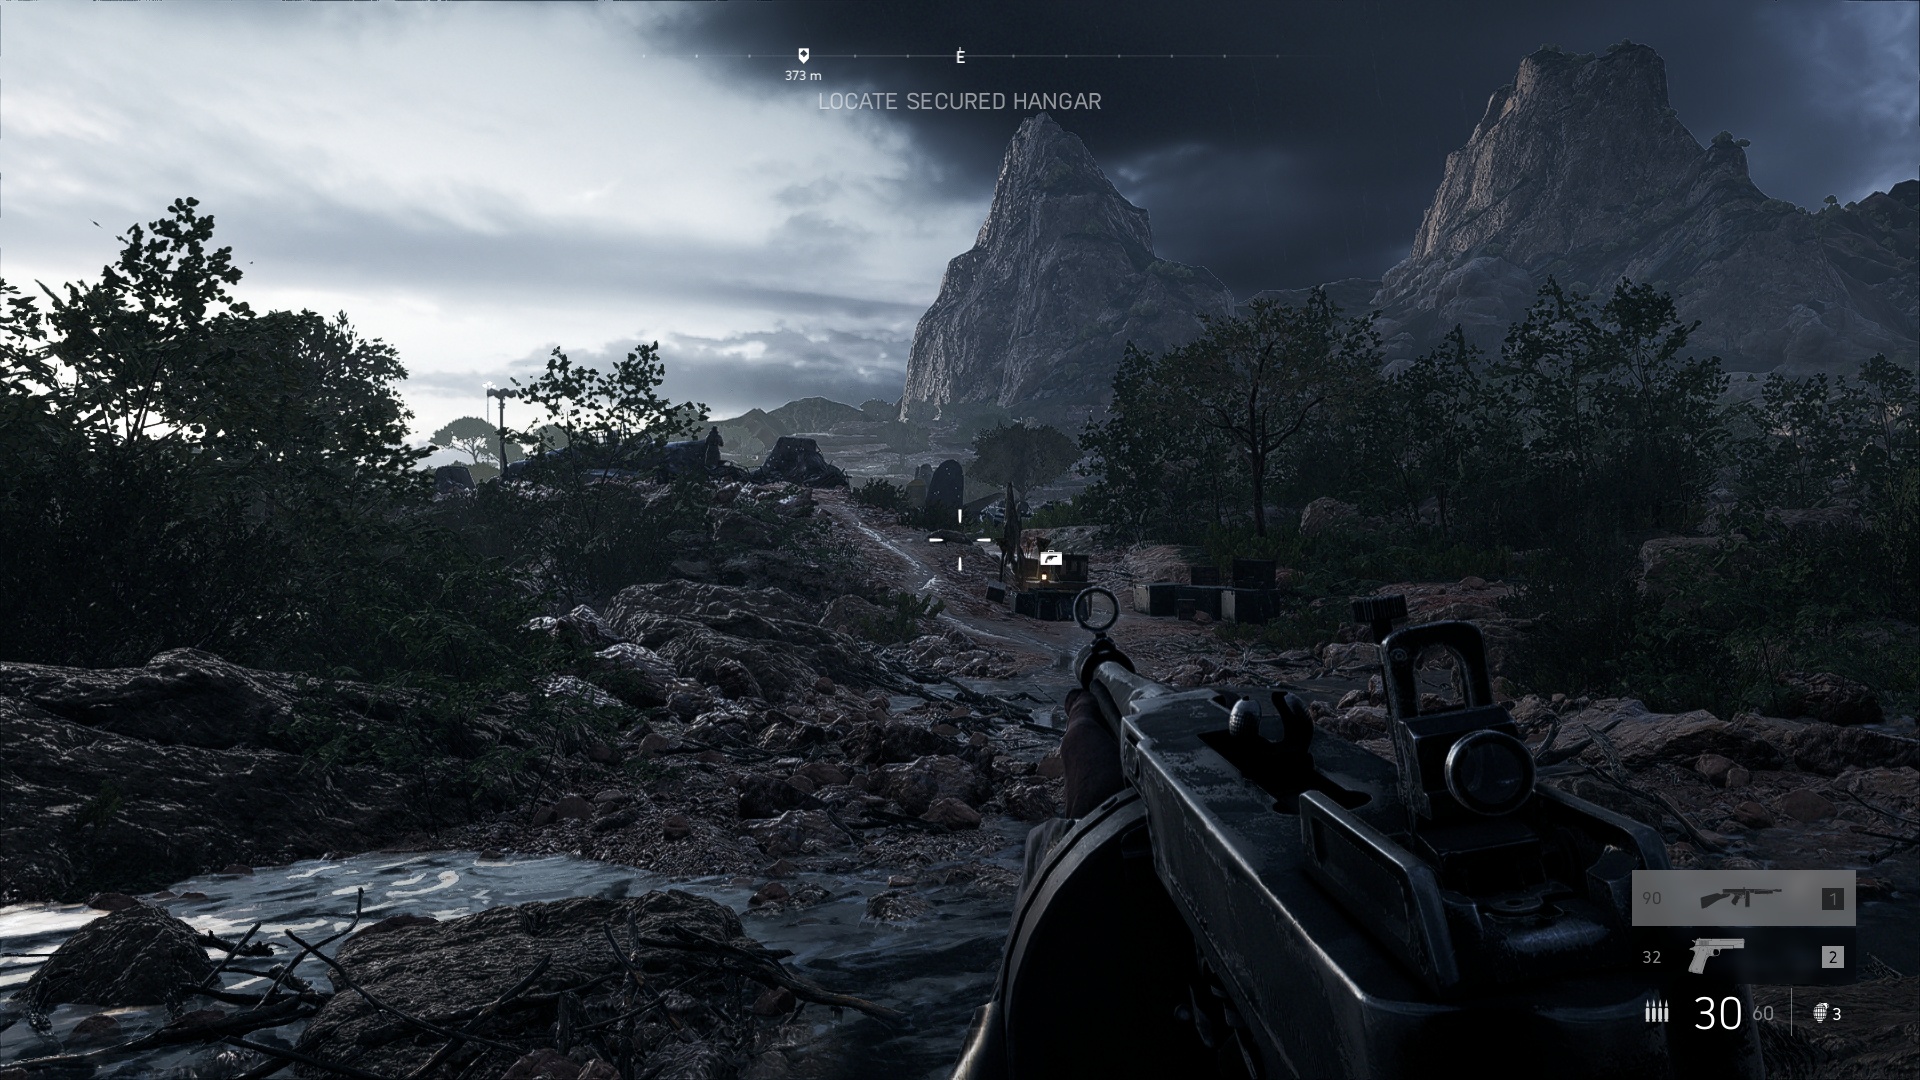
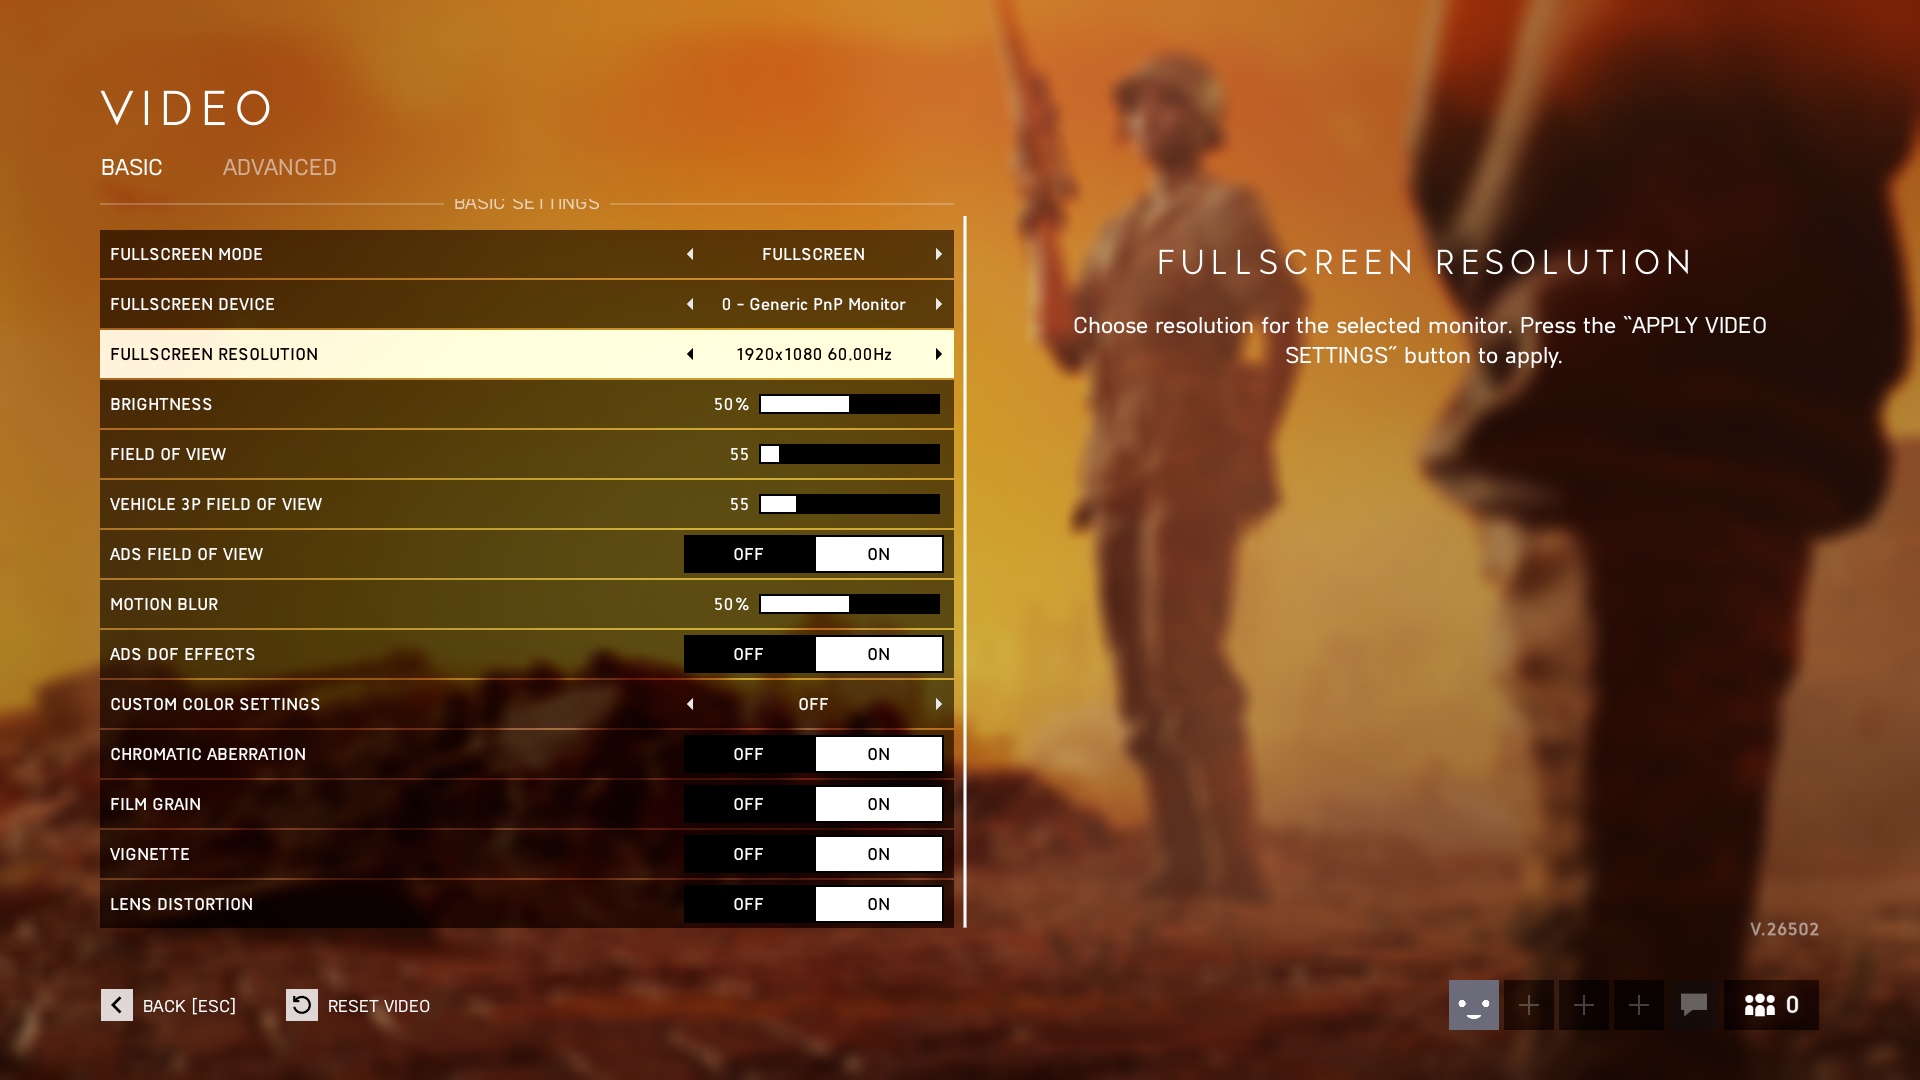
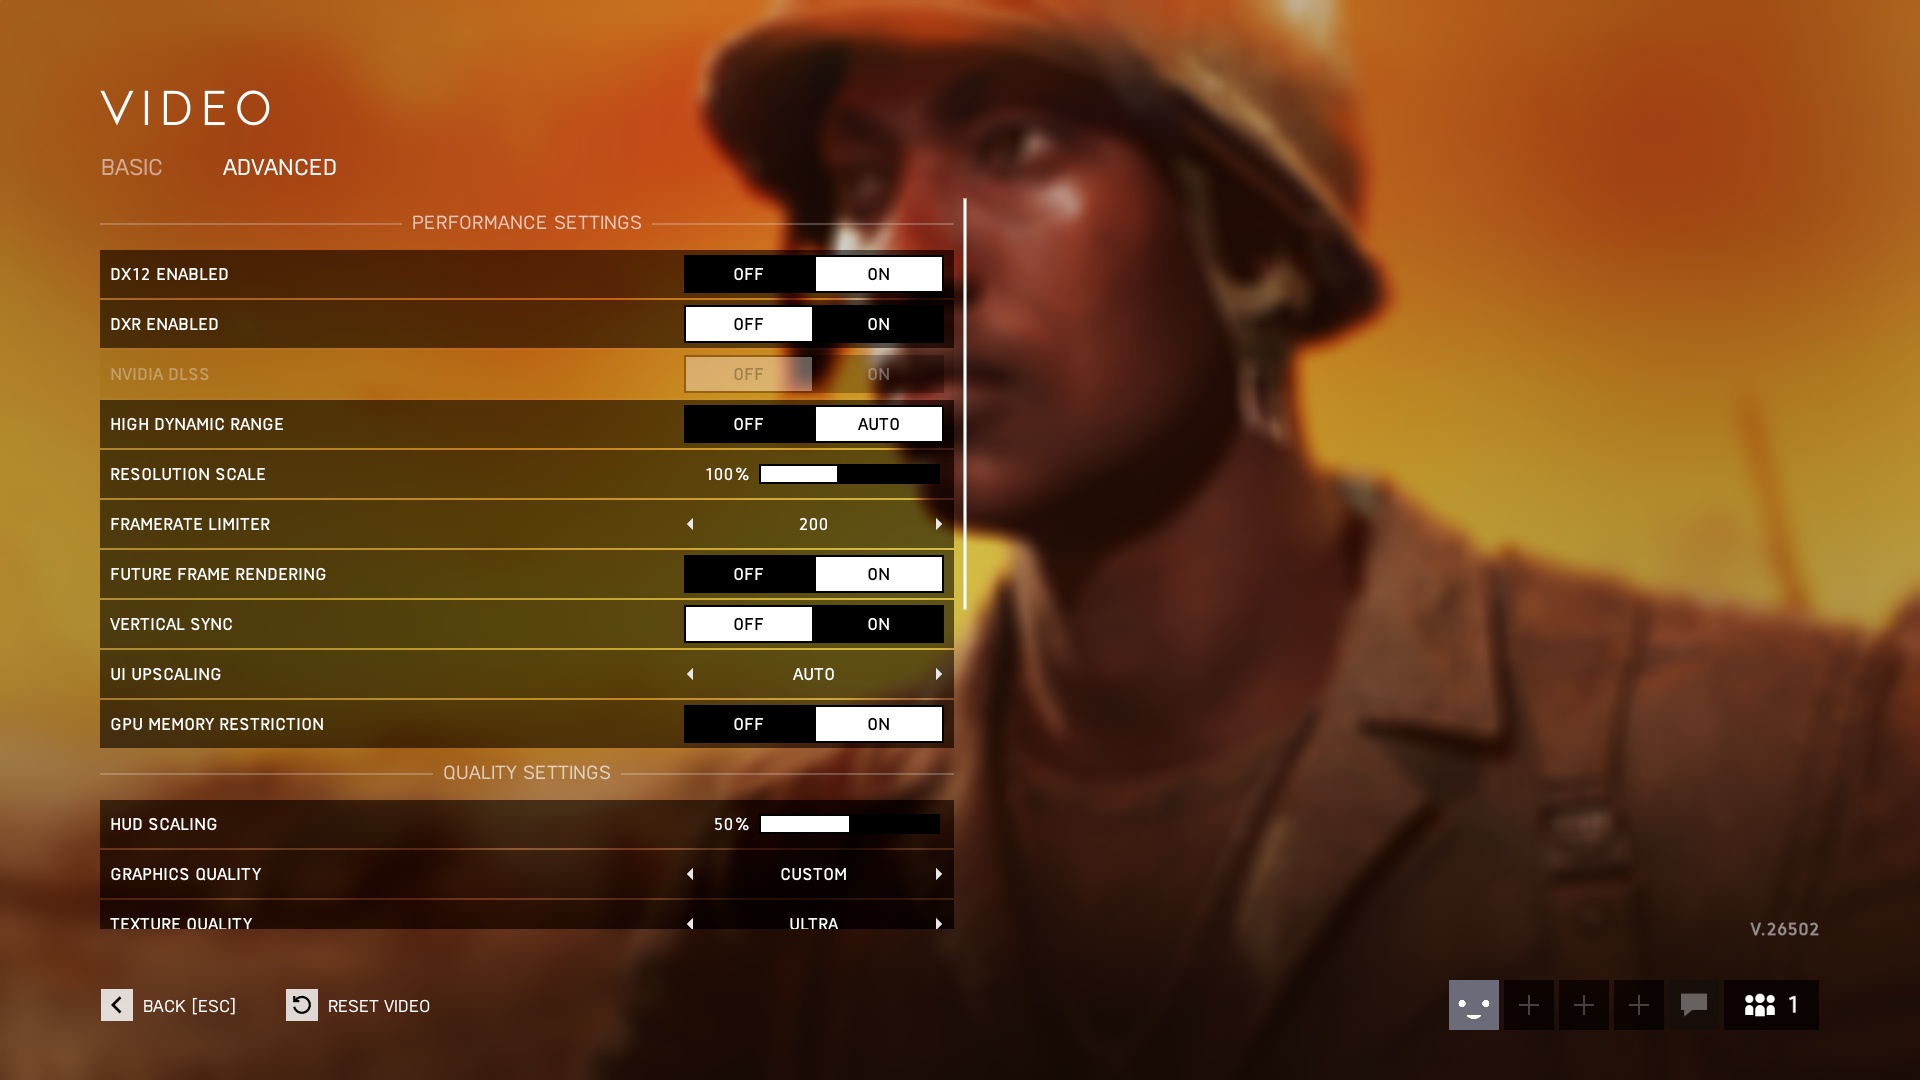
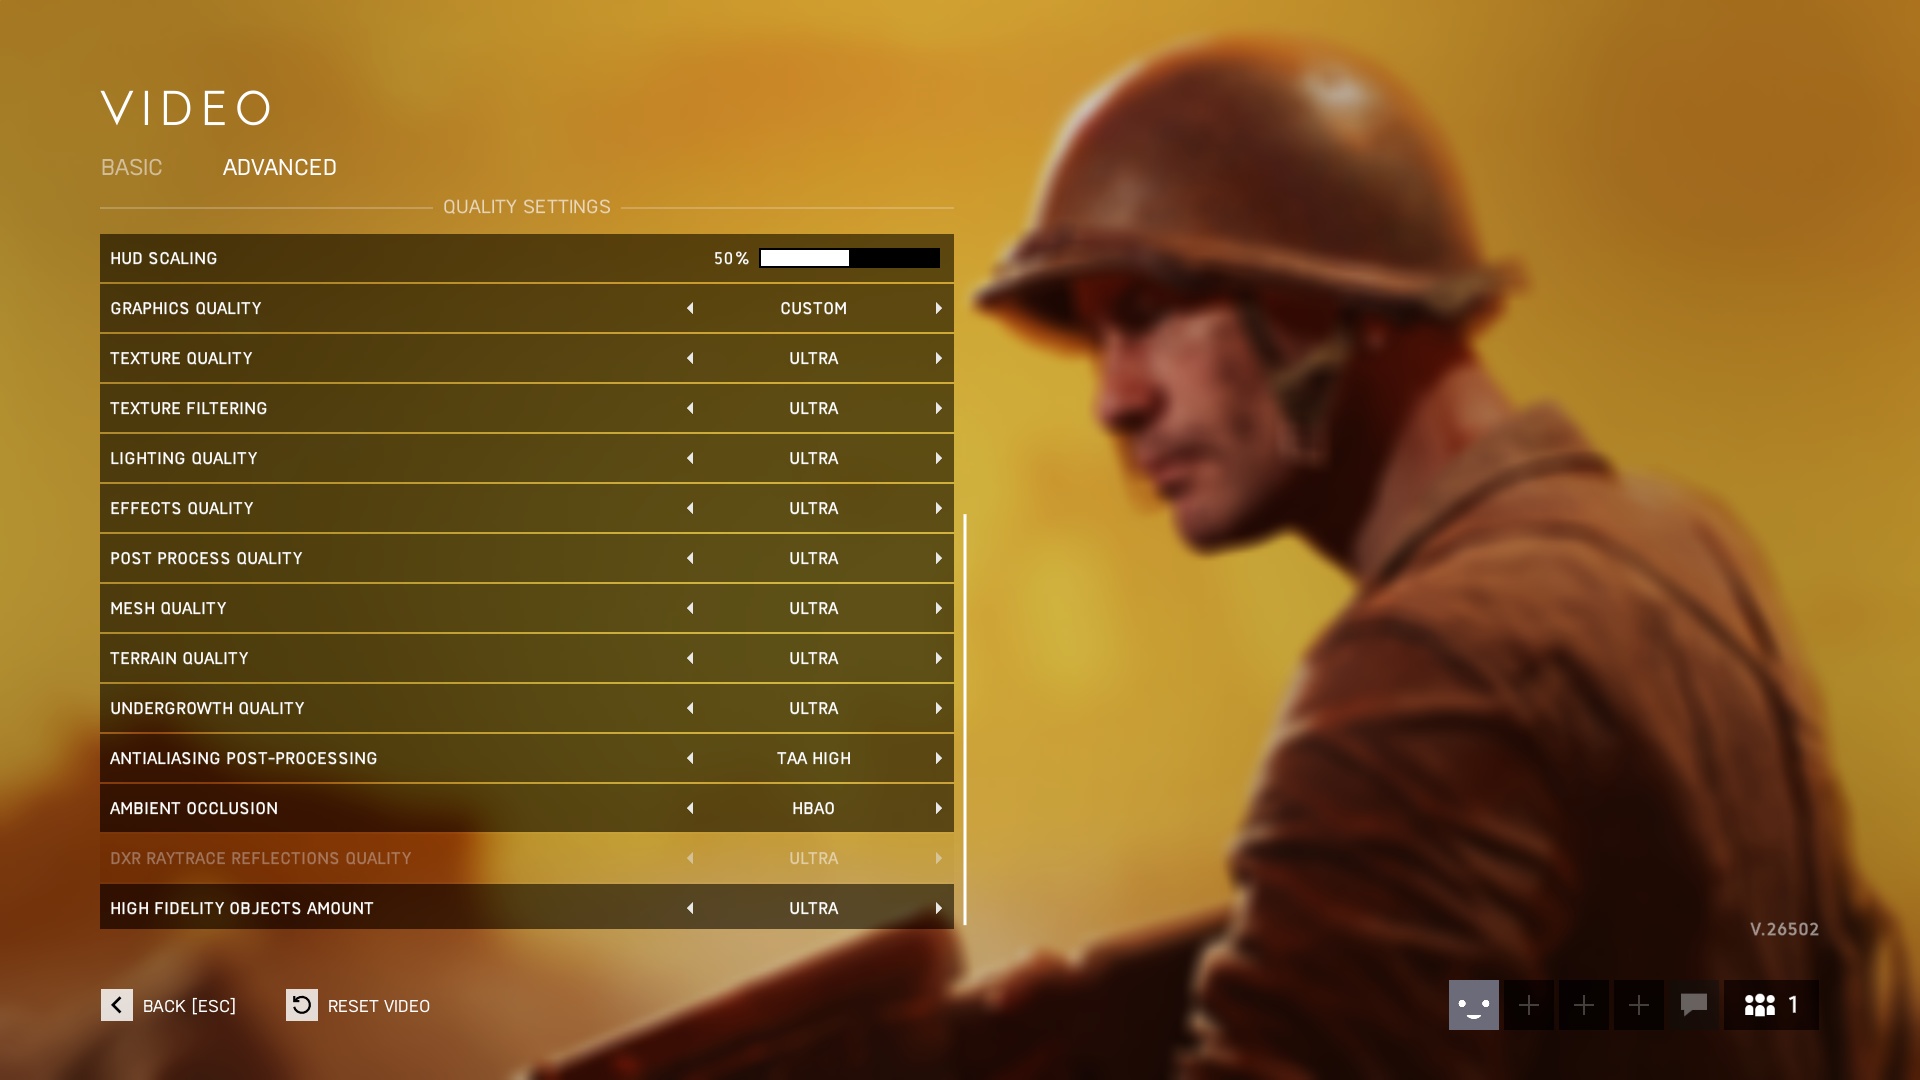
Battlefield V
Test platform custom scene (War stories/Under no flag); API DirectX 12, graphics settings preset Ultra; TAA high; no extra settings.
No compromises in performance! If this is your motto, then you cannot miss the test of the graphics card GeForce RTX 3090. It will also feed 4K resolution, has the fastest ray tracing and OptiX acceleration, huge video memory and, the review sample from MSI also has many more attractive features. The biggest drawback, as is usual with high-end hardware, is the price. It is really high.
Battlefield V with DXR
Test platform custom scene (War stories/Under no flag); API DirectX 12, graphics settings preset Ultra; TAA high; extra settings DXR.

Note: This game also supports DLSS, but since this is an older title and there are more than enough tests, we will not address this setting in standard tests. However, some testing on request is possible if you ask for it.
No compromises in performance! If this is your motto, then you cannot miss the test of the graphics card GeForce RTX 3090. It will also feed 4K resolution, has the fastest ray tracing and OptiX acceleration, huge video memory and, the review sample from MSI also has many more attractive features. The biggest drawback, as is usual with high-end hardware, is the price. It is really high.
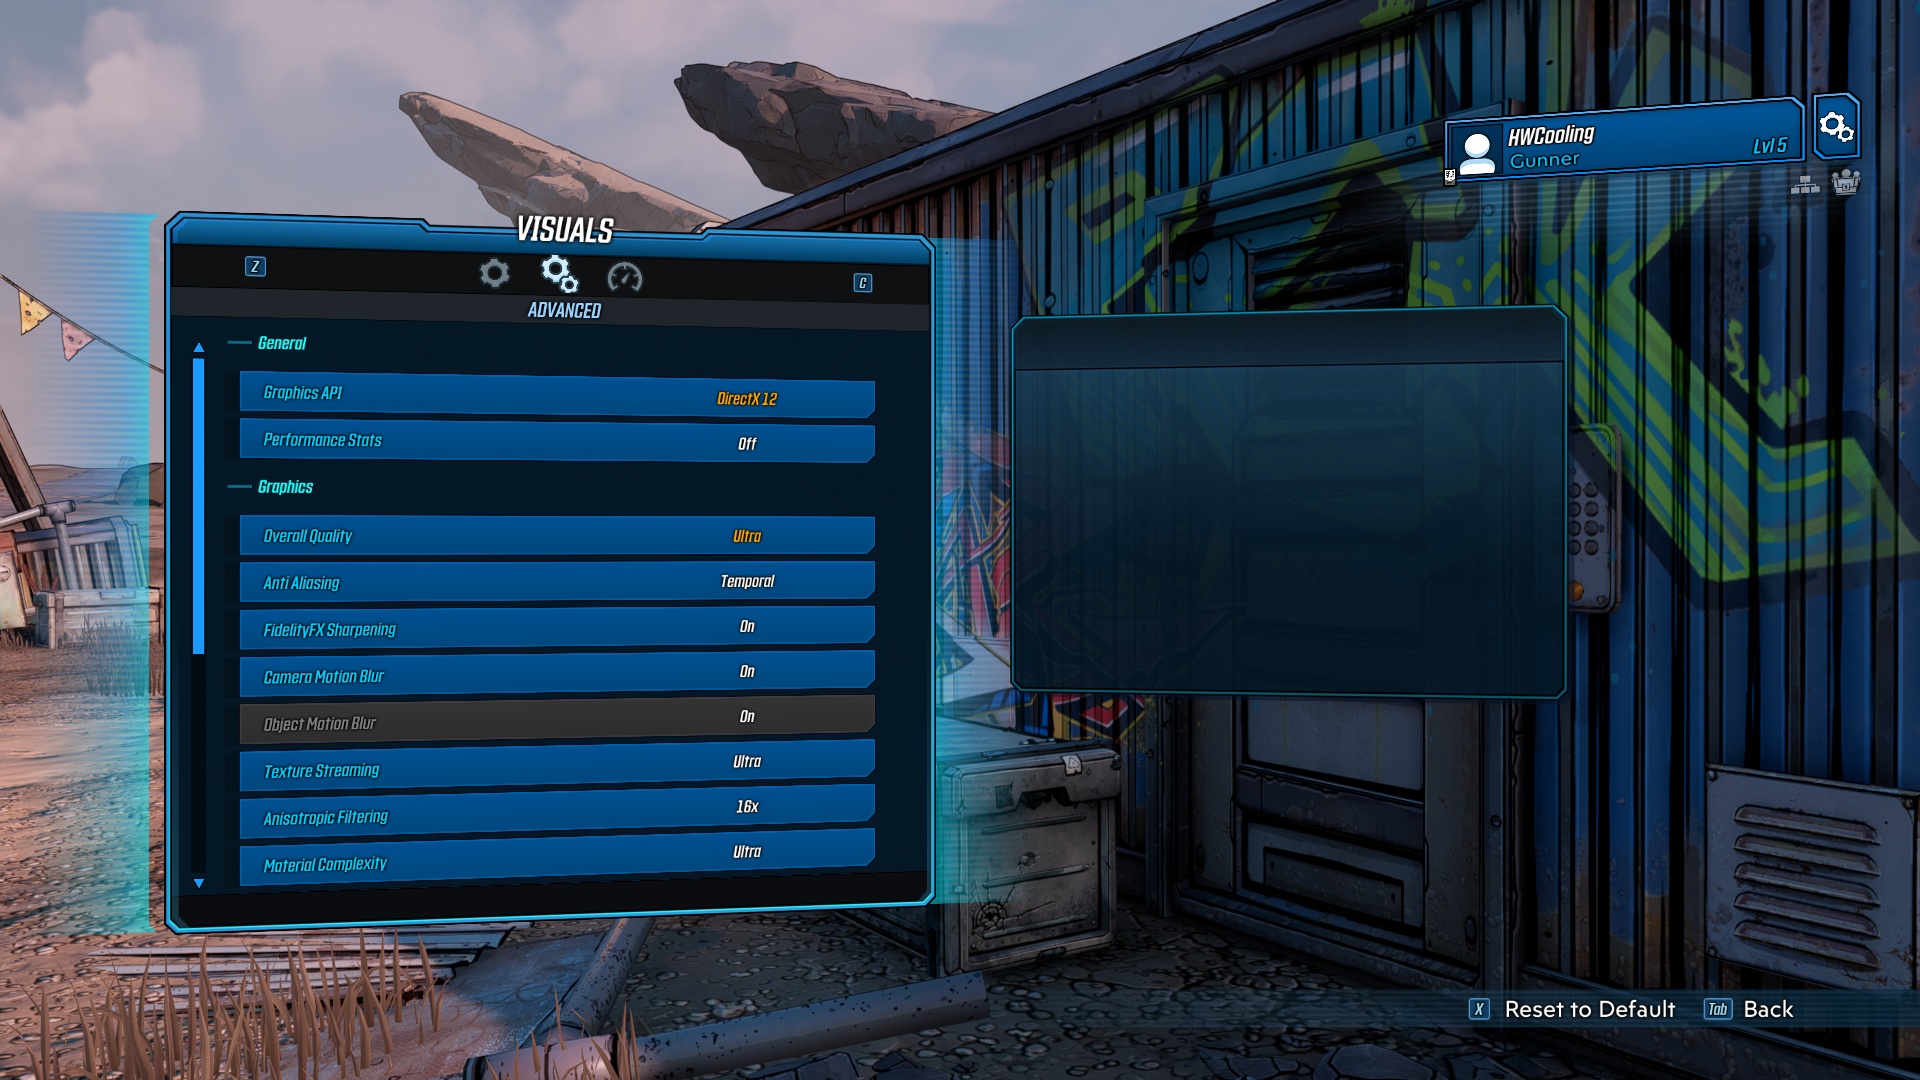
Borderlands 3
Test platform benchmark; API DirectX 12, graphics settings preset Ultra; TAA; no extra settings.


No compromises in performance! If this is your motto, then you cannot miss the test of the graphics card GeForce RTX 3090. It will also feed 4K resolution, has the fastest ray tracing and OptiX acceleration, huge video memory and, the review sample from MSI also has many more attractive features. The biggest drawback, as is usual with high-end hardware, is the price. It is really high.
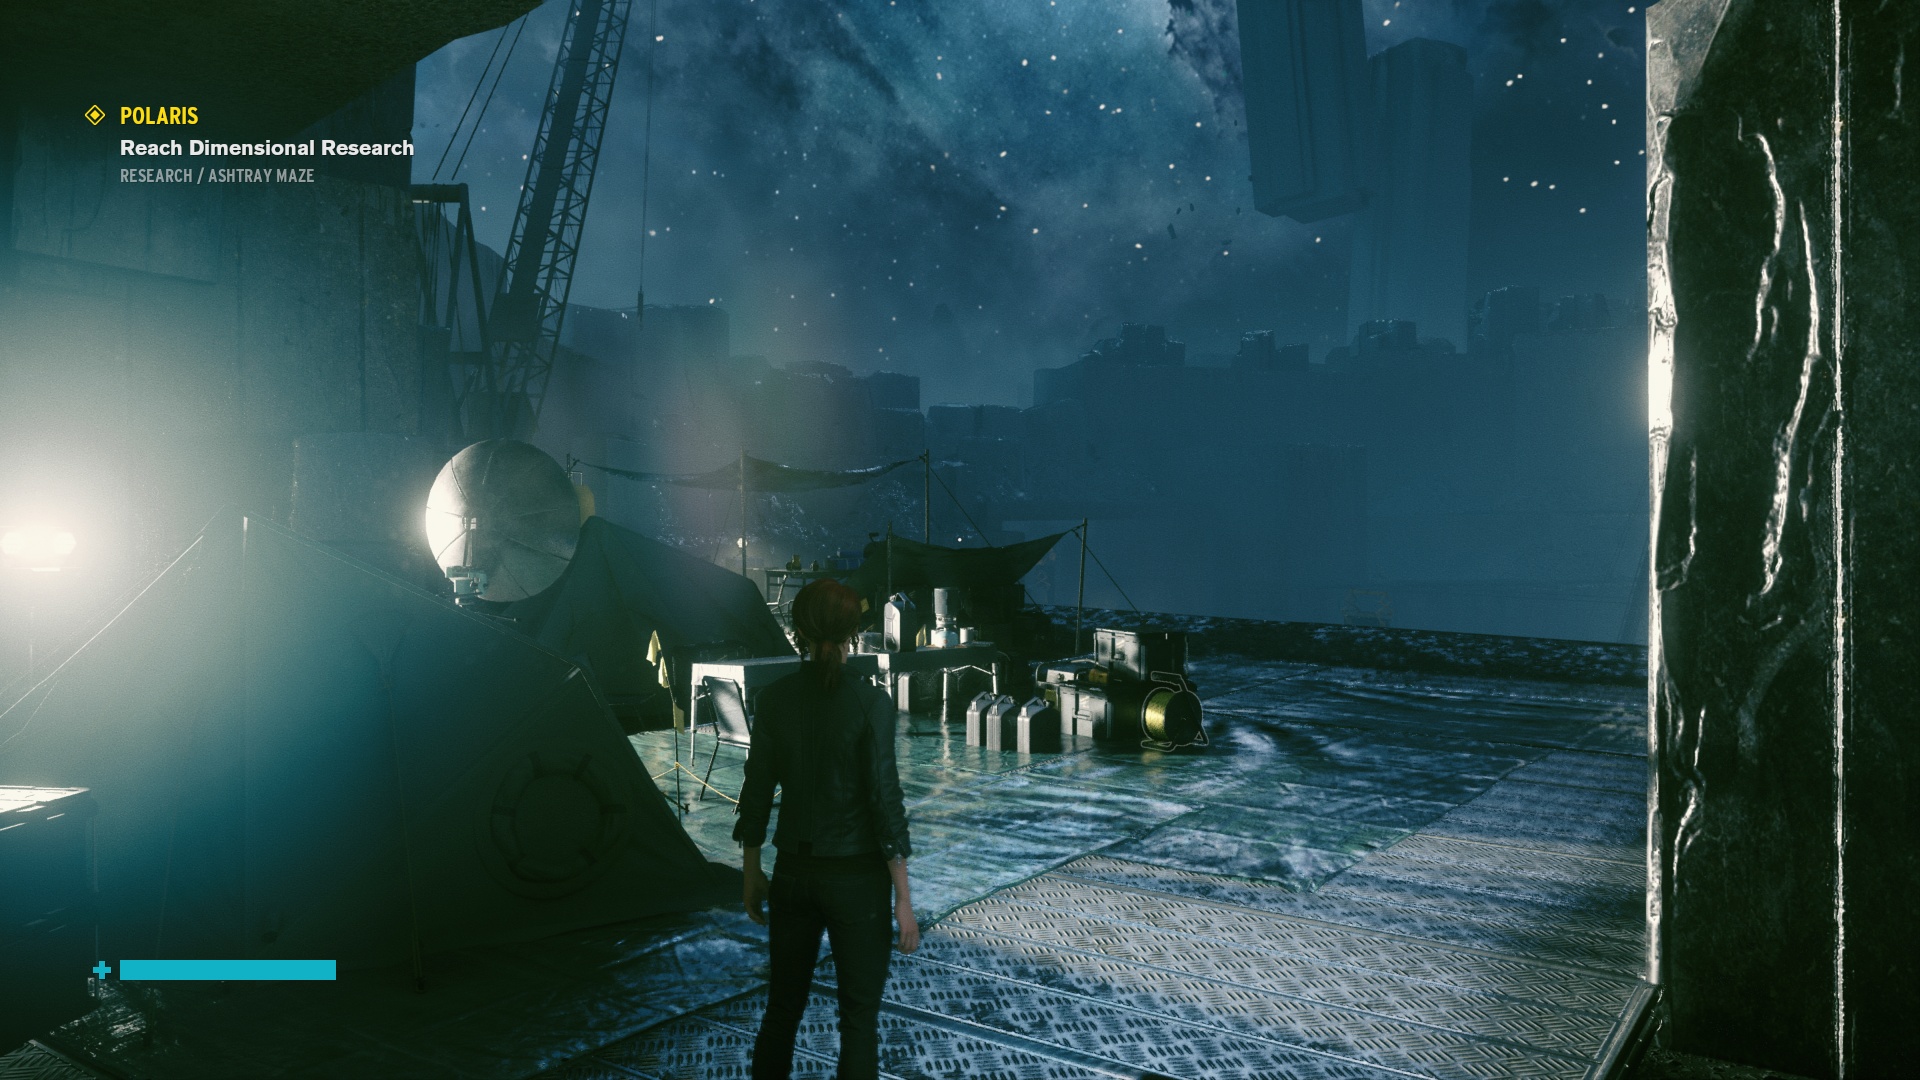
Control
Test platform custom scene (chapter Polaris); API DirectX 11, graphics settings preset High; no extra settings.
No compromises in performance! If this is your motto, then you cannot miss the test of the graphics card GeForce RTX 3090. It will also feed 4K resolution, has the fastest ray tracing and OptiX acceleration, huge video memory and, the review sample from MSI also has many more attractive features. The biggest drawback, as is usual with high-end hardware, is the price. It is really high.
Control with DXR and DLSS
Test platform custom scene (chapter Polaris); API DirectX 12, graphics settings preset High; extra settings DXR.

DXR (native)
DXR with DLSS (performance)
No compromises in performance! If this is your motto, then you cannot miss the test of the graphics card GeForce RTX 3090. It will also feed 4K resolution, has the fastest ray tracing and OptiX acceleration, huge video memory and, the review sample from MSI also has many more attractive features. The biggest drawback, as is usual with high-end hardware, is the price. It is really high.
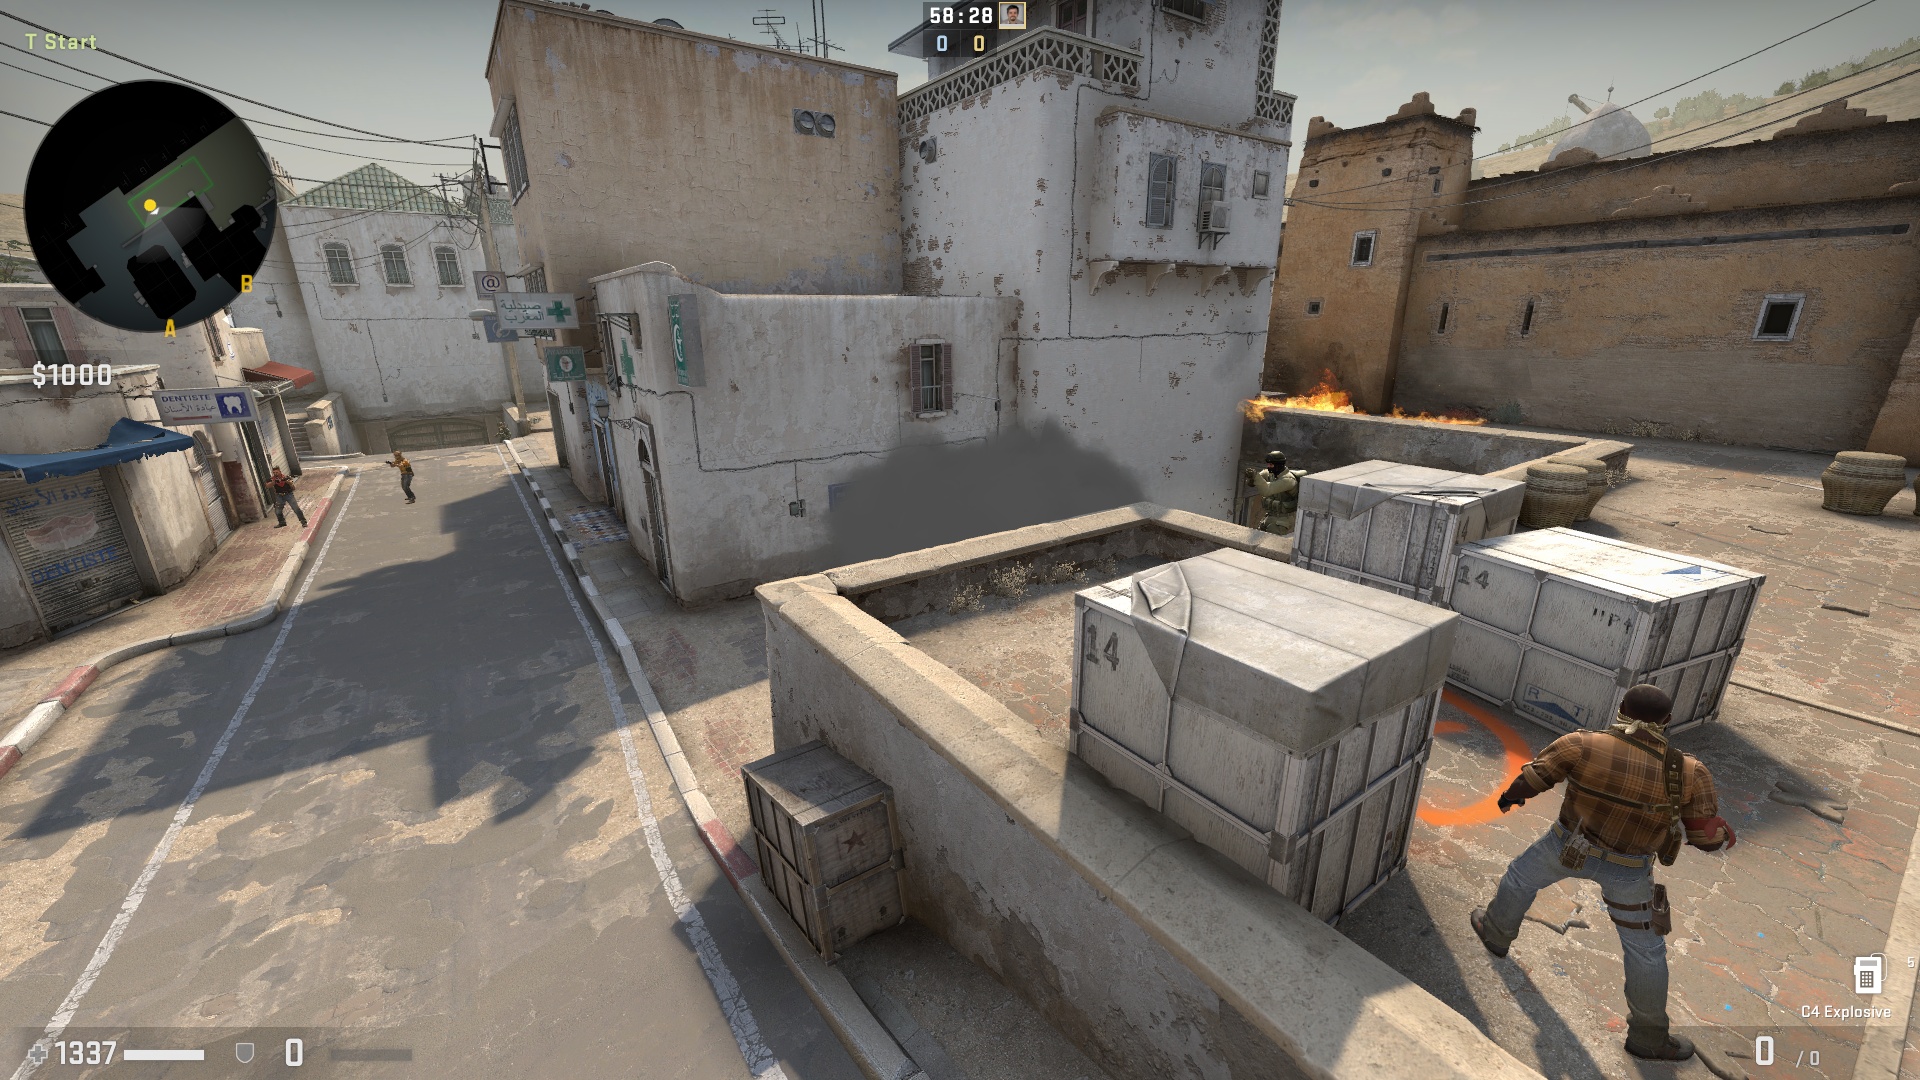
Counter-Strike: GO
Test platform benchmark (Dust 2 map tour); API DirectX 9, graphics settings preset High; 4× MSAA; no extra settings.
No compromises in performance! If this is your motto, then you cannot miss the test of the graphics card GeForce RTX 3090. It will also feed 4K resolution, has the fastest ray tracing and OptiX acceleration, huge video memory and, the review sample from MSI also has many more attractive features. The biggest drawback, as is usual with high-end hardware, is the price. It is really high.
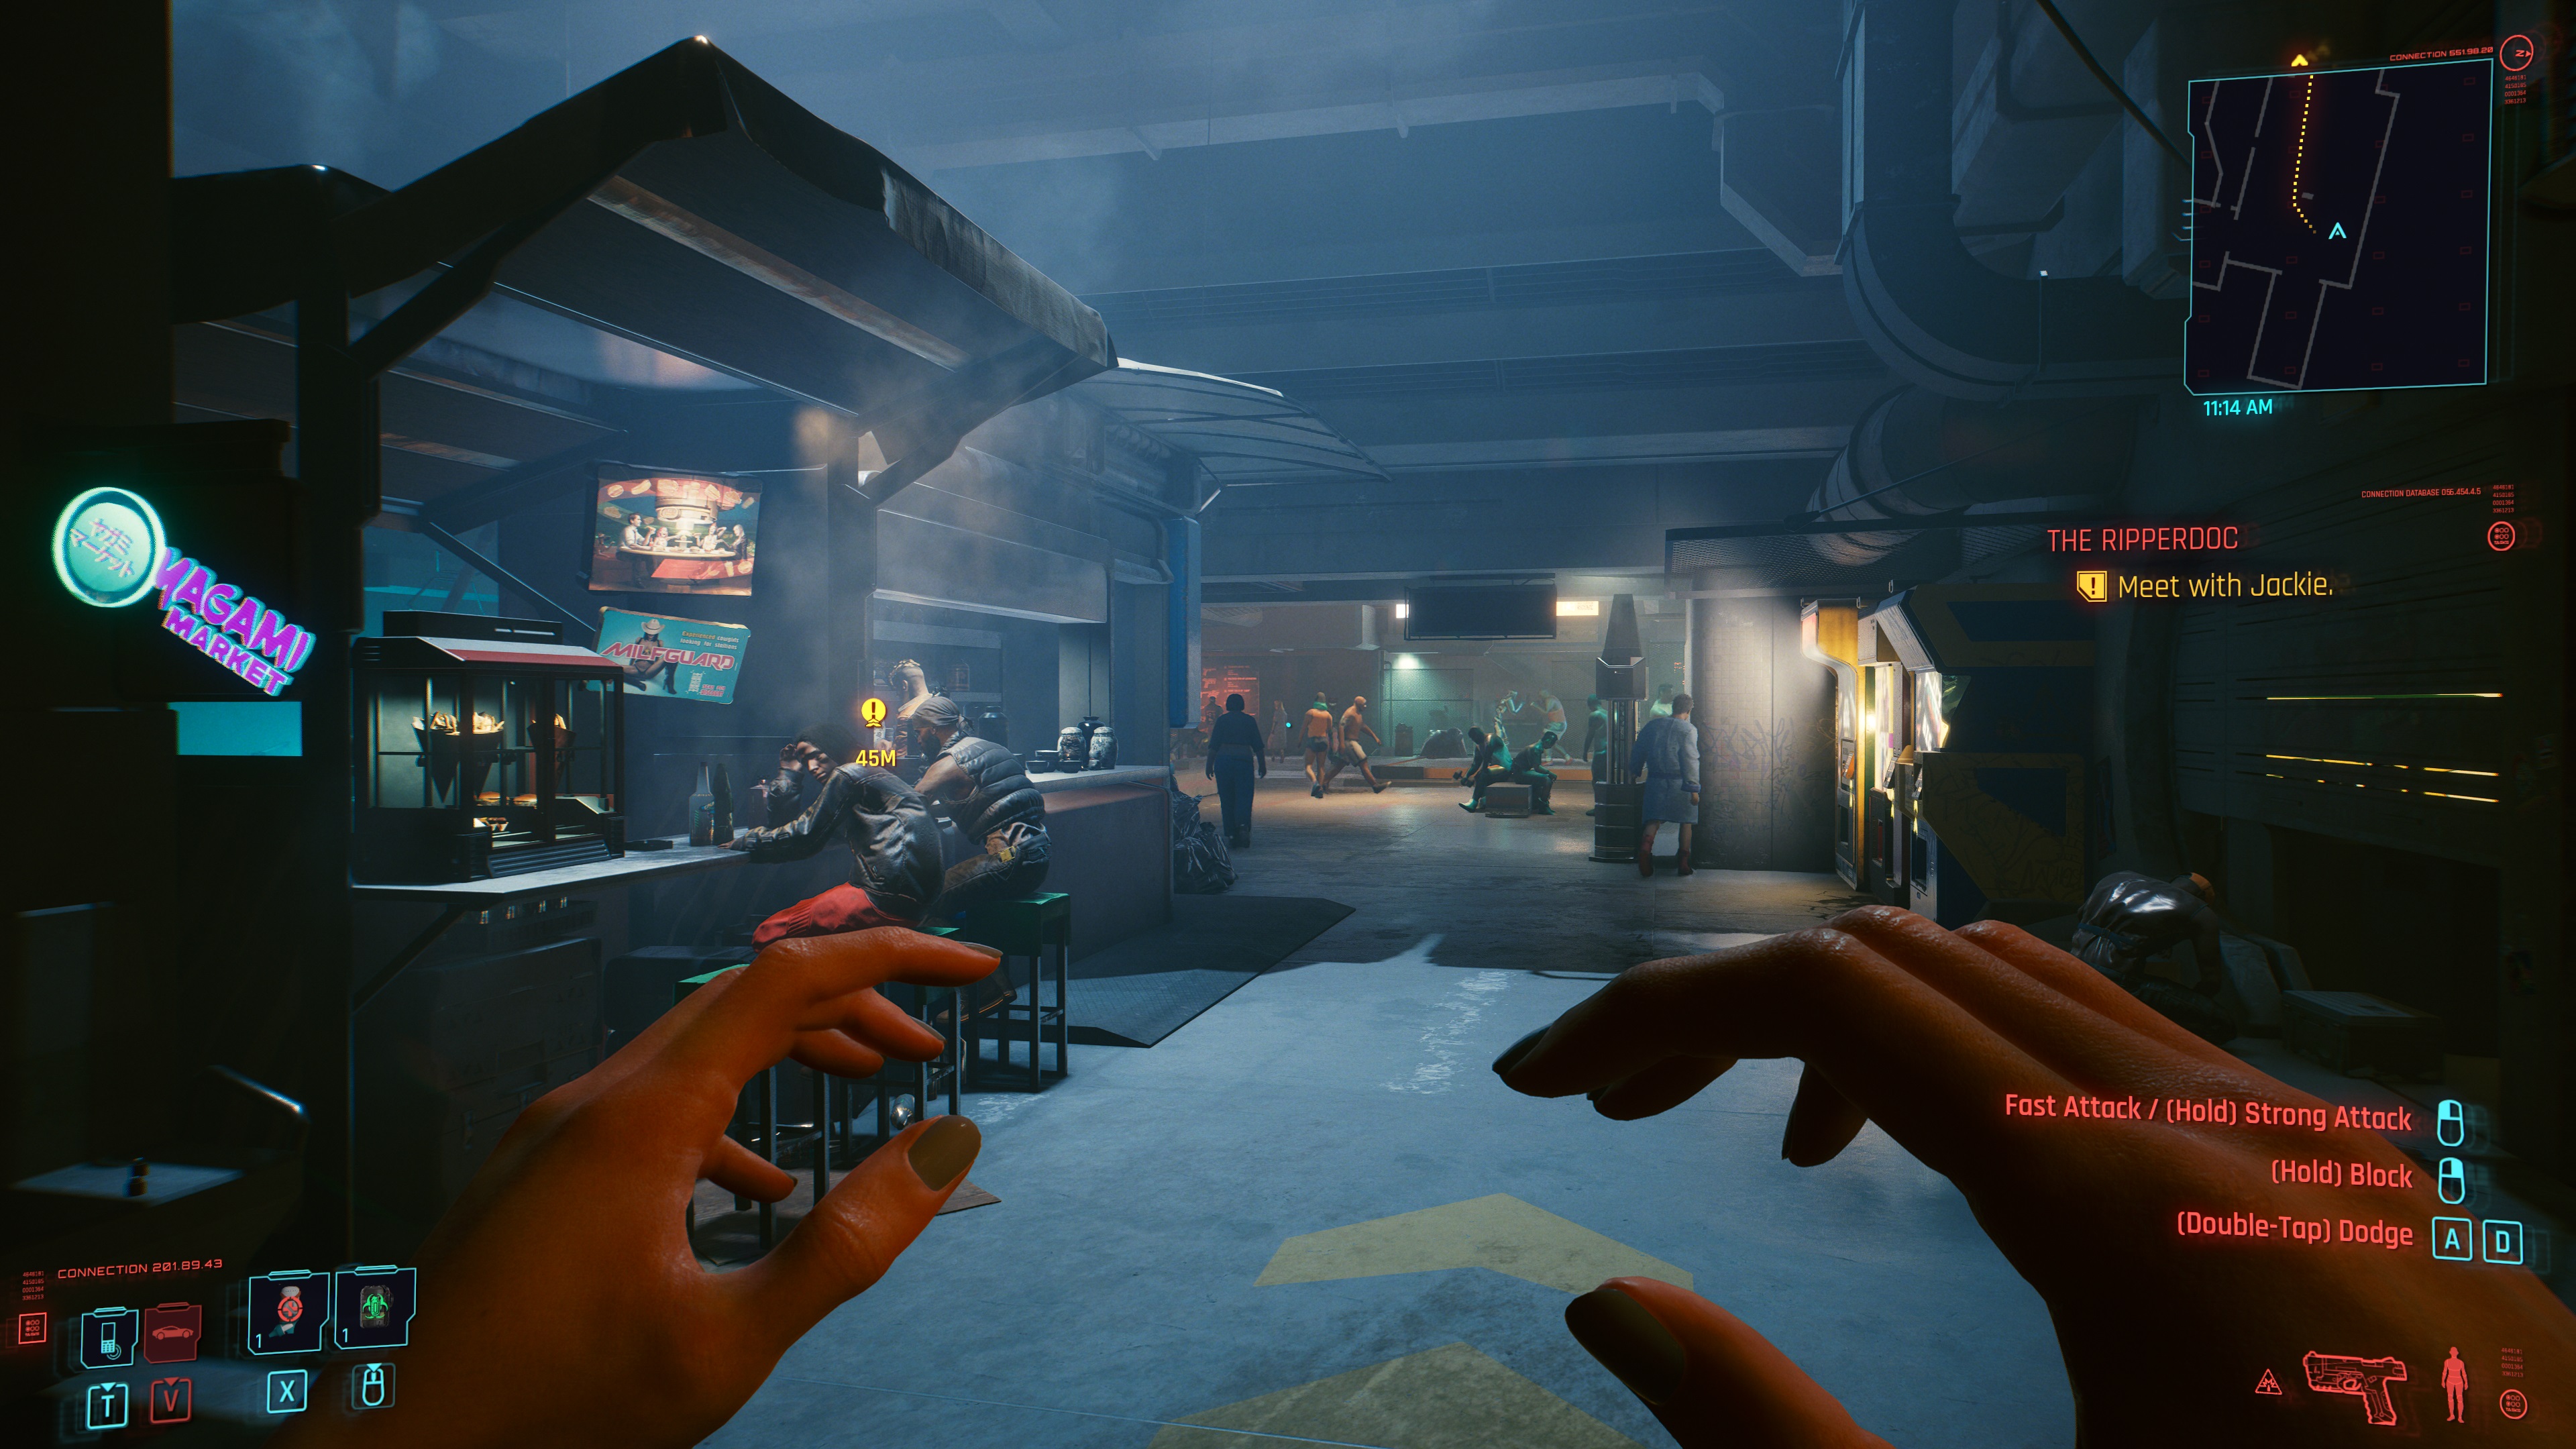
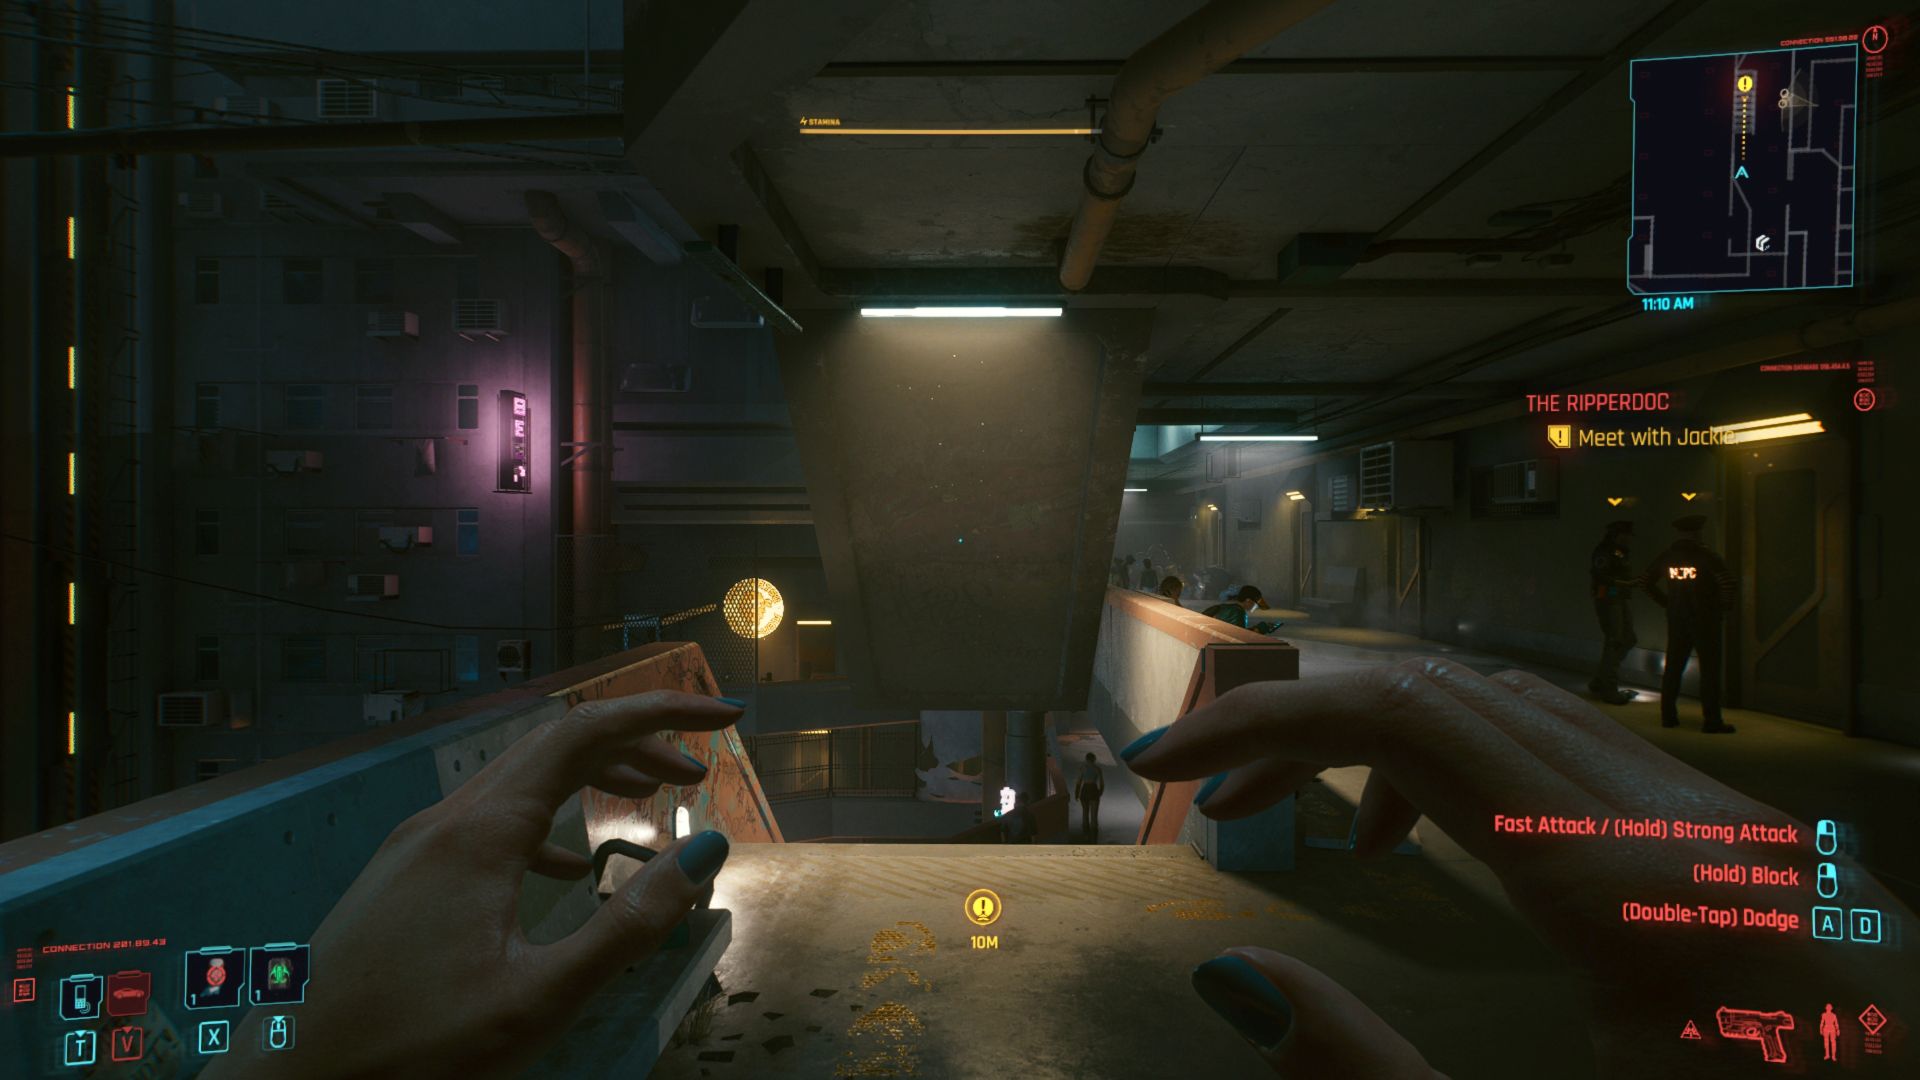
Cyberpunk 2077
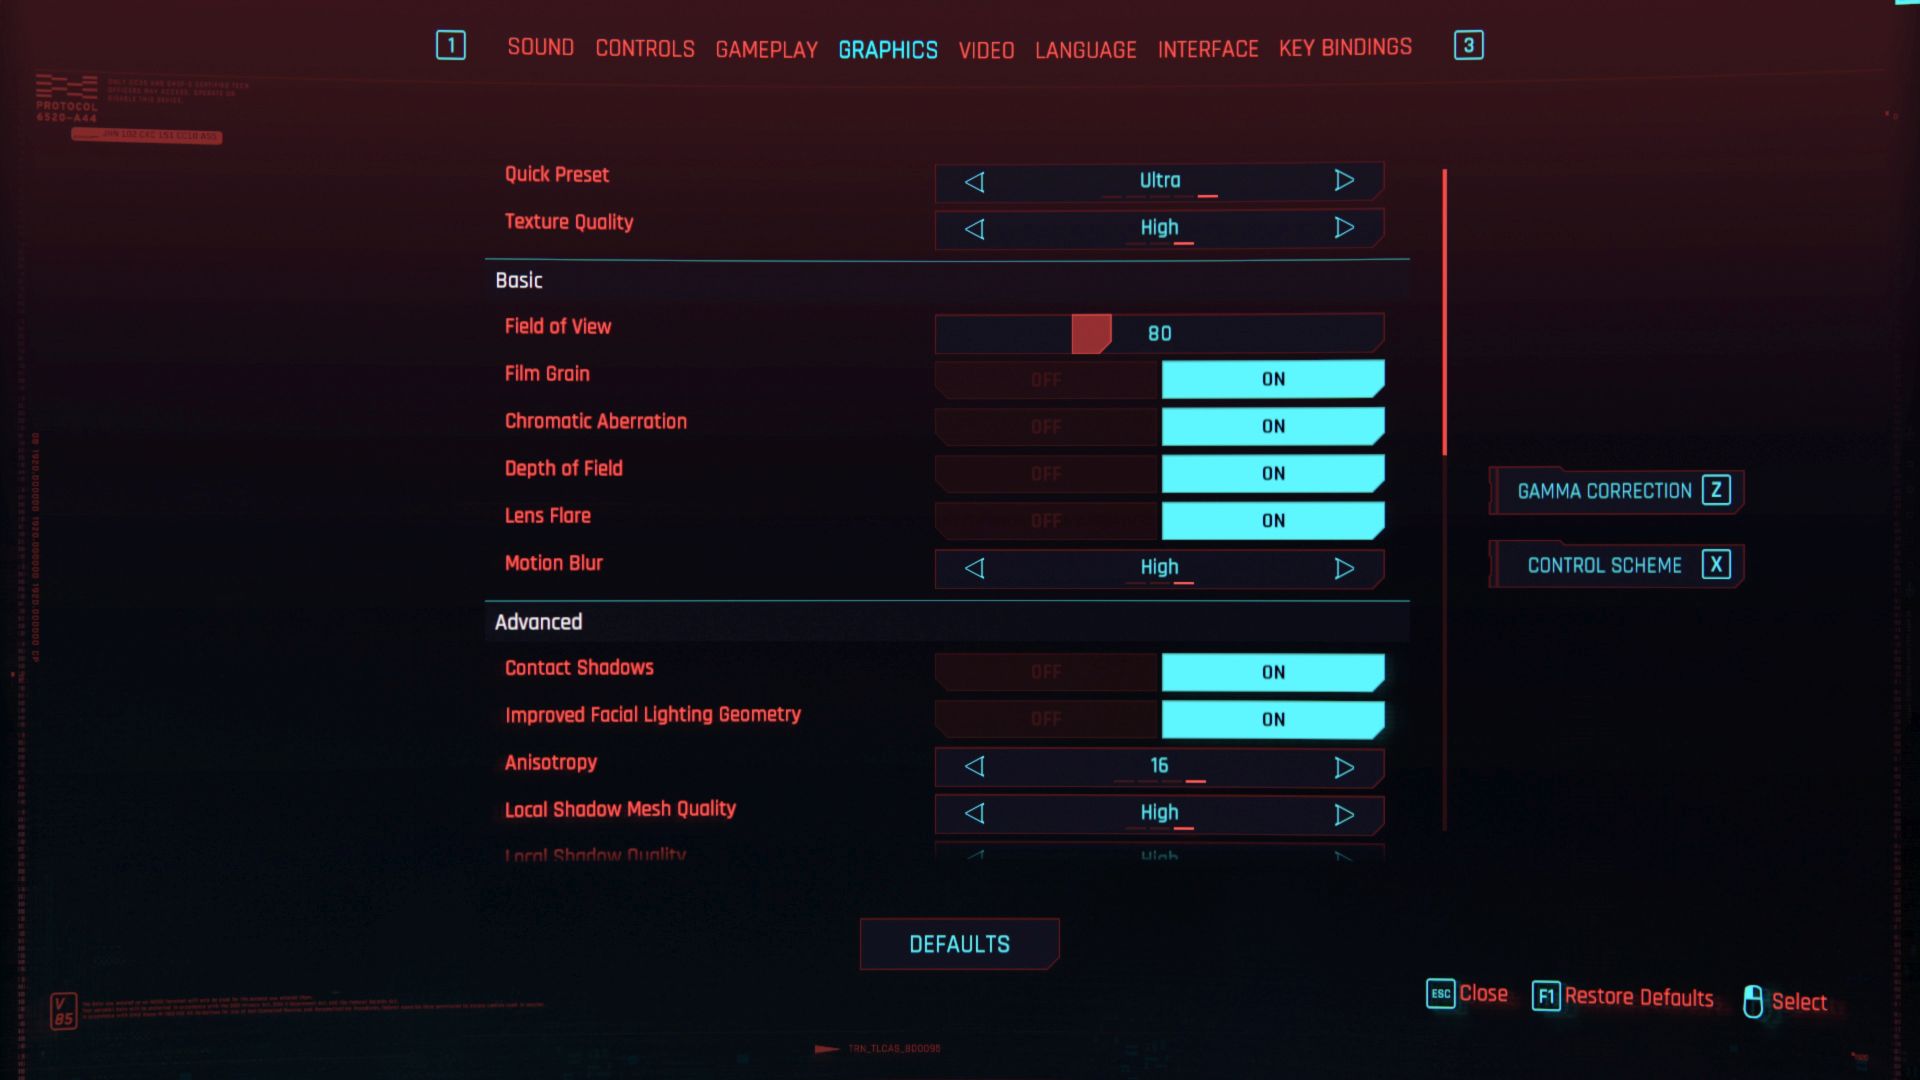
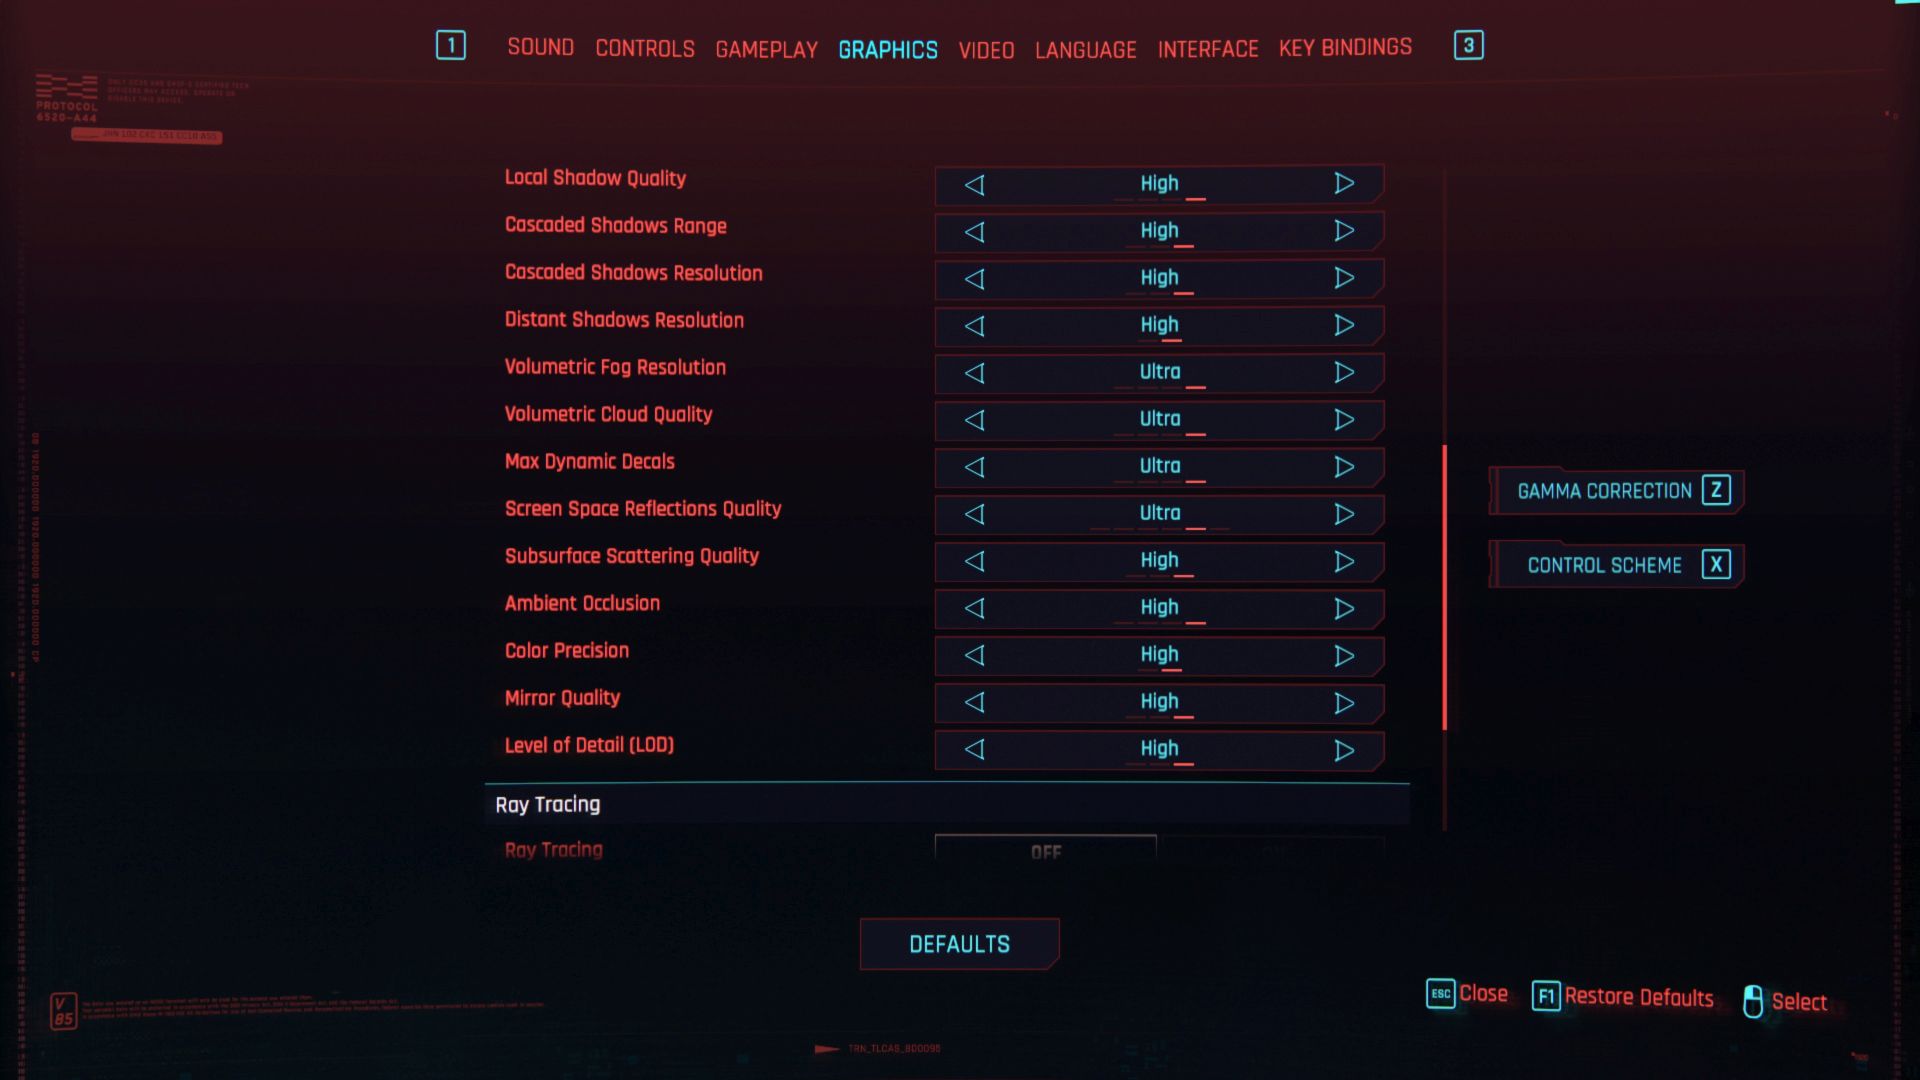
Test platform custom scene (Little China); API DirectX 12, graphics settings preset Ultra; no extra settings.
No compromises in performance! If this is your motto, then you cannot miss the test of the graphics card GeForce RTX 3090. It will also feed 4K resolution, has the fastest ray tracing and OptiX acceleration, huge video memory and, the review sample from MSI also has many more attractive features. The biggest drawback, as is usual with high-end hardware, is the price. It is really high.
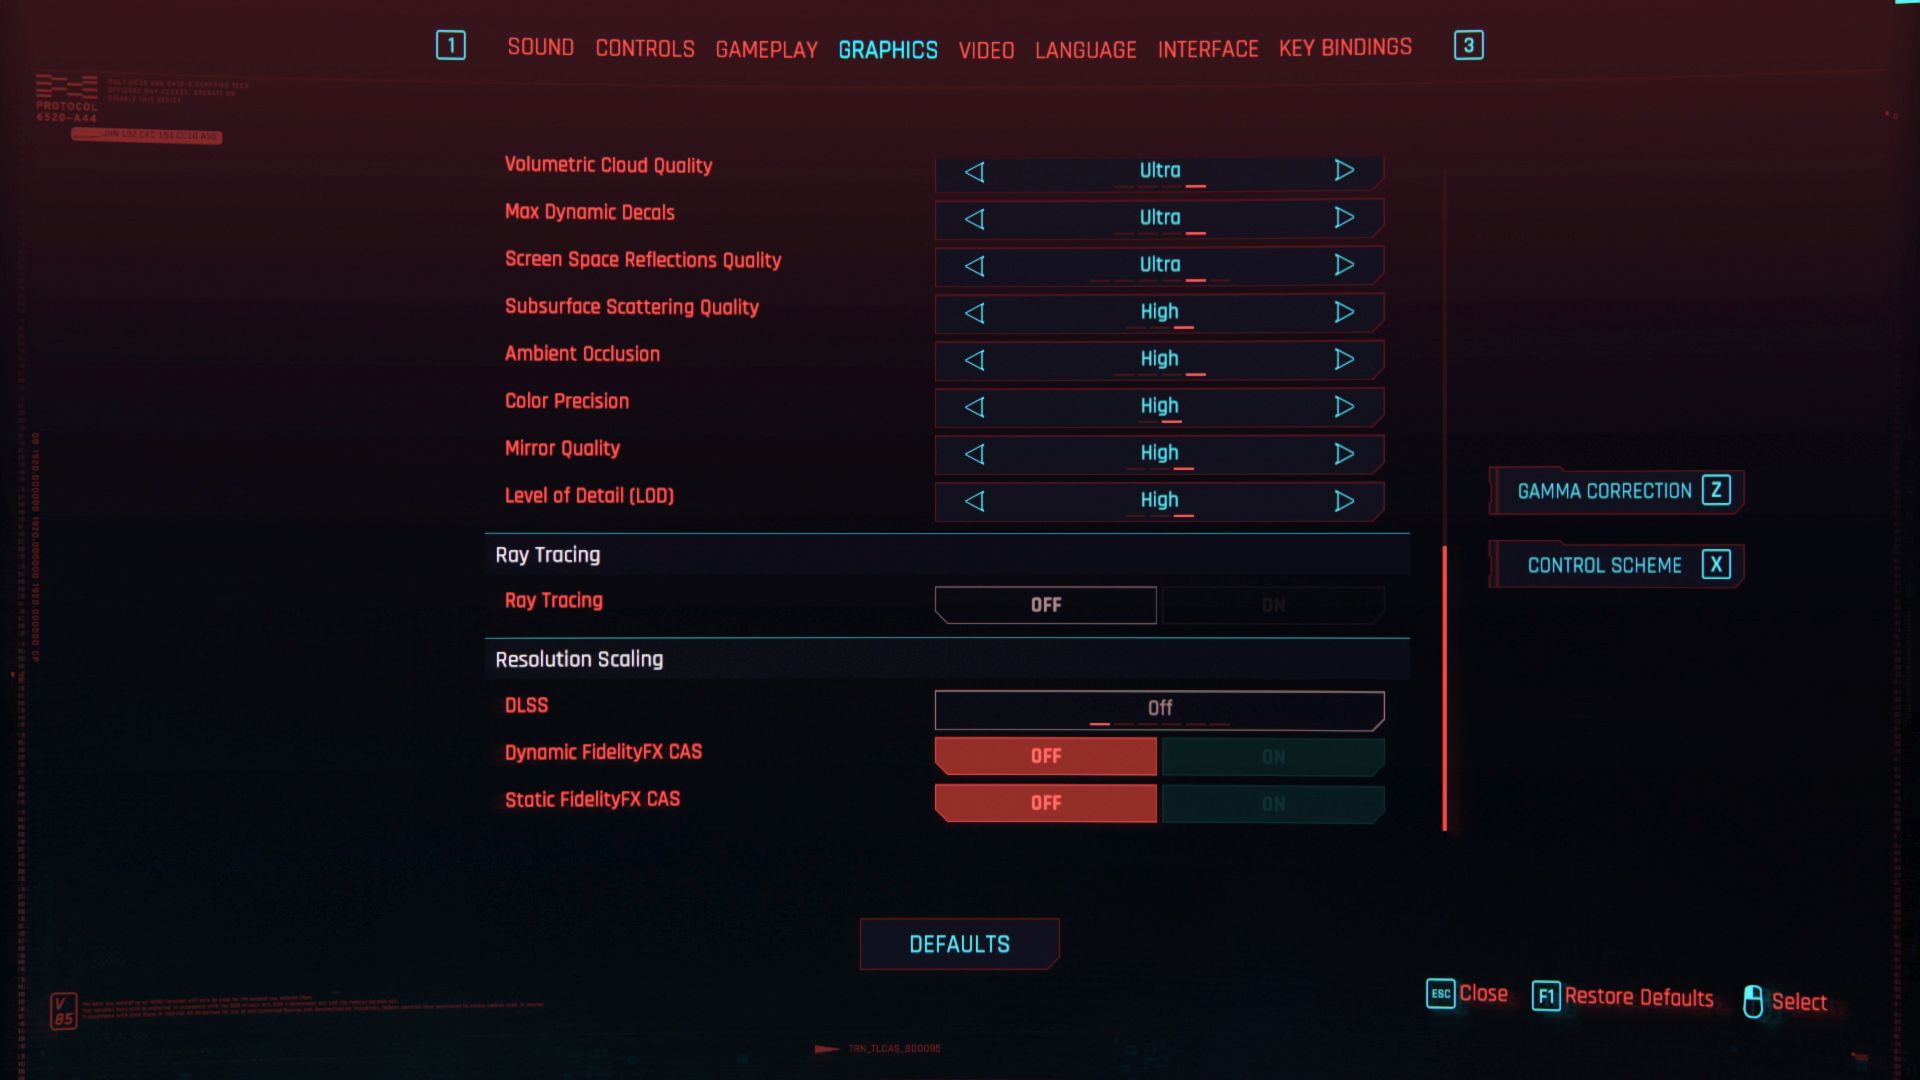
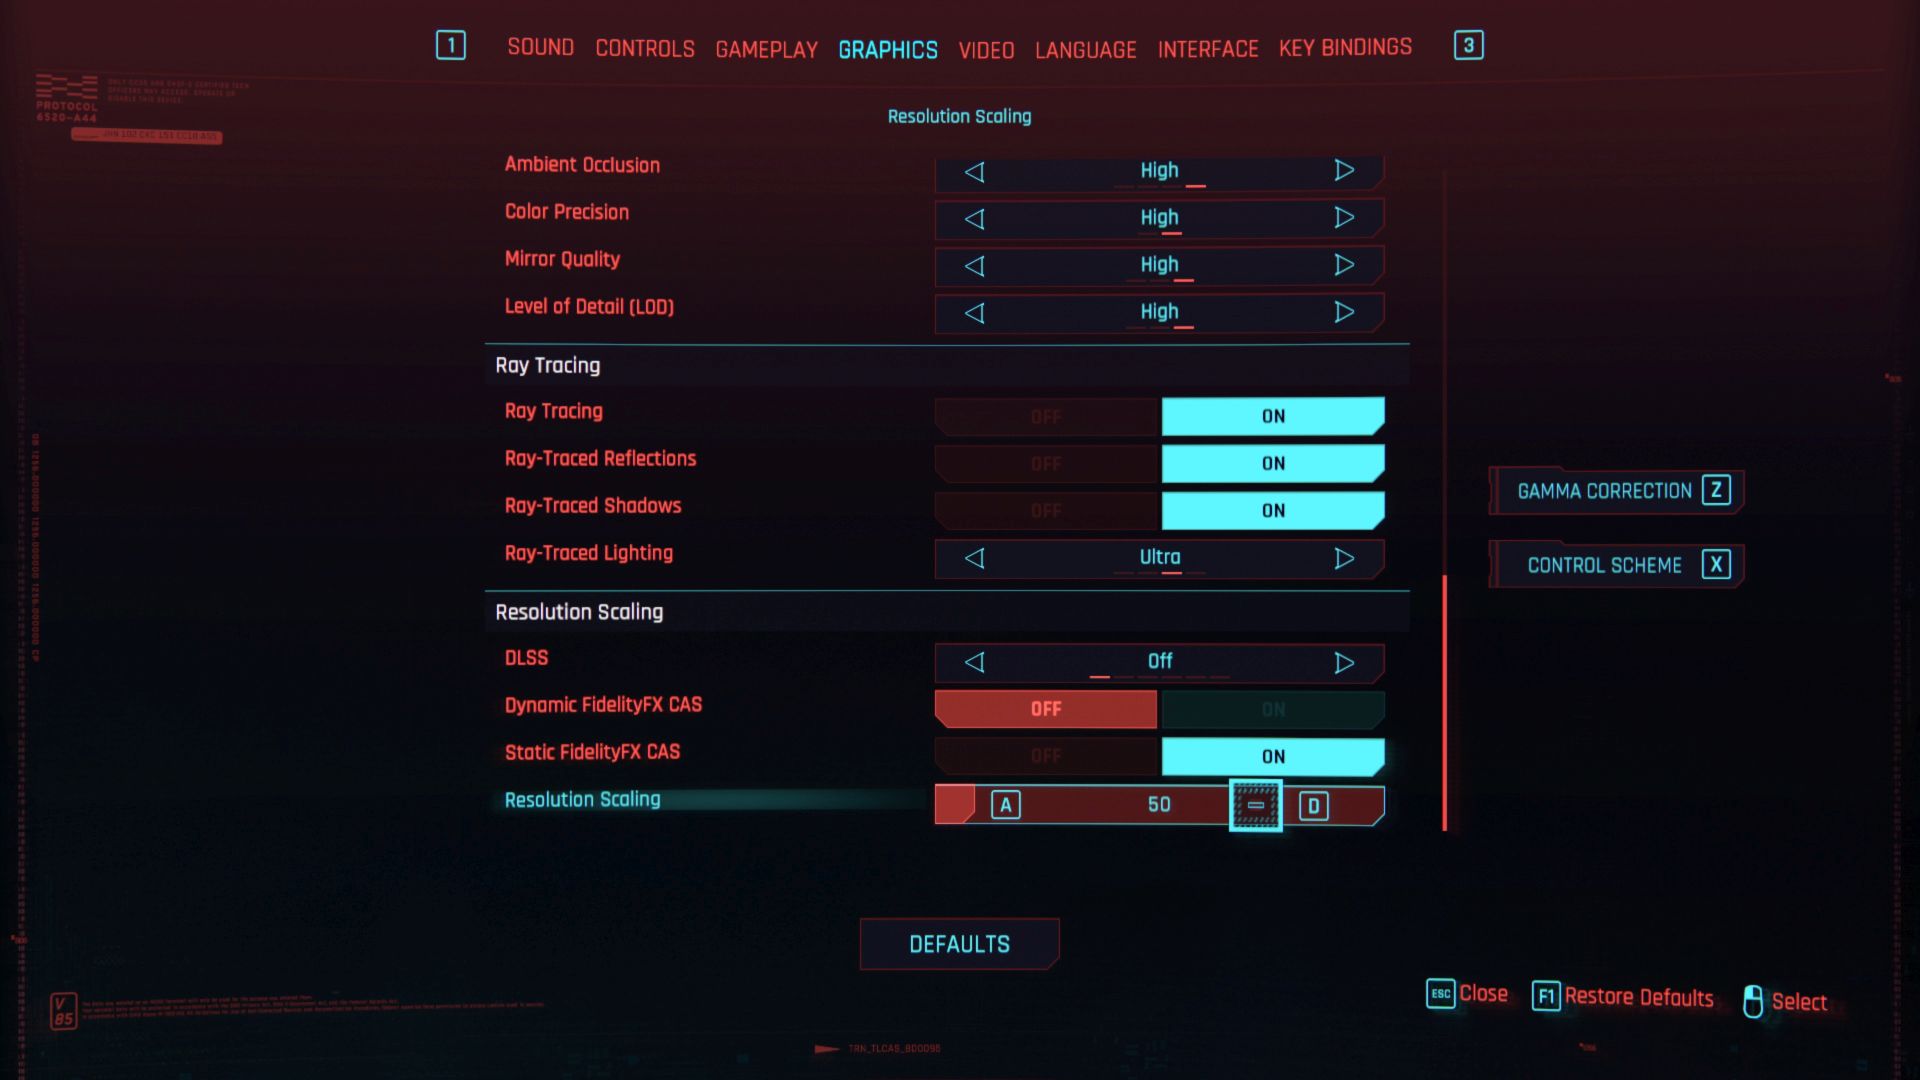
Cyberpunk 2077 with DLSS and FidelityFX CAS
Test platform custom scene (Little China); API DirectX 12, graphics settings preset Ultra; extra settings FidelityFX CAS.
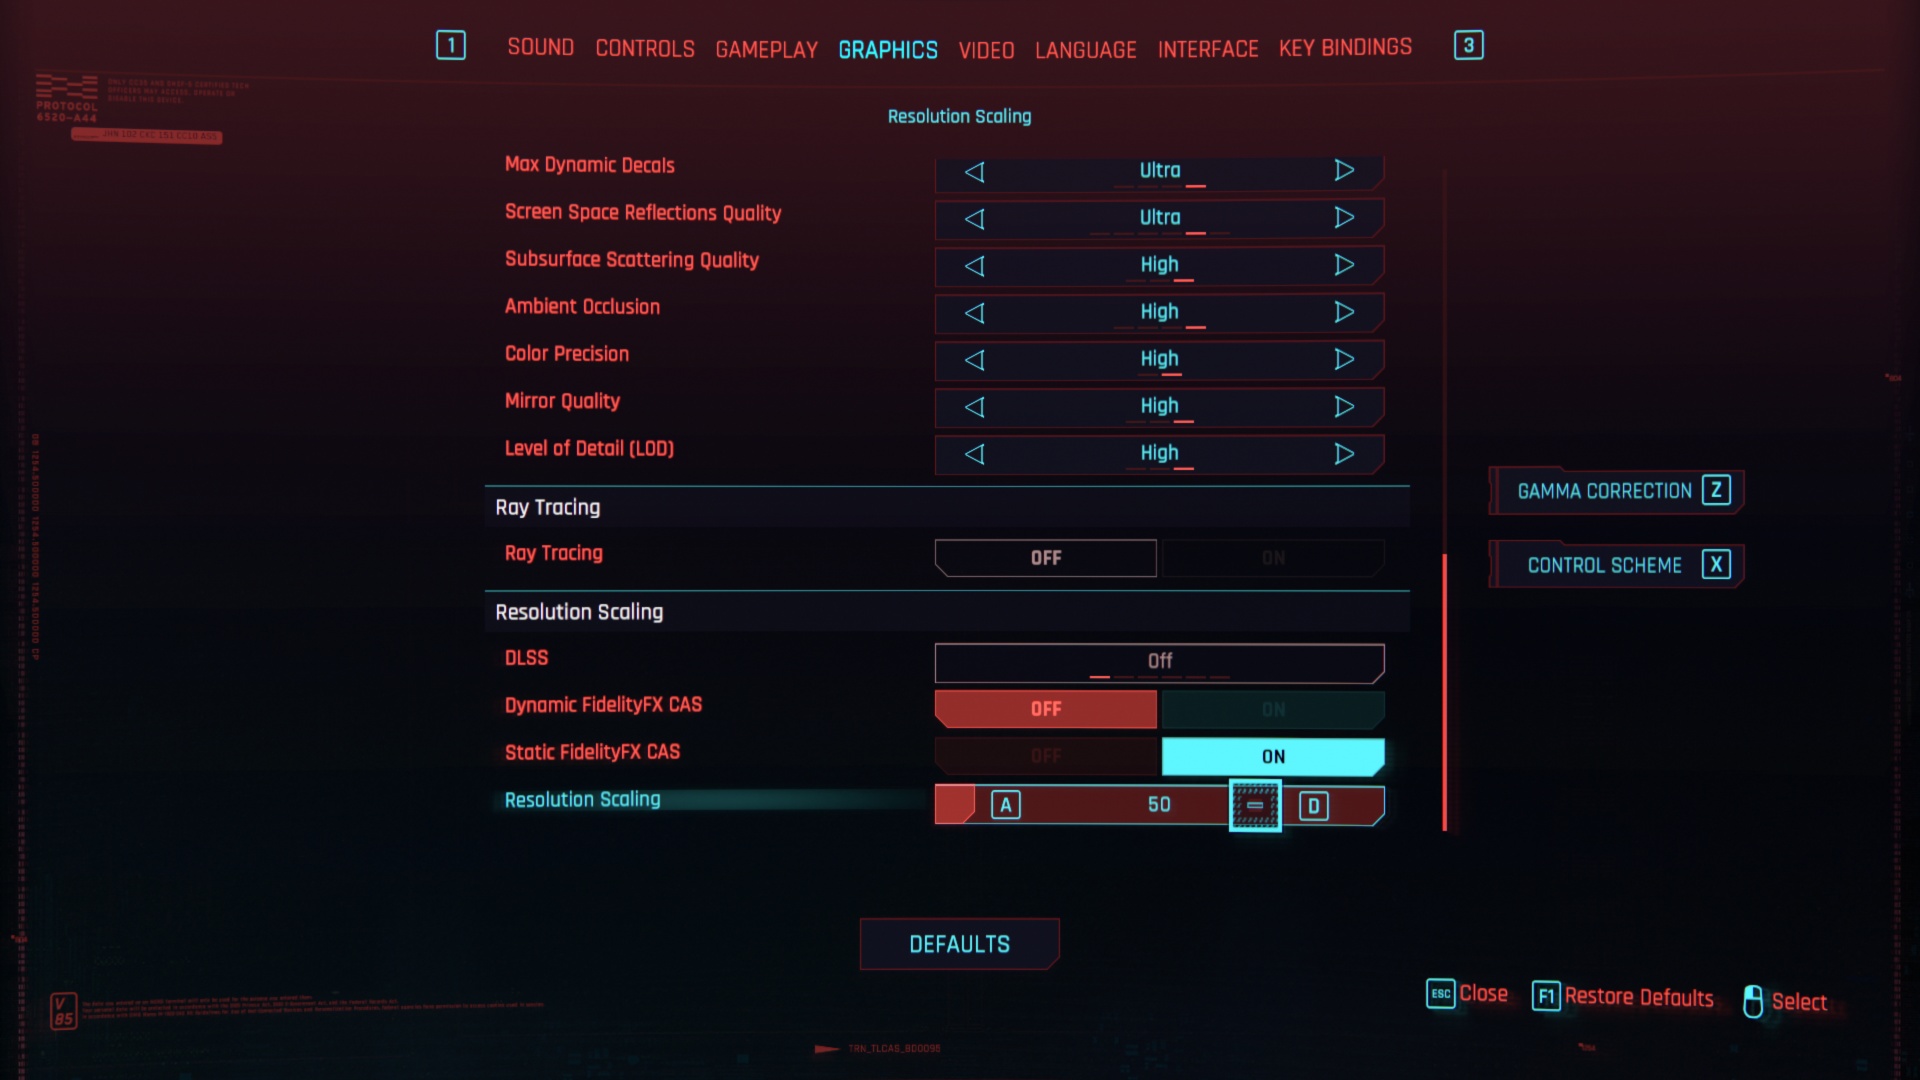
FidelityFX CAS (50 %)
DLSS (performance)
No compromises in performance! If this is your motto, then you cannot miss the test of the graphics card GeForce RTX 3090. It will also feed 4K resolution, has the fastest ray tracing and OptiX acceleration, huge video memory and, the review sample from MSI also has many more attractive features. The biggest drawback, as is usual with high-end hardware, is the price. It is really high.
Cyberpunk 2077 with DXR, DLSS and FidelityFX CAS
Test platform custom scene (Little China); API DirectX 12, graphics settings preset Ultra; extra settings DXR with DLSS and FidelityFX CAS.
DXR
DXR with DLSS (performance)
DXR with FidelityFX CAS (50 %)
No compromises in performance! If this is your motto, then you cannot miss the test of the graphics card GeForce RTX 3090. It will also feed 4K resolution, has the fastest ray tracing and OptiX acceleration, huge video memory and, the review sample from MSI also has many more attractive features. The biggest drawback, as is usual with high-end hardware, is the price. It is really high.
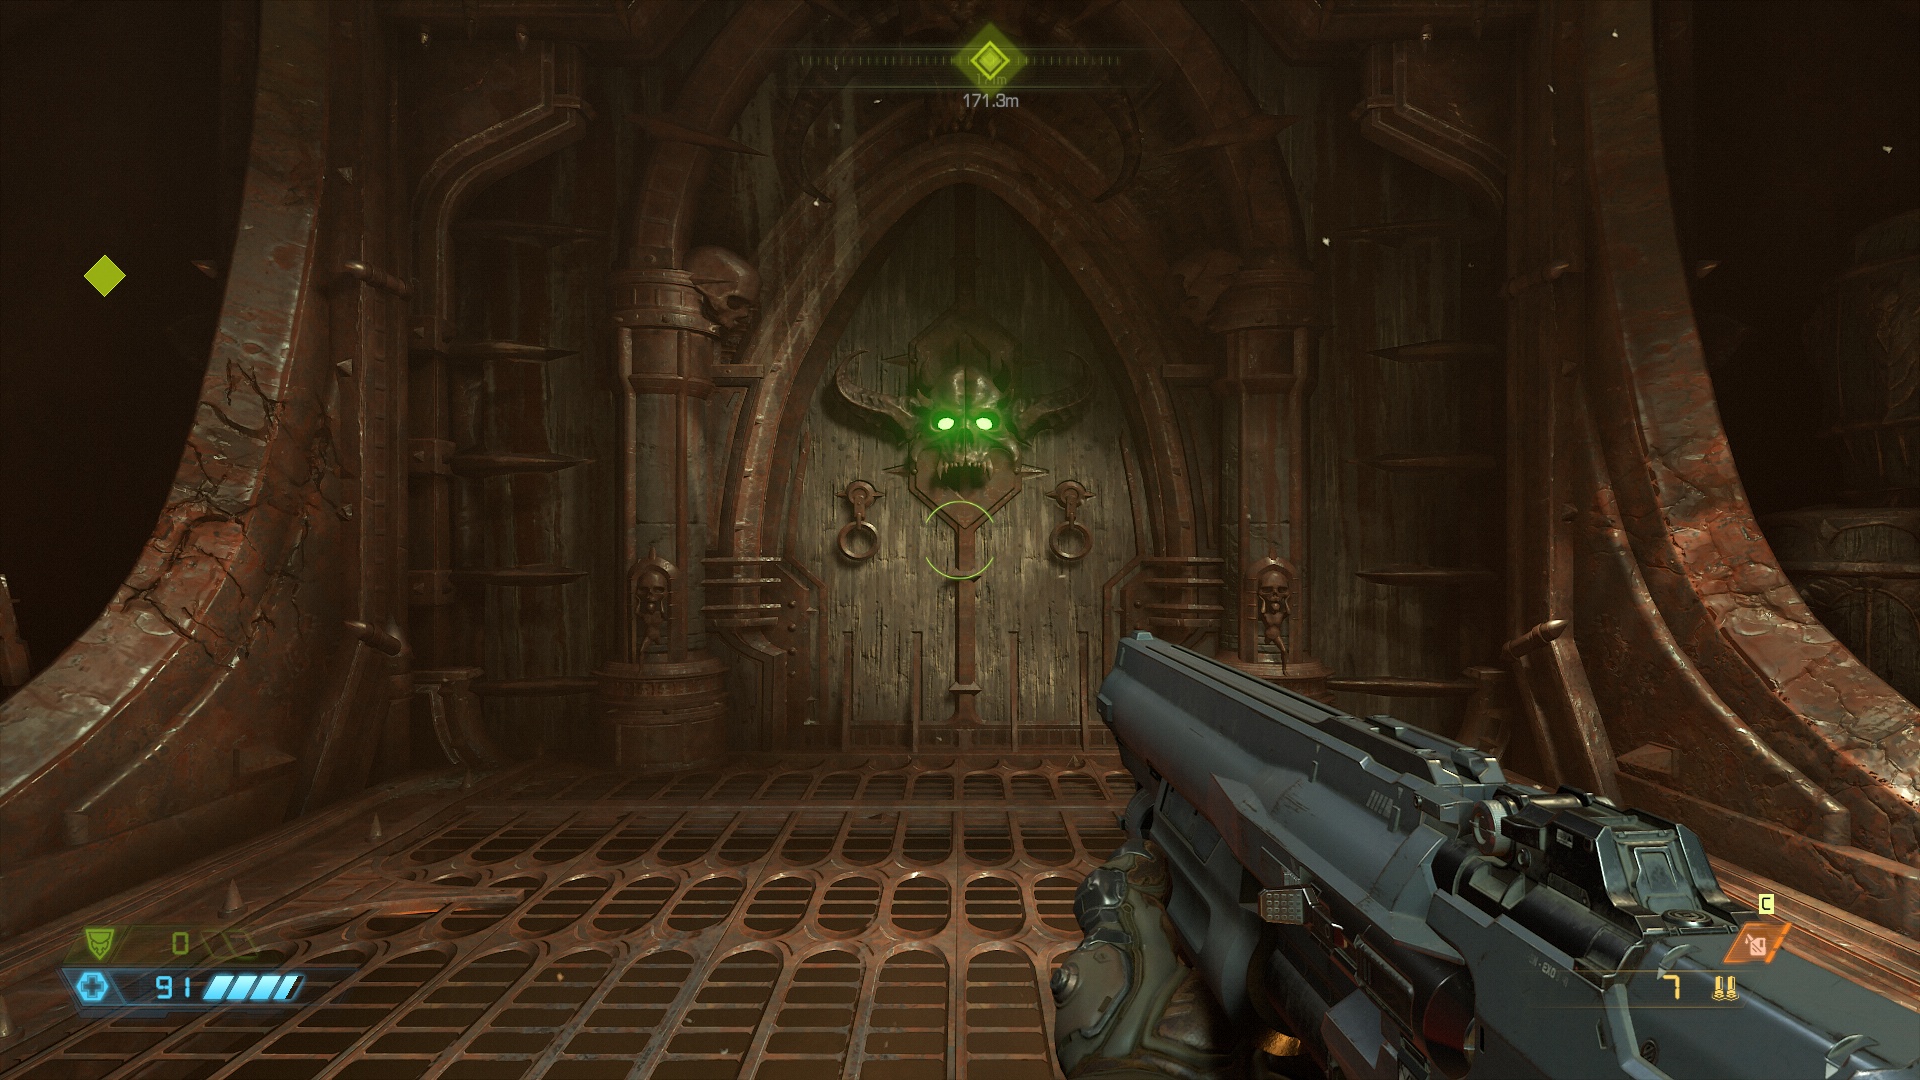
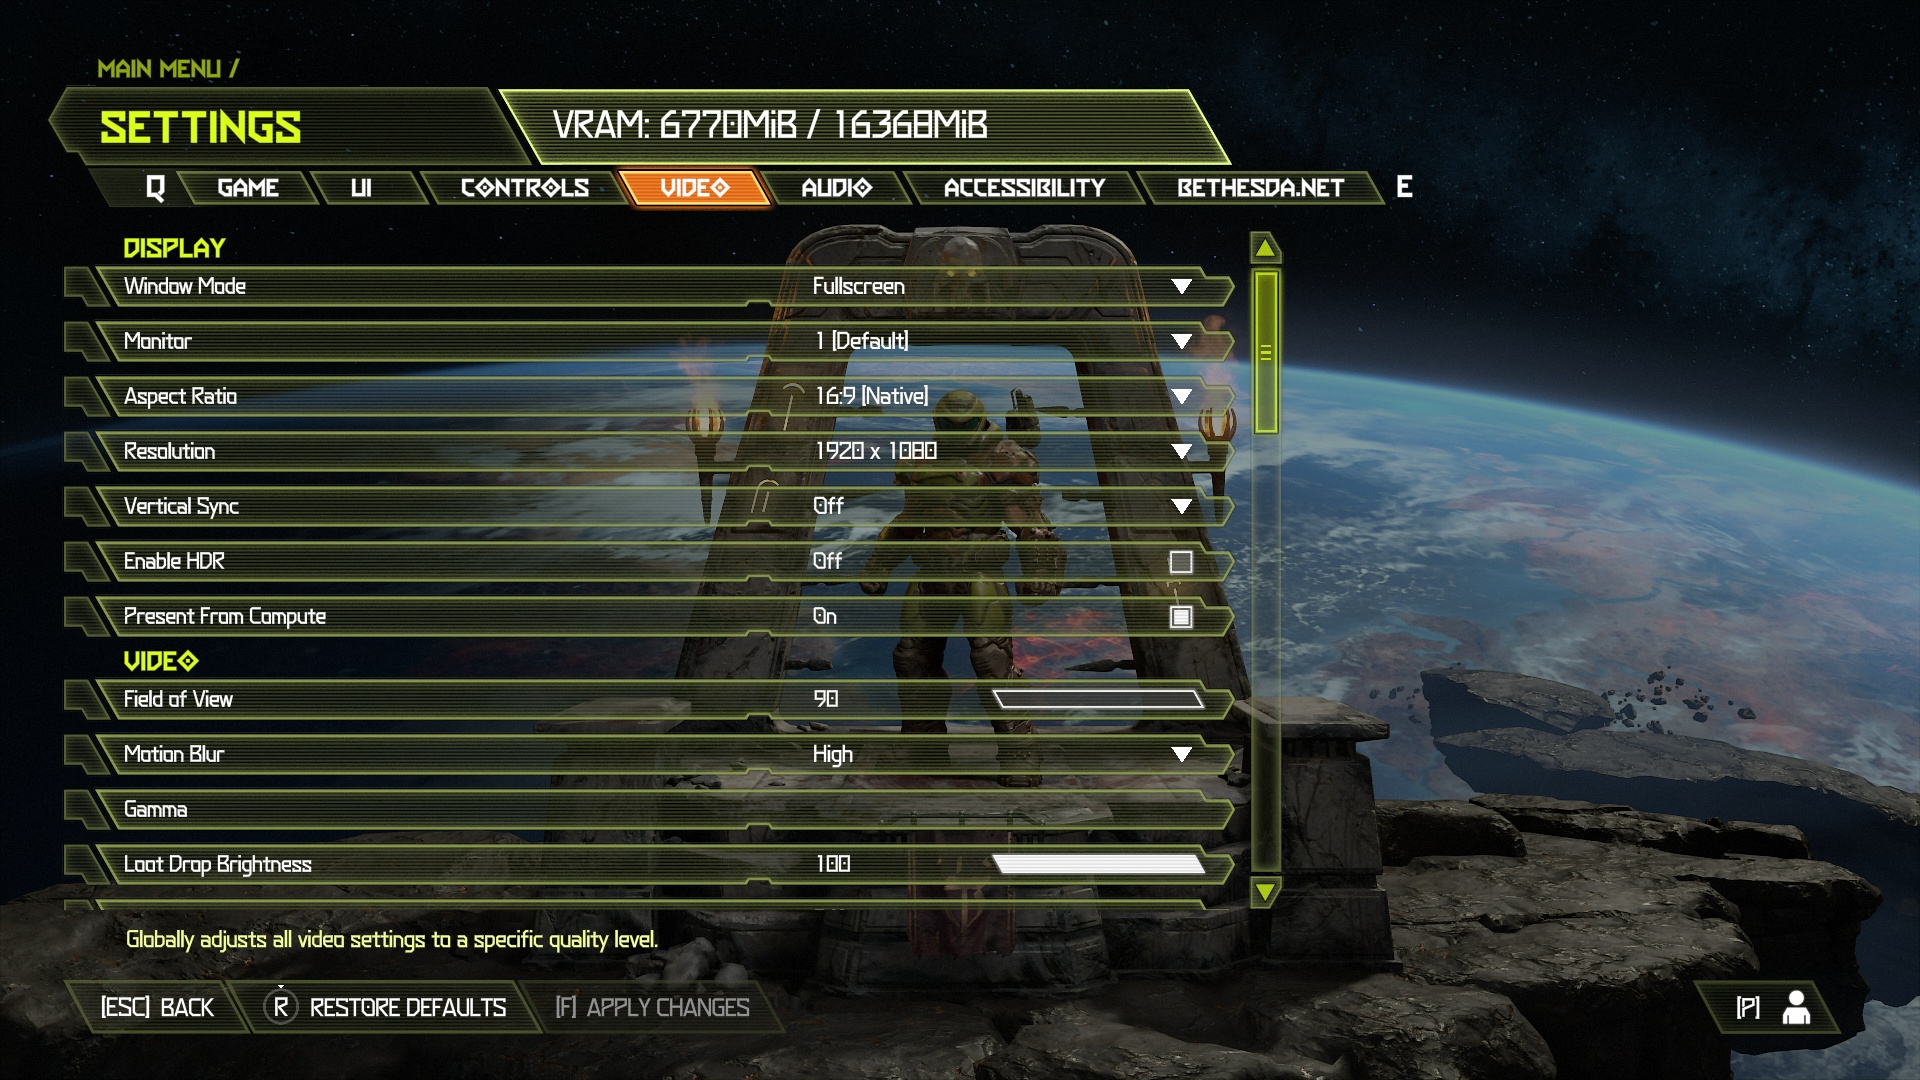
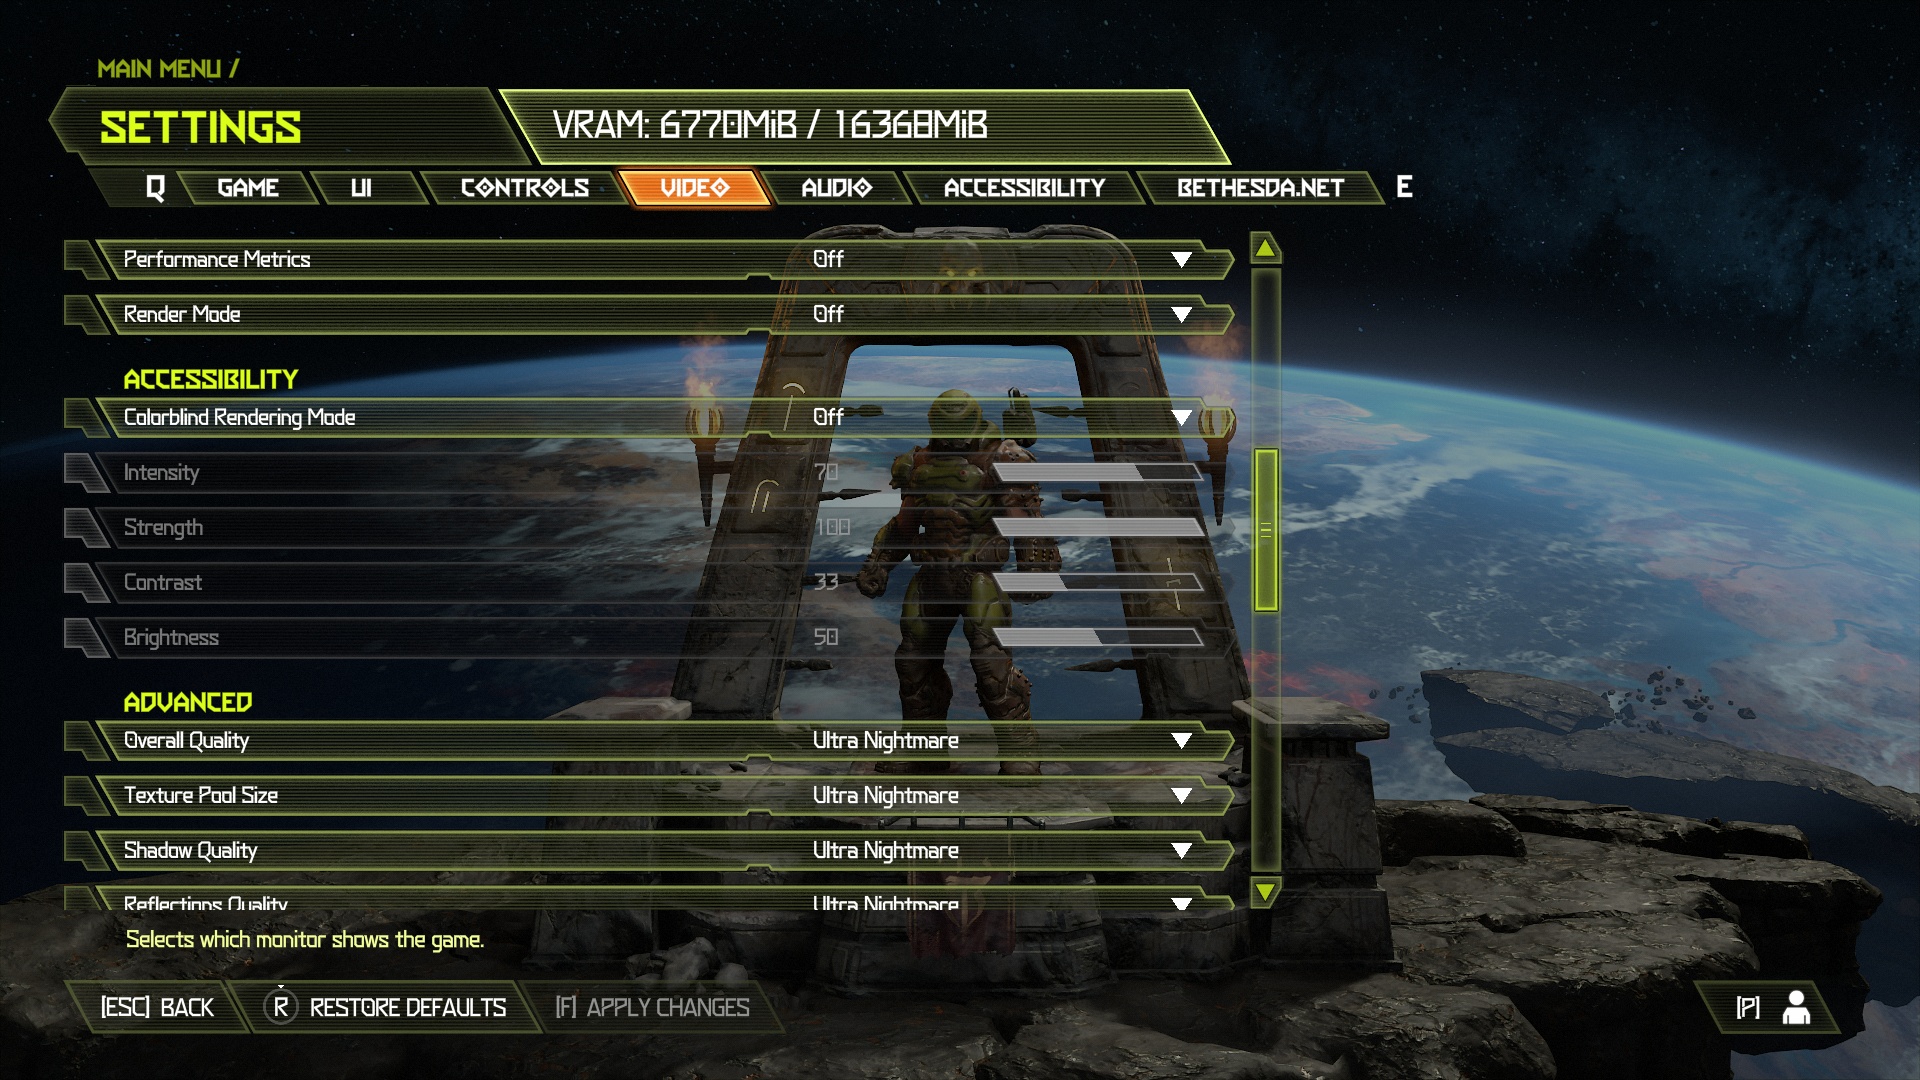
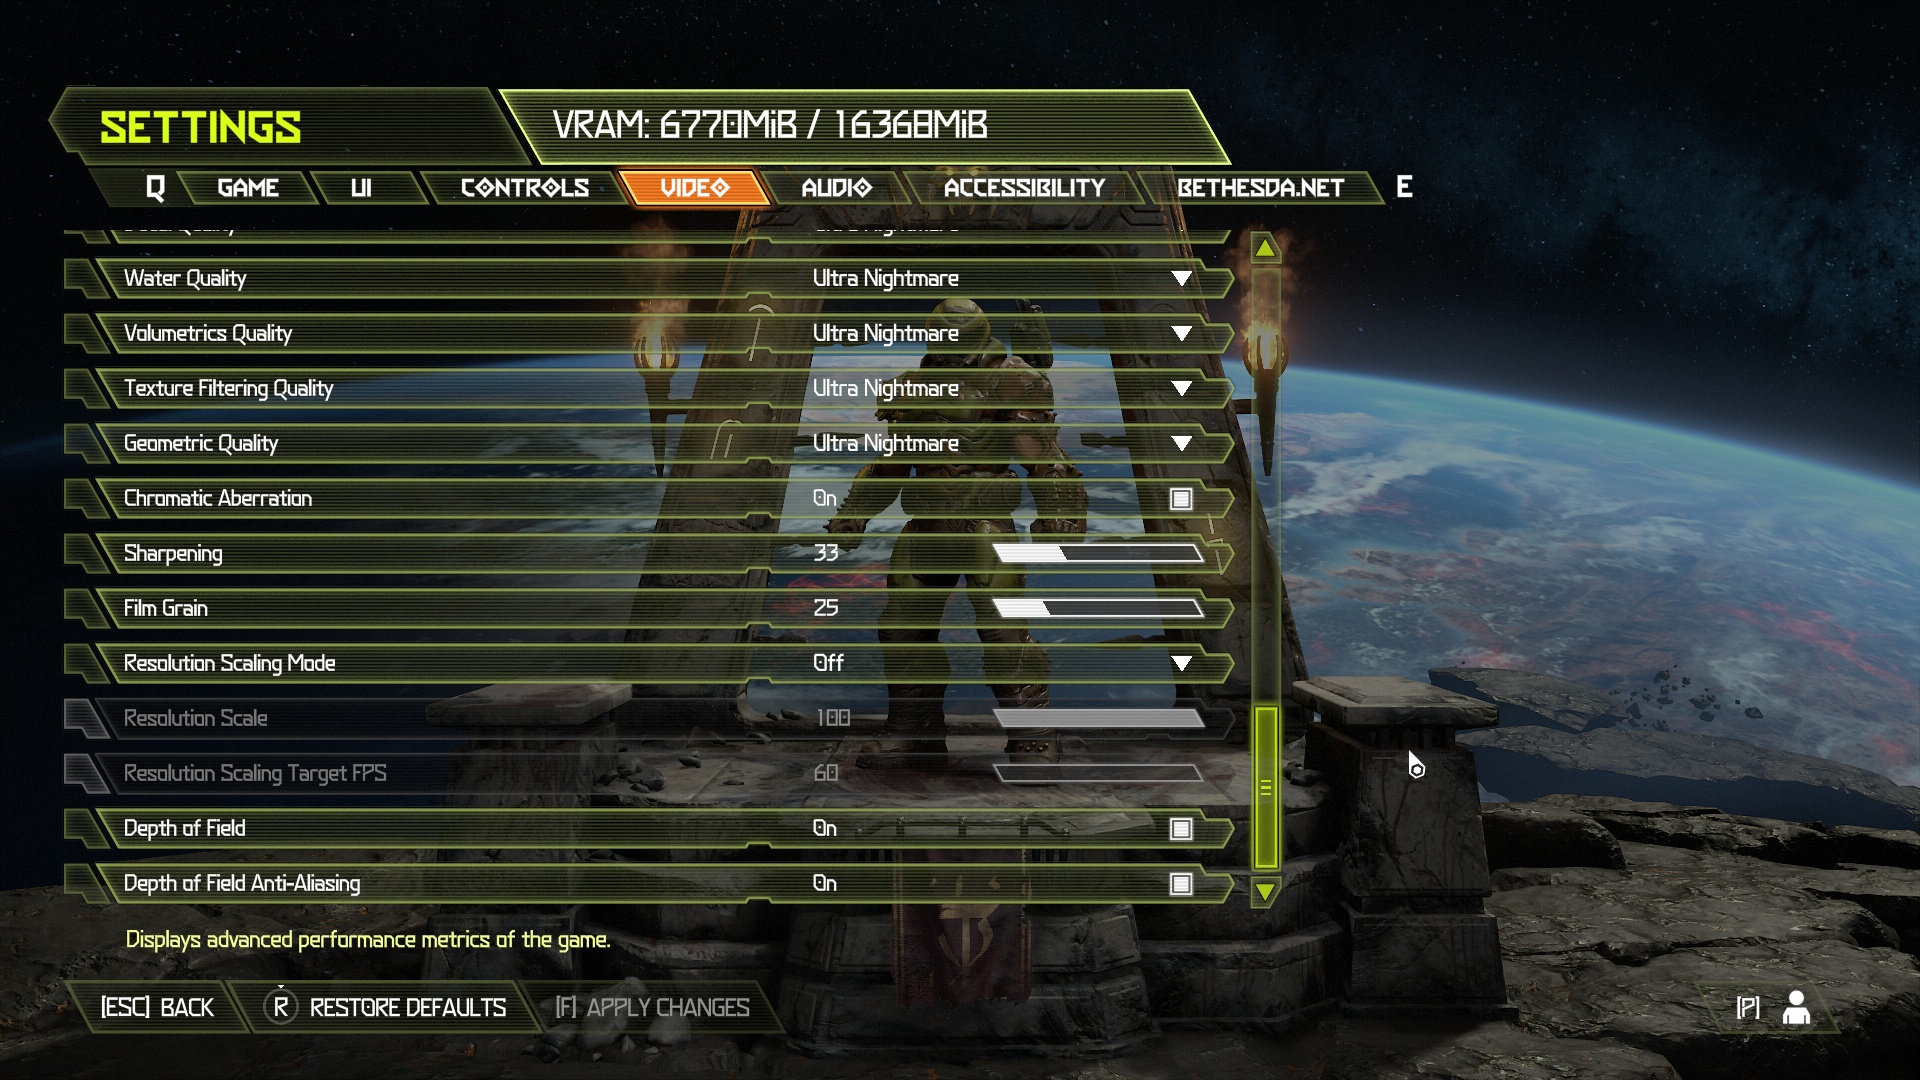
DOOM Eternal
Test platform custom scene; API Vulkan, graphics settings preset Ultra Nightmare; no extra settings.

No compromises in performance! If this is your motto, then you cannot miss the test of the graphics card GeForce RTX 3090. It will also feed 4K resolution, has the fastest ray tracing and OptiX acceleration, huge video memory and, the review sample from MSI also has many more attractive features. The biggest drawback, as is usual with high-end hardware, is the price. It is really high.
F1 2020
Test platform benchmark (Australia, Clear/Dry, Cycle); API DirectX 12, graphics settings preset Ultra High; TAA; extra settings Skidmarks blending off*.
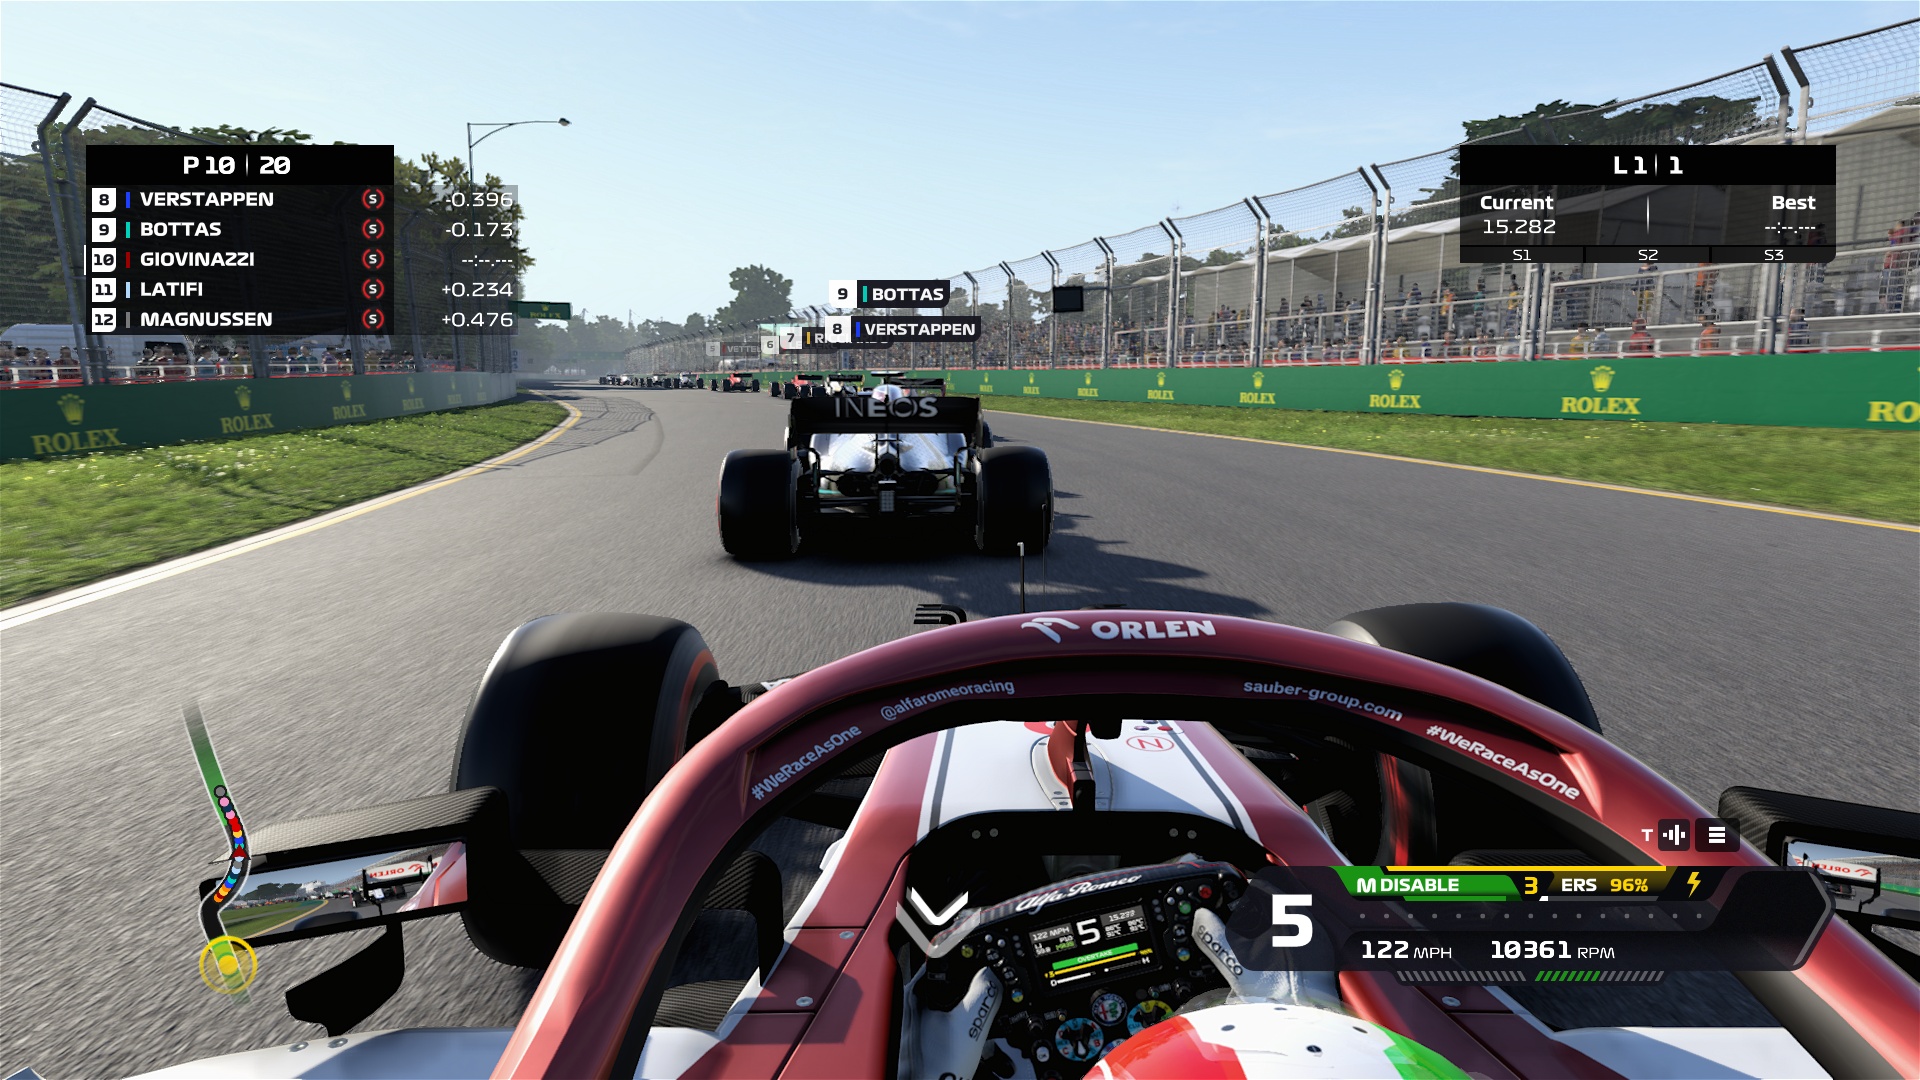

*on GeForce graphics cards, the Skidmarks blending option is disabled. This option is missing on AMD graphics cards. However, the overall quality of Skidmarks is otherwise set to High on both GeForce and AMD.
Note: The game also supports DLSS 2.0 and FidelityFX for upscaling and sharpening, but due to the relatively low hardware requirements in the native settings, we will not address them in standard tests. However, some measurement on request is possible if you ask for it.
No compromises in performance! If this is your motto, then you cannot miss the test of the graphics card GeForce RTX 3090. It will also feed 4K resolution, has the fastest ray tracing and OptiX acceleration, huge video memory and, the review sample from MSI also has many more attractive features. The biggest drawback, as is usual with high-end hardware, is the price. It is really high.
FIFA 21
Test platform custom scene (Autumn/Fall, Overcast, 9pm, Old Trafford); API DirectX 12, graphics settings preset Ultra; no extra settings.

No compromises in performance! If this is your motto, then you cannot miss the test of the graphics card GeForce RTX 3090. It will also feed 4K resolution, has the fastest ray tracing and OptiX acceleration, huge video memory and, the review sample from MSI also has many more attractive features. The biggest drawback, as is usual with high-end hardware, is the price. It is really high.
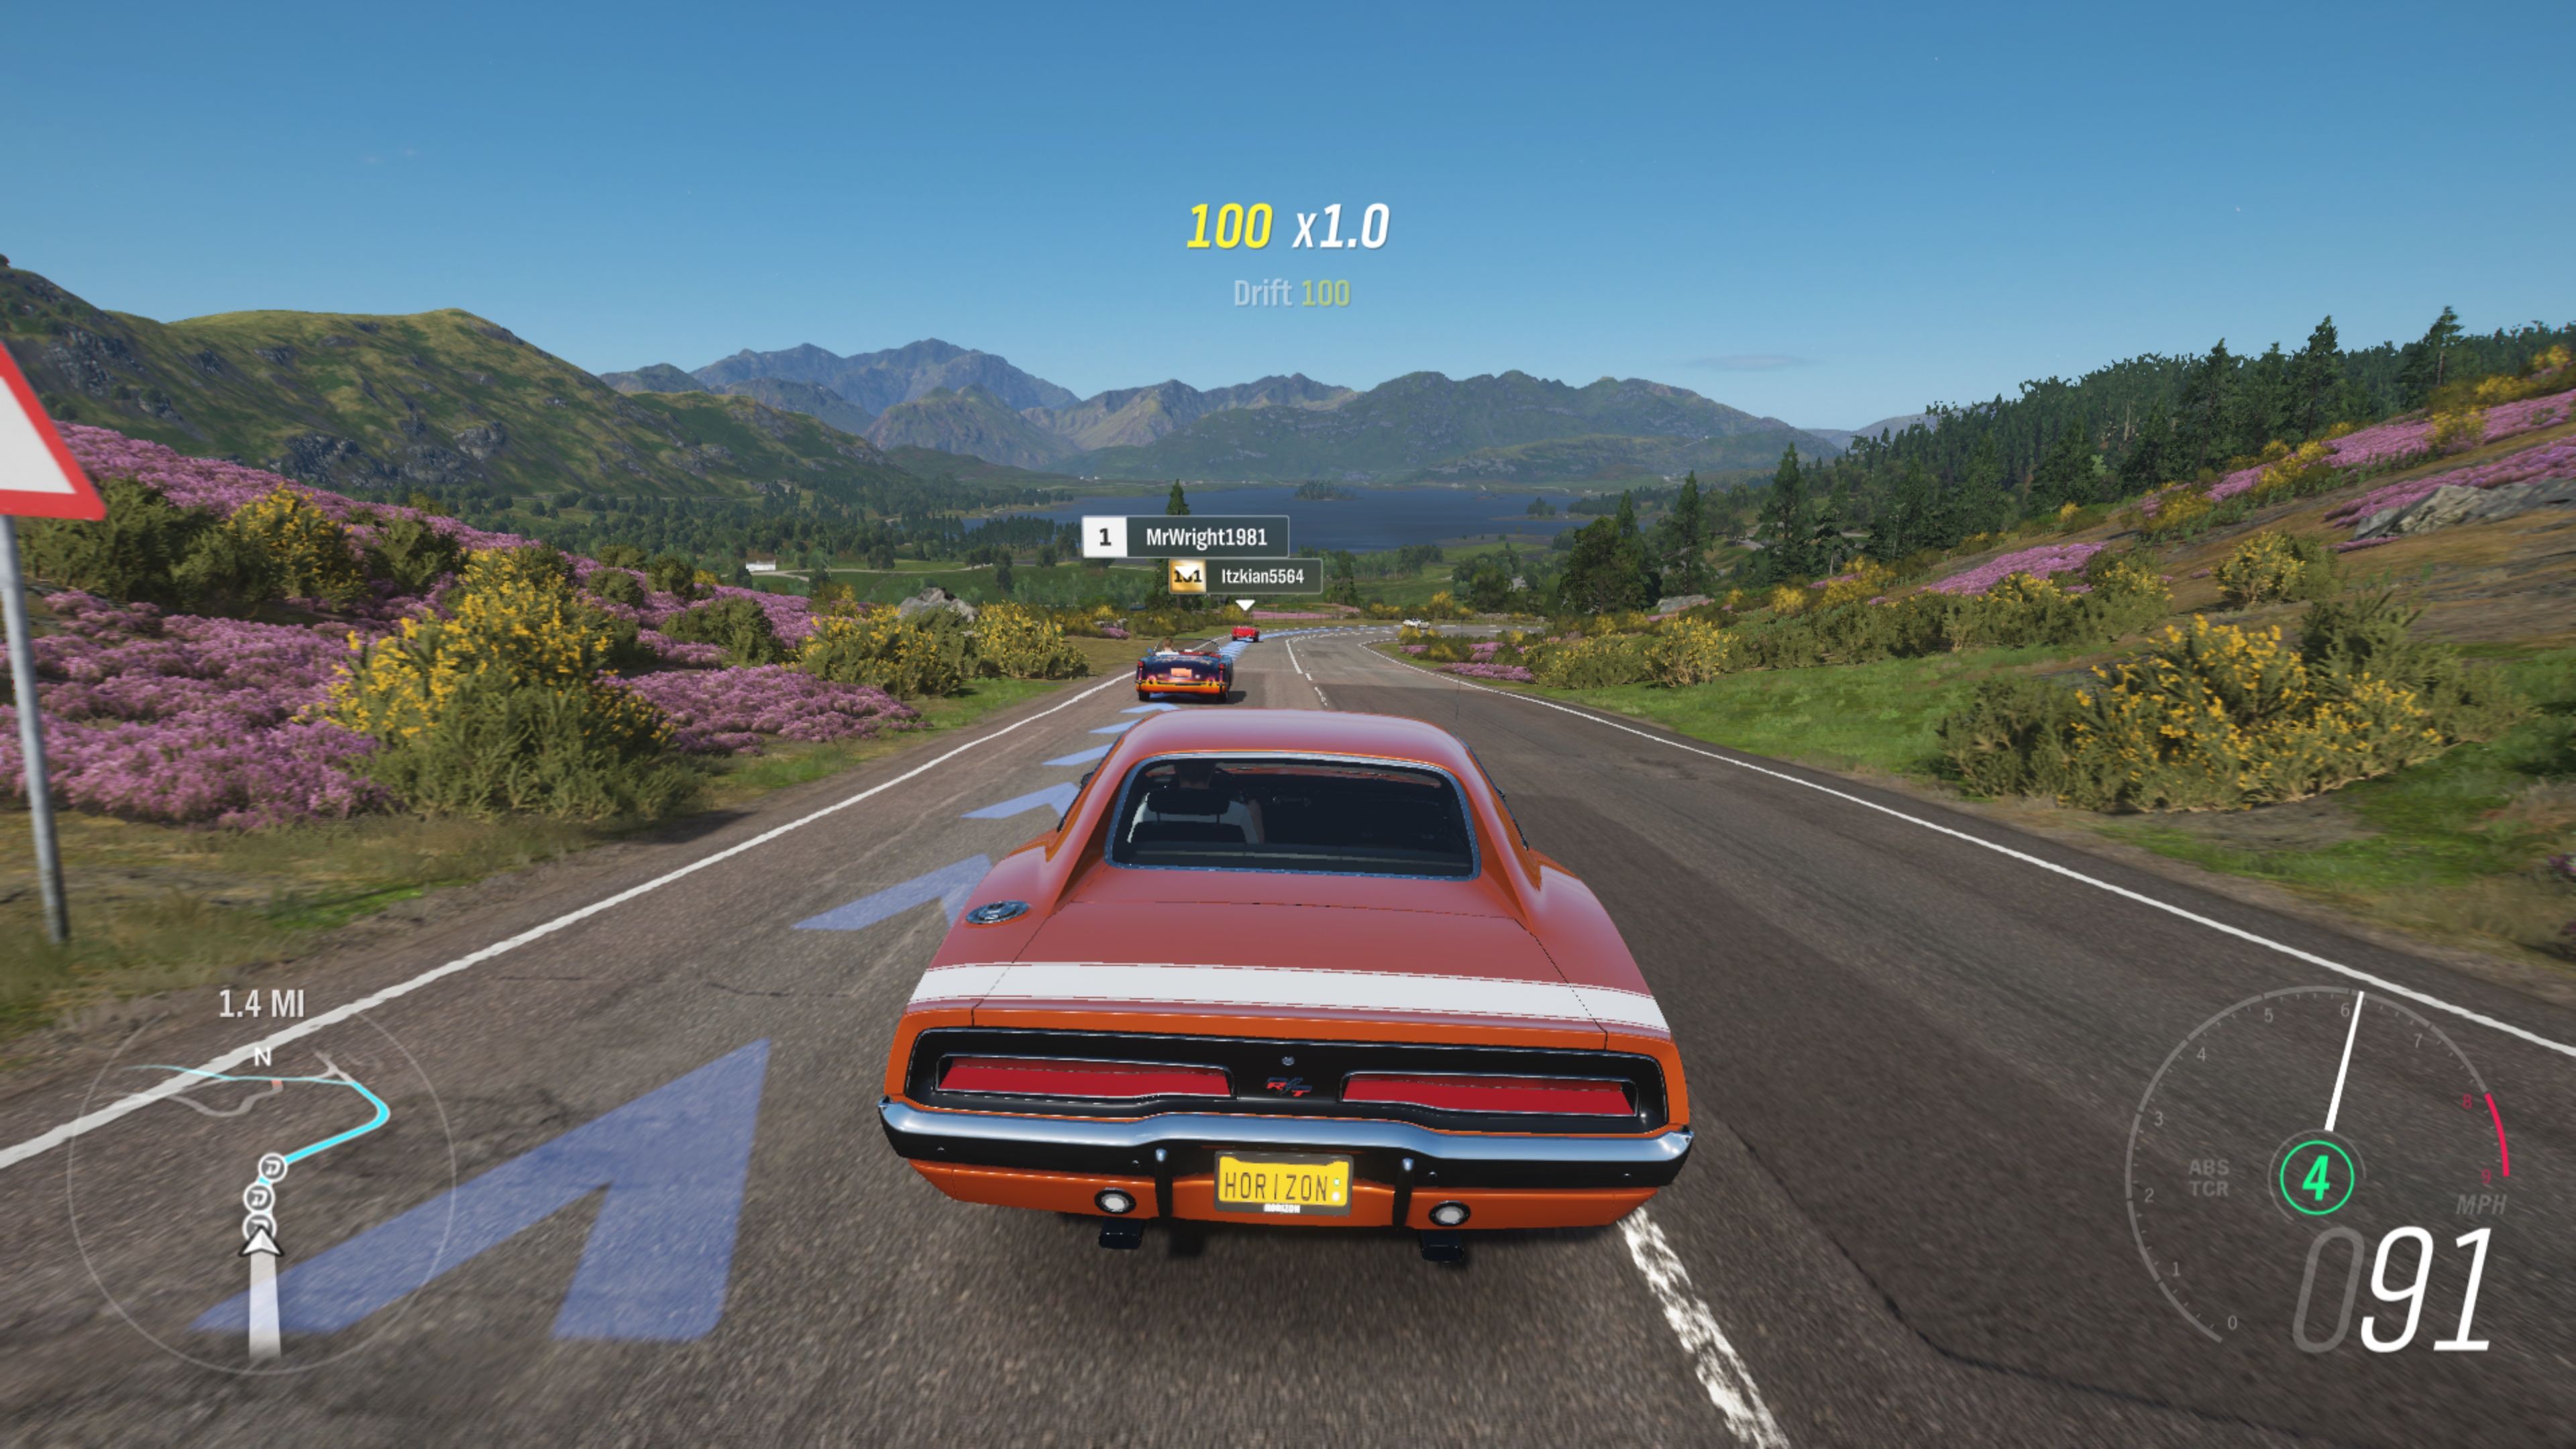
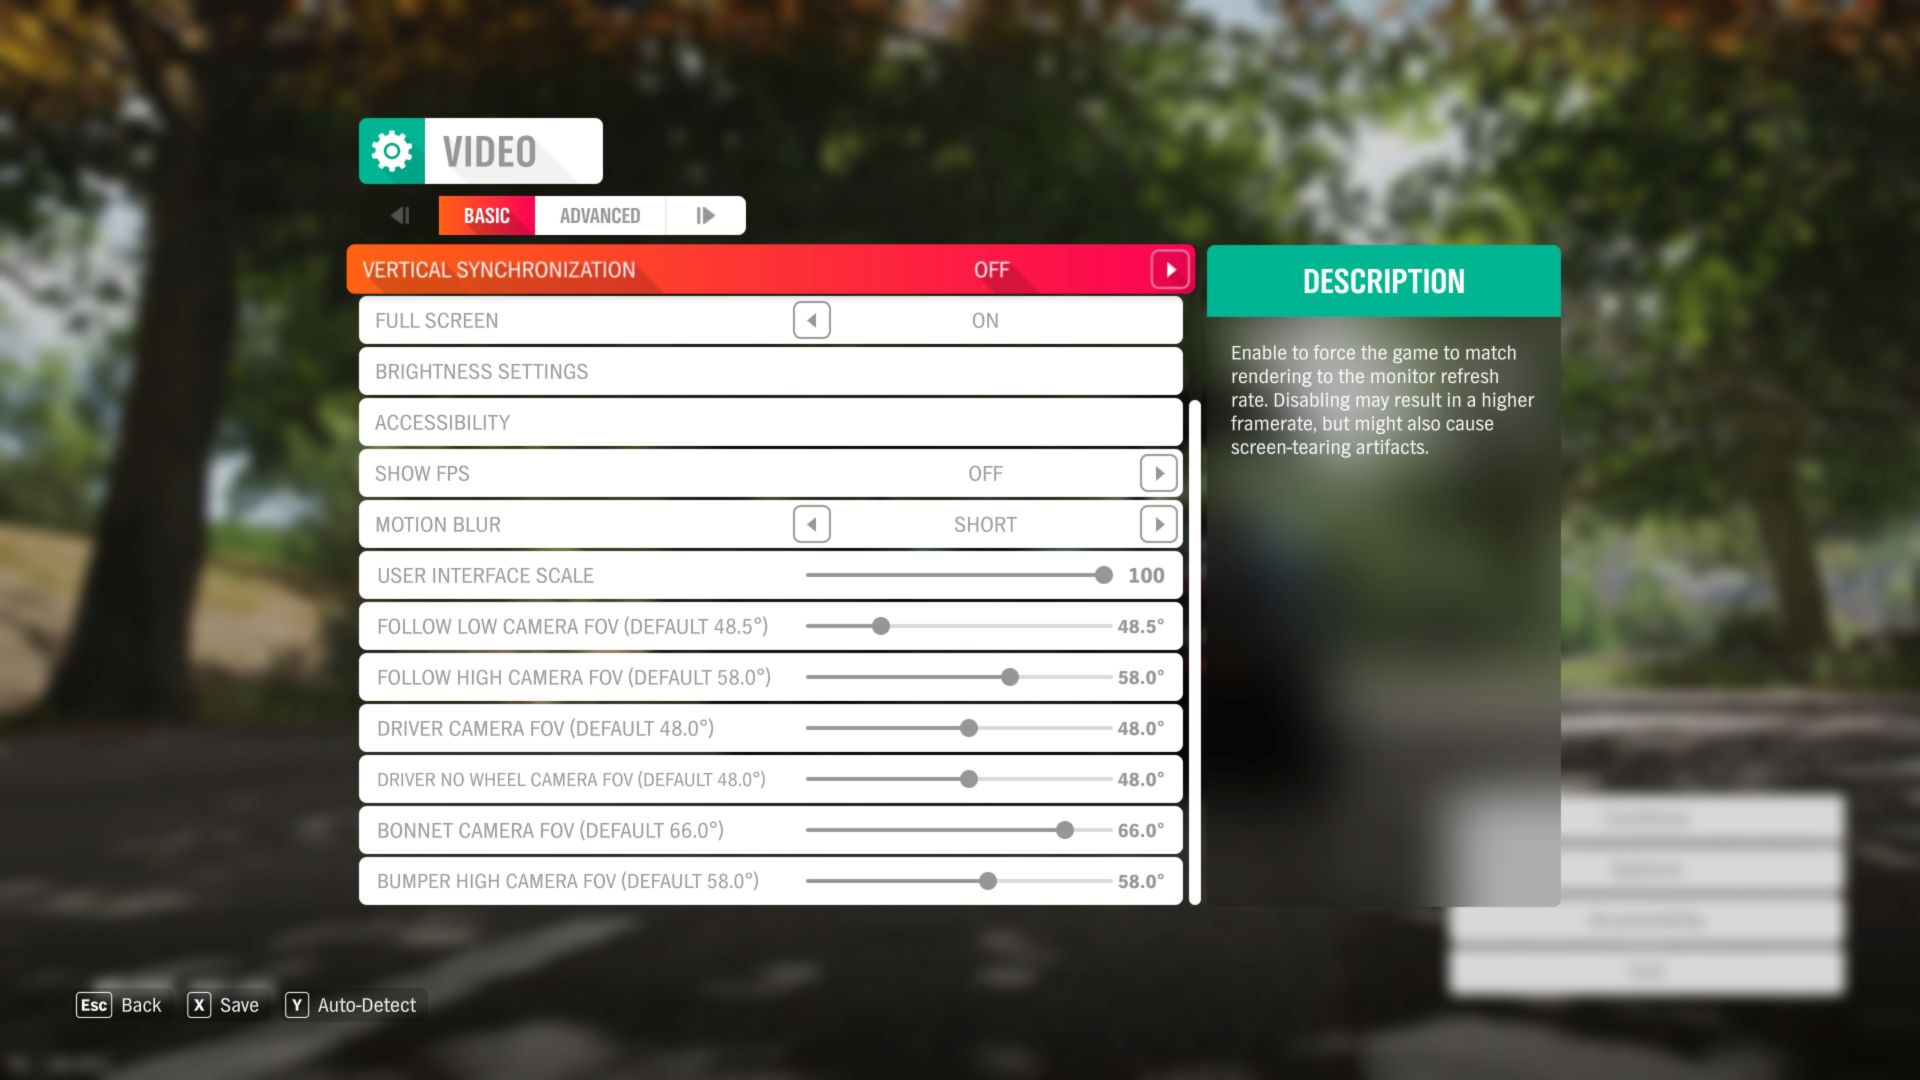
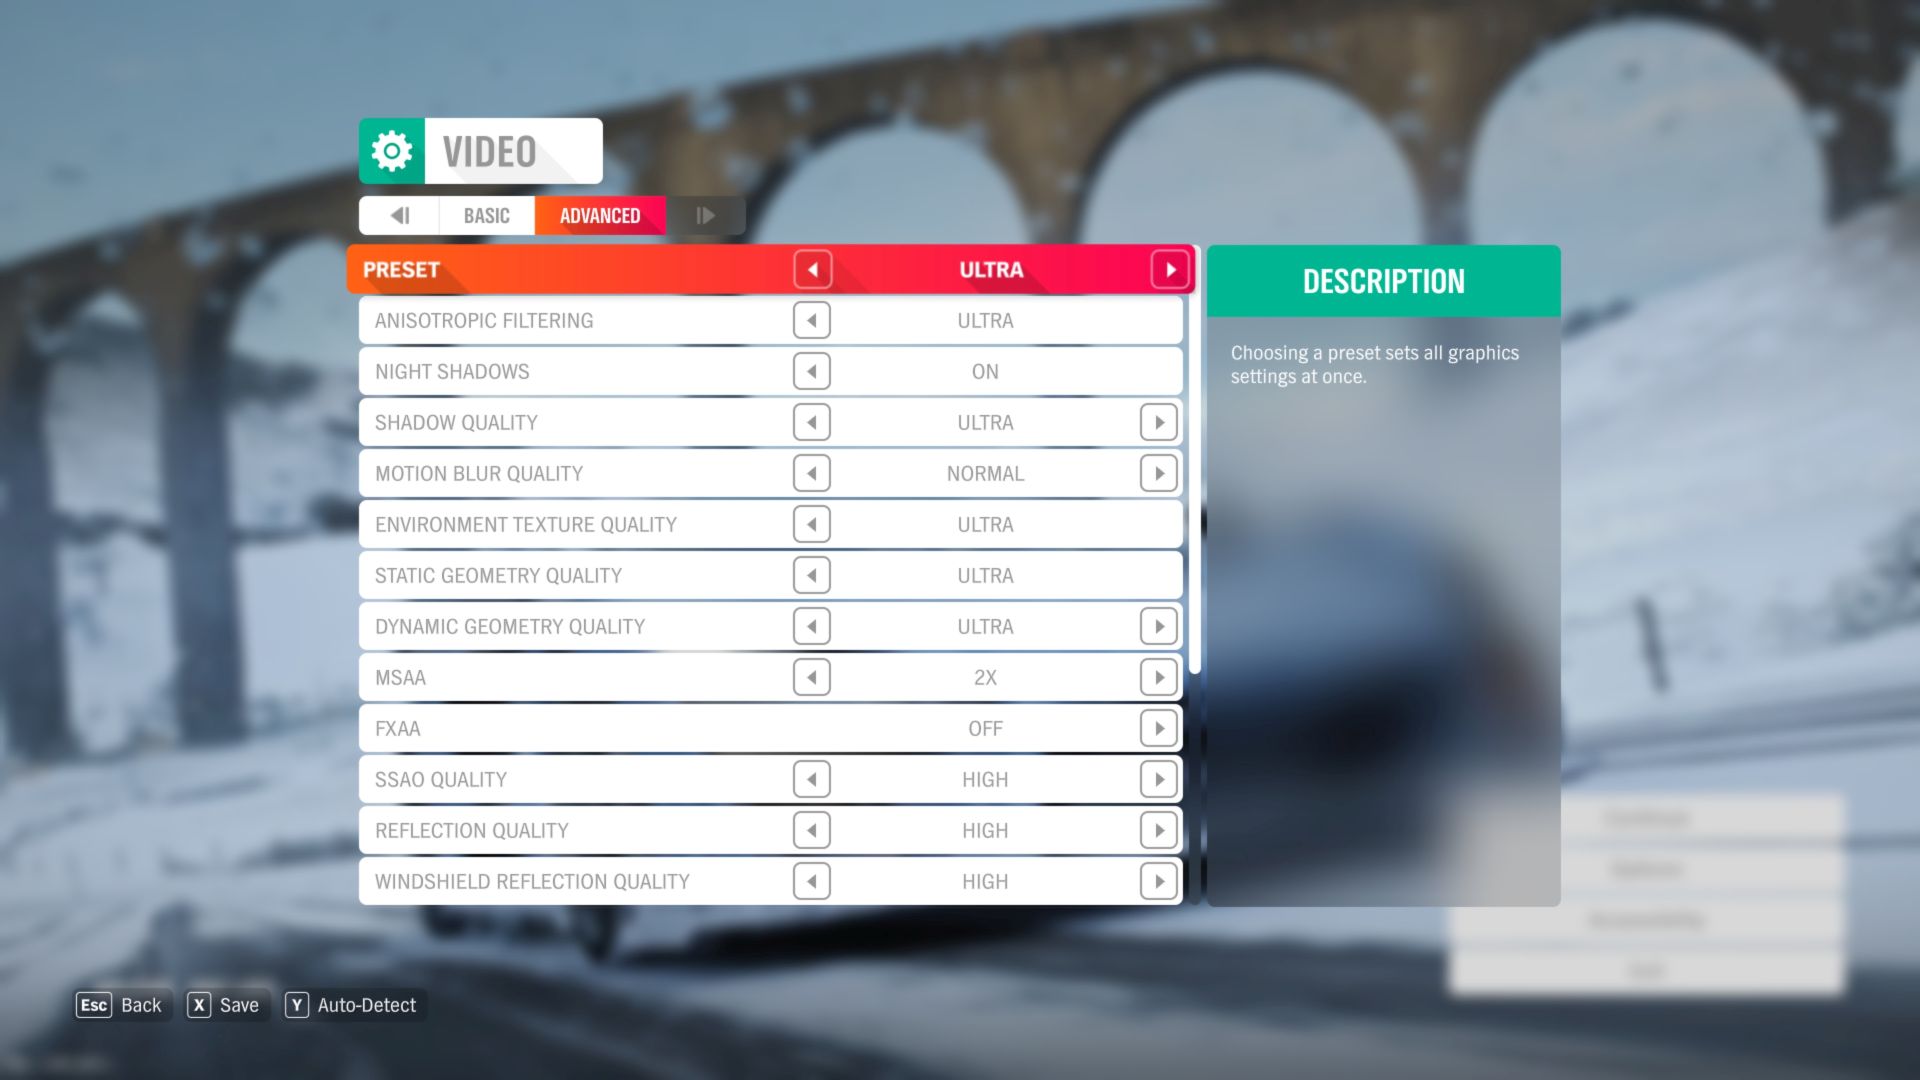
Forza Horizon 4
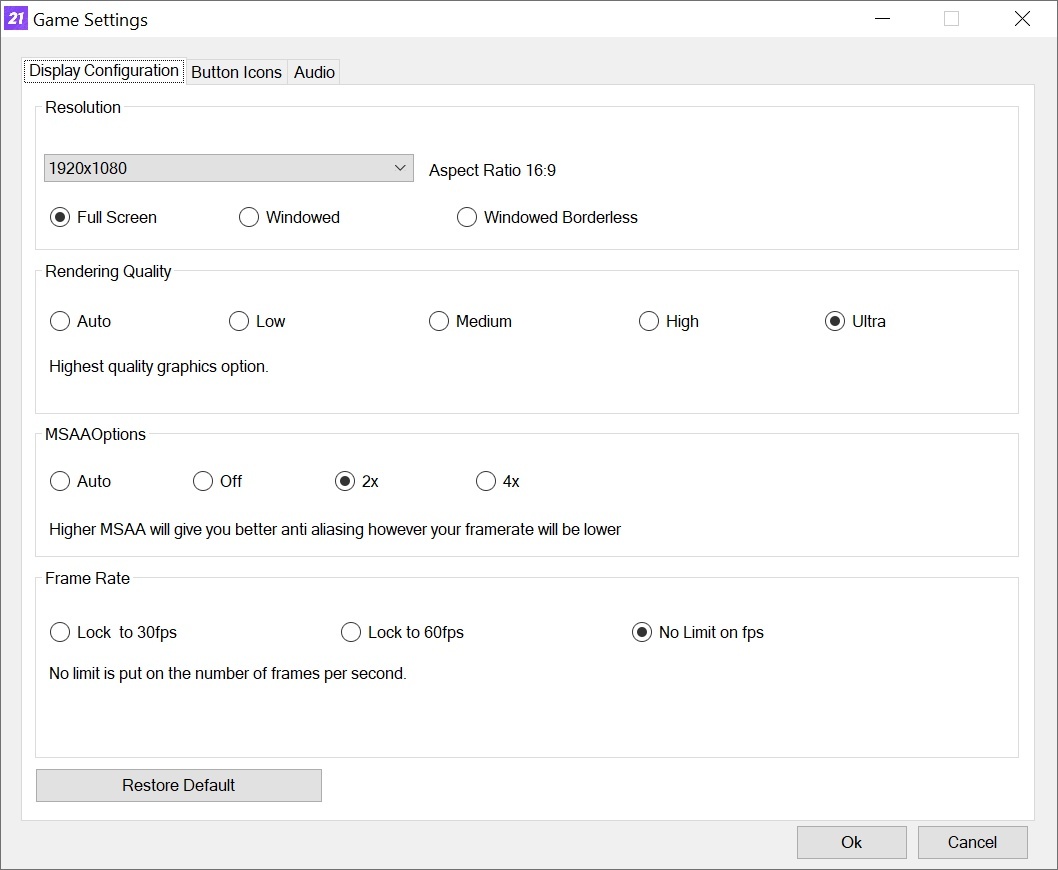
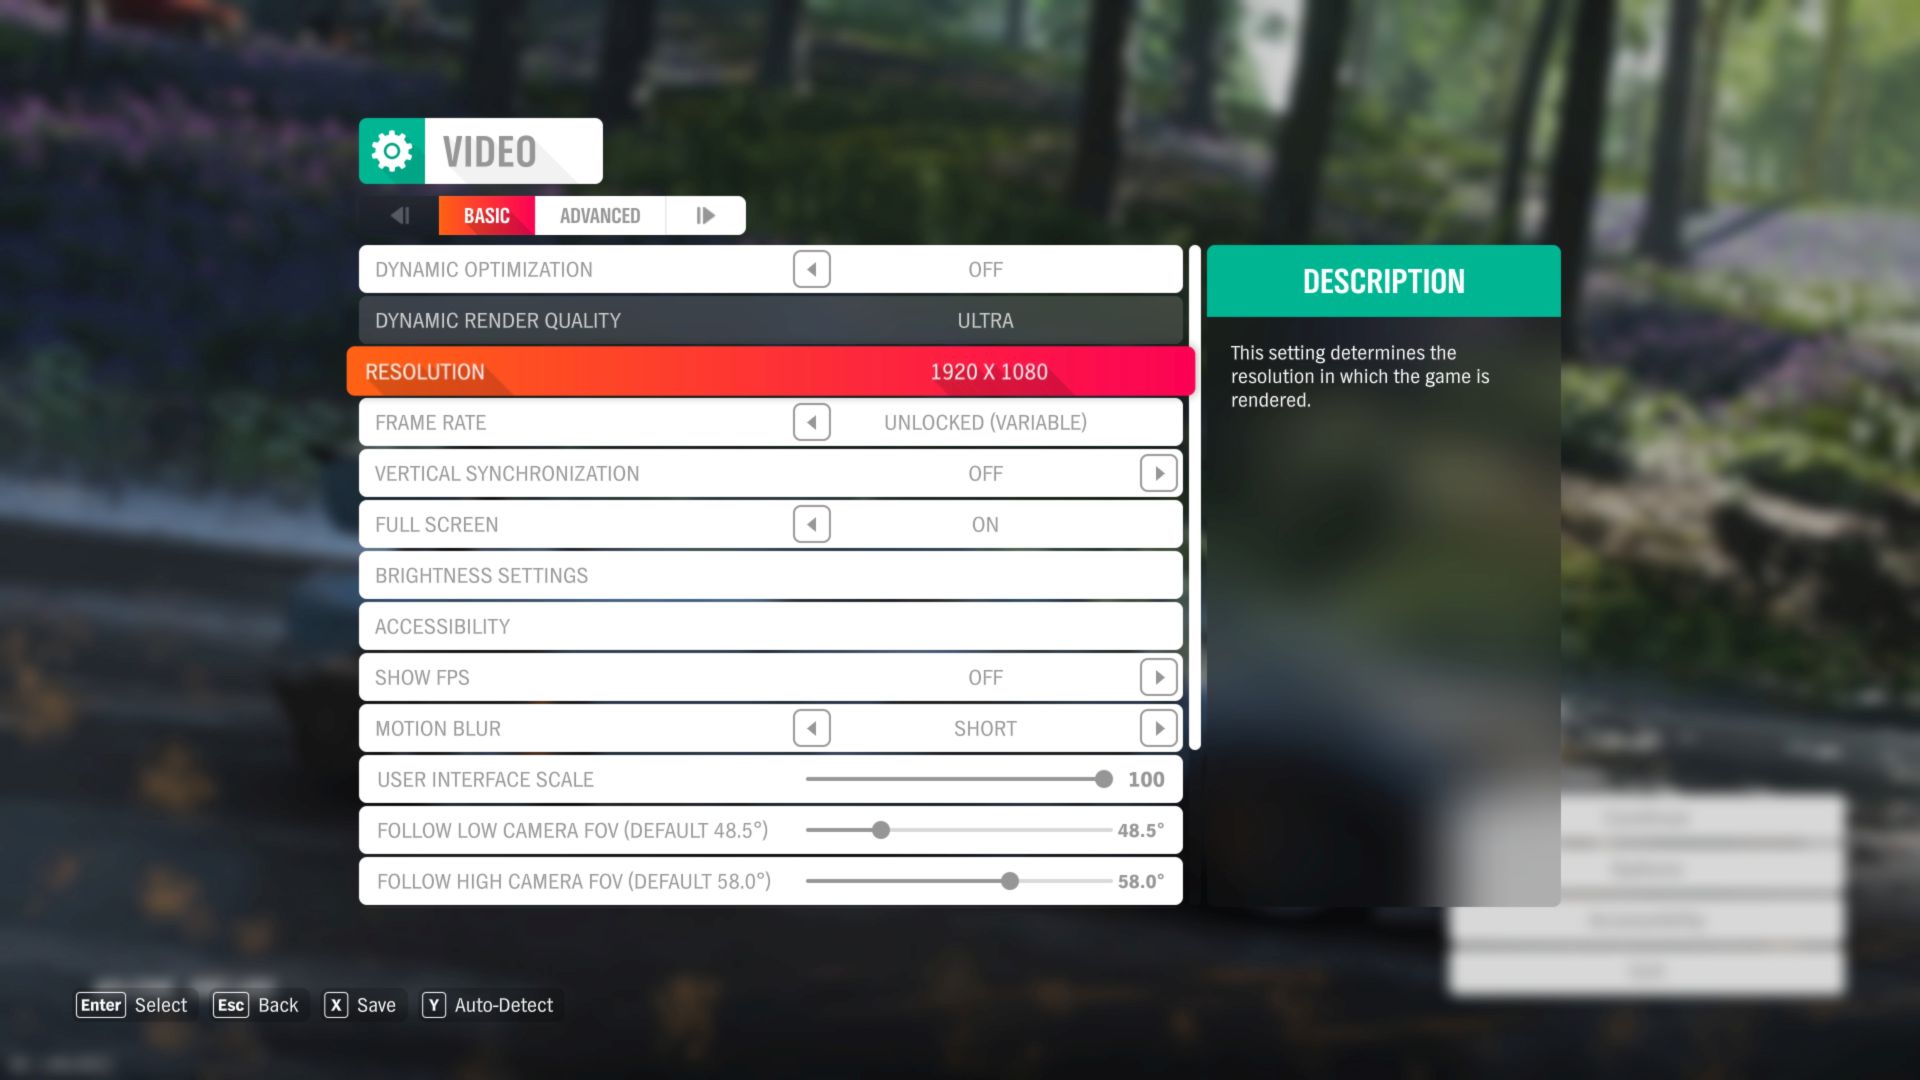
Test platform custom scene; API DirectX 12, graphics settings preset Ultra; 2× MSAA; no extra settings.

No compromises in performance! If this is your motto, then you cannot miss the test of the graphics card GeForce RTX 3090. It will also feed 4K resolution, has the fastest ray tracing and OptiX acceleration, huge video memory and, the review sample from MSI also has many more attractive features. The biggest drawback, as is usual with high-end hardware, is the price. It is really high.
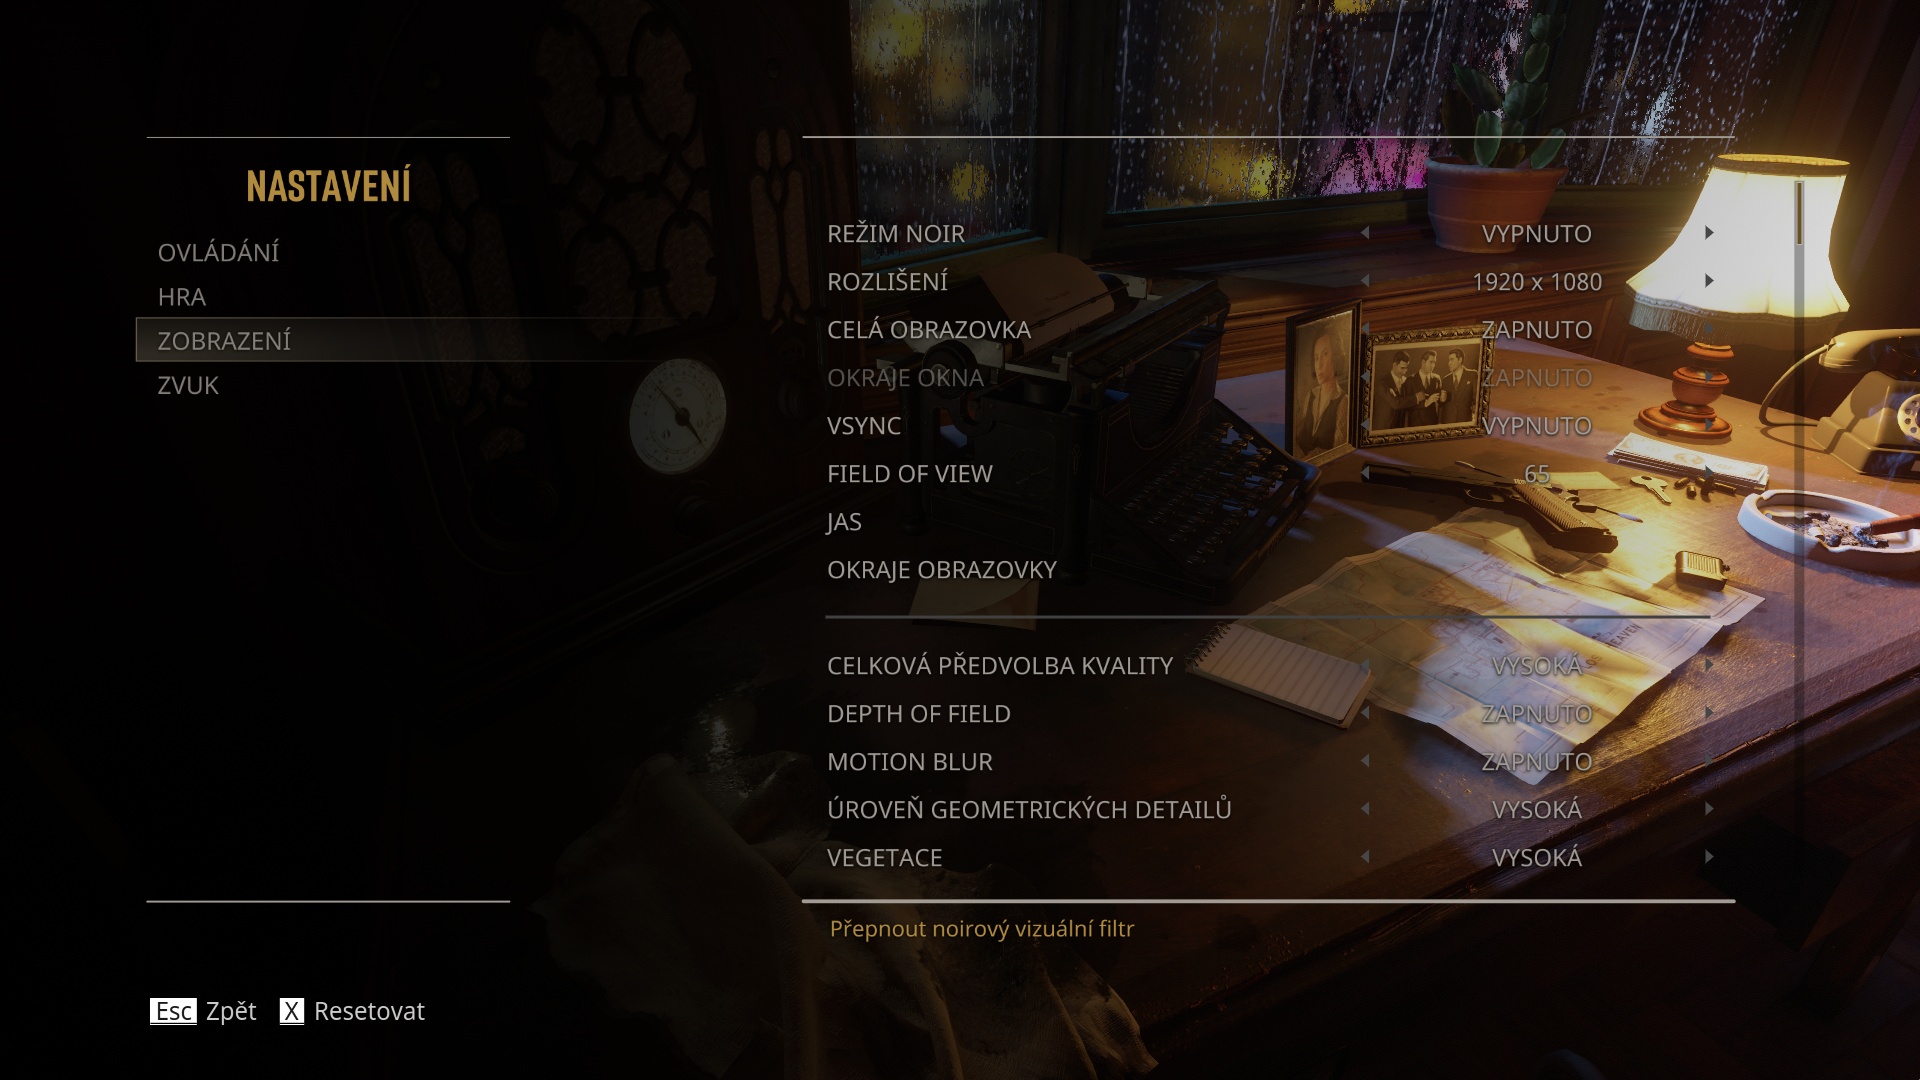
Mafia: DE
Test platform custom scene (from the Salieri’s Bar parking lot to the elevated railway gate); API DirectX 11, graphics settings preset High; no extra settings.


No compromises in performance! If this is your motto, then you cannot miss the test of the graphics card GeForce RTX 3090. It will also feed 4K resolution, has the fastest ray tracing and OptiX acceleration, huge video memory and, the review sample from MSI also has many more attractive features. The biggest drawback, as is usual with high-end hardware, is the price. It is really high.
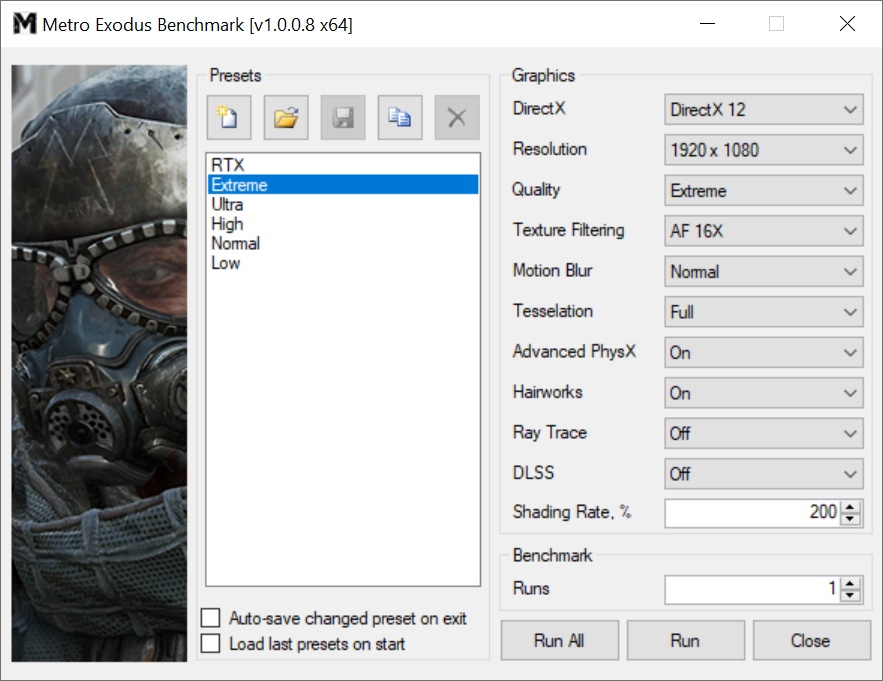
Metro Exodus
Test platform benchmark; API DirectX 12, graphics settings preset Extreme; no extra settings.
No compromises in performance! If this is your motto, then you cannot miss the test of the graphics card GeForce RTX 3090. It will also feed 4K resolution, has the fastest ray tracing and OptiX acceleration, huge video memory and, the review sample from MSI also has many more attractive features. The biggest drawback, as is usual with high-end hardware, is the price. It is really high.
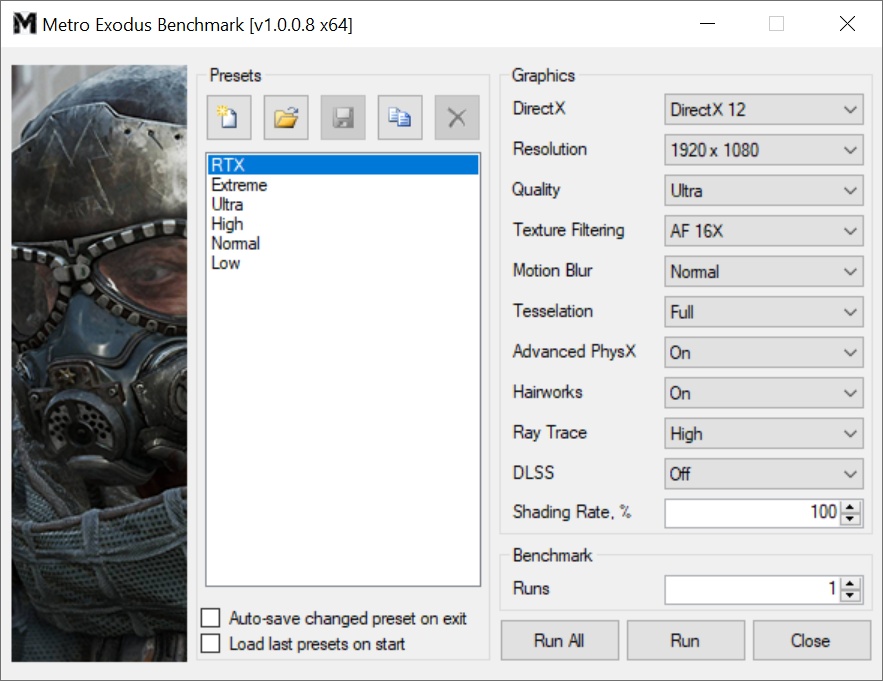
Metro Exodus with DXR and DLSS
Test platform benchmark; API DirectX 12, graphics settings preset Ultra; extra settings DXR.
DXR (native)
DXR with DLSS (performance)
No compromises in performance! If this is your motto, then you cannot miss the test of the graphics card GeForce RTX 3090. It will also feed 4K resolution, has the fastest ray tracing and OptiX acceleration, huge video memory and, the review sample from MSI also has many more attractive features. The biggest drawback, as is usual with high-end hardware, is the price. It is really high.
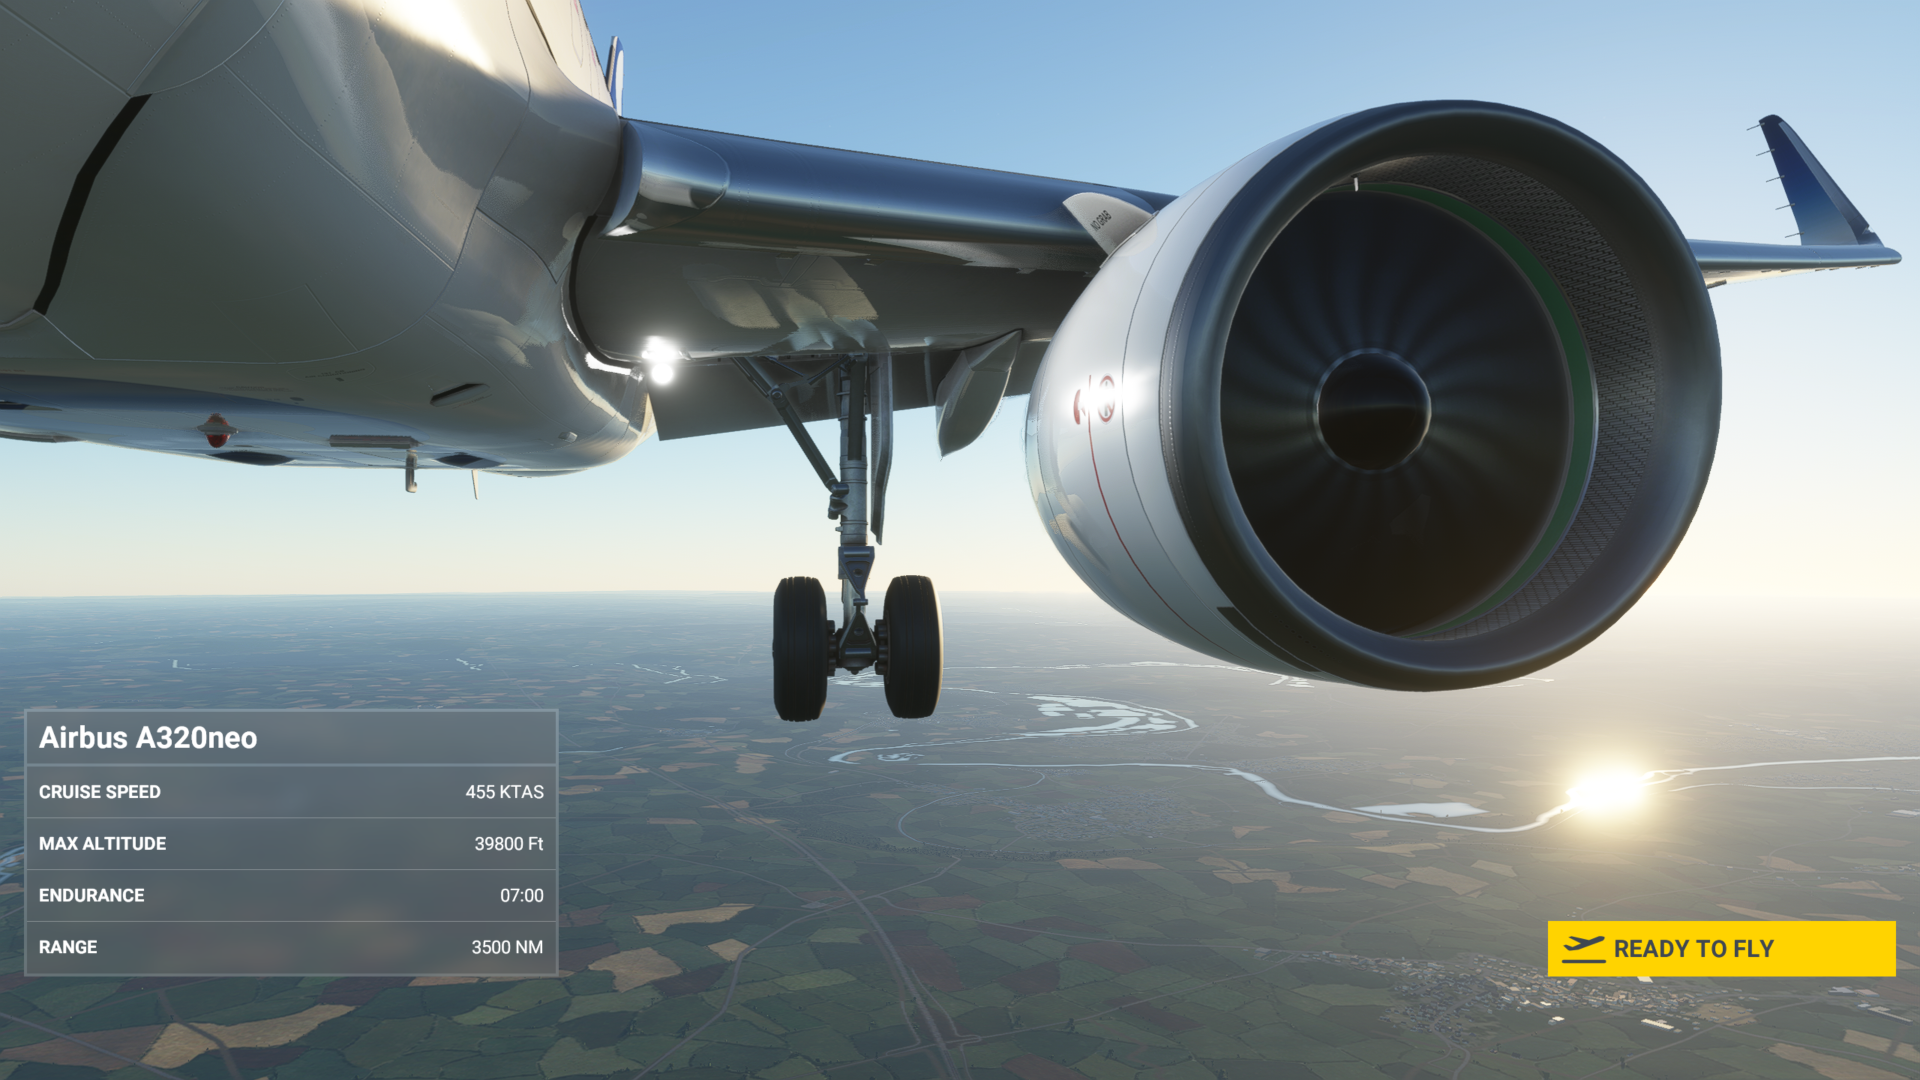
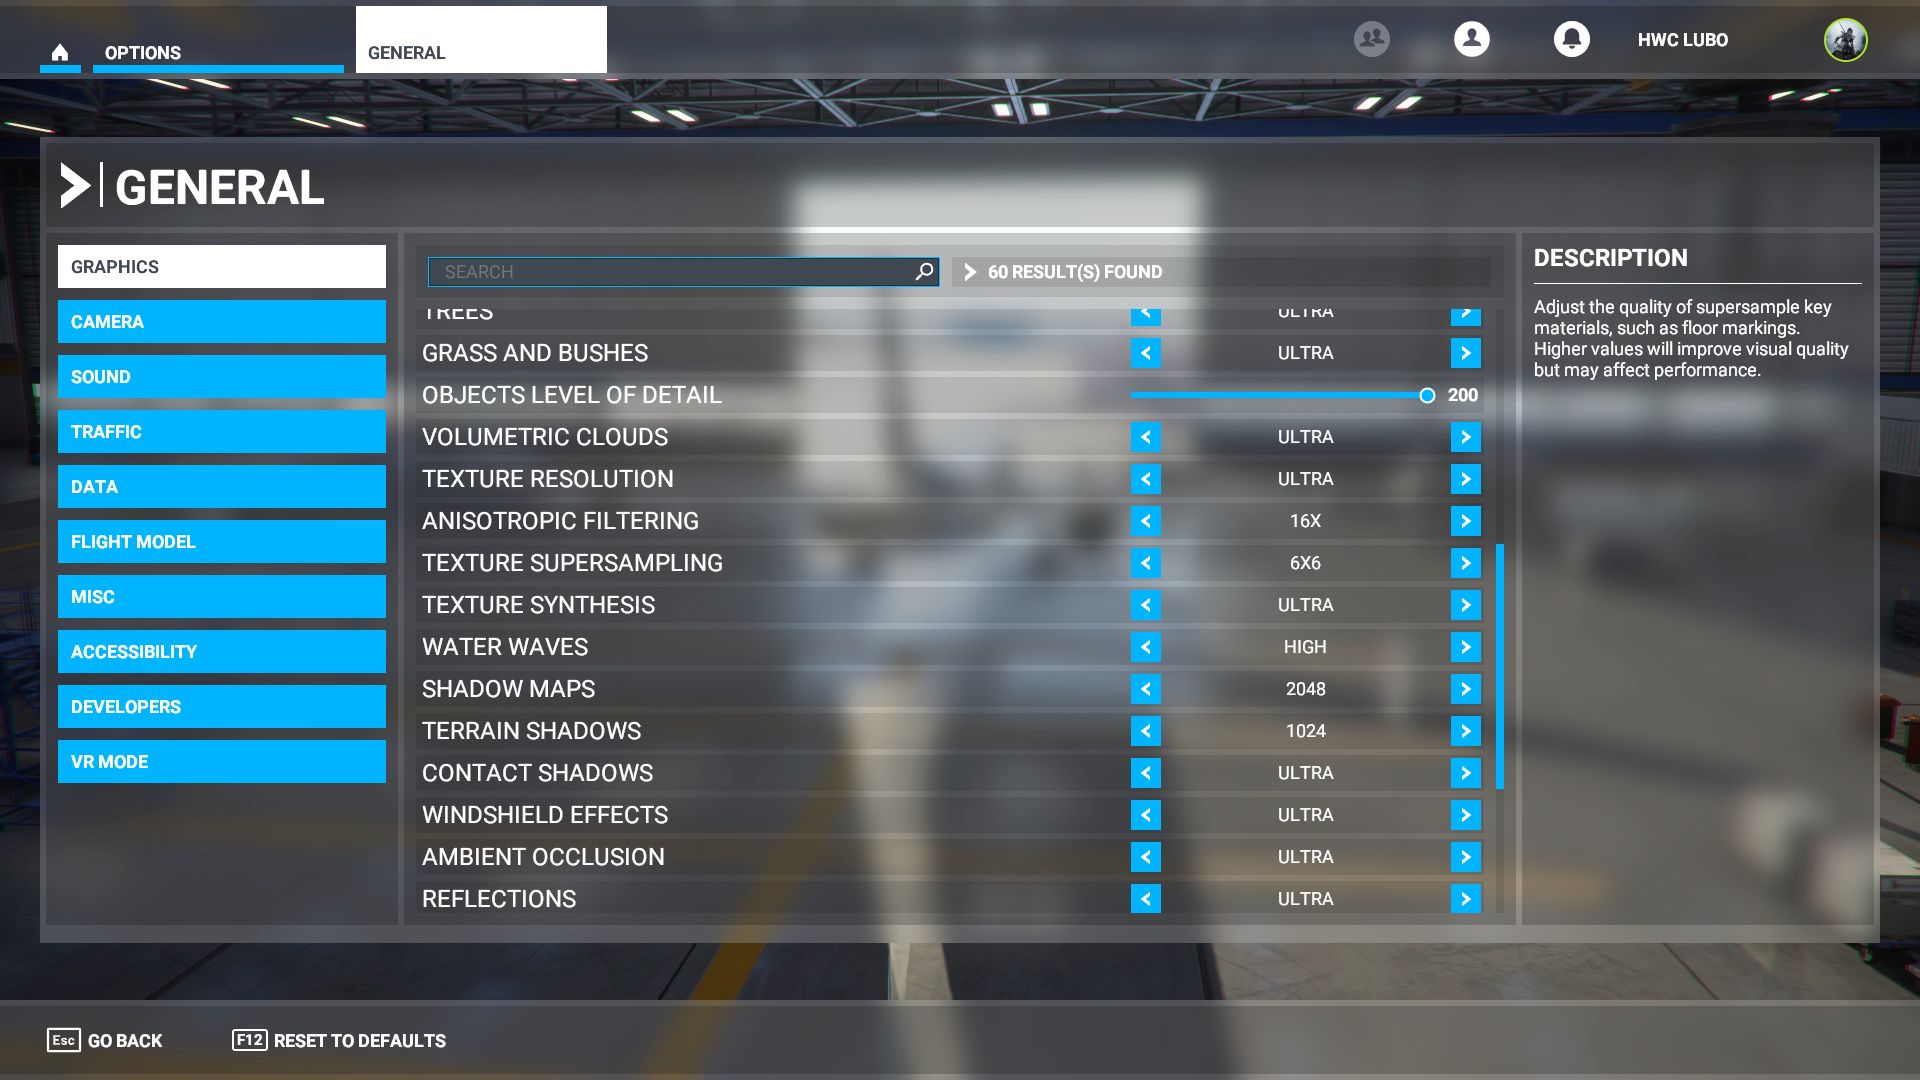
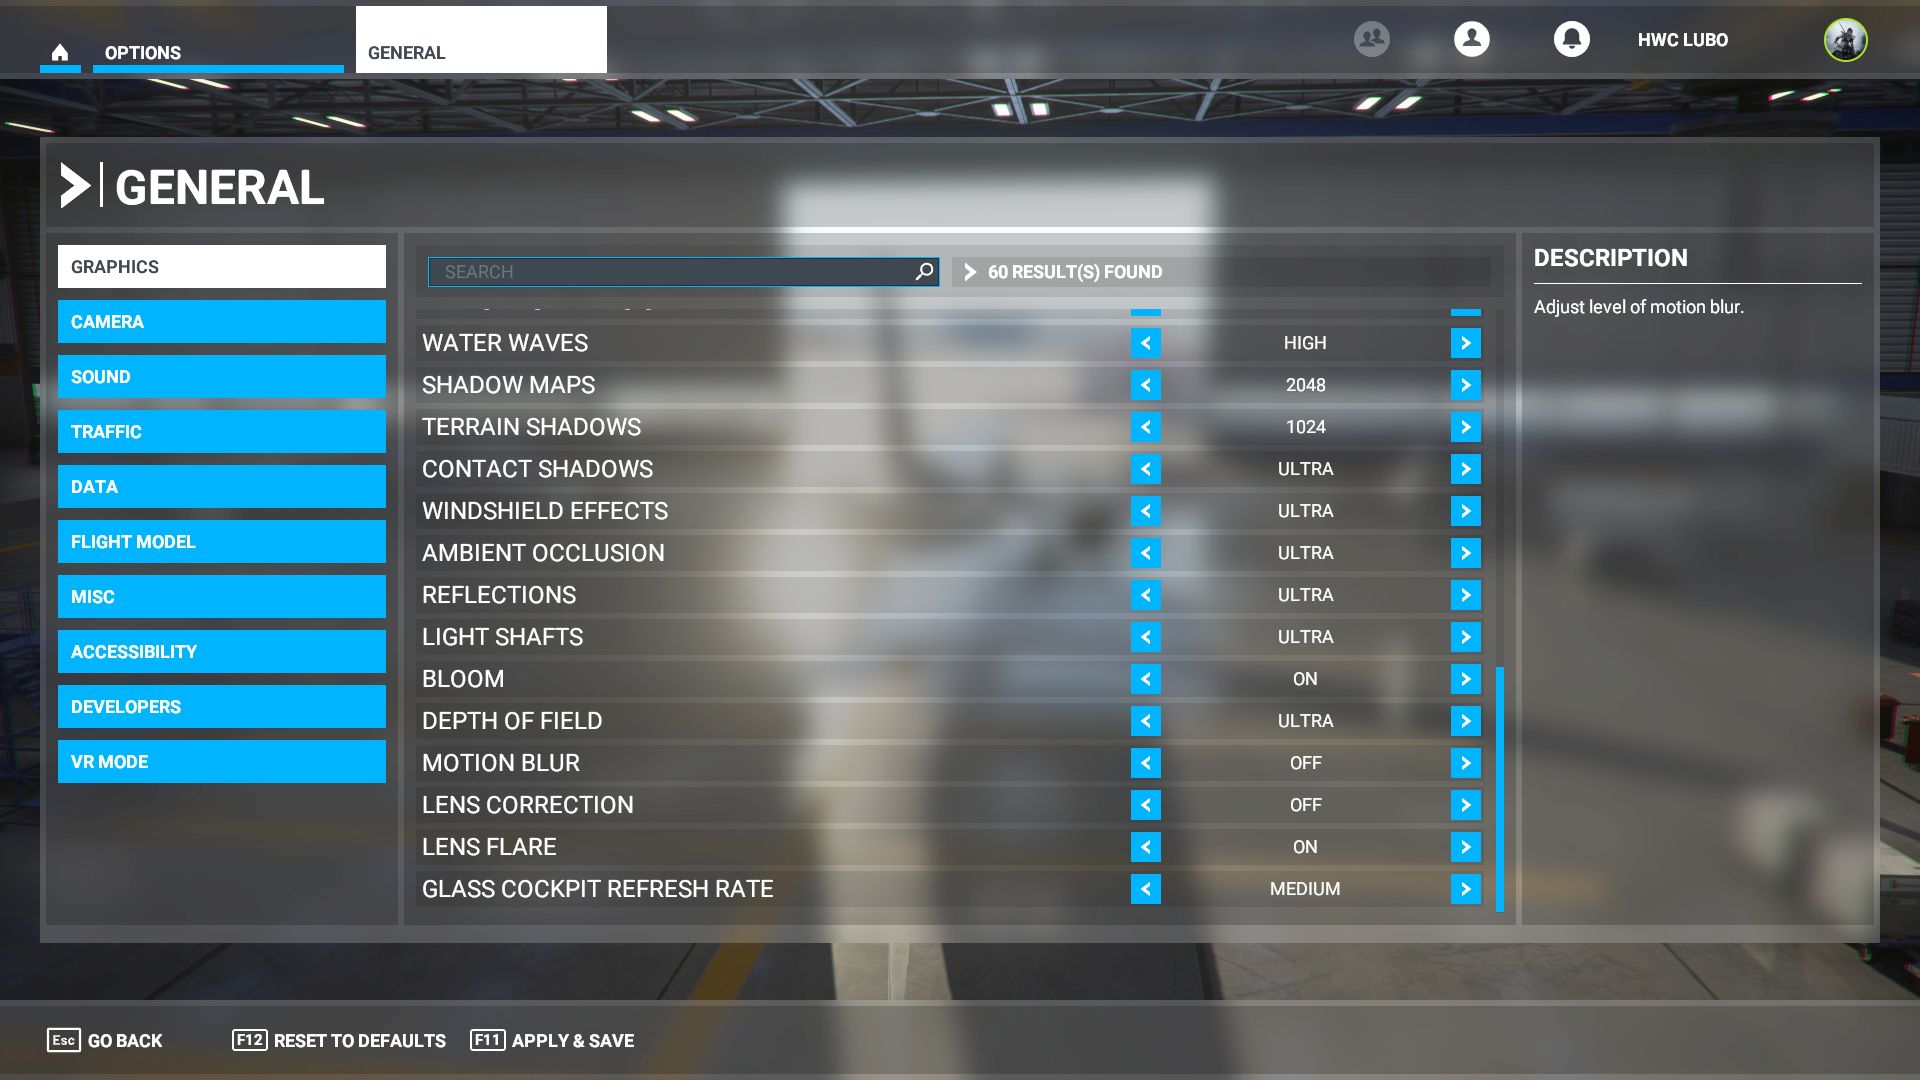
Microsoft Flight Simulator
Test platform custom scene (Paris-Charles de Gaulle, Air Traffic: AI, February 14, 9:00 am) autopilot: from 1000 until hitting the terrain; API DirectX 11, graphics settings preset Ultra; TAA; extra settings Motion Blur off.

No compromises in performance! If this is your motto, then you cannot miss the test of the graphics card GeForce RTX 3090. It will also feed 4K resolution, has the fastest ray tracing and OptiX acceleration, huge video memory and, the review sample from MSI also has many more attractive features. The biggest drawback, as is usual with high-end hardware, is the price. It is really high.
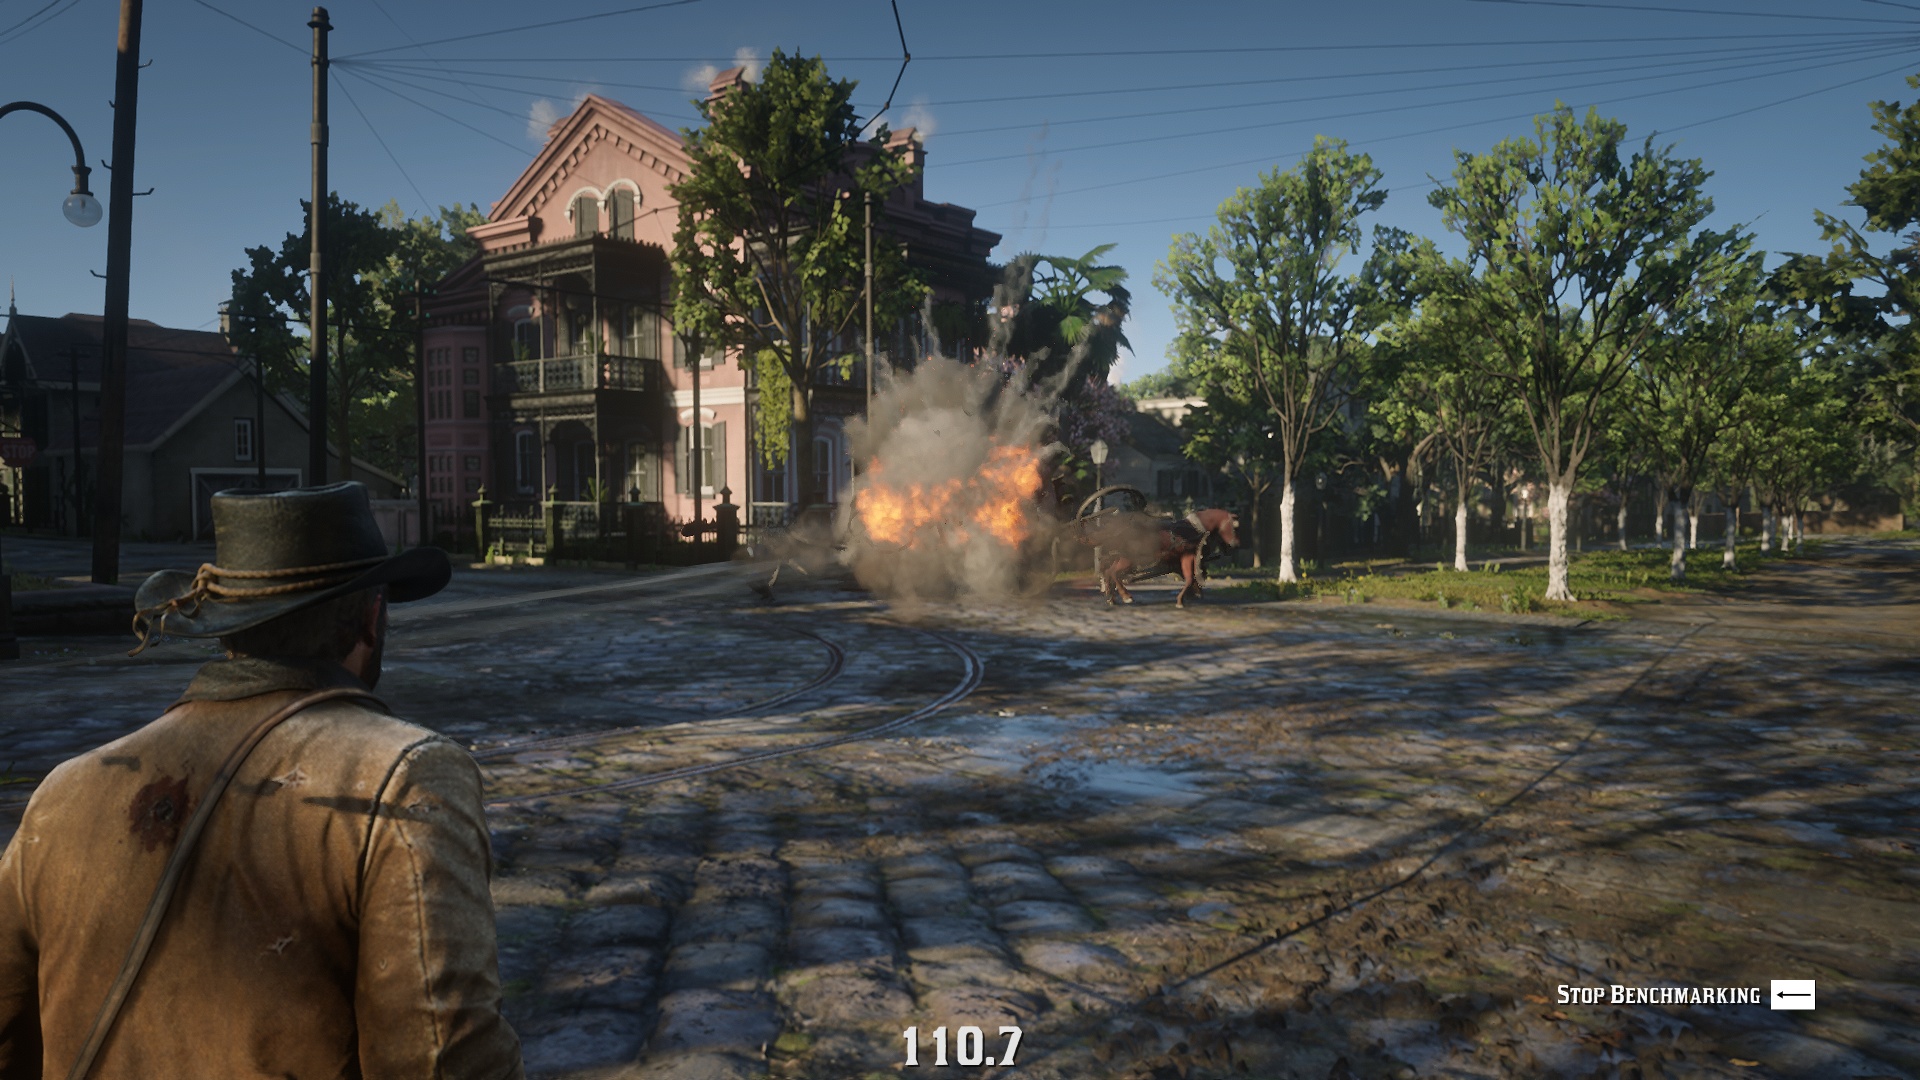
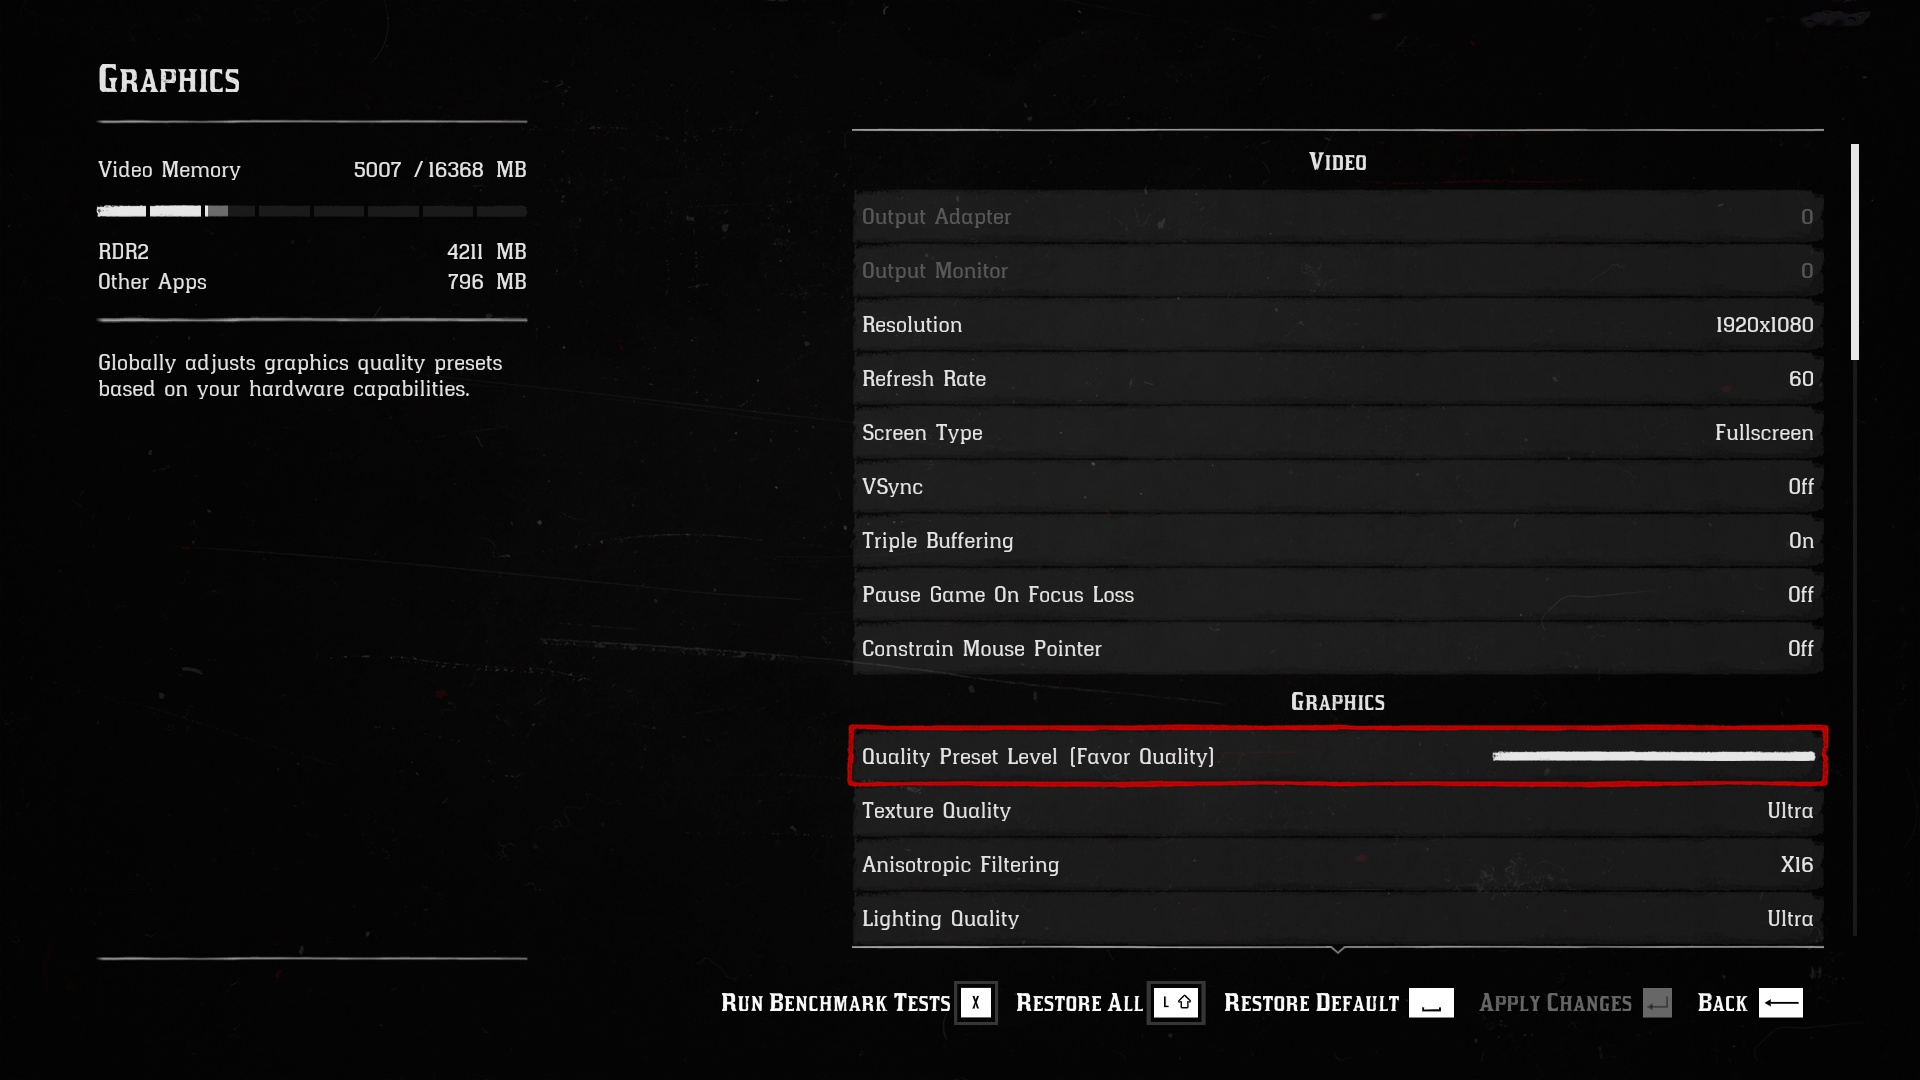
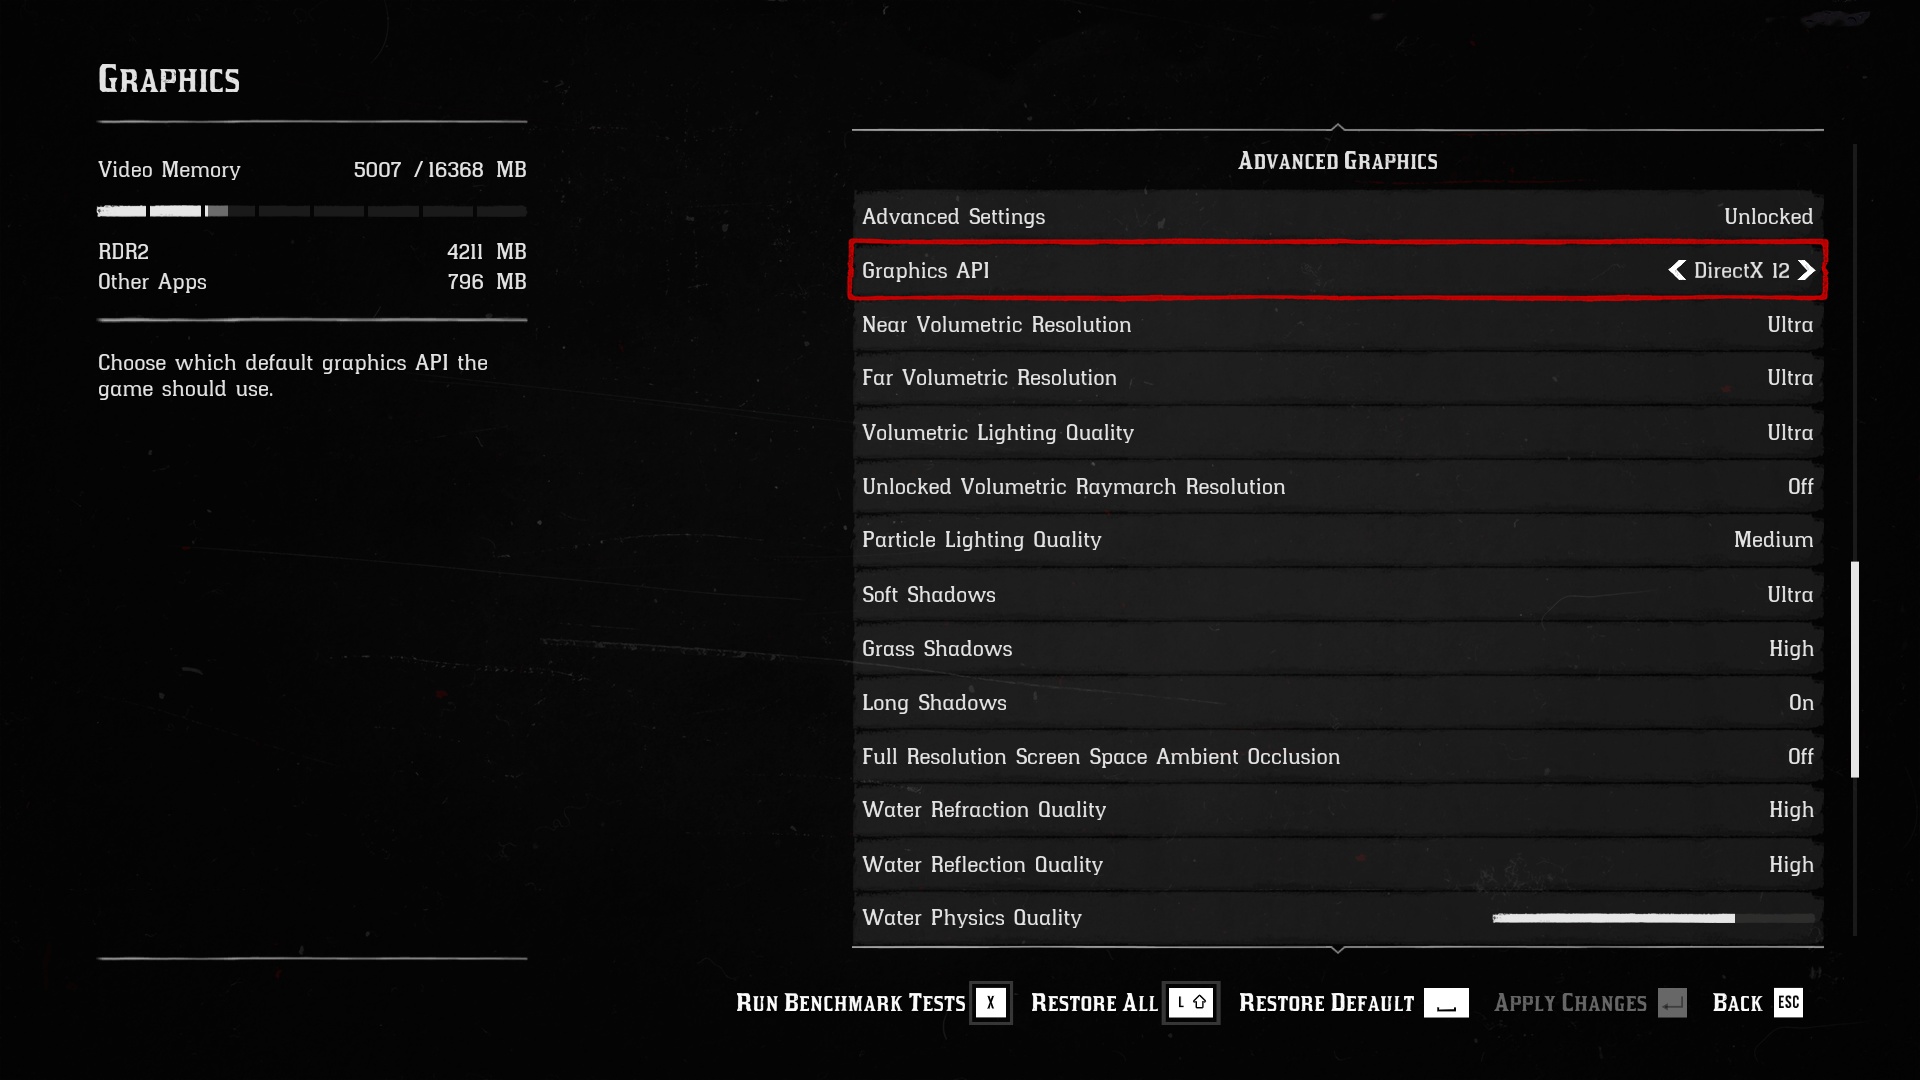
Red Dead Redemption 2 (Vulkan)
Test platform custom scene; API Vulkan, graphics settings preset Favor Quality; no extra settings.


No compromises in performance! If this is your motto, then you cannot miss the test of the graphics card GeForce RTX 3090. It will also feed 4K resolution, has the fastest ray tracing and OptiX acceleration, huge video memory and, the review sample from MSI also has many more attractive features. The biggest drawback, as is usual with high-end hardware, is the price. It is really high.
Red Dead Redemption 2 (Dx12)
Test platform custom scene; API DirectX 12, graphics settings preset Favor Quality; no extra settings.
No compromises in performance! If this is your motto, then you cannot miss the test of the graphics card GeForce RTX 3090. It will also feed 4K resolution, has the fastest ray tracing and OptiX acceleration, huge video memory and, the review sample from MSI also has many more attractive features. The biggest drawback, as is usual with high-end hardware, is the price. It is really high.
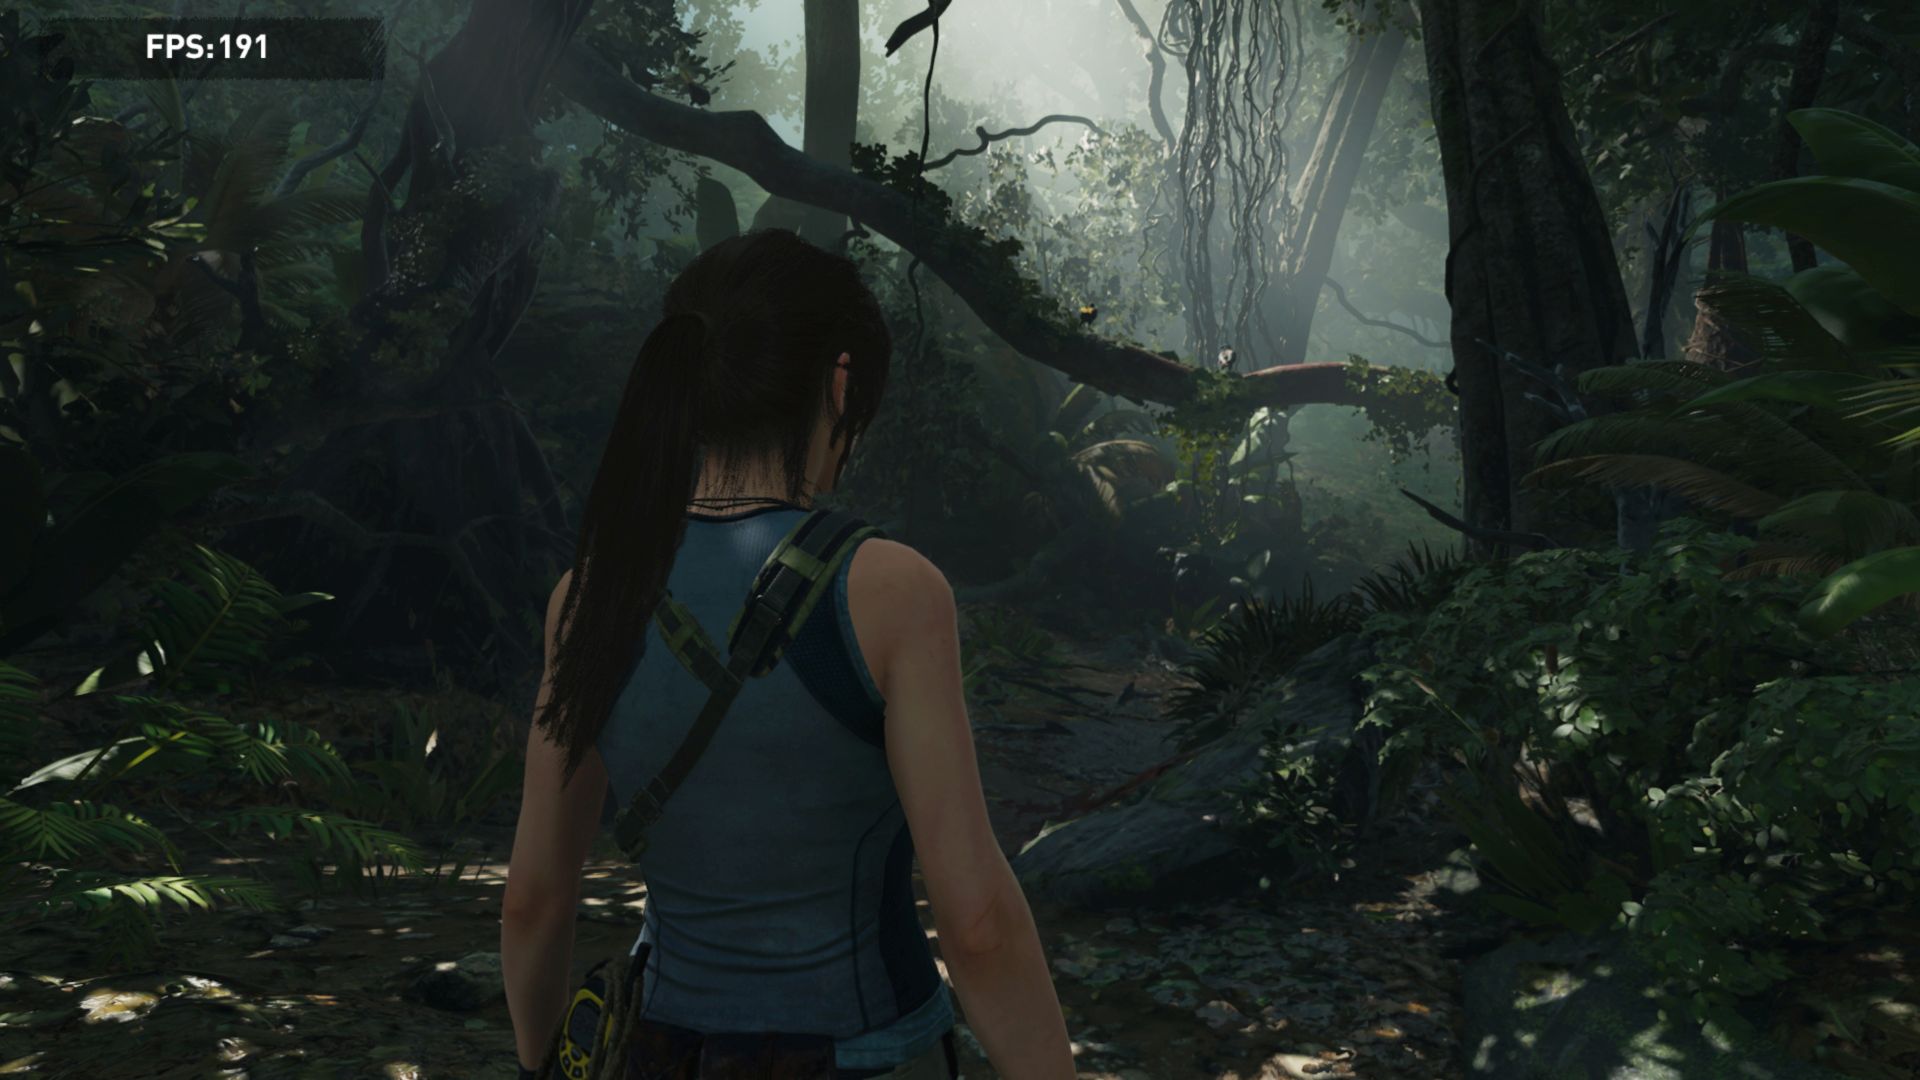
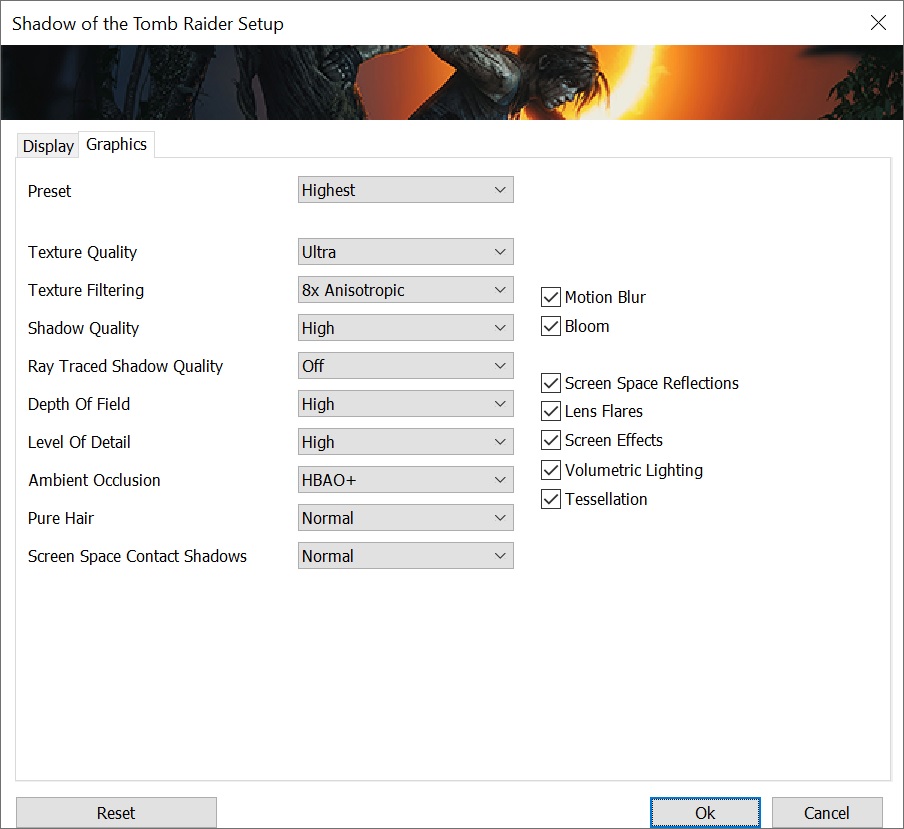
Shadow of the Tomb Raider
Test platform custom scene; API DirectX 12, graphics settings preset Highest; TAA; no extra settings.

No compromises in performance! If this is your motto, then you cannot miss the test of the graphics card GeForce RTX 3090. It will also feed 4K resolution, has the fastest ray tracing and OptiX acceleration, huge video memory and, the review sample from MSI also has many more attractive features. The biggest drawback, as is usual with high-end hardware, is the price. It is really high.
Shadow of the Tomb Raider with DXR
Test platform benchmark; API DirectX 12, graphics settings preset Highest; extra settings DXR.

Note: This game also supports DLSS and FidelityFX CAS, but since this is an older title and there are more than enough tests, we will not address this setting in standard tests. However, some testing on request is possible if you ask for it.
No compromises in performance! If this is your motto, then you cannot miss the test of the graphics card GeForce RTX 3090. It will also feed 4K resolution, has the fastest ray tracing and OptiX acceleration, huge video memory and, the review sample from MSI also has many more attractive features. The biggest drawback, as is usual with high-end hardware, is the price. It is really high.
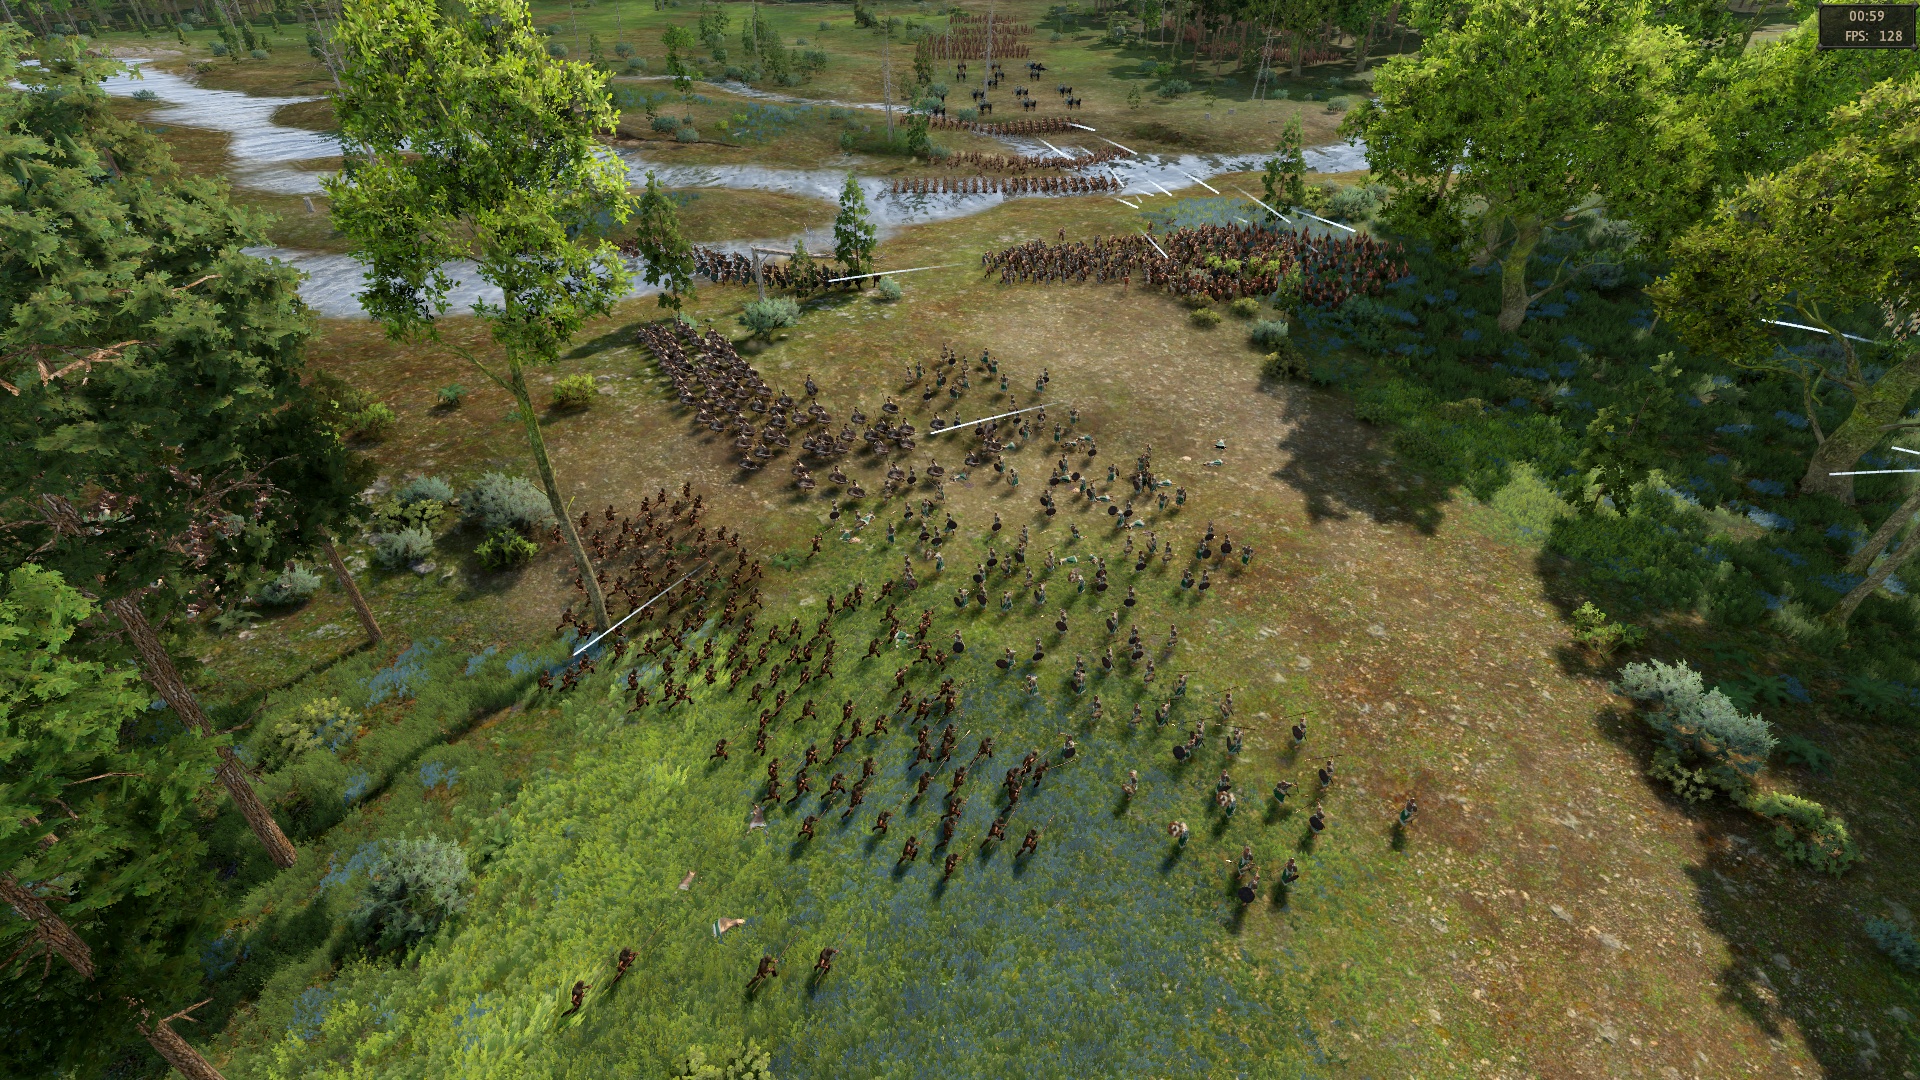
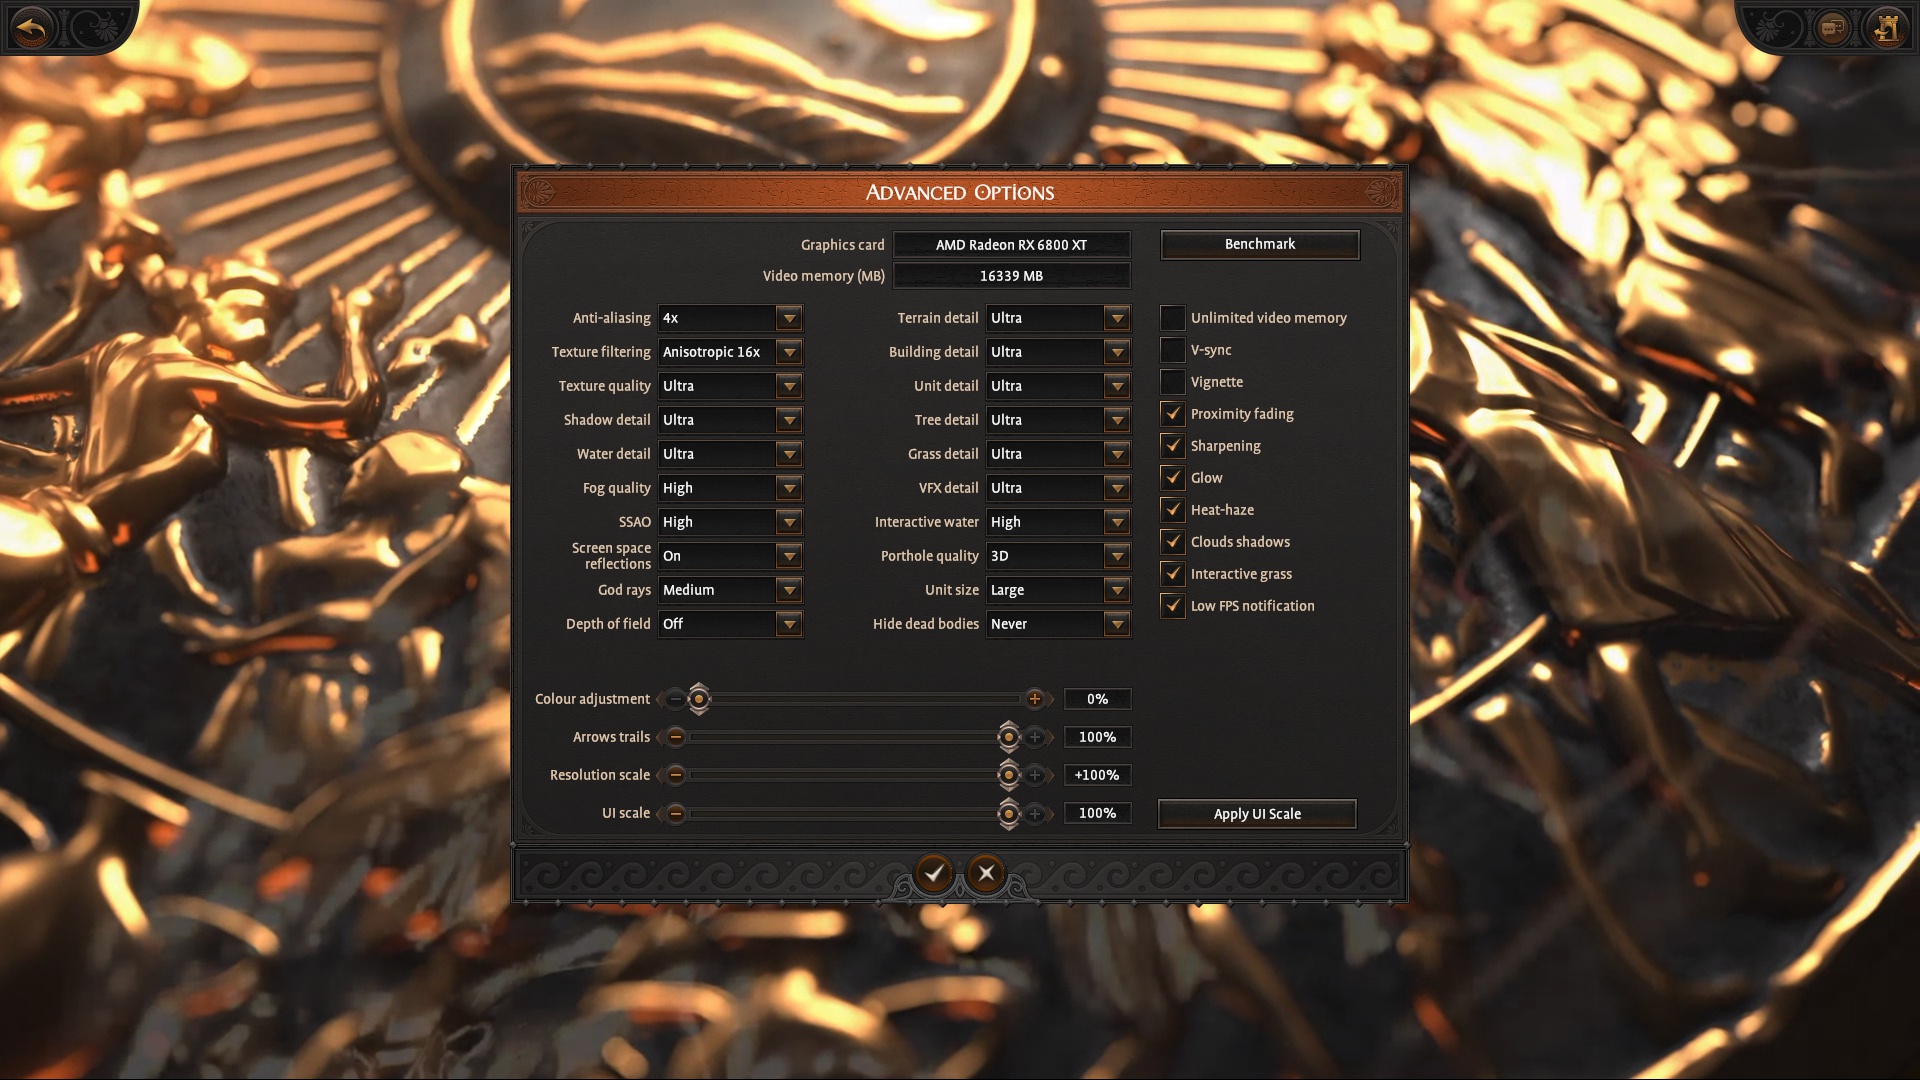
Total War Saga: Troy
Test platform benchmark; API DirectX 11, graphics settings preset Ultra; 4× AA, no extra settings.
No compromises in performance! If this is your motto, then you cannot miss the test of the graphics card GeForce RTX 3090. It will also feed 4K resolution, has the fastest ray tracing and OptiX acceleration, huge video memory and, the review sample from MSI also has many more attractive features. The biggest drawback, as is usual with high-end hardware, is the price. It is really high.
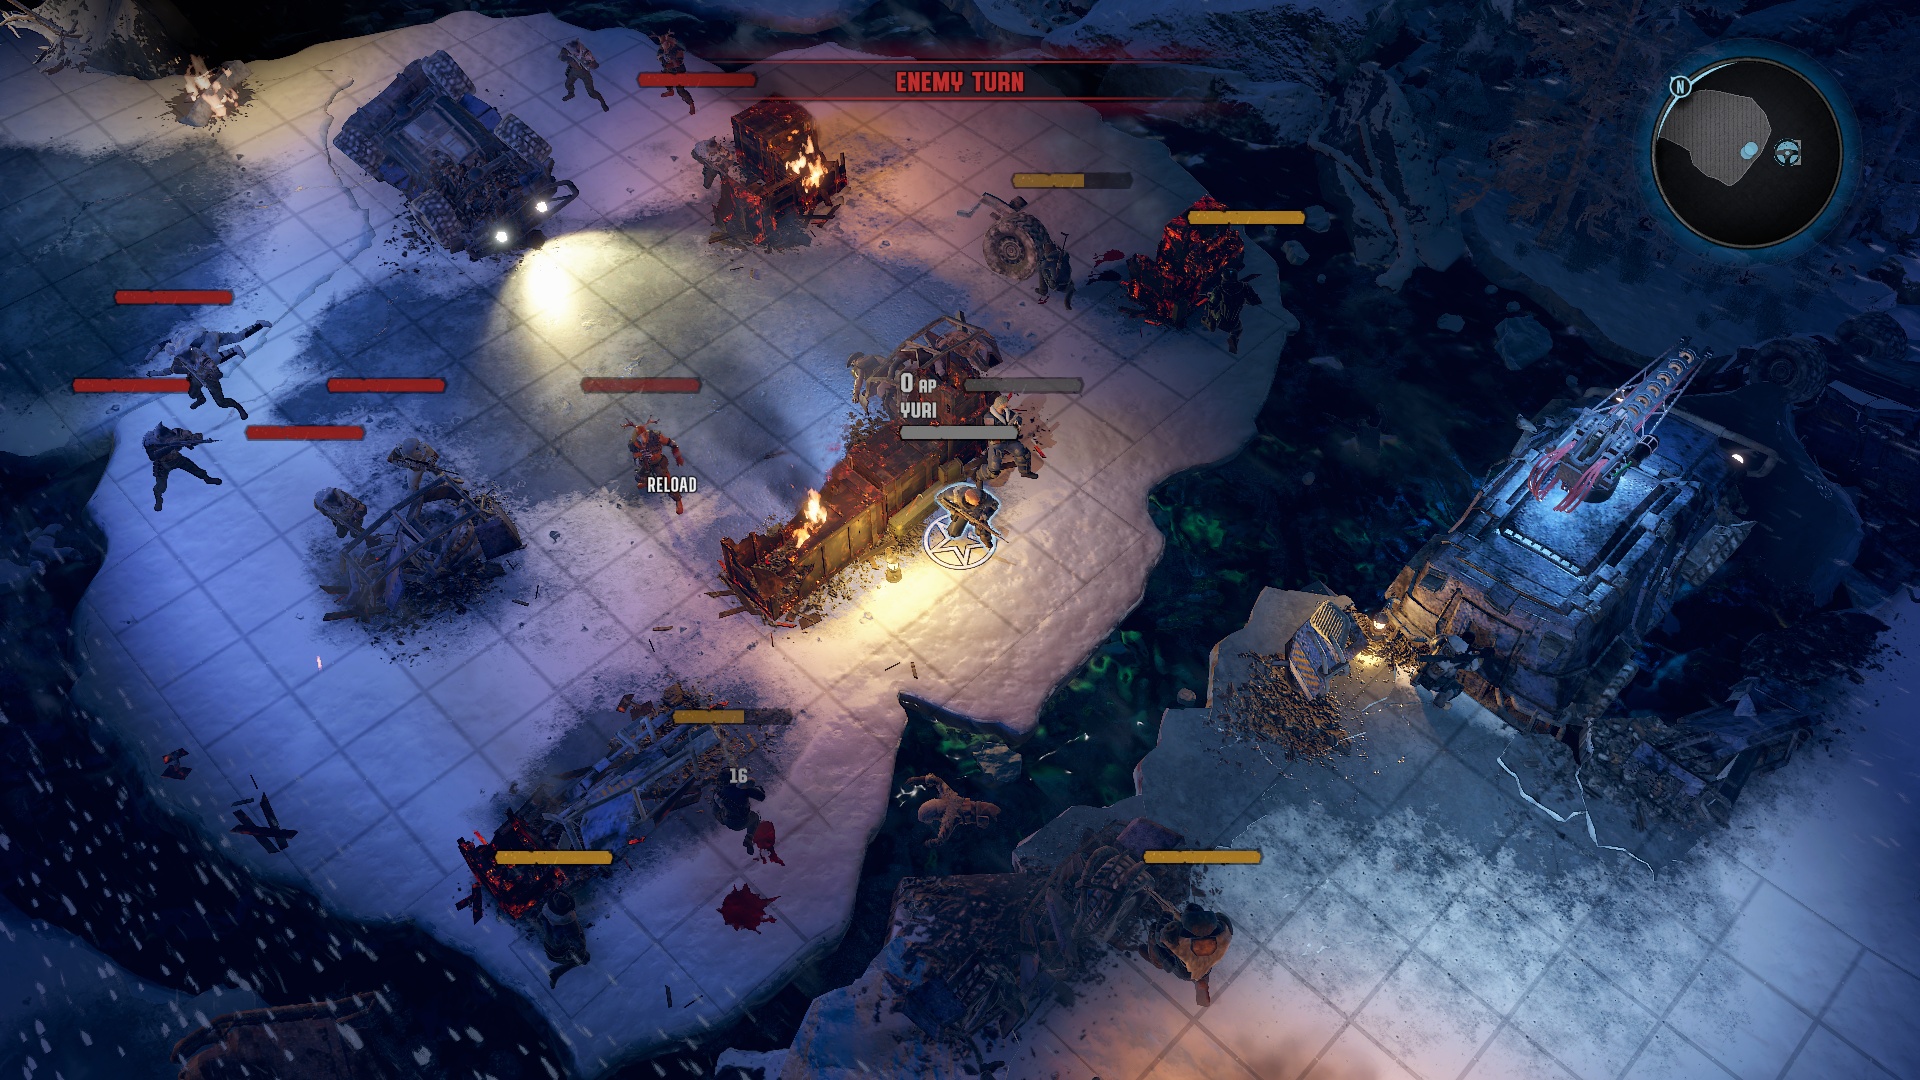
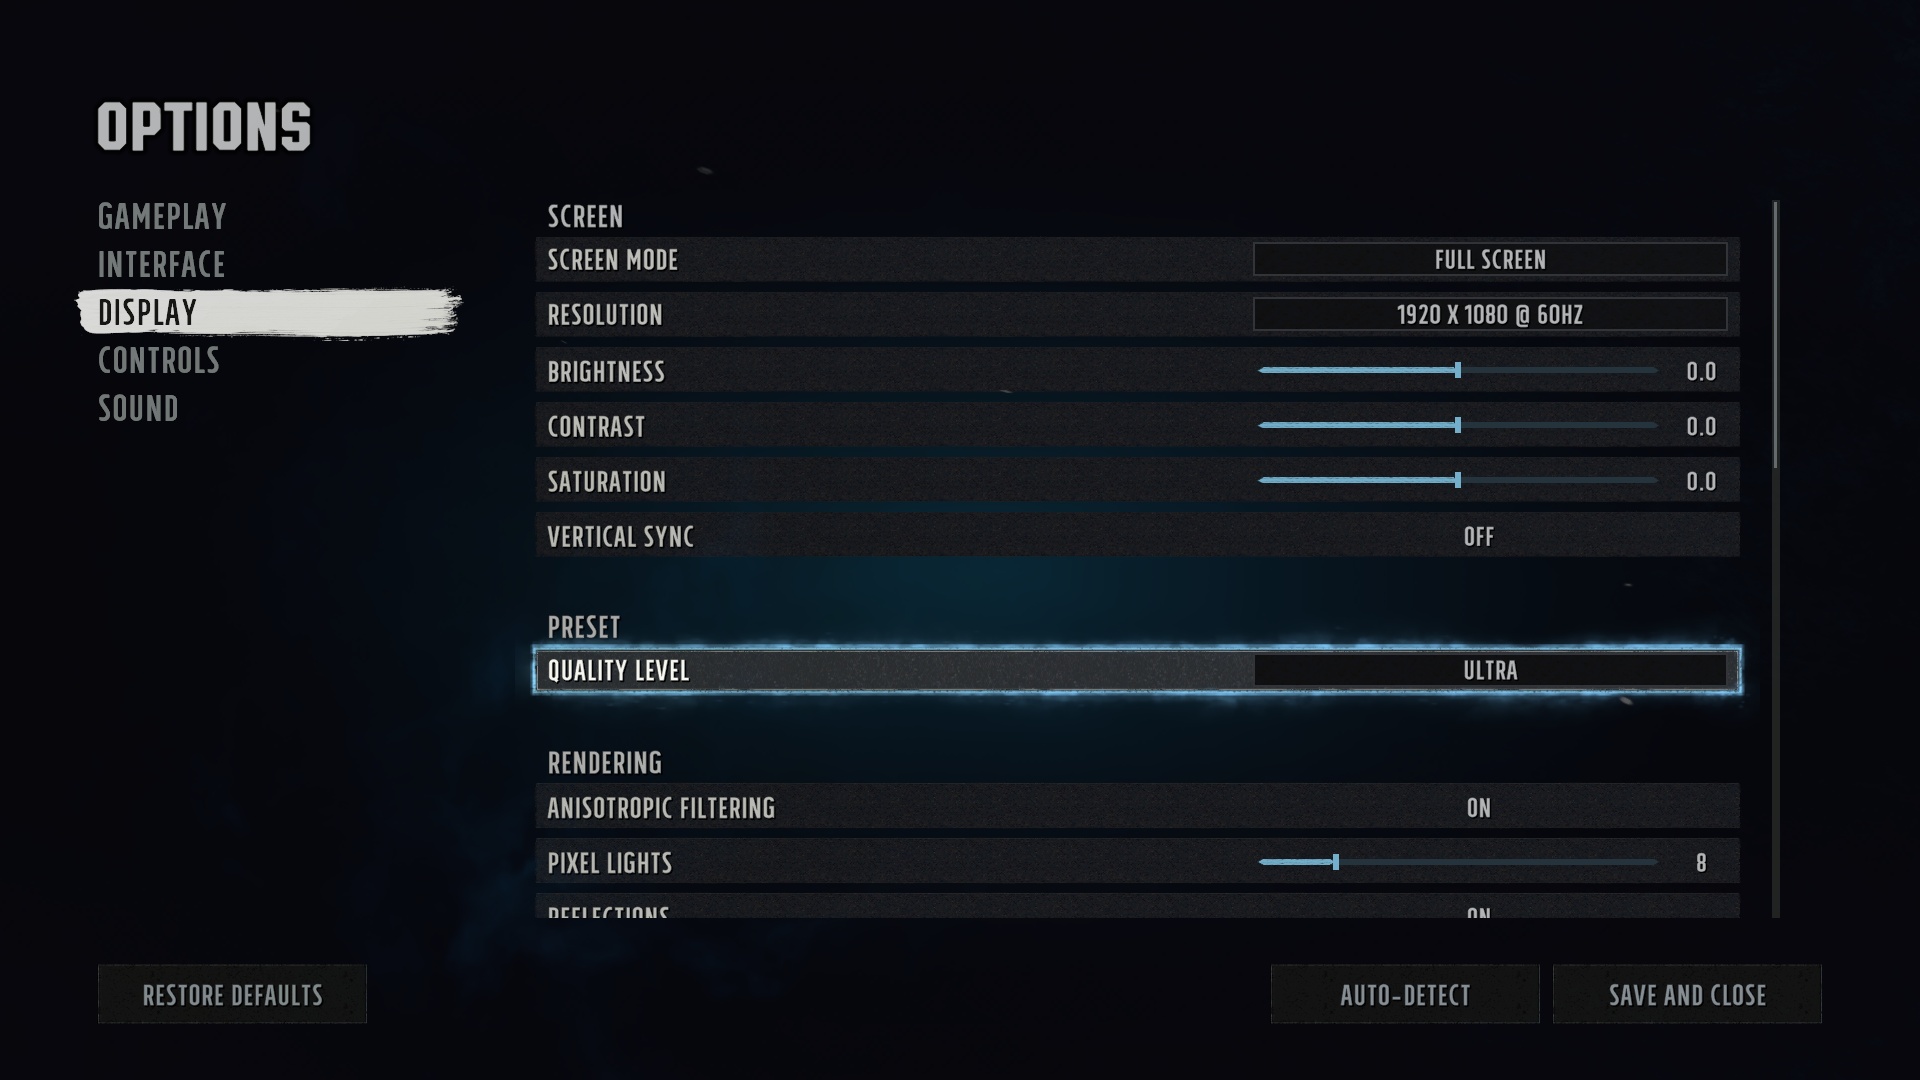
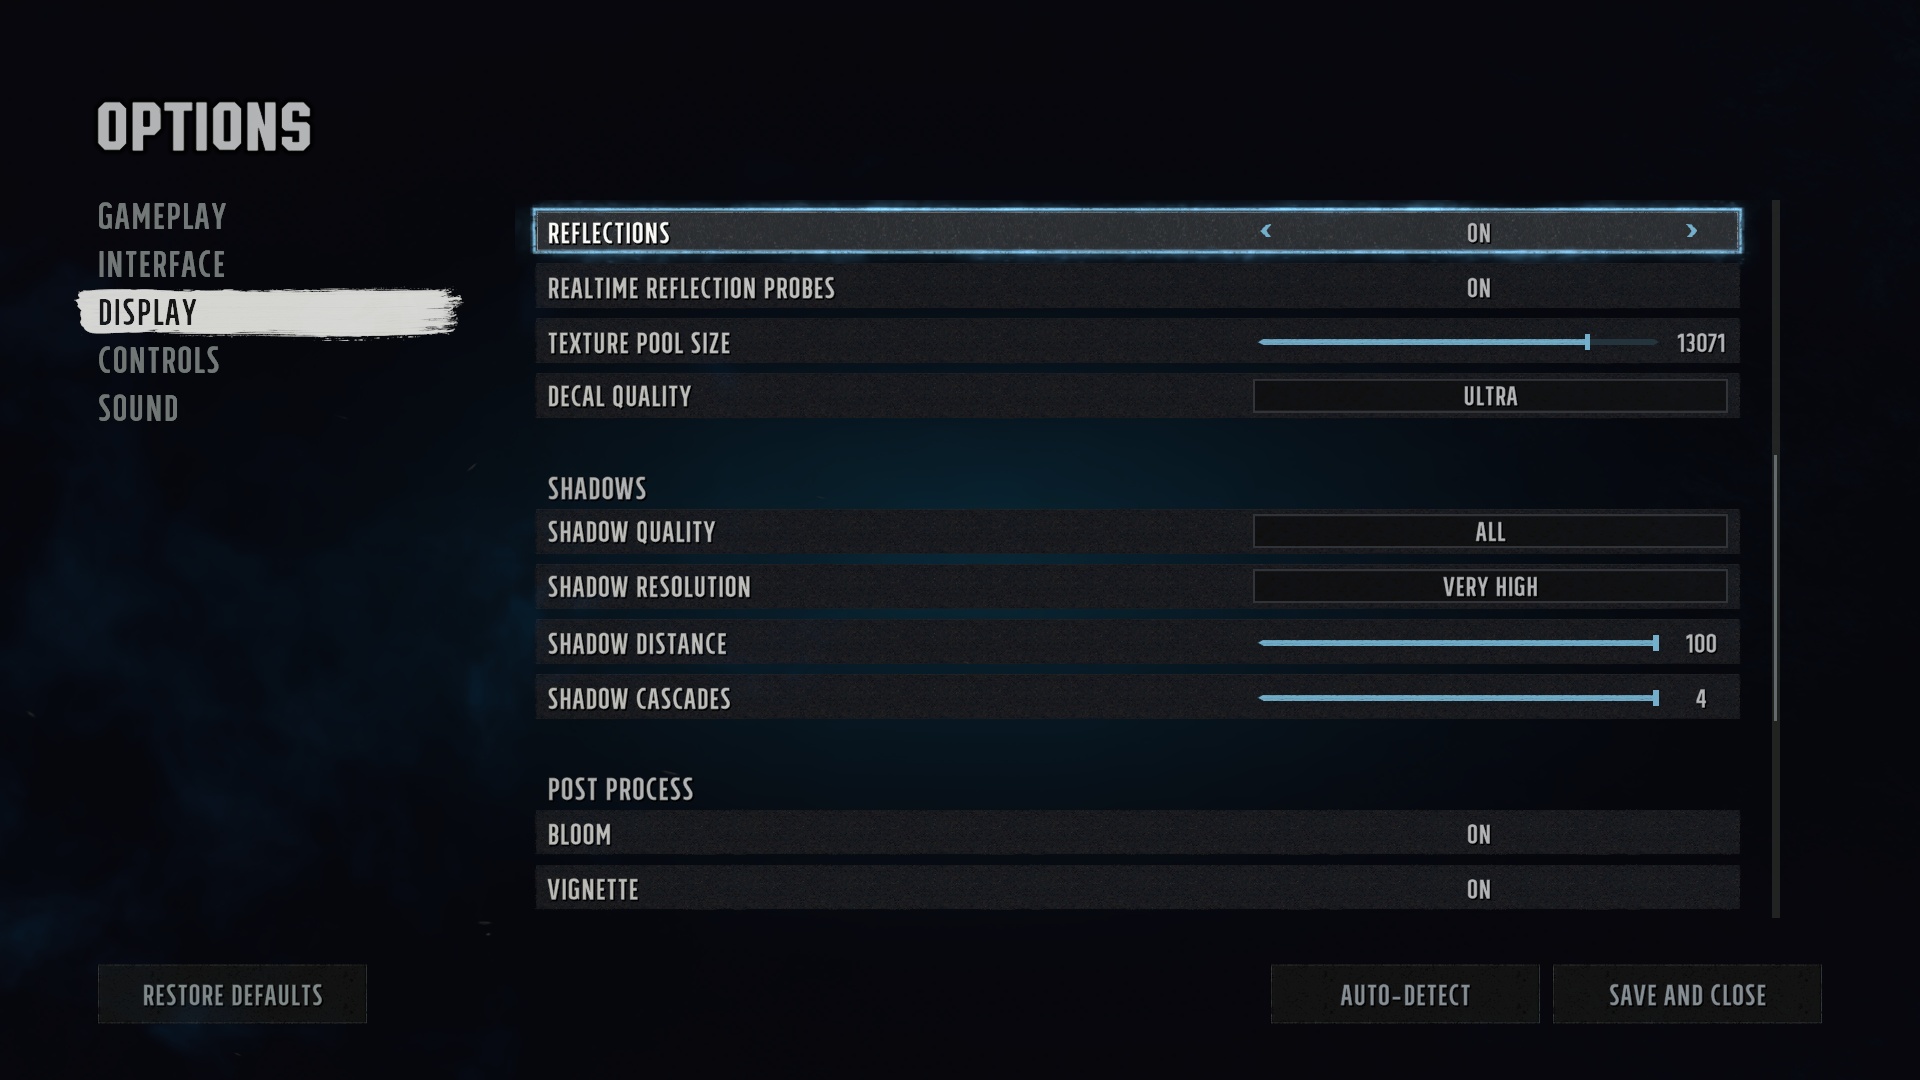
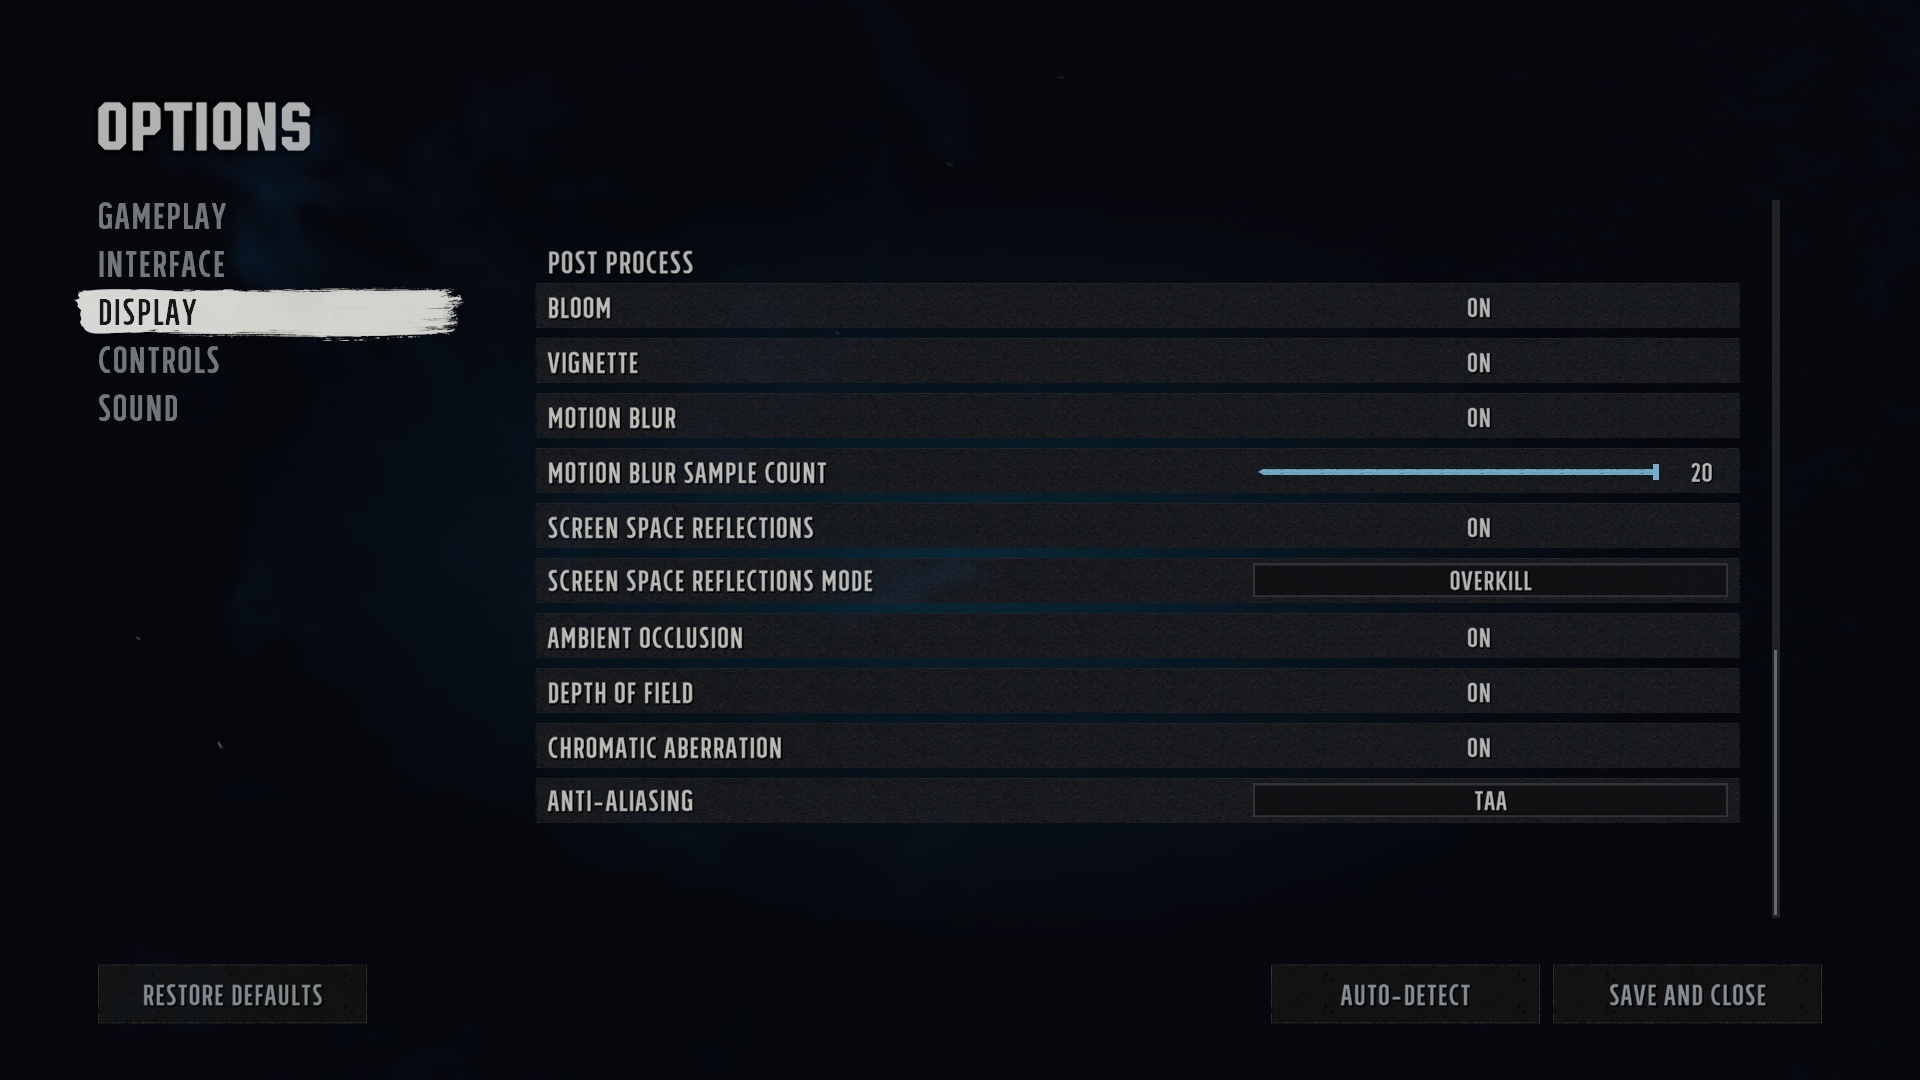
Wasteland 3
Test platform custom scene; API DirectX 11, graphics settings preset Ultra; no extra settings.
No compromises in performance! If this is your motto, then you cannot miss the test of the graphics card GeForce RTX 3090. It will also feed 4K resolution, has the fastest ray tracing and OptiX acceleration, huge video memory and, the review sample from MSI also has many more attractive features. The biggest drawback, as is usual with high-end hardware, is the price. It is really high.
Overall game performance
Performance per euro
No compromises in performance! If this is your motto, then you cannot miss the test of the graphics card GeForce RTX 3090. It will also feed 4K resolution, has the fastest ray tracing and OptiX acceleration, huge video memory and, the review sample from MSI also has many more attractive features. The biggest drawback, as is usual with high-end hardware, is the price. It is really high.
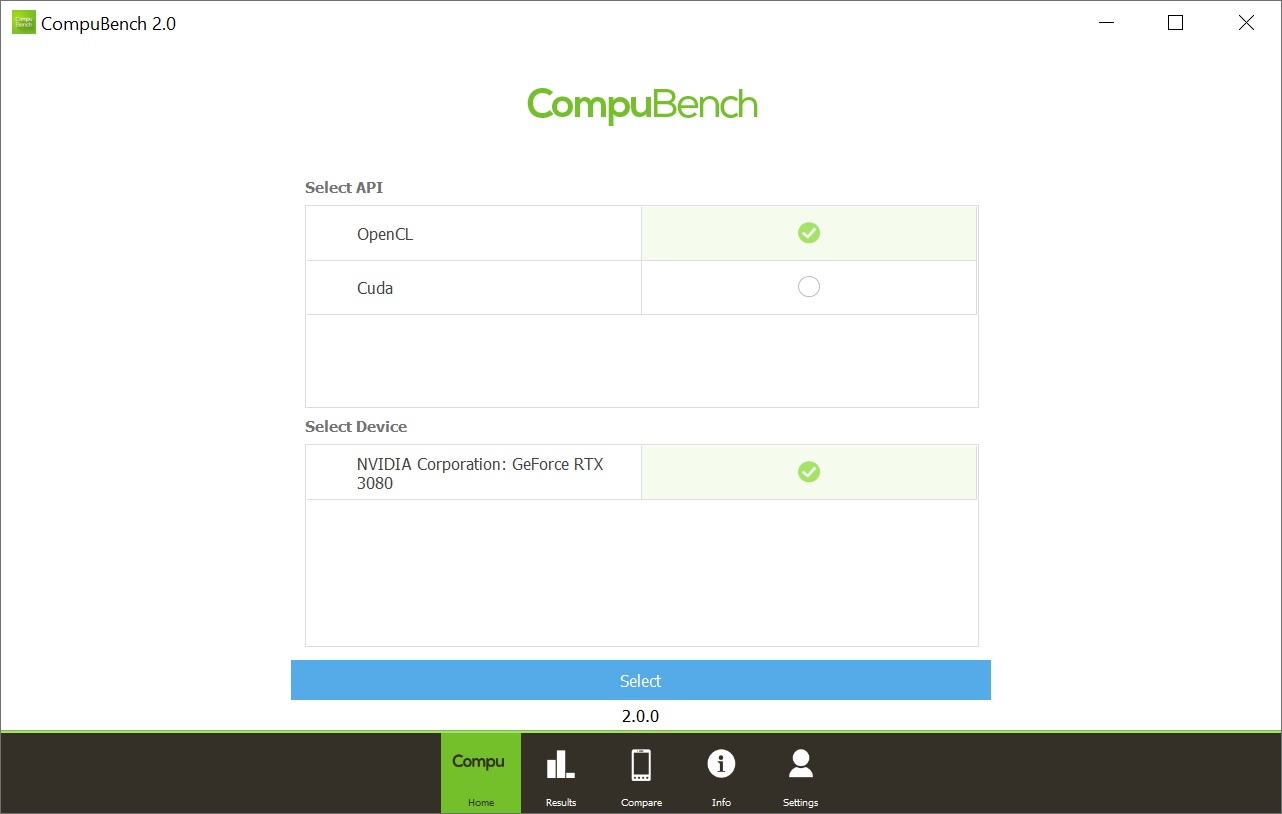
CompuBench 2.0 (OpenCL)
Test platform benchmark; API OpenCL; no extra settings.
Game Effects
Advanced Compute
High Quality Computer Generated Imagery and Rendering
Computer Vision
No compromises in performance! If this is your motto, then you cannot miss the test of the graphics card GeForce RTX 3090. It will also feed 4K resolution, has the fastest ray tracing and OptiX acceleration, huge video memory and, the review sample from MSI also has many more attractive features. The biggest drawback, as is usual with high-end hardware, is the price. It is really high.
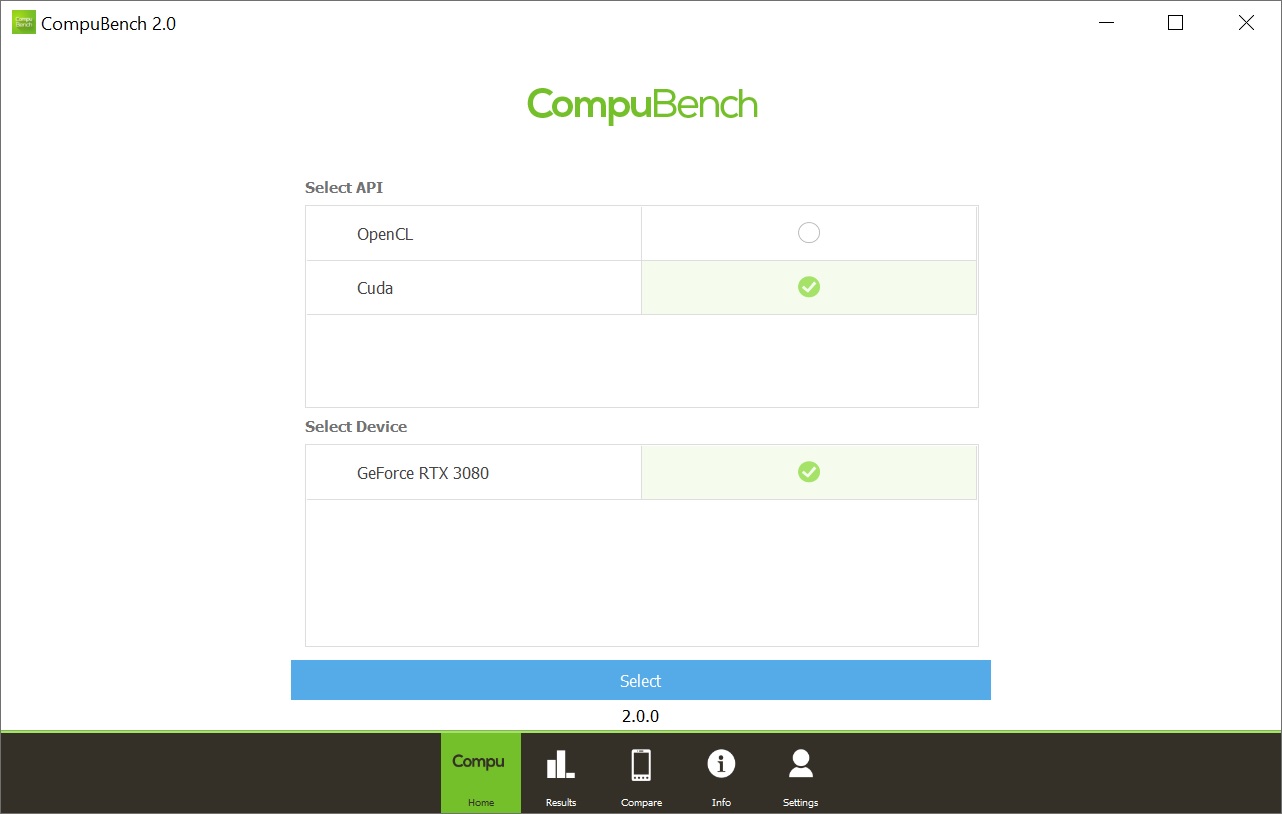
ComputeBench 2.0 (CUDA)
Test platform benchmark; API Nvidia CUDA; no extra settings.
Game Effects
Advanced Compute
High Quality Computer Generated Imagery and Rendering
Computer Vision
No compromises in performance! If this is your motto, then you cannot miss the test of the graphics card GeForce RTX 3090. It will also feed 4K resolution, has the fastest ray tracing and OptiX acceleration, huge video memory and, the review sample from MSI also has many more attractive features. The biggest drawback, as is usual with high-end hardware, is the price. It is really high.
SPECviewperf 2020
Test platform benchmark; API OpenGL and DirectX; no extra settings.
SPECworkstation 3
No compromises in performance! If this is your motto, then you cannot miss the test of the graphics card GeForce RTX 3090. It will also feed 4K resolution, has the fastest ray tracing and OptiX acceleration, huge video memory and, the review sample from MSI also has many more attractive features. The biggest drawback, as is usual with high-end hardware, is the price. It is really high.
FLOPS, IOPS and memory speed tests
Test platform benchmark; app version 6.32.5600; no extra settings.
No compromises in performance! If this is your motto, then you cannot miss the test of the graphics card GeForce RTX 3090. It will also feed 4K resolution, has the fastest ray tracing and OptiX acceleration, huge video memory and, the review sample from MSI also has many more attractive features. The biggest drawback, as is usual with high-end hardware, is the price. It is really high.
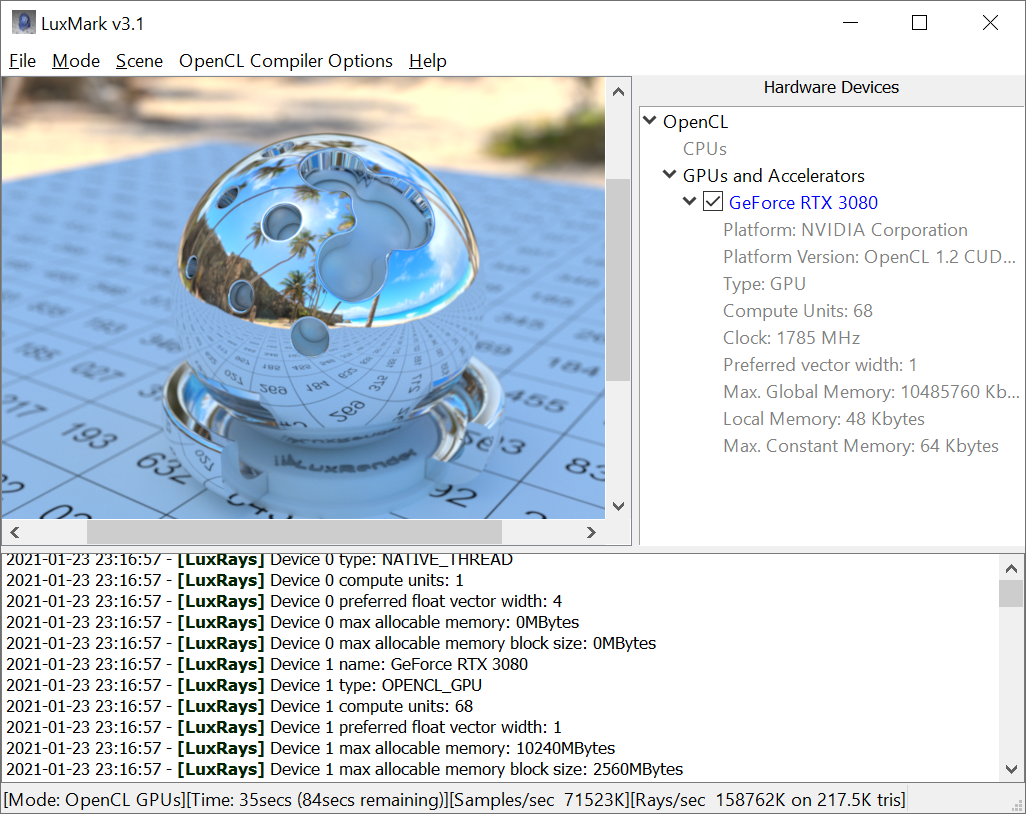
LuxMark
Test platform benchmark; API OpenCL; no extra settings.
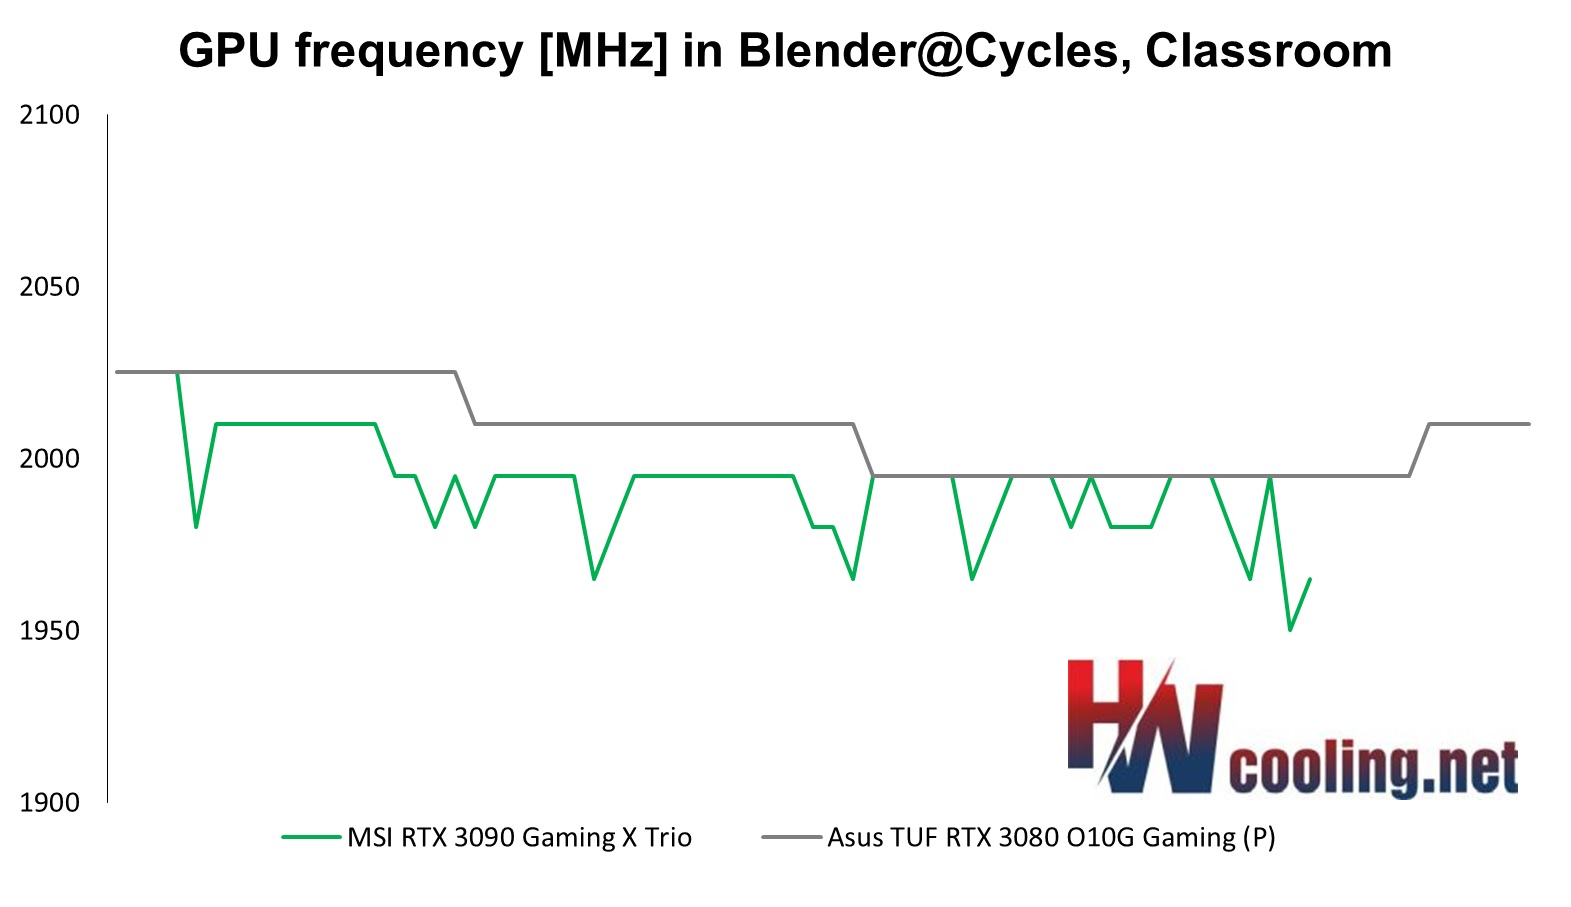
Blender@Cycles
Test platform render BMW and Classroom; renderer Cycles, 12 tiles; extra settings OpenCL for Radeon and CUDA for GeForce. Like the majority of people use it. OpenCL with GeForce is always slow because path tracing does not support GPU acceleration and the CPU does the computing. Nvidia OptiX is tested separately on supported cards (GeForce RTX) and the results are drawn in a separate graph.

No compromises in performance! If this is your motto, then you cannot miss the test of the graphics card GeForce RTX 3090. It will also feed 4K resolution, has the fastest ray tracing and OptiX acceleration, huge video memory and, the review sample from MSI also has many more attractive features. The biggest drawback, as is usual with high-end hardware, is the price. It is really high.
Blender@Radeon ProRender
Test platform render BMW and Classroom; renderer Radeon ProRender, 1024 samples; extra settings OpenCL for Radeon and CUDA for GeForce. Nvidia OptiX is tested separately on supported cards (GeForce RTX) and the results are drawn in a separate graph.
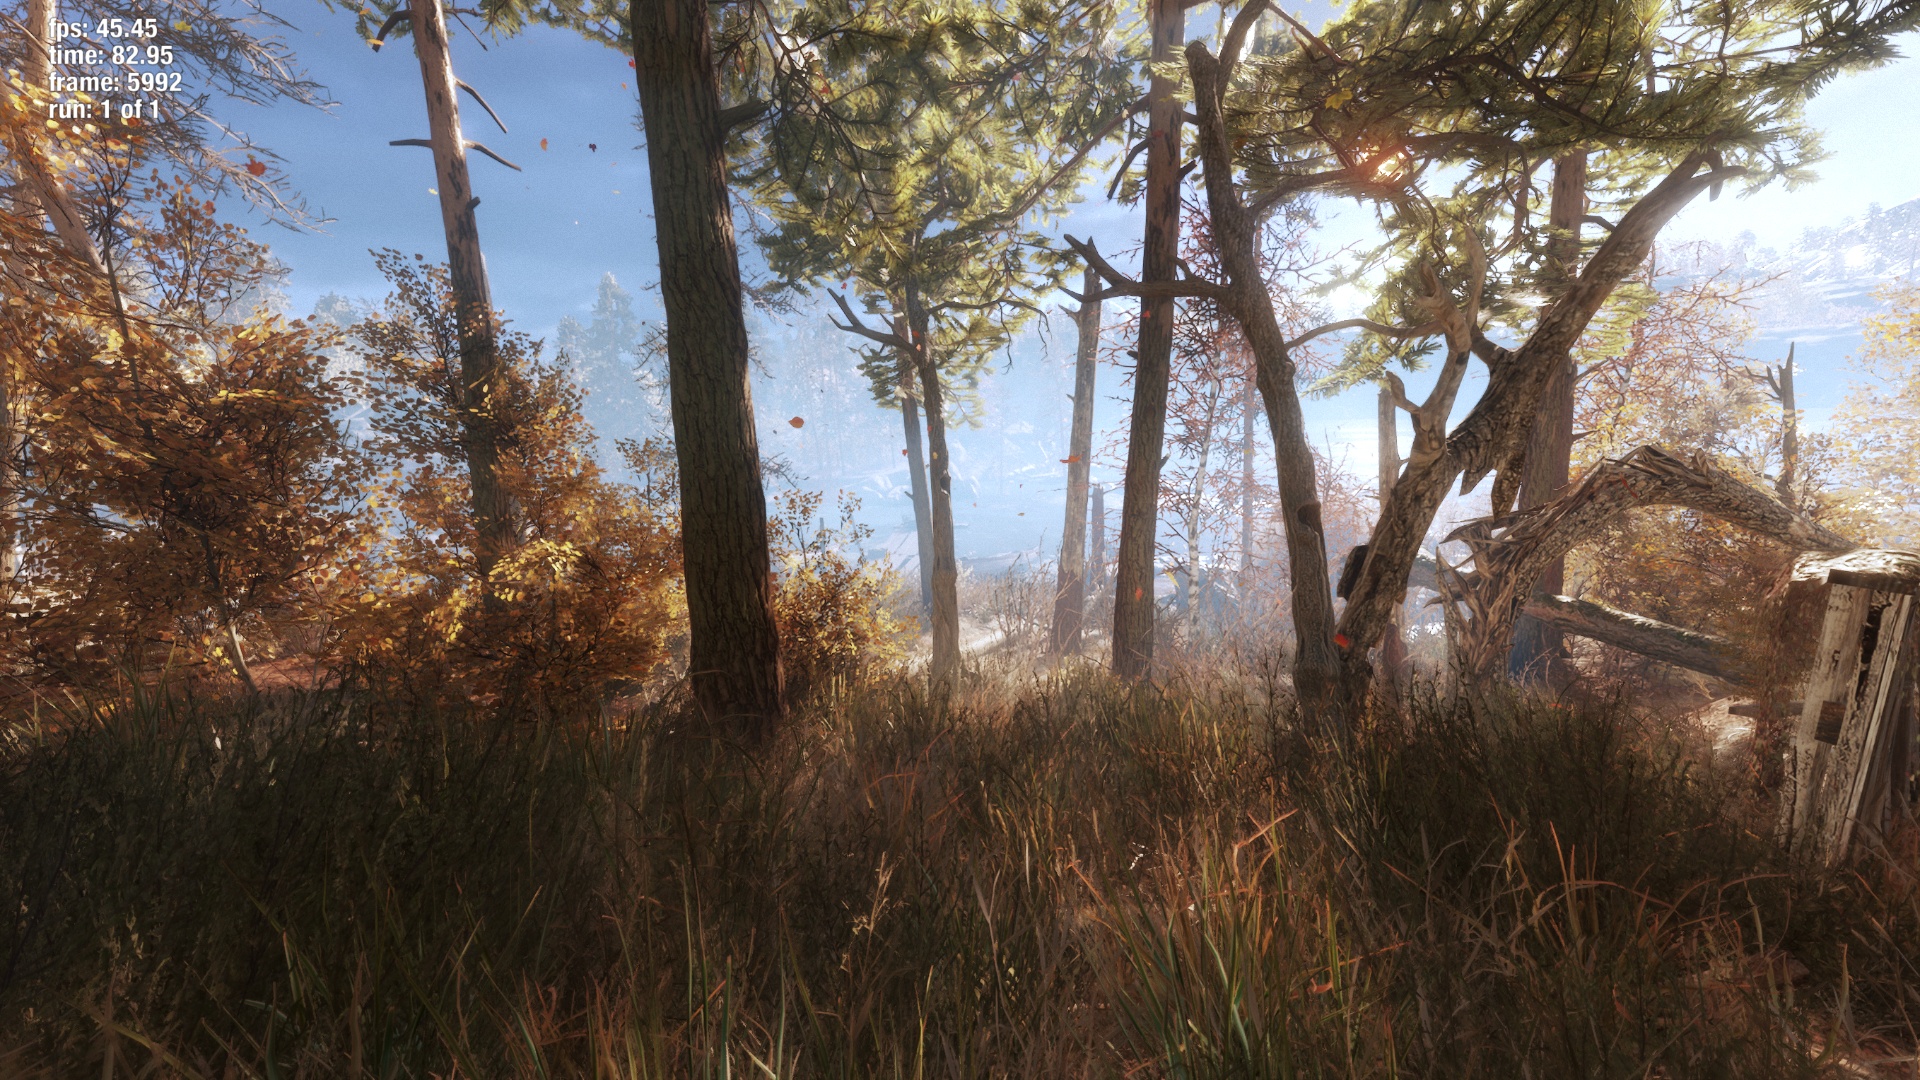
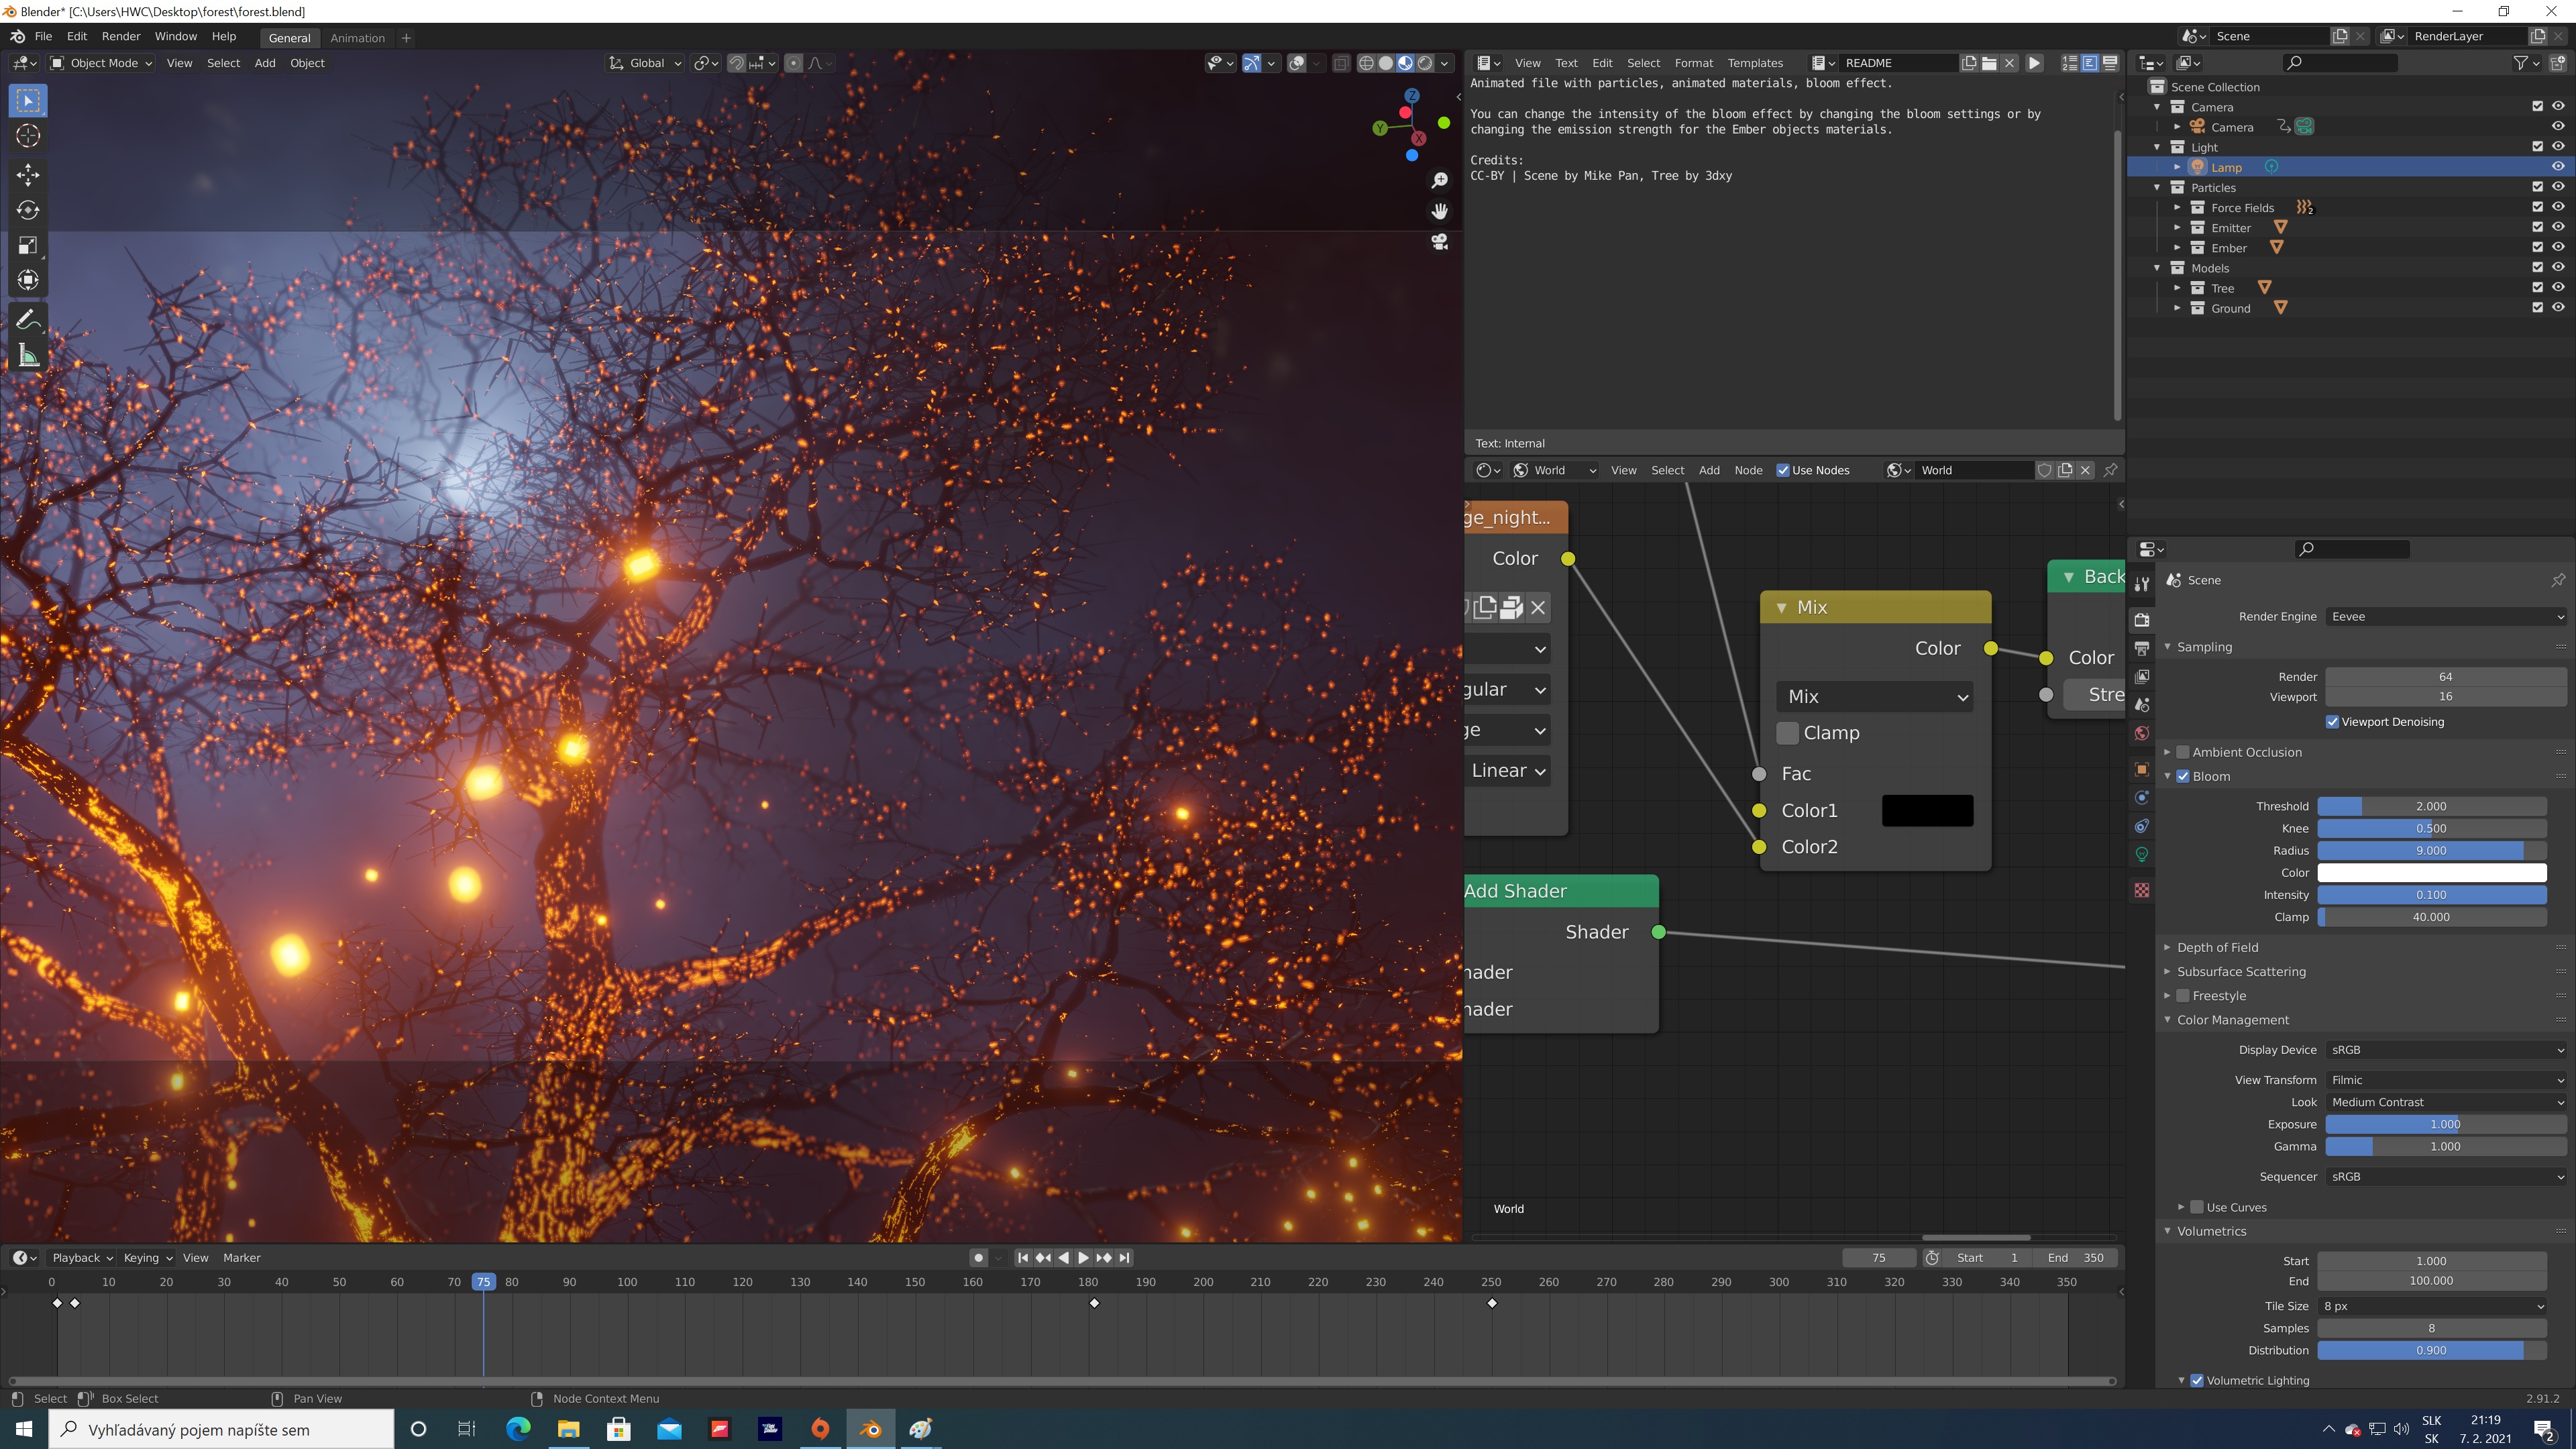
Blender@Eevee
Test platform animation render Ember Forest; renderer Eevee, 350 images; extra settings OpenCL.
No compromises in performance! If this is your motto, then you cannot miss the test of the graphics card GeForce RTX 3090. It will also feed 4K resolution, has the fastest ray tracing and OptiX acceleration, huge video memory and, the review sample from MSI also has many more attractive features. The biggest drawback, as is usual with high-end hardware, is the price. It is really high.
Photo editing
Adobe Photoshop: Test platform PugetBench; no extra settings.
Affinity Photo: Test platform built-in benchmark; no extra settings.
Adobe Lightroom: Test platform custom 1-gigabyte archive of 42 raw photos (CR2) taken with DSLR; no extra settings.

No compromises in performance! If this is your motto, then you cannot miss the test of the graphics card GeForce RTX 3090. It will also feed 4K resolution, has the fastest ray tracing and OptiX acceleration, huge video memory and, the review sample from MSI also has many more attractive features. The biggest drawback, as is usual with high-end hardware, is the price. It is really high.
Broadcasting
OBS Studio and XSplit: Test platform F1 2020 benchmark; extra settings – enabled encoders AMD VCE/Nvidia Nvenc (AVC/H.264), output resolution 2560 × 1440 px (60 fps), target bitrate 19,700 kbps.
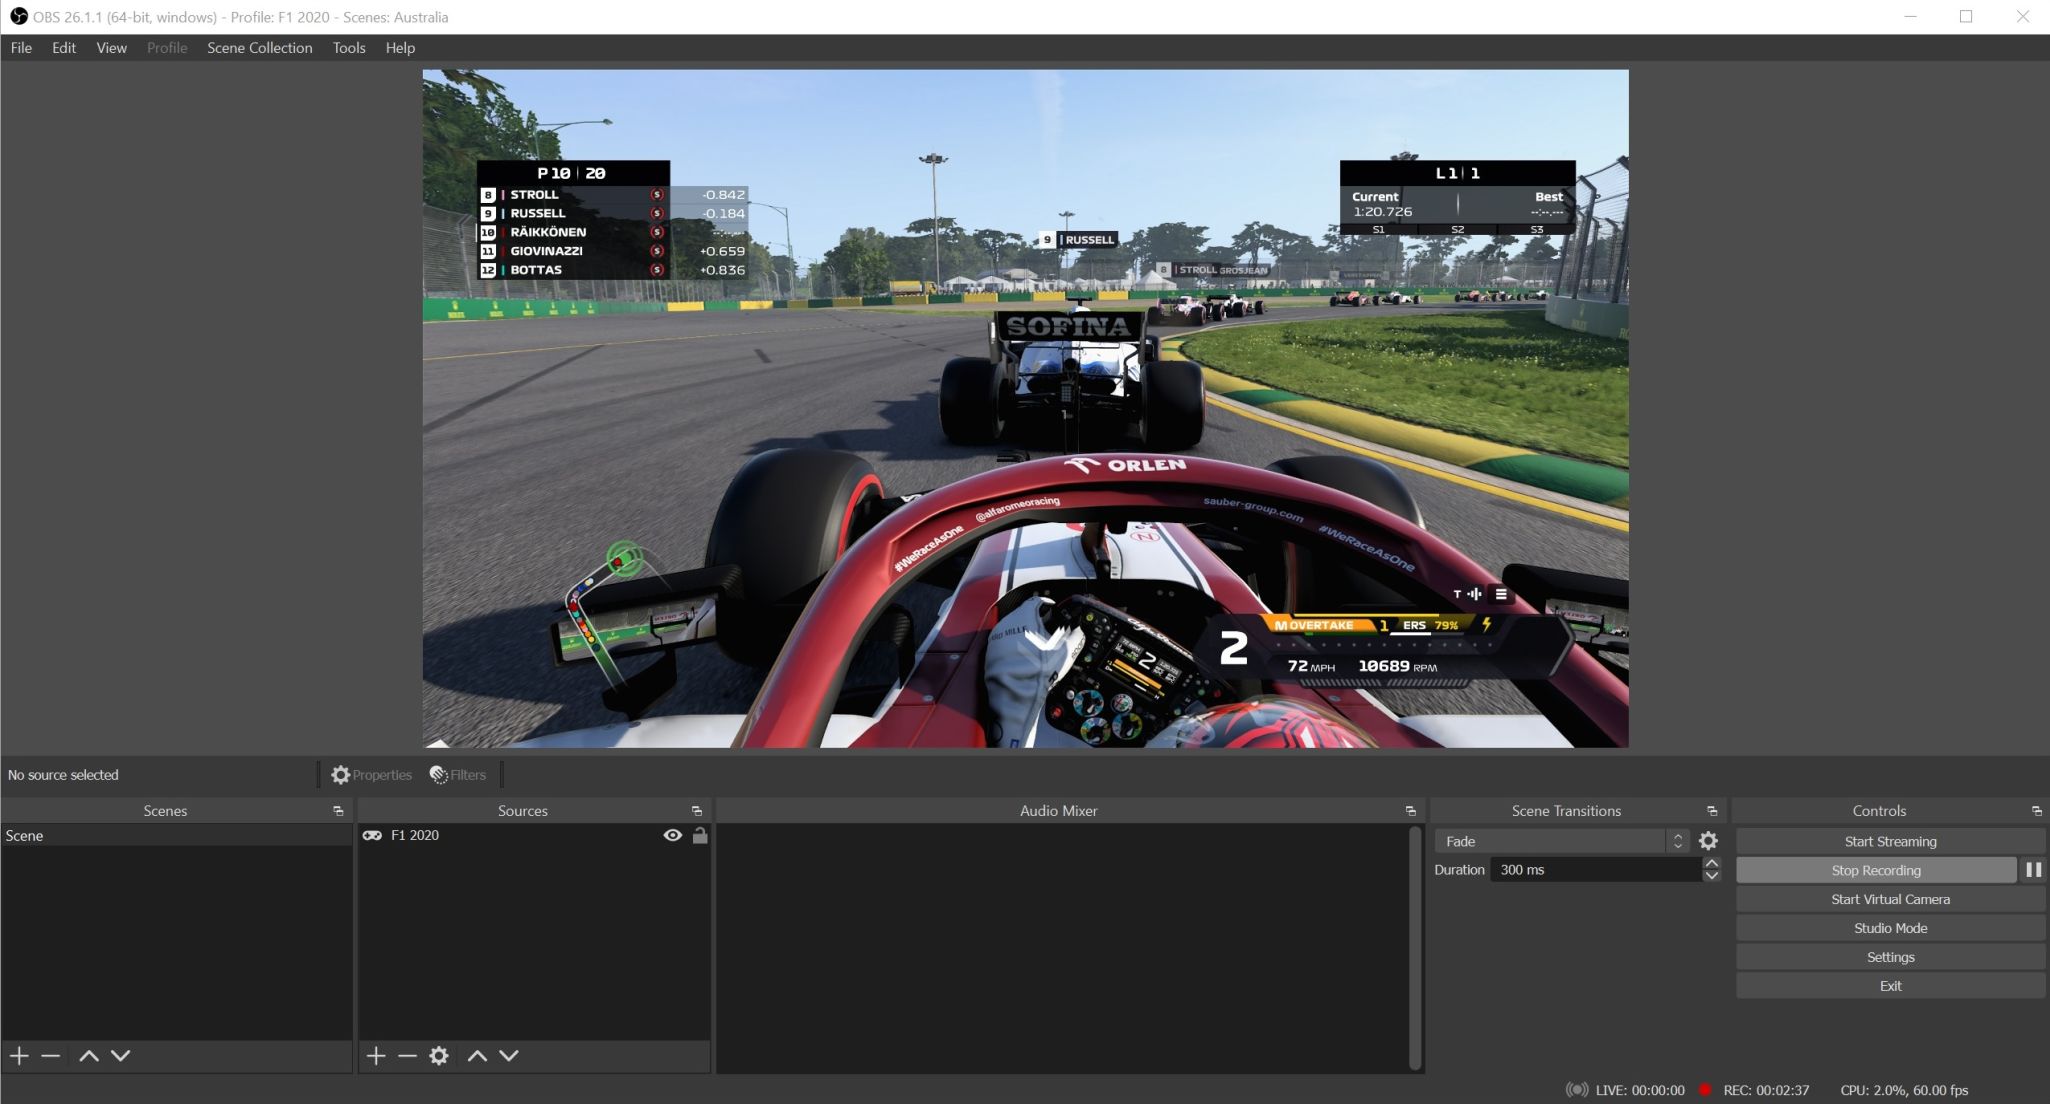
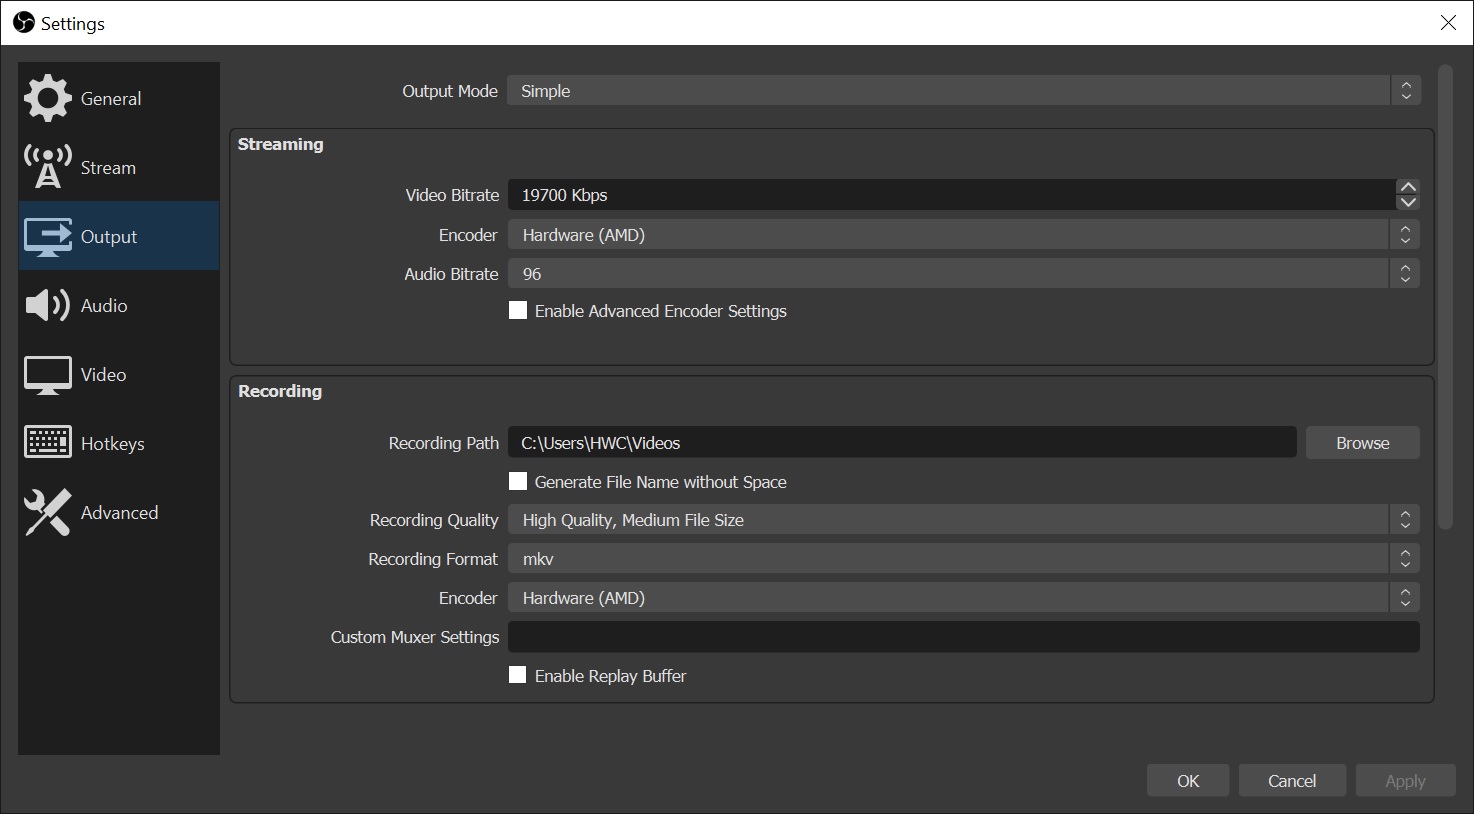
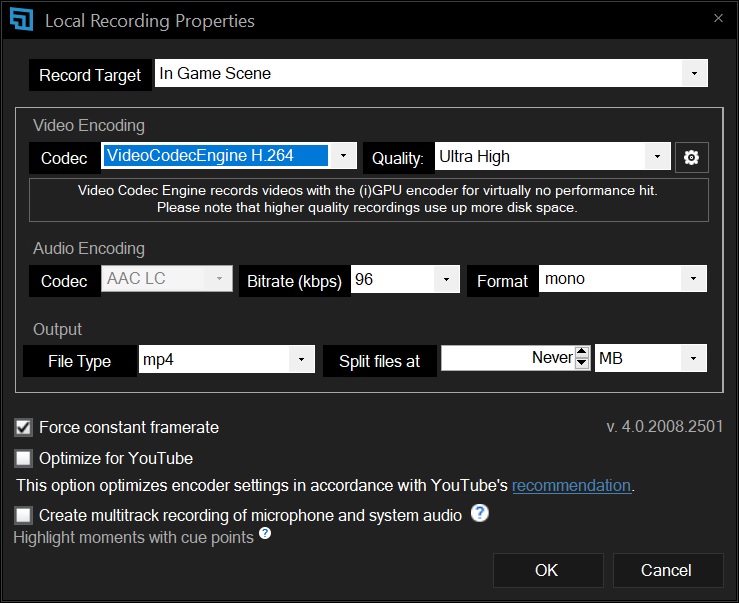
No compromises in performance! If this is your motto, then you cannot miss the test of the graphics card GeForce RTX 3090. It will also feed 4K resolution, has the fastest ray tracing and OptiX acceleration, huge video memory and, the review sample from MSI also has many more attractive features. The biggest drawback, as is usual with high-end hardware, is the price. It is really high.
Password cracking
Test platform Hashcat; no extra settings. You can easily try the tests yourself. Just download the binary and enter the cipher you are interested in using the numeric code on the command line.
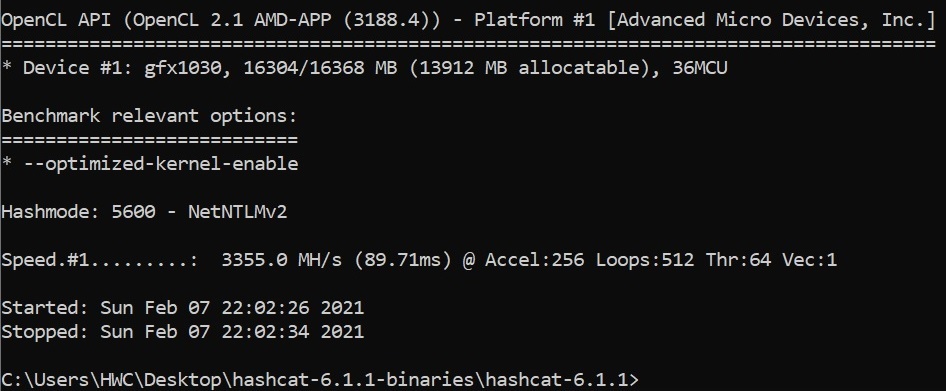
No compromises in performance! If this is your motto, then you cannot miss the test of the graphics card GeForce RTX 3090. It will also feed 4K resolution, has the fastest ray tracing and OptiX acceleration, huge video memory and, the review sample from MSI also has many more attractive features. The biggest drawback, as is usual with high-end hardware, is the price. It is really high.
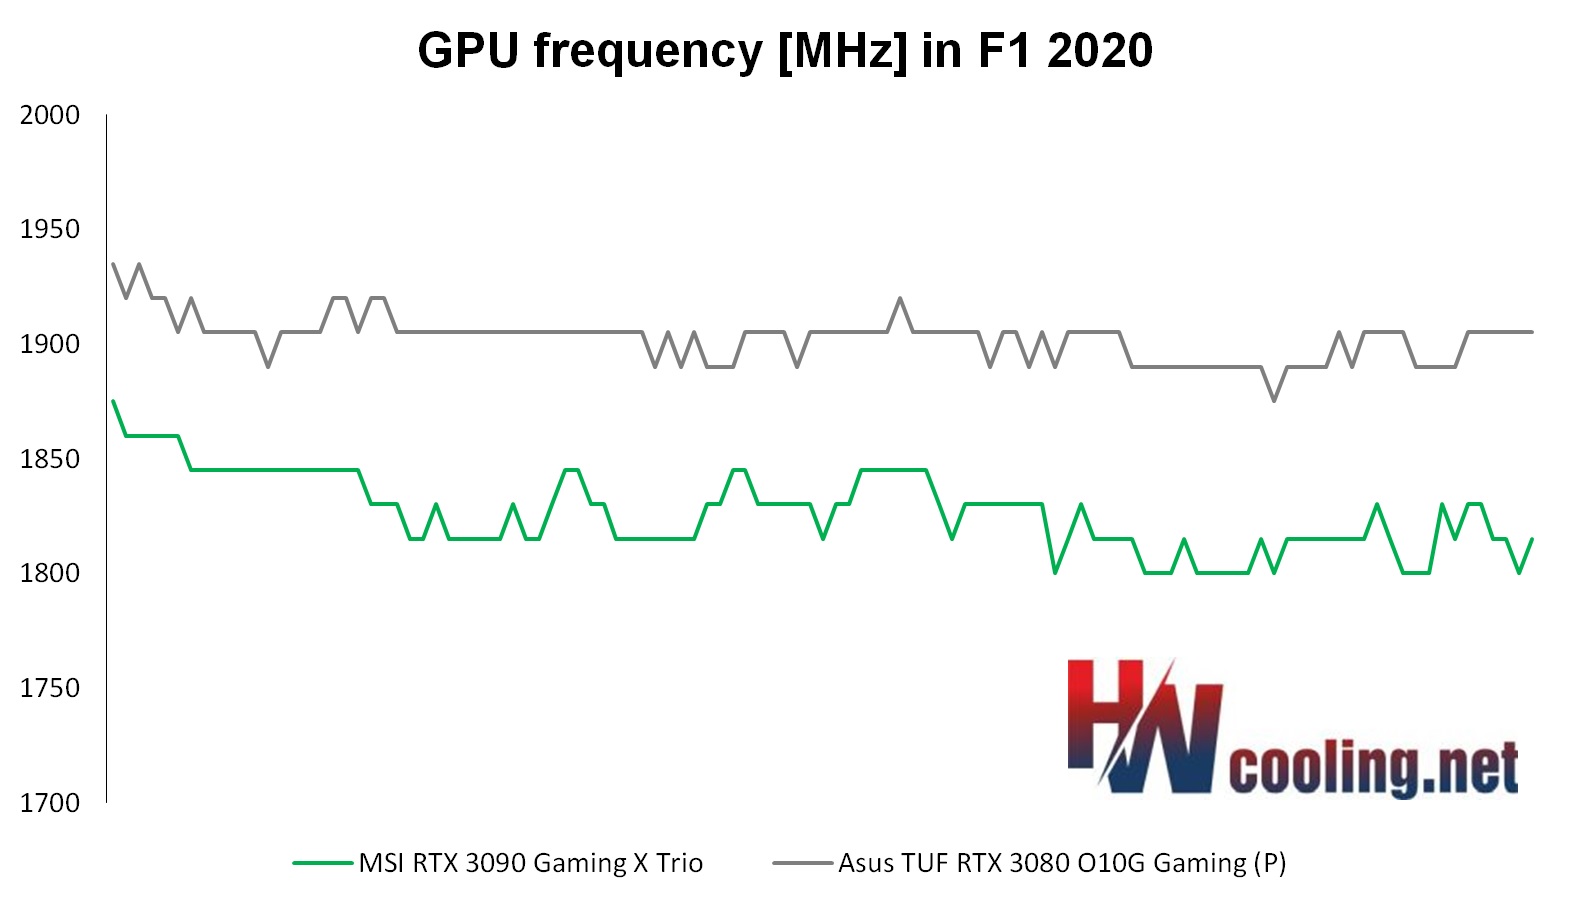
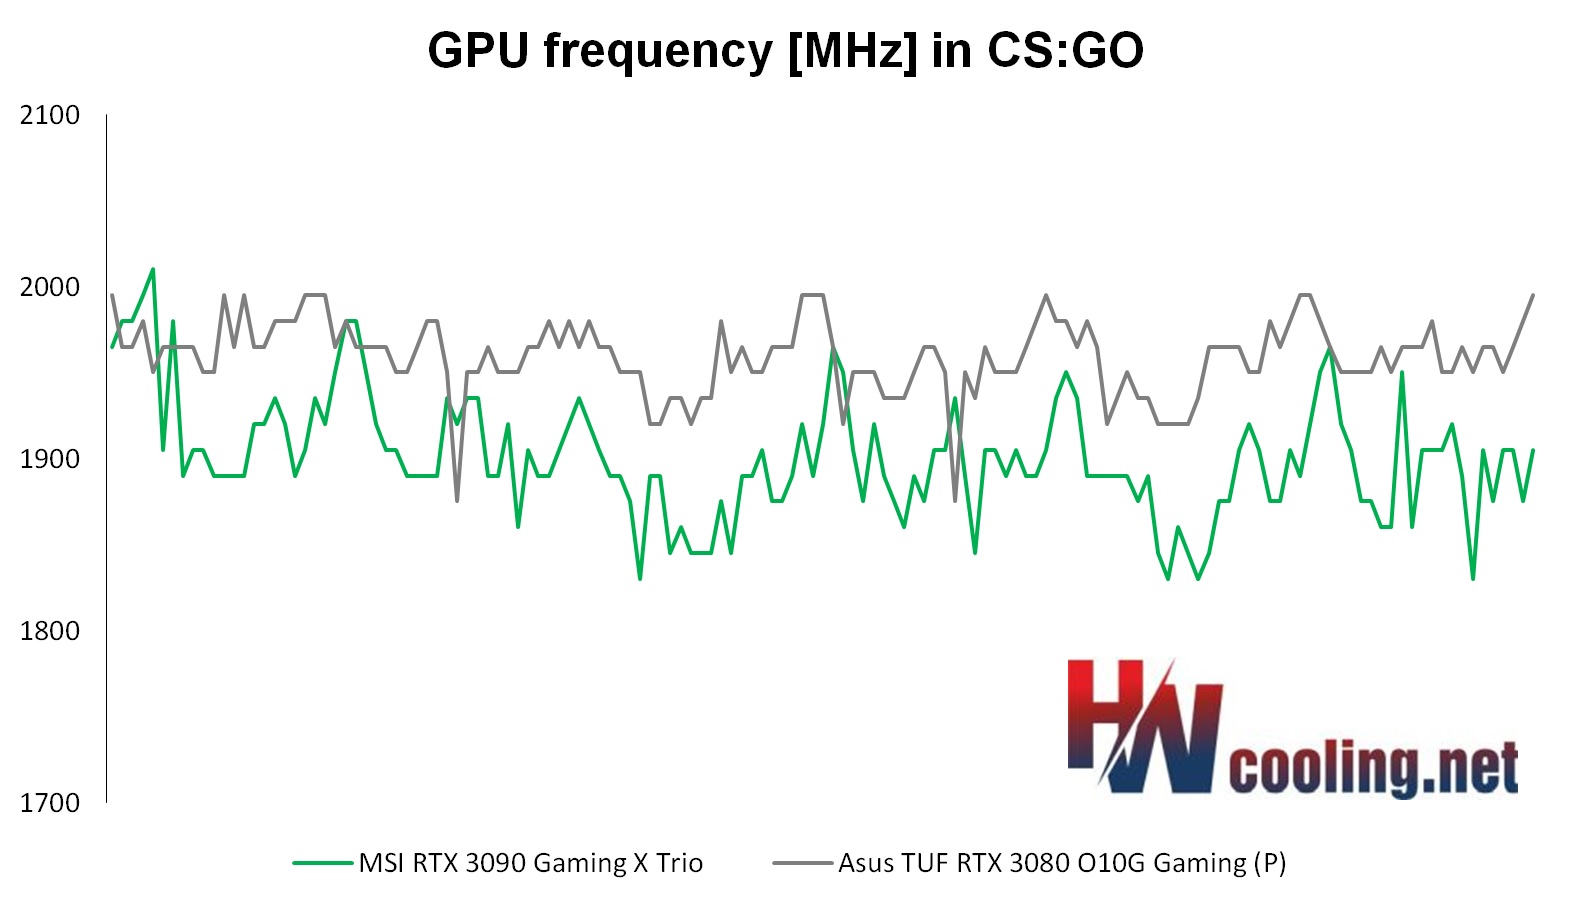
GPU clock speed

No compromises in performance! If this is your motto, then you cannot miss the test of the graphics card GeForce RTX 3090. It will also feed 4K resolution, has the fastest ray tracing and OptiX acceleration, huge video memory and, the review sample from MSI also has many more attractive features. The biggest drawback, as is usual with high-end hardware, is the price. It is really high.
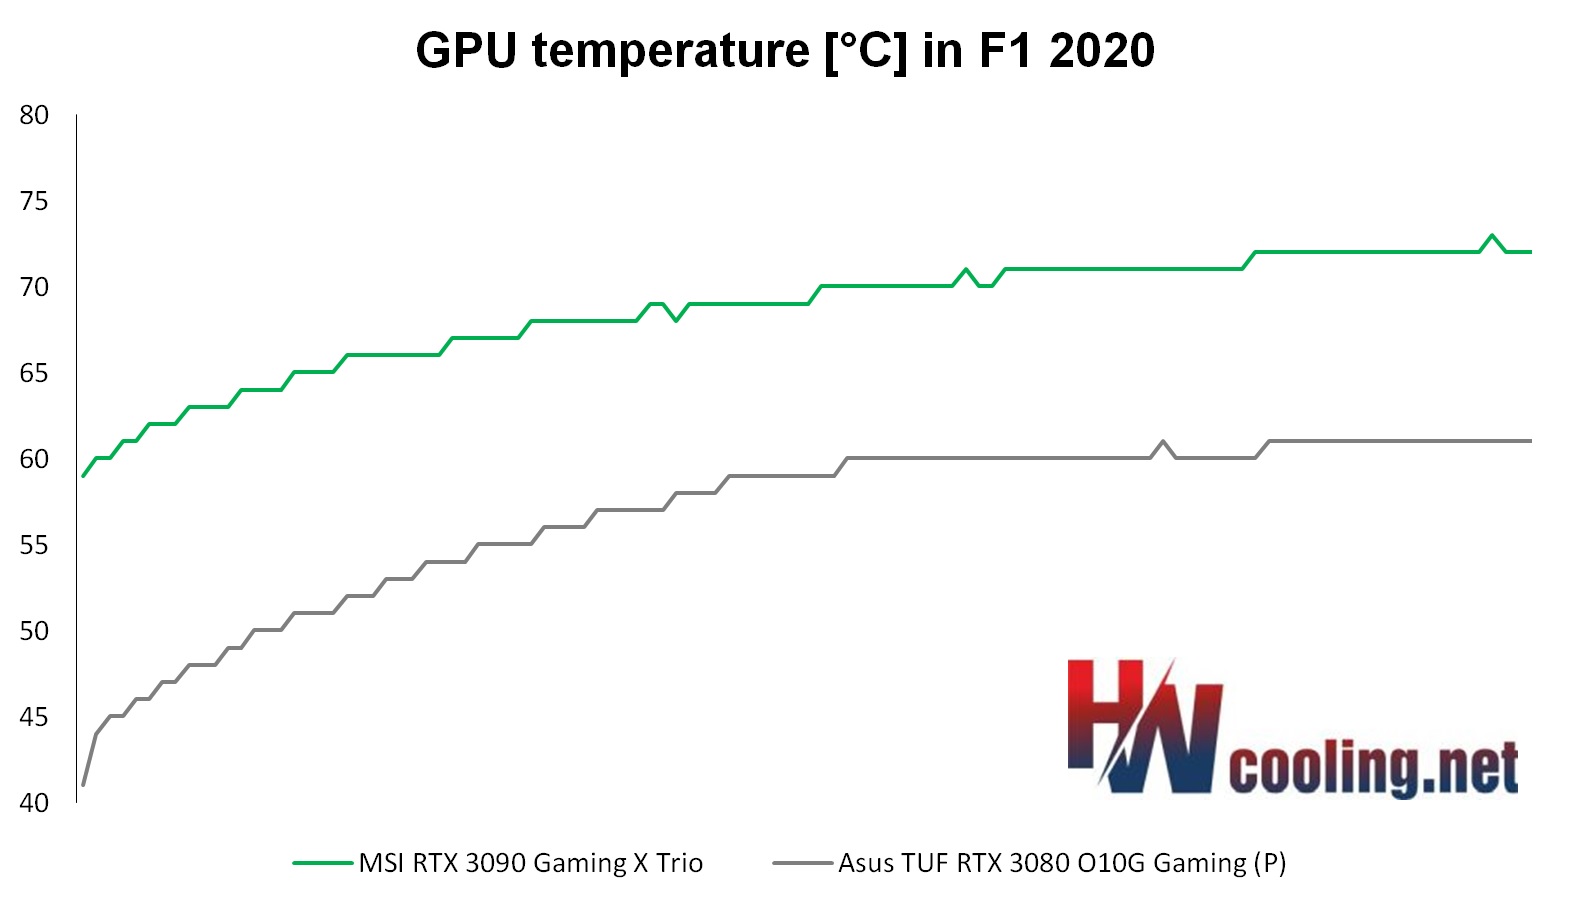
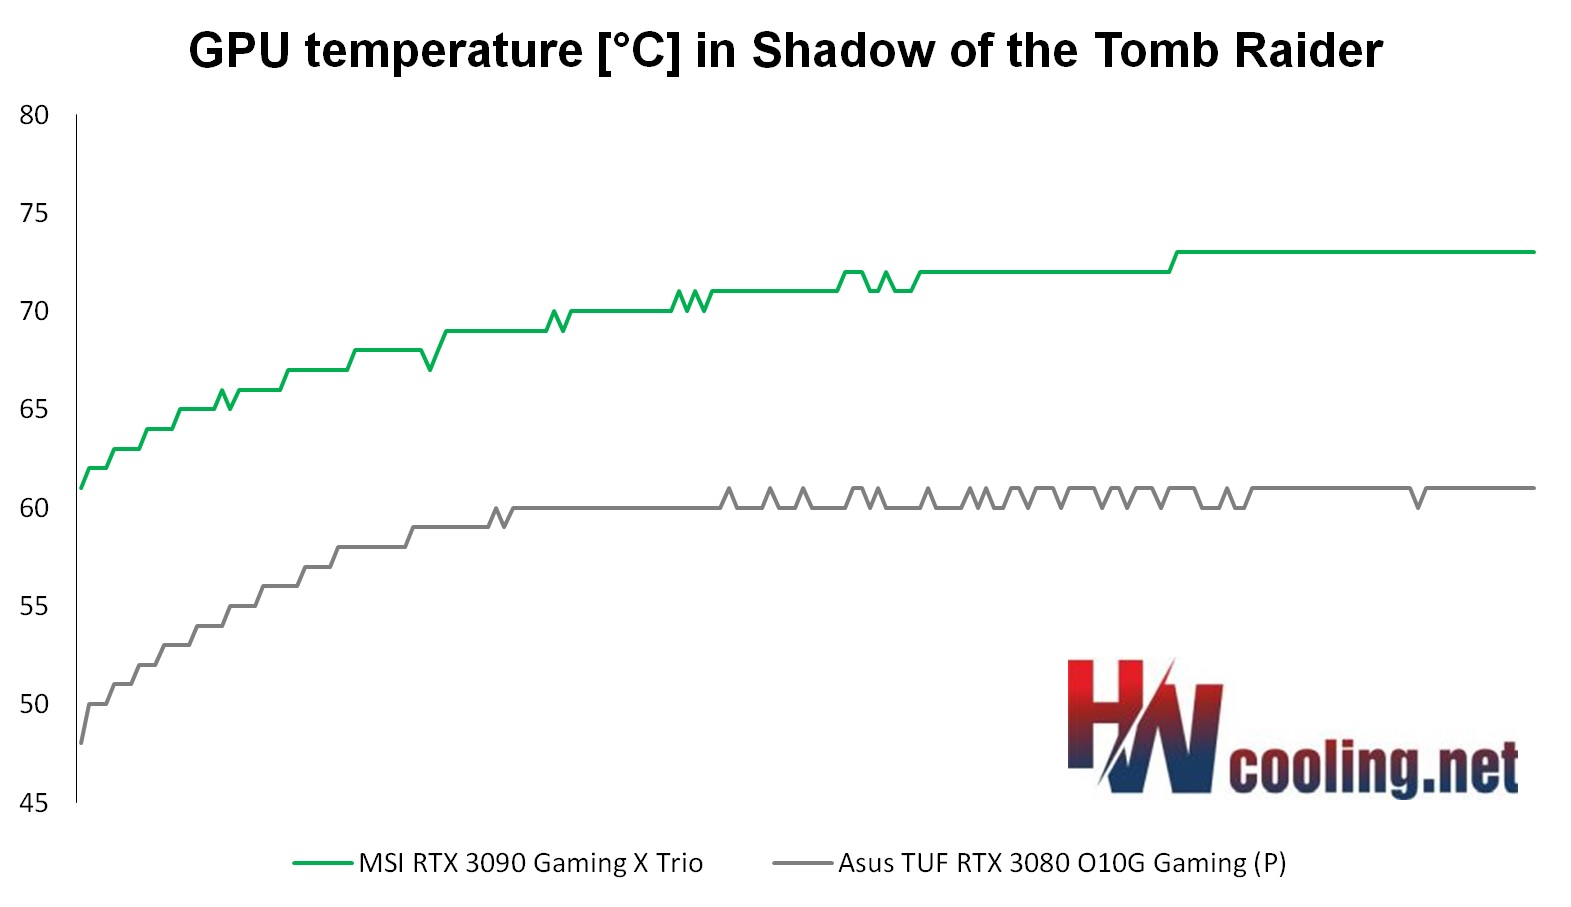
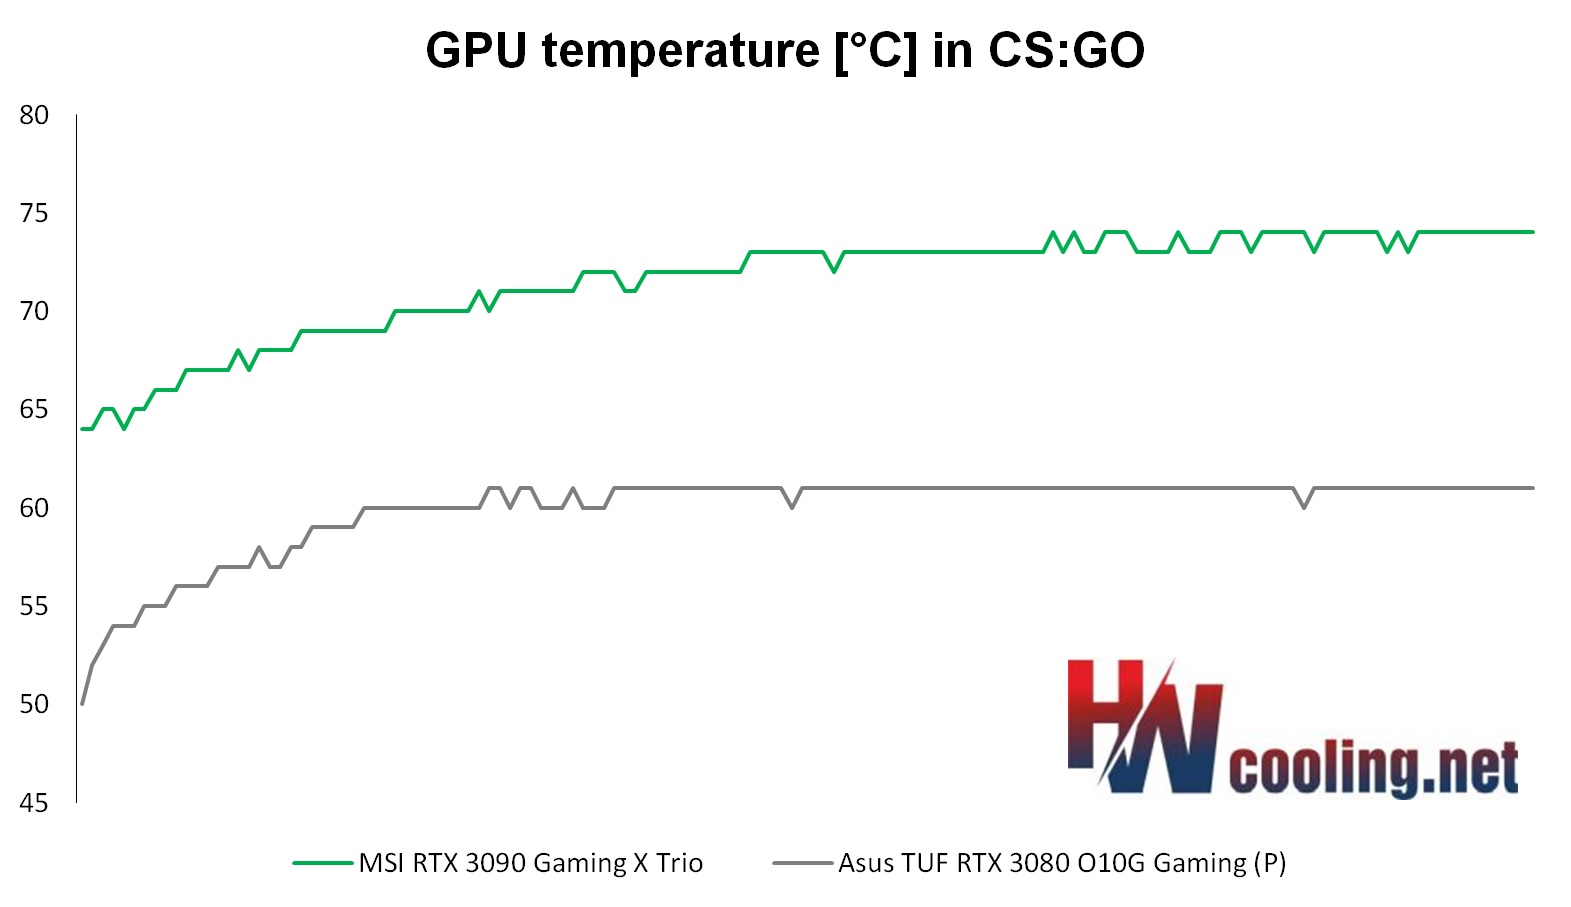
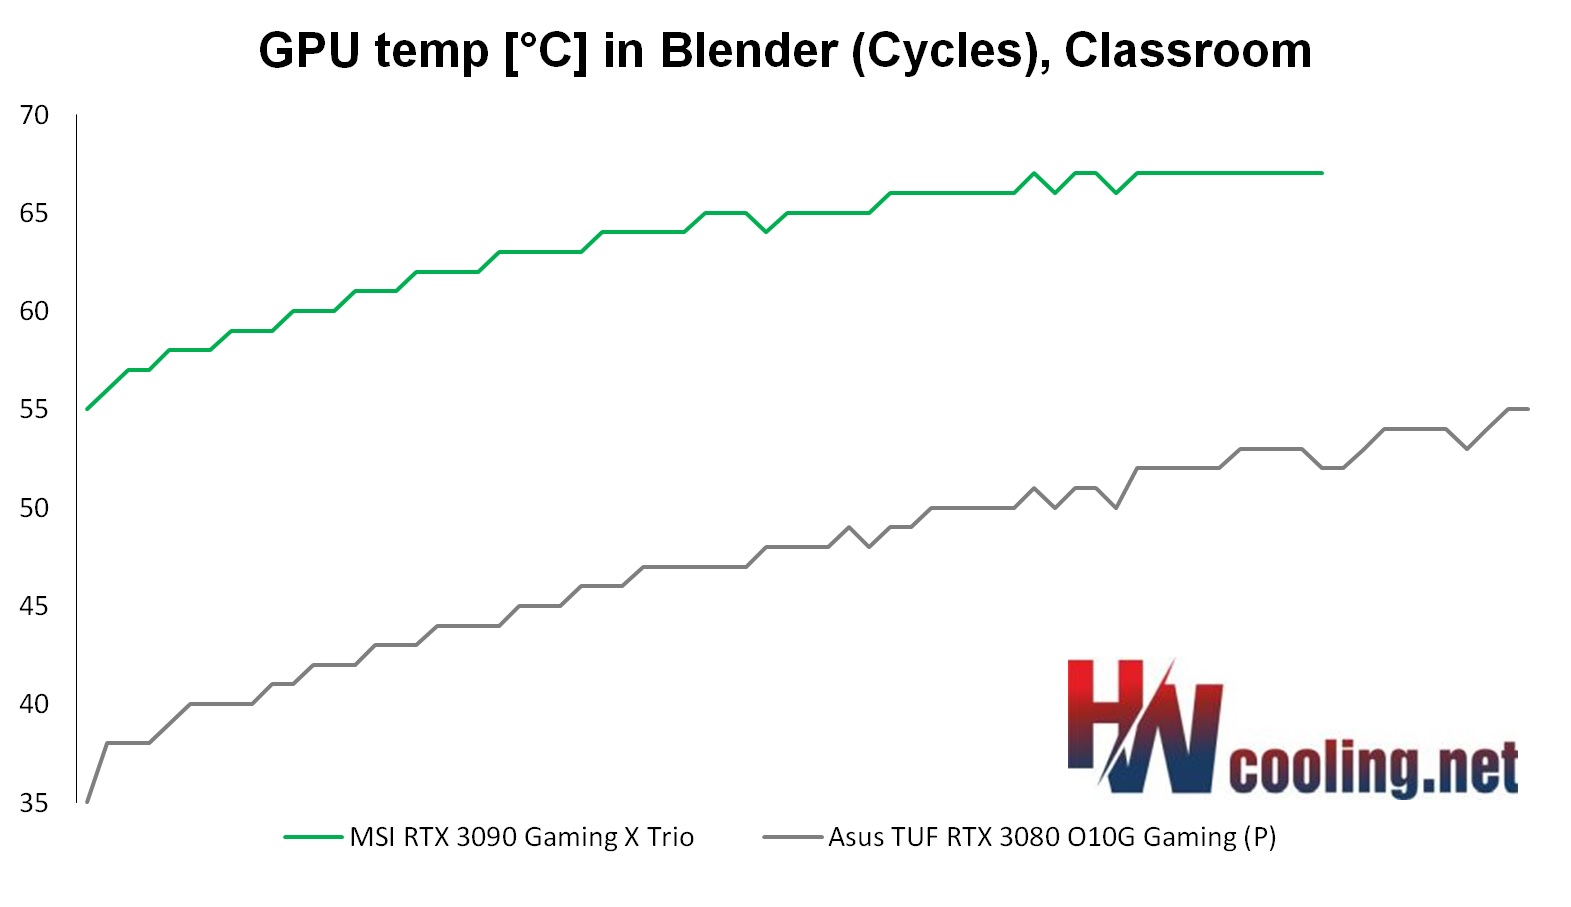
GPU temperature
VRAM temperature
No compromises in performance! If this is your motto, then you cannot miss the test of the graphics card GeForce RTX 3090. It will also feed 4K resolution, has the fastest ray tracing and OptiX acceleration, huge video memory and, the review sample from MSI also has many more attractive features. The biggest drawback, as is usual with high-end hardware, is the price. It is really high.
Net graphics power draw
Performance per watt
No compromises in performance! If this is your motto, then you cannot miss the test of the graphics card GeForce RTX 3090. It will also feed 4K resolution, has the fastest ray tracing and OptiX acceleration, huge video memory and, the review sample from MSI also has many more attractive features. The biggest drawback, as is usual with high-end hardware, is the price. It is really high.
Analysis of 12 V subcircuit power supply (higher load)


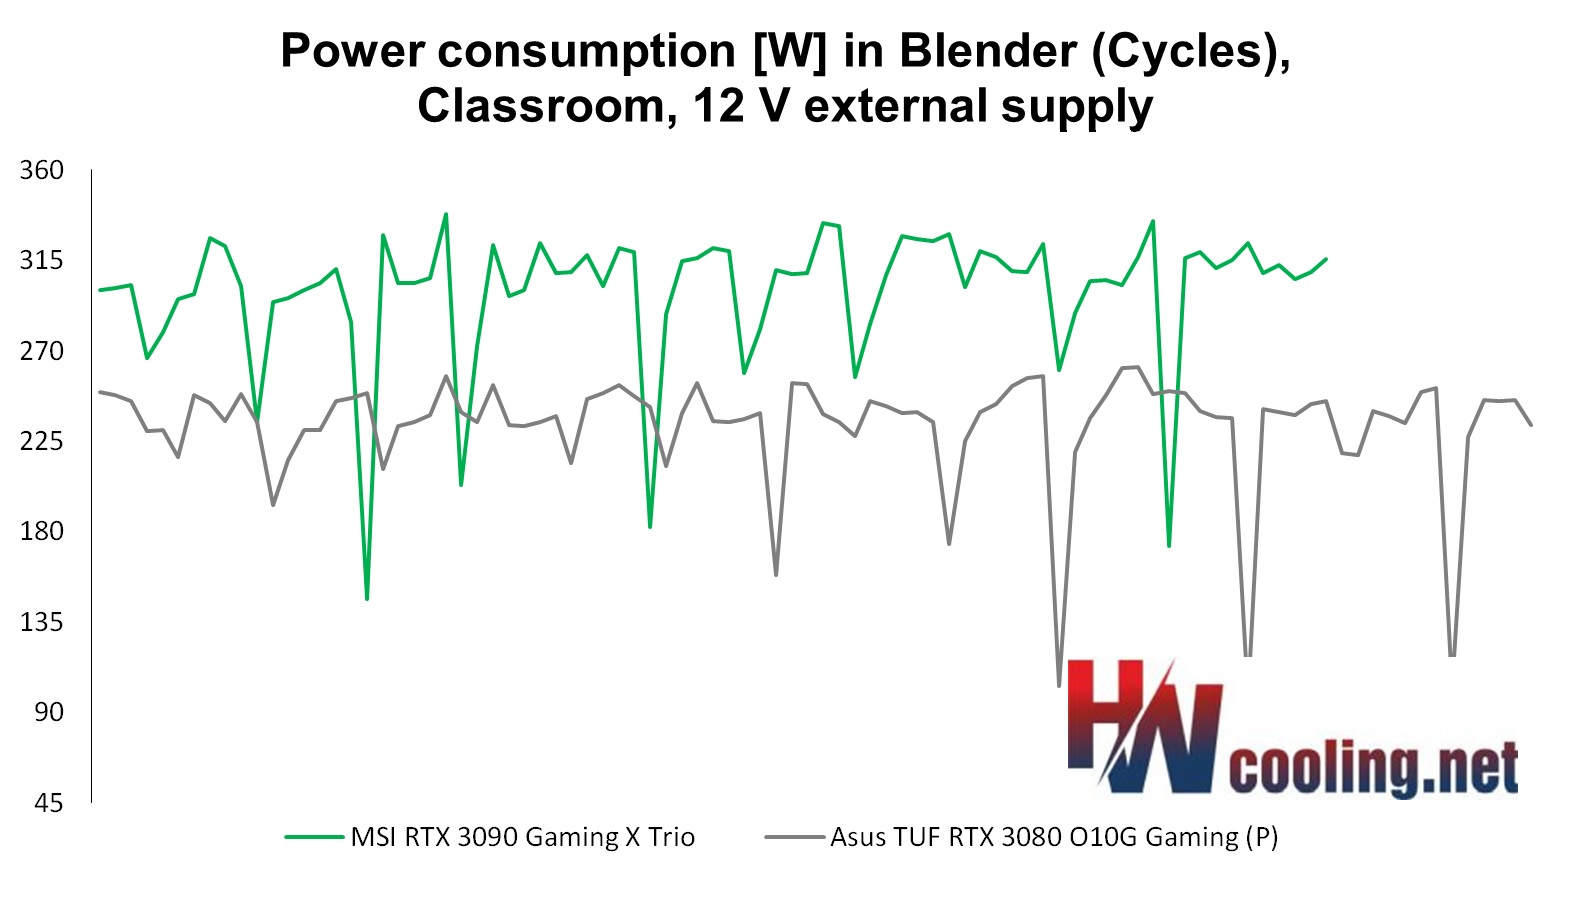
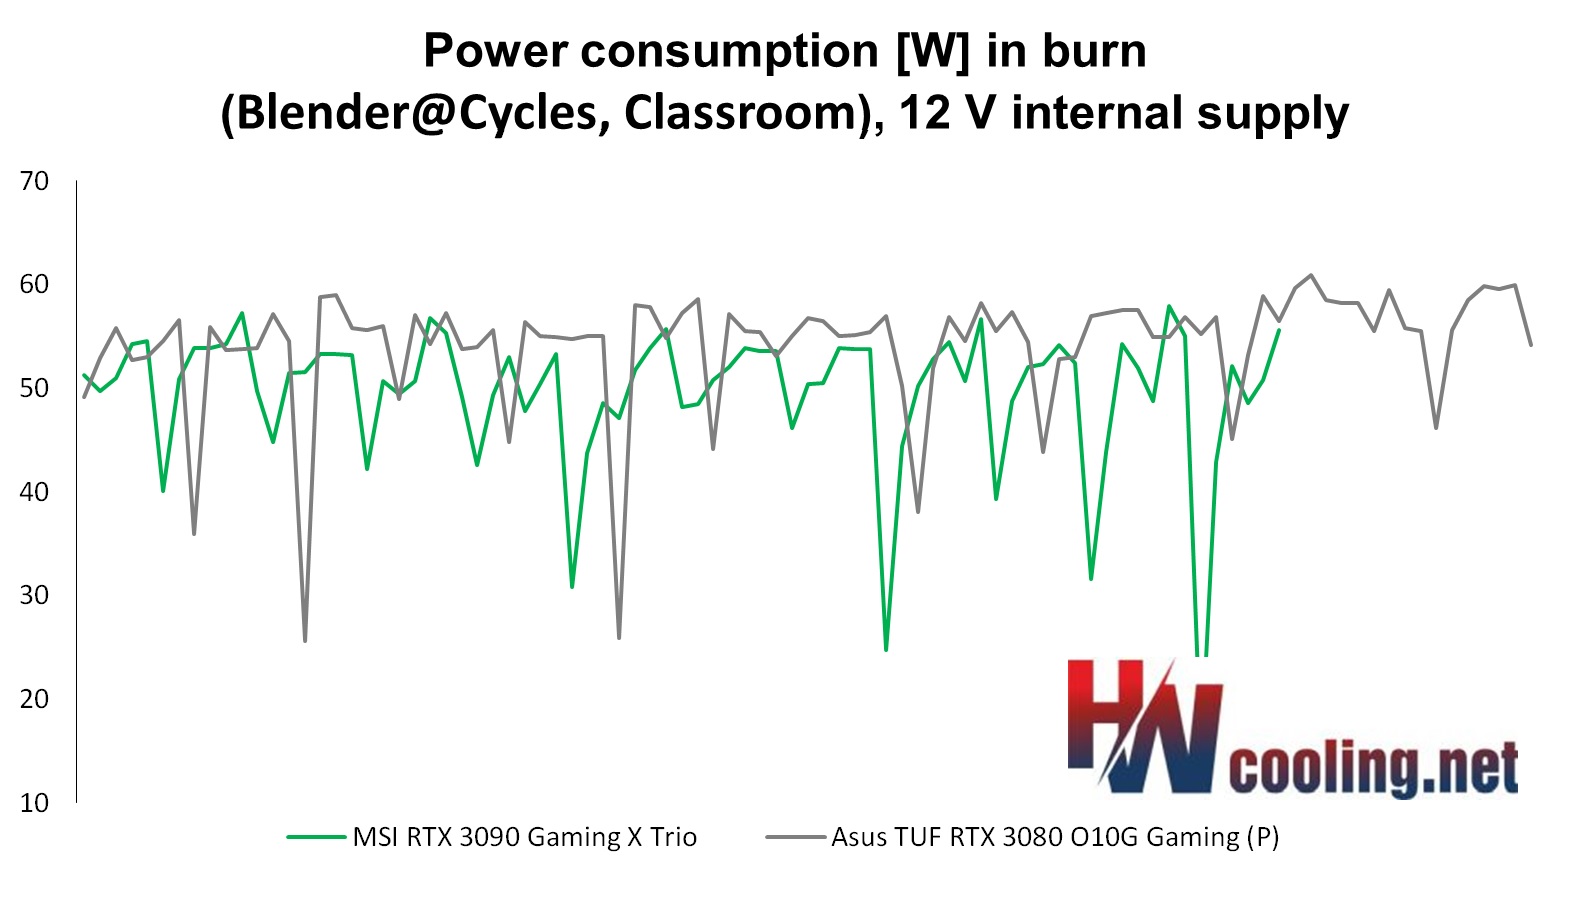
No compromises in performance! If this is your motto, then you cannot miss the test of the graphics card GeForce RTX 3090. It will also feed 4K resolution, has the fastest ray tracing and OptiX acceleration, huge video memory and, the review sample from MSI also has many more attractive features. The biggest drawback, as is usual with high-end hardware, is the price. It is really high.
Analysis of 12 V subcircuit power supply (lower load)
No compromises in performance! If this is your motto, then you cannot miss the test of the graphics card GeForce RTX 3090. It will also feed 4K resolution, has the fastest ray tracing and OptiX acceleration, huge video memory and, the review sample from MSI also has many more attractive features. The biggest drawback, as is usual with high-end hardware, is the price. It is really high.
Analysis of 3.3 V subcircuit power supply
No compromises in performance! If this is your motto, then you cannot miss the test of the graphics card GeForce RTX 3090. It will also feed 4K resolution, has the fastest ray tracing and OptiX acceleration, huge video memory and, the review sample from MSI also has many more attractive features. The biggest drawback, as is usual with high-end hardware, is the price. It is really high.
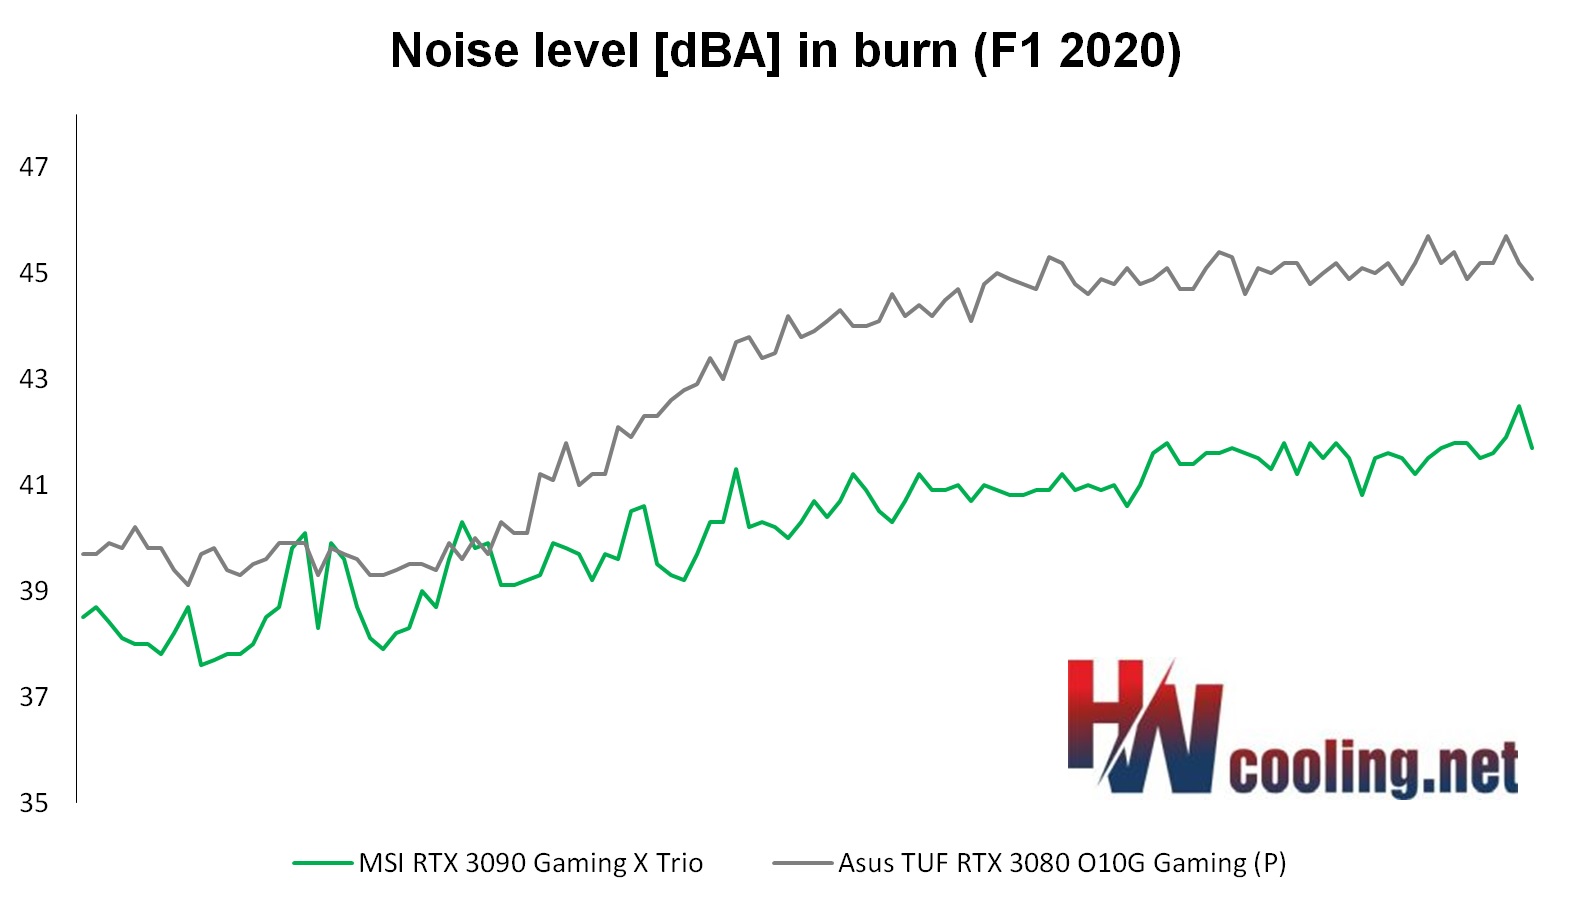
Noise level
No compromises in performance! If this is your motto, then you cannot miss the test of the graphics card GeForce RTX 3090. It will also feed 4K resolution, has the fastest ray tracing and OptiX acceleration, huge video memory and, the review sample from MSI also has many more attractive features. The biggest drawback, as is usual with high-end hardware, is the price. It is really high.
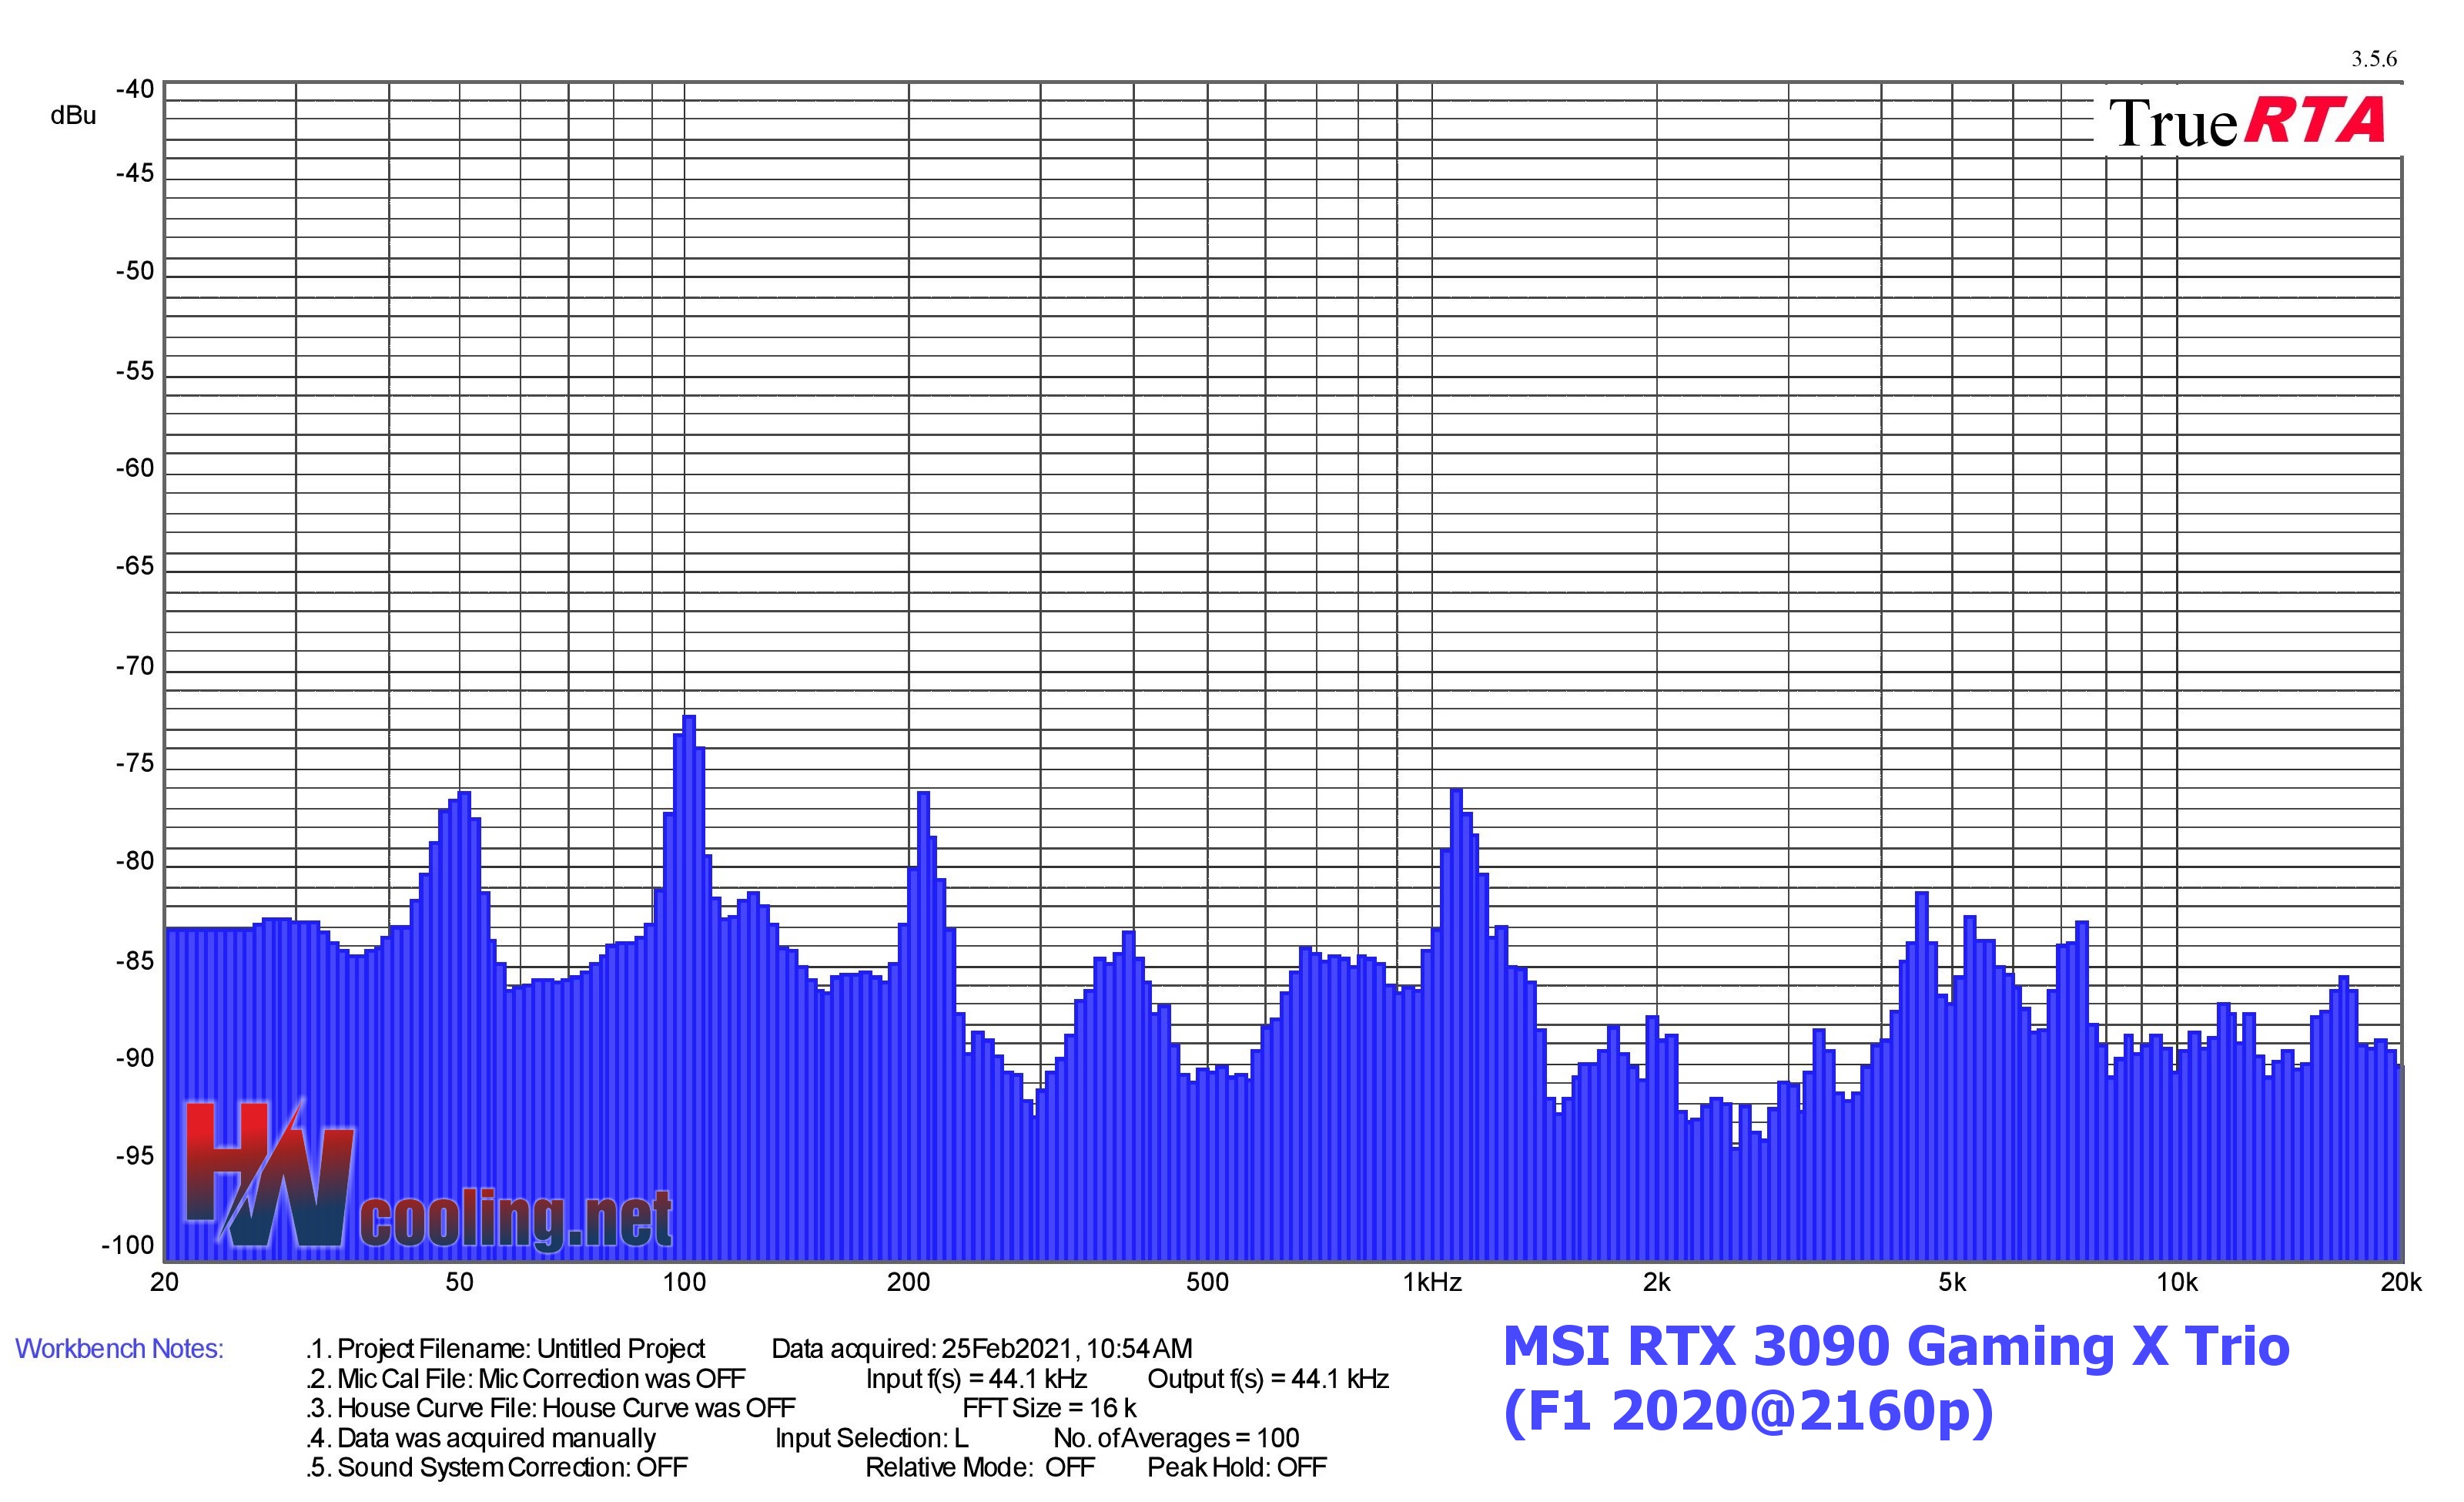
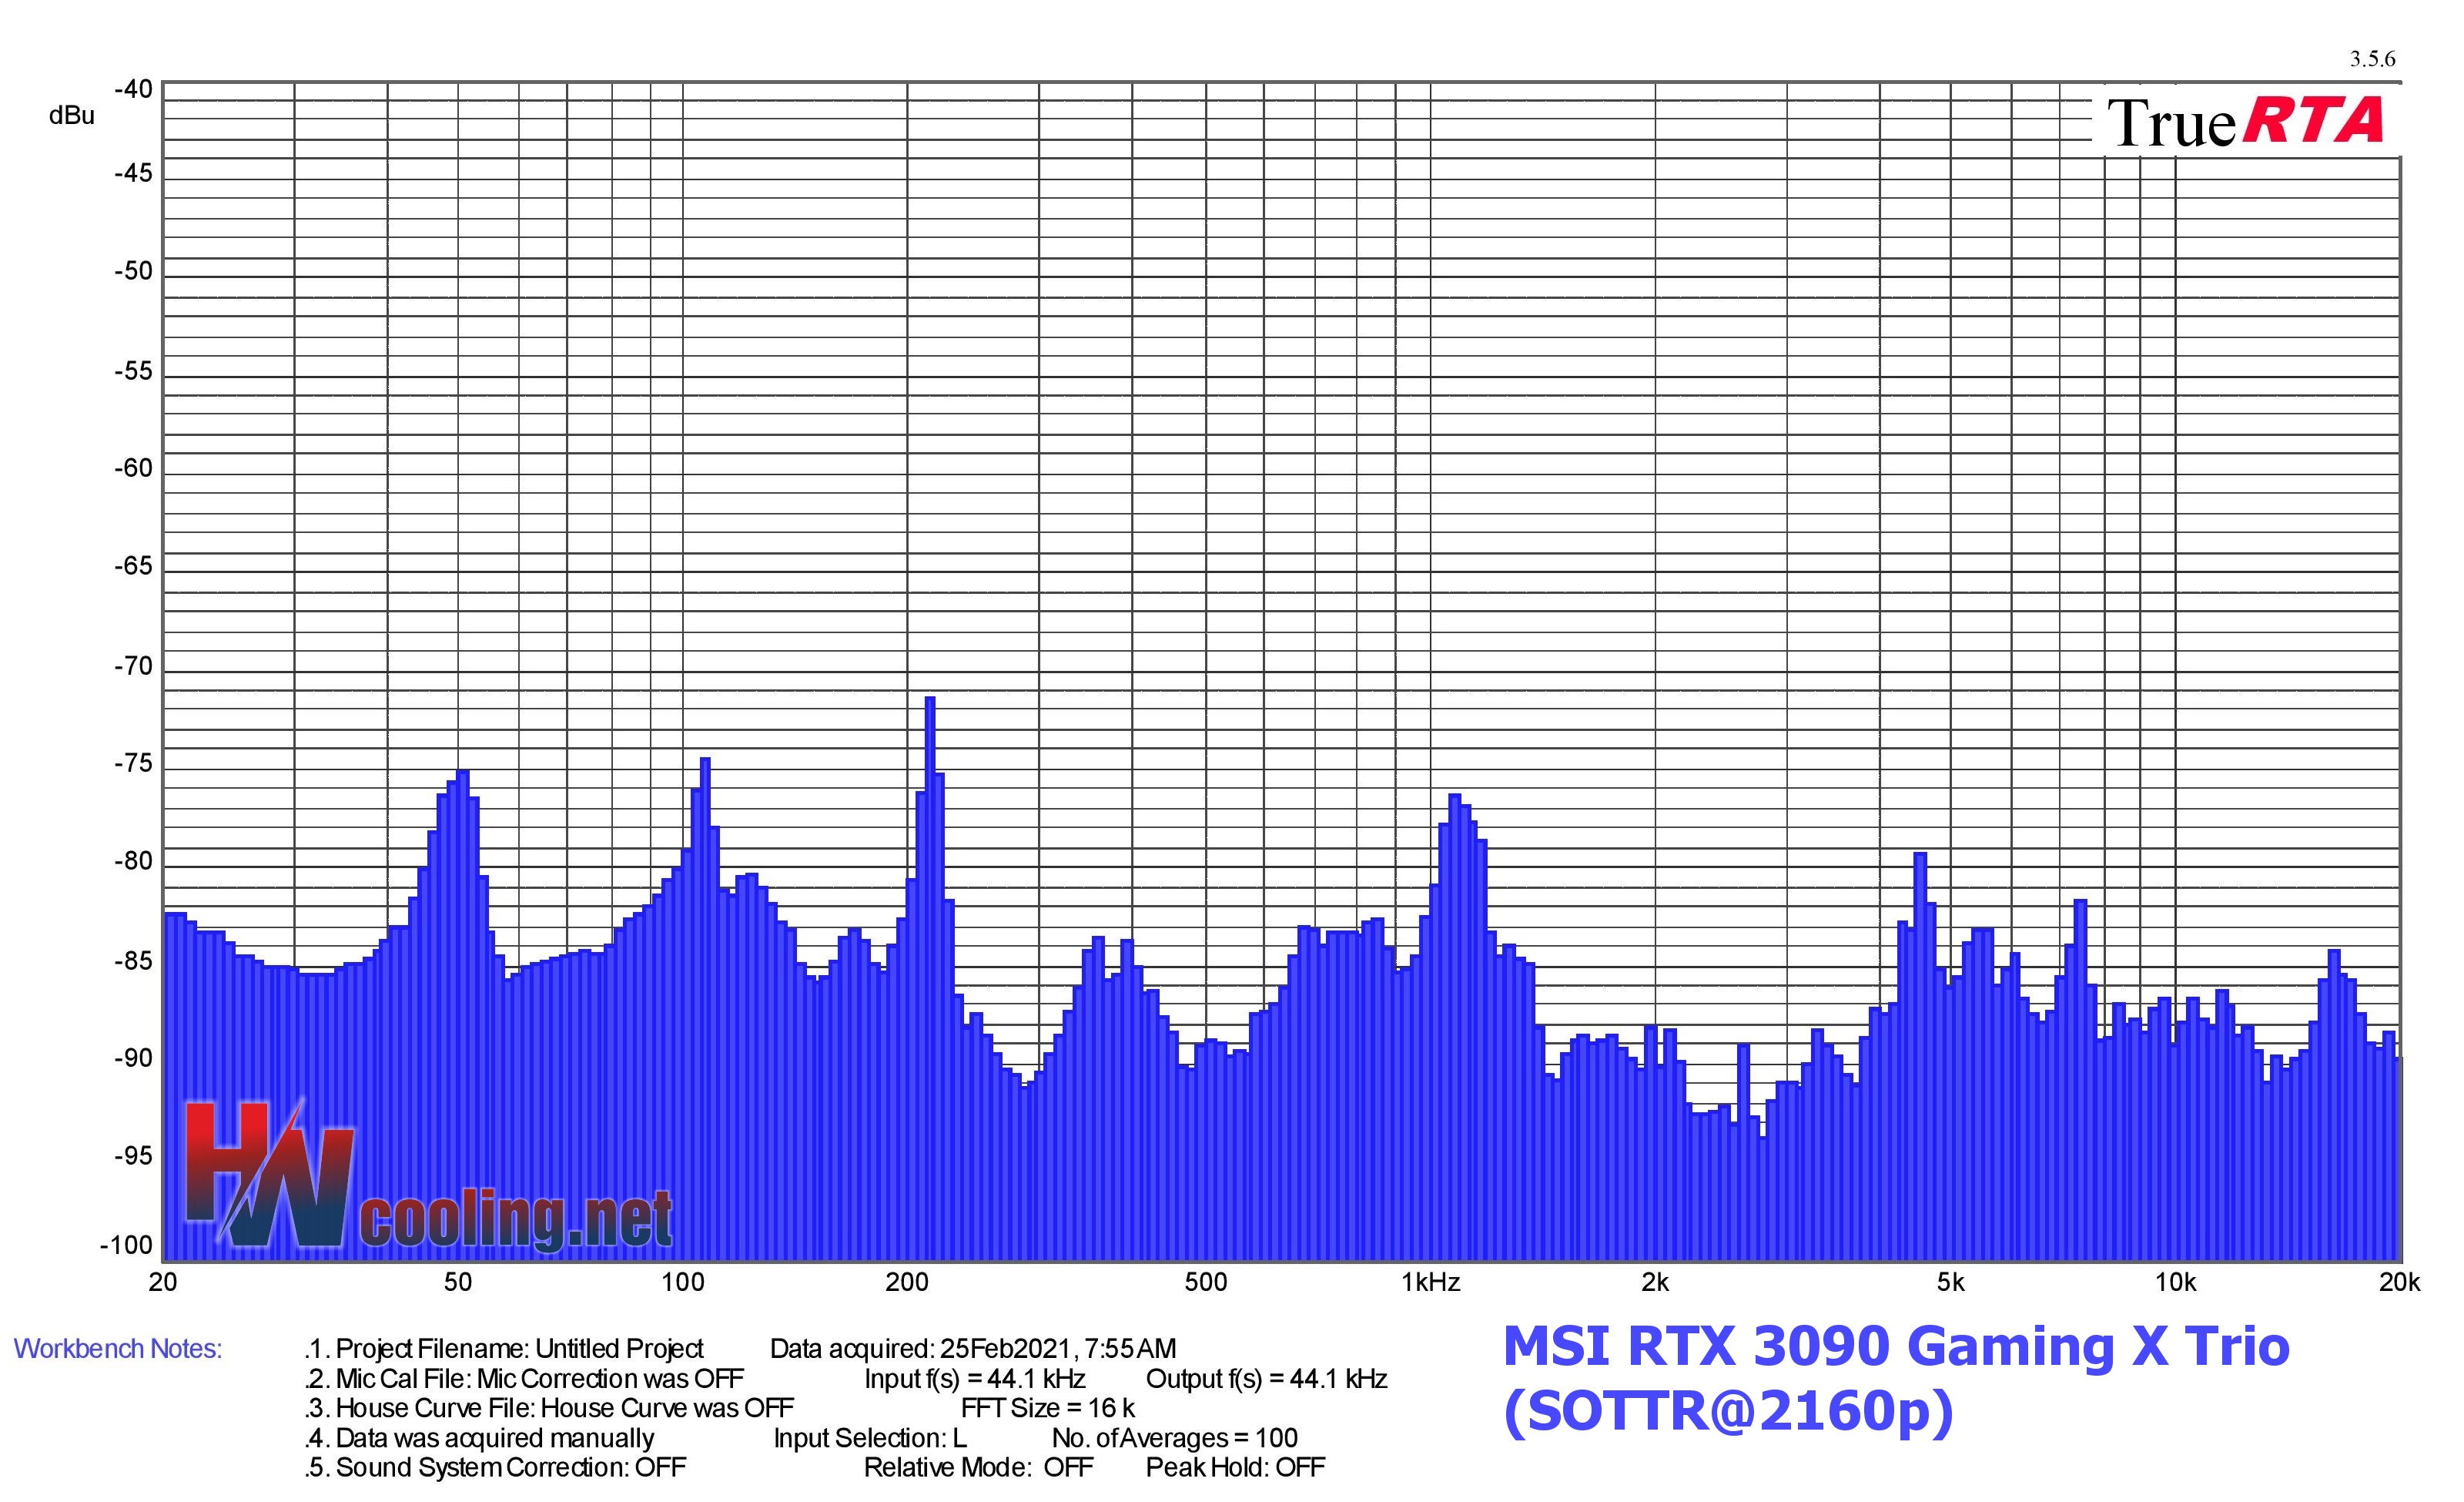
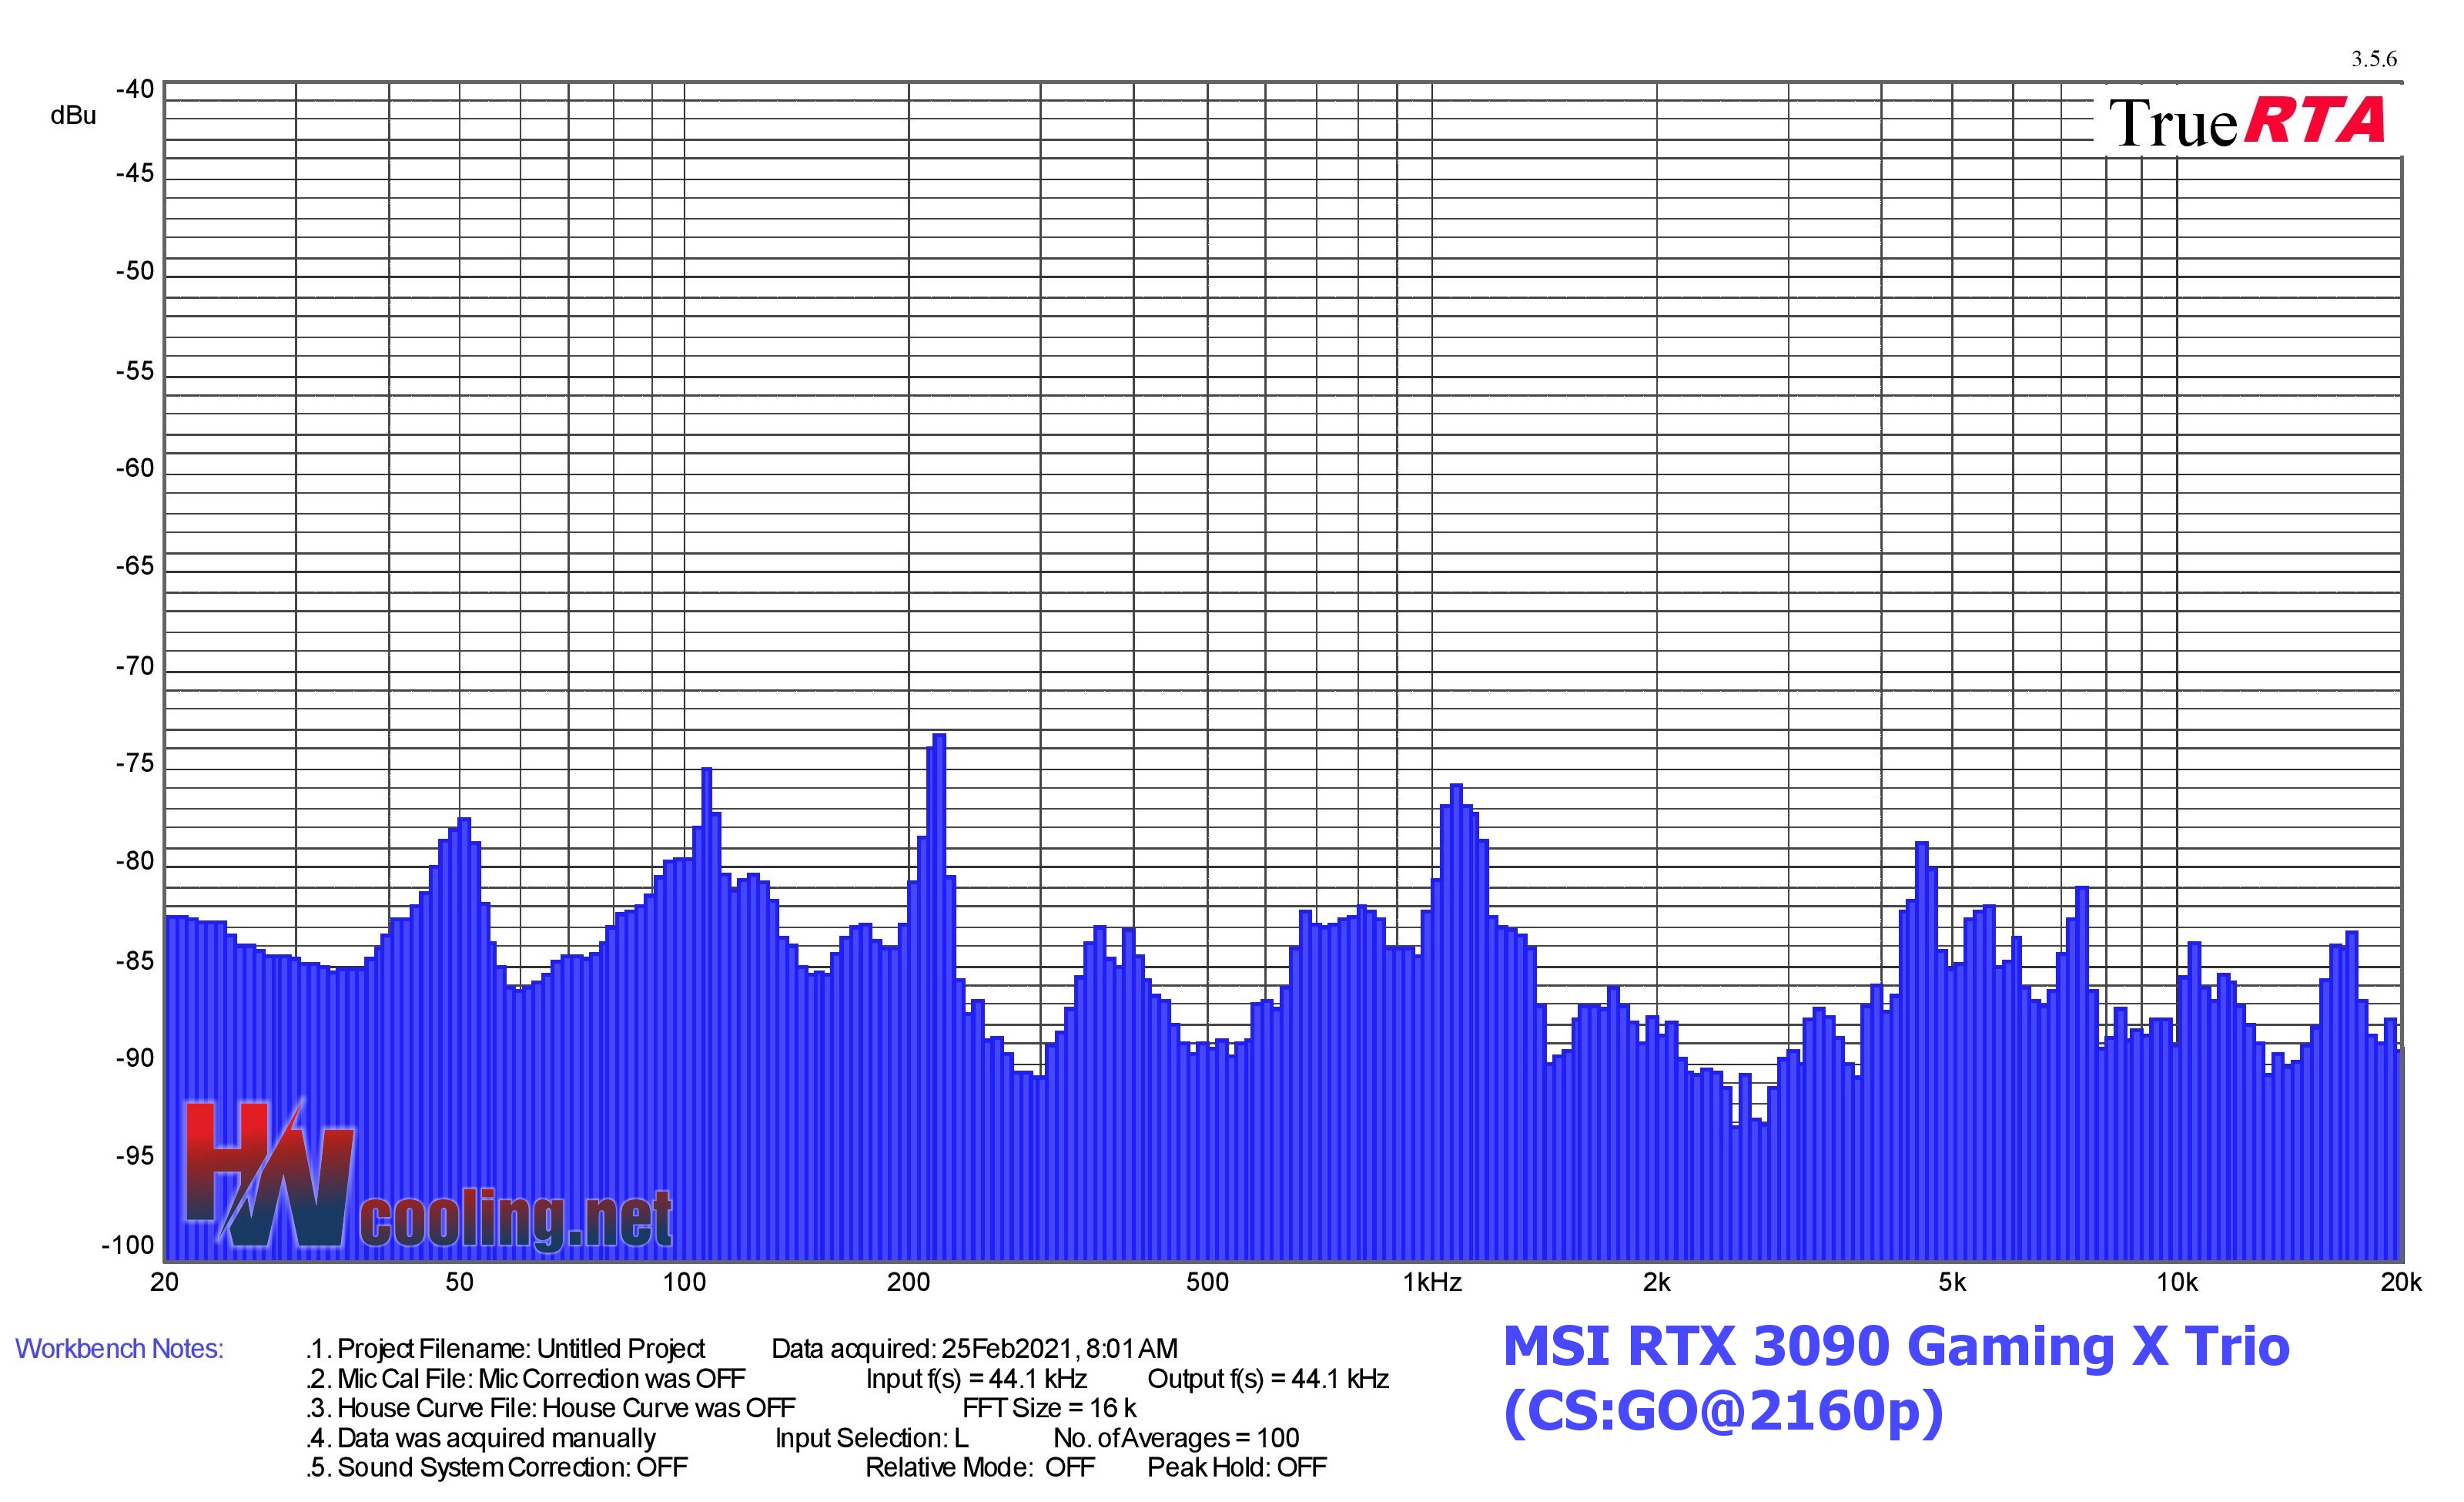
Frequency response of sound
Measurements are performed in the TrueRTA application, which records sound in a range of 240 frequencies in the recorded range of 20–20,000 Hz. For the possibility of comparison across articles, we export the dominant frequency from the low (20–200 Hz), medium (201–2,000 Hz) and high (2,001–20,000 Hz) range to standard bar graphs. However, for an even more detailed analysis of the sound expression, it is important to perceive the overall shape of the graph and the intensity of all frequencies/tones. If you don’t understand something in the graphs and tables below, you will find the answers to all the questions in this article. That explains how to read the measured data below correctly.
| Graphics card | Dominant sound freq. and noise level in F1 2020@2160p | NF-F12 PWM | NF-A15 PWM | ||||
| Low range | Mid range | High range | |||||
| Frequency [Hz] | Noise level [dBu] | Frequency [Hz] | Noise level [dBu] | Frequency [Hz] | Noise level [dBu] | ||
| MSI RTX 3090 Gaming X Trio | 100,794 | -72,330 | 1076,347 | -75,992 | 4561,401 | -81,229 | |
| MSI RTX 3070 Gaming X Trio | 100,794 | -73,926 | 1076,347 | -79,719 | 6267,154 | -85,076 | |
| AMD Radeon RX 6800 | 100,794 | -71,759 | 1107,887 | -67,416 | 2091,412 | -75,288 | |
| Asus TUF RTX 3080 O10G Gaming | 100,794 | -76,045 | 1107,887 | -77,850 | 7034,643 | -74,423 | |
| AMD Radeon RX 6800 XT | 100,794 | -72,991 | 1107,887 | -74,724 | 10848,902 | -76,519 |
| Graphics card | Dominant sound freq. and noise level in SOTTR@2160p | NF-F12 PWM | NF-A15 PWM | ||||
| Low range | Mid range | High range | |||||
| Frequency [Hz] | Noise level [dBu] | Frequency [Hz] | Noise level [dBu] | Frequency [Hz] | Noise level [dBu] | ||
| MSI RTX 3070 Gaming X Trio | 106,787 | -74,468 | 213,574 | -71,307 | 4561,401 | -79,260 | |
| MSI RTX 3070 Gaming X Trio | 100,794 | -72,952 | 213,574 | -72,275 | 6267,154 | -84,919 | |
| AMD Radeon RX 6800 | 100,794 | -71,603 | 1140,350 | -67,765 | 9665,273 | -80,642 | |
| Asus TUF RTX 3080 O10G Gaming | 100,794 | -75,410 | 1076,347 | -72,321 | 7240,773 | -74,199 | |
| AMD Radeon RX 6800 XT | 100,794 | -73,170 | 1107,887 | -75,262 | 10848,902 | -75,397 |
| Graphics card | Dominant sound freq. and noise level in CS:GO@2160p | NF-F12 PWM | NF-A15 PWM | ||||
| Low range | Mid range | High range | |||||
| Frequency [Hz] | Noise level [dBu] | Frequency [Hz] | Noise level [dBu] | Frequency [Hz] | Noise level [dBu] | ||
| MSI RTX 3090 Gaming X Trio | 106,787 | -75,721 | 213,574 | -73,423 | 4695,061 | -77,625 | |
| MSI RTX 3070 Gaming X Trio | 106,787 | -75,721 | 213,574 | -73,423 | 6267,154 | -82,711 | |
| AMD Radeon RX 6800 | 100,794 | -71,103 | 1076,347 | -77,328 | 9665,273 | -77,714 | |
| Asus TUF RTX 3080 O10G Gaming | 100,794 | -74,208 | 1076,347 | -70,919 | 7240,773 | -74,402 | |
| AMD Radeon RX 6800 XT | 100,794 | -72,346 | 1107,887 | -73,732 | 10848,902 | -72,534 |

| Graphics card | Dominant sound freq. and noise level in Blender (Cycles), Classroom | NF-F12 PWM | NF-A15 PWM | ||||
| Low range | Mid range | High range | |||||
| Frequency [Hz] | Noise level [dBu] | Frequency [Hz] | Noise level [dBu] | Frequency [Hz] | Noise level [dBu] | ||
| MSI RTX 3090 Gaming X Trio | 100,794 | -71,224 | 1076,347 | -85,314 | 5915,406 | -91,953 | |
| MSI RTX 3070 Gaming X Trio | 100,794 | -71,224 | 1076,347 | -85,314 | 18245,606 | -90,785 | |
| AMD Radeon RX 6800 | 100,794 | -71,136 | 987,015 | -89,041 | 7452,944 | -88,237 | |
| Asus TUF RTX 3080 O10G Gaming | 106,787 | -81,541 | 1659,995 | -80,568 | 6834,380 | -77,967 | |
| AMD Radeon RX 6800 XT | 100,794 | -72,980 | 1243,561 | -95,235 | 7671,332 | -84,980 |
| Graphics card | Dominant sound freq. and noise level in CS:GO@1080p (coils only) | NF-F12 PWM | NF-A15 PWM | ||||
| Low range | Mid range | High range | |||||
| Frequency [Hz] | Noise level [dBu] | Frequency [Hz] | Noise level [dBu] | Frequency [Hz] | Noise level [dBu] | ||
| MSI RTX 3090 Gaming X Trio | 50,397 | -76,126 | 987,015 | -84,836 | 5915,406 | -83,323 | |
| MSI RTX 3070 Gaming X Trio | 100,794 | -74,662 | 1317,507 | -81,448 | 6088,740 | -84,631 | |
| AMD Radeon RX 6800 | 100,794 | -72,013 | 1659,955 | -90,354 | 8863,094 | -84,530 | |
| Asus TUF RTX 3080 O10G Gaming | 100,794 | -75,576 | 1140,350 | -81,739 | 9948,487 | -78,734 | |
| AMD Radeon RX 6800 XT | 100,794 | -73,272 | 1659,955 | -83,327 | 7452,944 | -76,372 |
No compromises in performance! If this is your motto, then you cannot miss the test of the graphics card GeForce RTX 3090. It will also feed 4K resolution, has the fastest ray tracing and OptiX acceleration, huge video memory and, the review sample from MSI also has many more attractive features. The biggest drawback, as is usual with high-end hardware, is the price. It is really high.
Conclusion
The RTX 3090 Gaming X Trio already has enough performance for ray tracing even in Ultra HD. Of course, not true for Cyberpunk 2077, you’ll need to turn on DLSS. But with DLSS the gameplay feels smoother and is closer to 60 fps than e.g. the TUF RTX 3080 Gaming.
In Metro Exodus in UHD with DXR, the RTX 3090 Gaming X wins by 14%, that you will feel with otherwise low fps (35 vs 40). Even in games like Battlefield V (DXR Ultra@UHD) or Shadow of the Tomb Raider (DXR Ultra@UHD), where the smoothness is better and the RTX 3090 Gaming X climbs over the 60 fps border, while the RTX 3080 stays below it. But we are still talking about the fact that you have the highest demands on graphic details, which is natural for a GPU priced at over two thousand euros. With lower demands, the differences already begin to shrink. With DLSS on, the difference in performance compared to the RTX 3080 is roughly “only” 10 percent, and most importantly, you can achieve 60+ fps even with a significantly cheaper graphics card than the RTX 3090.
Without ray-tracing settings, the RTX 3090 Gaming X Trio has up to 7% higher preformance on average compared to the TUF RTX 3080 Gaming in performance mode, which is starting to be really pointless in gaming.
Another thing is if the card is supposed to serve for computing tasks, where it is able to profit, for example, with its huge VRAM. The RTX 3090 is conceptually derived from the Titan series and in 3D rendering we’ve spotted sometimes even 26% higher performance and especially, the RTX 3090 will make sense for VRAM addressing that is beyond the capabilities of the RTX 3080. Also noteworthy are the three times faster times for resizing large photos in Photoshop or the relatively small decrease in game fps during screen recording via Nvenc. And the RTX 3090 can also defend its high price with the unrivaled performance of decrypting SHA, SHA2-512, but also other hash functions.
In addition, the Gaming X Trio excels with its excellent cooler. Even with a power draw of 373 W (in F1 2020), it is relatively quiet and you will most probably not complain about its noise. E.g. the reference Radeon 6800 is approximately 4.5 dBA louder, and that is a graphics card with almost half the power draw. GPU and VRAM temperatures are normal though and neither the GPU clock speed suffers from the lower noise (1826–1901 MHz), which is significantly above the specified boost value. But even though the price/performance ratio is quite unfavorable, but Nvidia is to blame here.
MSI did its job with the card and even that efficiency (performance per watt) is not so much worse than on the TUF RTX 3080 Gaming. We will therefore keep the most amazing editorial award “Top-notch” in the reserve for now (perhaps for the higher series Suprim X), we’ll stay with ”Approved” for now. And hopefully you’ll soon see the Sapphire RX 6900 XT Toxic reach the podium. 🙂
| MSI RTX 3090 Gaming X Trio |
| + Excellent performance (appropriate for 2160p/4K RT on gaming) |
| + Very nice RT performance (the biggest difference compared to the RTX 3080) |
| + Up to 24 GB VRAM |
| + Solid effectiveness (performance per watt) |
| + Efficient cooler Tri Frozr 2 |
| + Quiet operation (low fan and coil noise) |
| + Exclusive DLSS (2.0), CUDA and OptiX support |
| + Significant performance increase (25–50%) in certain computational tasks compared to the RTX 3080 |
| + PCI Express holder/support included in the package |
| + Appealing RGB LED lighting and we’ve checked it’s also very power-efficient |
| - Lower effectiveness (performance per watt) than with Radeon RX 6000 |
| - Weak price/performance ratio (especially with RT off) |
| - Greater card depth with possible collision in smaller PC cases |
| - Unavailability |


Thank you to Spacebar for providing us with games for our tests
- Contents
- MSI RTX 3090 Gaming X Trio – details
- Specs table
- Methodology: performance tests
- Methodology: how we measure power draw
- Methodology: noise and sound measurement
- Methodology: temperature tests
- Test rig
- 3DMark
- Age of Empires II: DE
- Assassin’s Creed: Valhalla
- Battlefield V
- Battlefield V with DXR
- Borderlands 3
- Control
- Control with DXR and DLSS
- Counter-Strike: GO
- Cyberpunk 2077
- Cyberpunk 2077 with DLSS and FidelityFX CAS
- Cyberpunk 2077 with DXR, DLSS and FidelityFX CAS
- DOOM Eternal
- F1 2020
- FIFA 21
- Forza Horizon 4
- Mafia: DE
- Metro Exodus
- Metro Exodus with DXR and DLSS
- Microsoft Flight Simulator
- Red Dead Redemption 2 (Vulkan)
- Red Dead Redemption 2 (Dx12)
- Shadow of the Tomb Raider
- Shadow of the Tomb Raider with DXR
- Total War Saga: Troy
- Wasteland 3
- Overall game performance and performance per euro
- CompuBench (OpenCL)
- CompuBench (CUDA)
- SPECviewperf 2020 and SPECworkstation 3
- FLOPS, IOPS and memory speed tests
- 3D rendering 1/2 (LuxMark and Blender@Cycles)
- 3D rendering 2/2 (Blender@Radeon ProRender and Eevee)
- Photo editing (Adobe Photoshop, Lightroom and Affinity Photo)
- Broadcasting (OBS and Xsplit)
- Password cracking
- GPU clock speed
- GPU and VRAM temperatures
- Net graphics power draw and performance per watt
- Analysis of 12 V subcircuit power supply (higher load)
- Analysis of 12 V subcircuit power supply (lower load)
- Analysis of 3.3 V subcircuit power supply
- Noise level
- Frequency response of sound
- Conclusion