


Biostar B660GTA in detail
Most motherboards from the same classes look pretty much the same. While they differ in color scheme and heatsink shape, the layout, features, and overall operation (including power management) are like a carbon copy. The Biostar B660GTA goes upstream in many ways and presents an attractive option for those users who always find something lacking on boards in this price range.
Biostar is behind the top three (Asus, Gigabyte, MSI) and ASRock is the fifth largest motherboard manufacturer. For the past years, the company’s offerings were characterized by a more modest selection of models, but this has grown and with the Intel B660 chipset alone, Biostar has as many as nine motherboards – from the very low-end to more robust options that can withstand the high power draw of even the most powerful Alder Lake processors in boost. For this test, we’ll take an in-depth look at the Biostar B660GTA with the most feature-rich options.
| Parameters | Biostar B660GTA | |
| MSI MAG Z690 Tomahawk DDR4 | ||
| Socket | Intel LGA 1700 | |
| Chipset | Intel B660 | |
| Format | ATX (305 × 244 mm) | |
| CPU power delivery | 17-phase | |
| Supported memory (and max. frequency) | DDR4 (5000 MHz) | |
| Slots PCIe ×16 (+ PCIe ×1) | 2× (+ 2×) | |
| Centre of socket to first PCIe ×16 slot | 101 mm | |
| Centre of socket to first DIMM slot | 56 mm | |
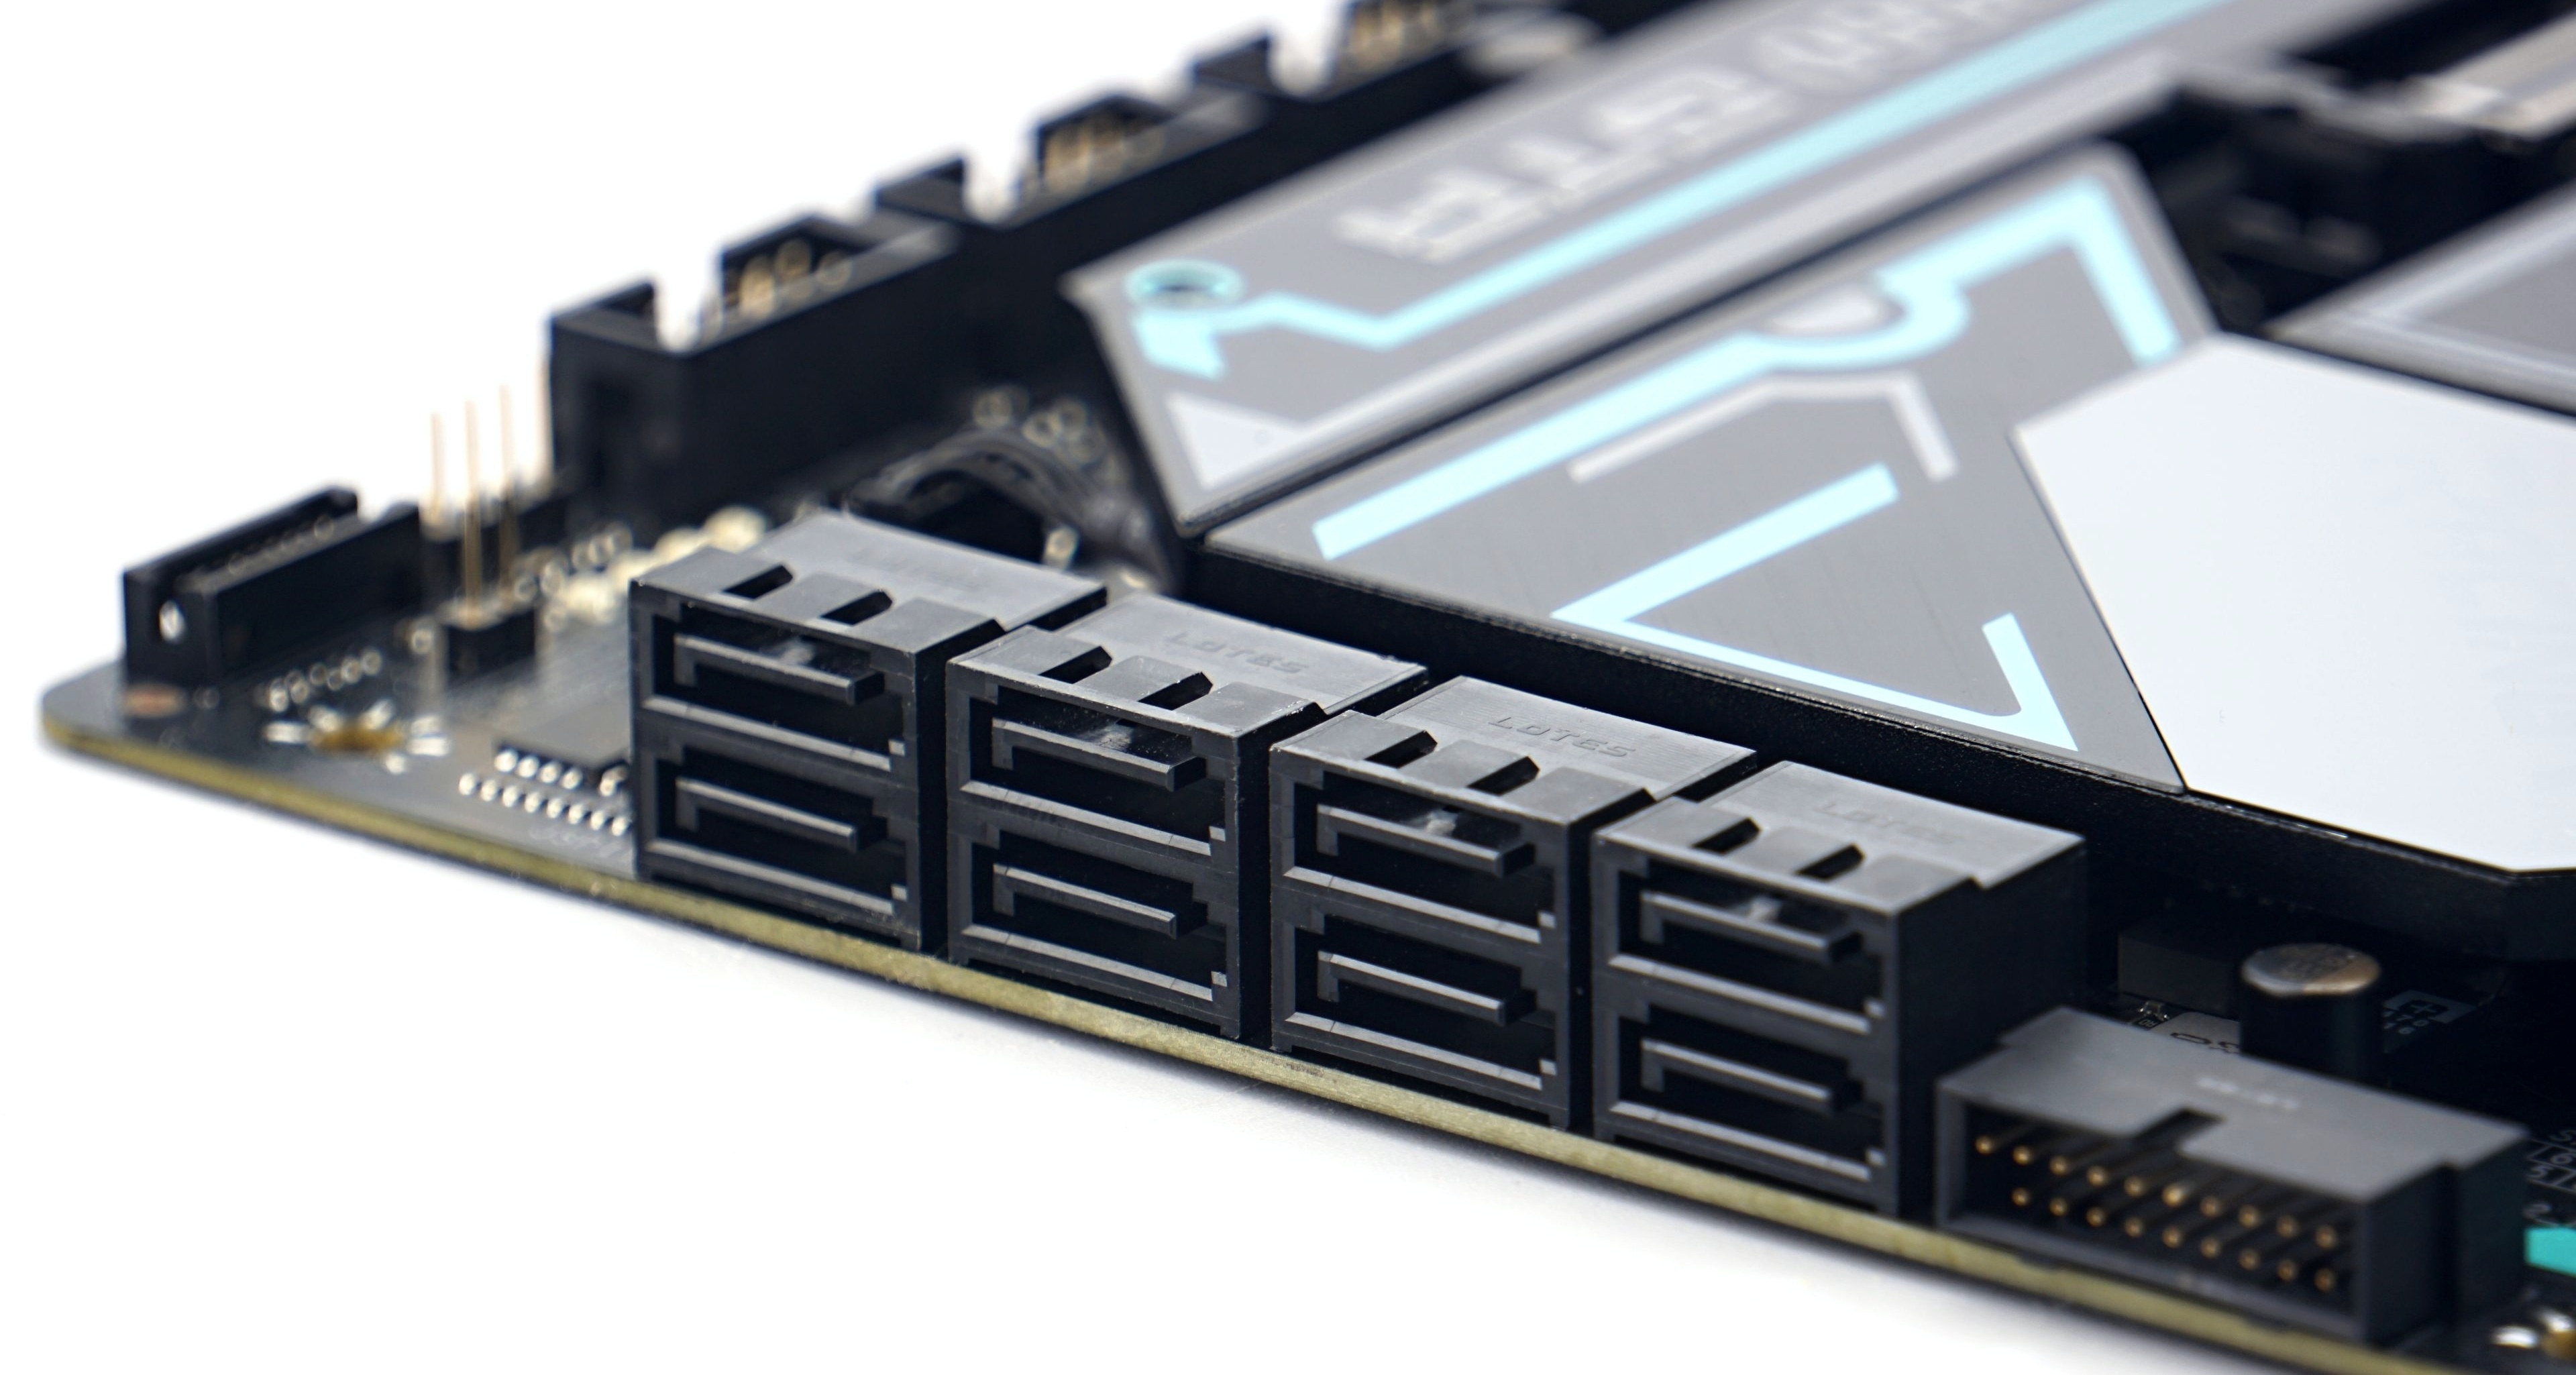
| Storage connectors | 8× SATA III, 3× M.2: 2× PCIe 4.0 ×4 (42–80 mm) + 1× PCIe 3.0 ×4 (42–110 mm) | |
| PWM connectors for fans or AIO pump | 5× | |
| Internal USB ports | 1× 3.2 gen. 2 type C, 2× 3.2 gen. 1 type A, 4× 2.0 type A | |
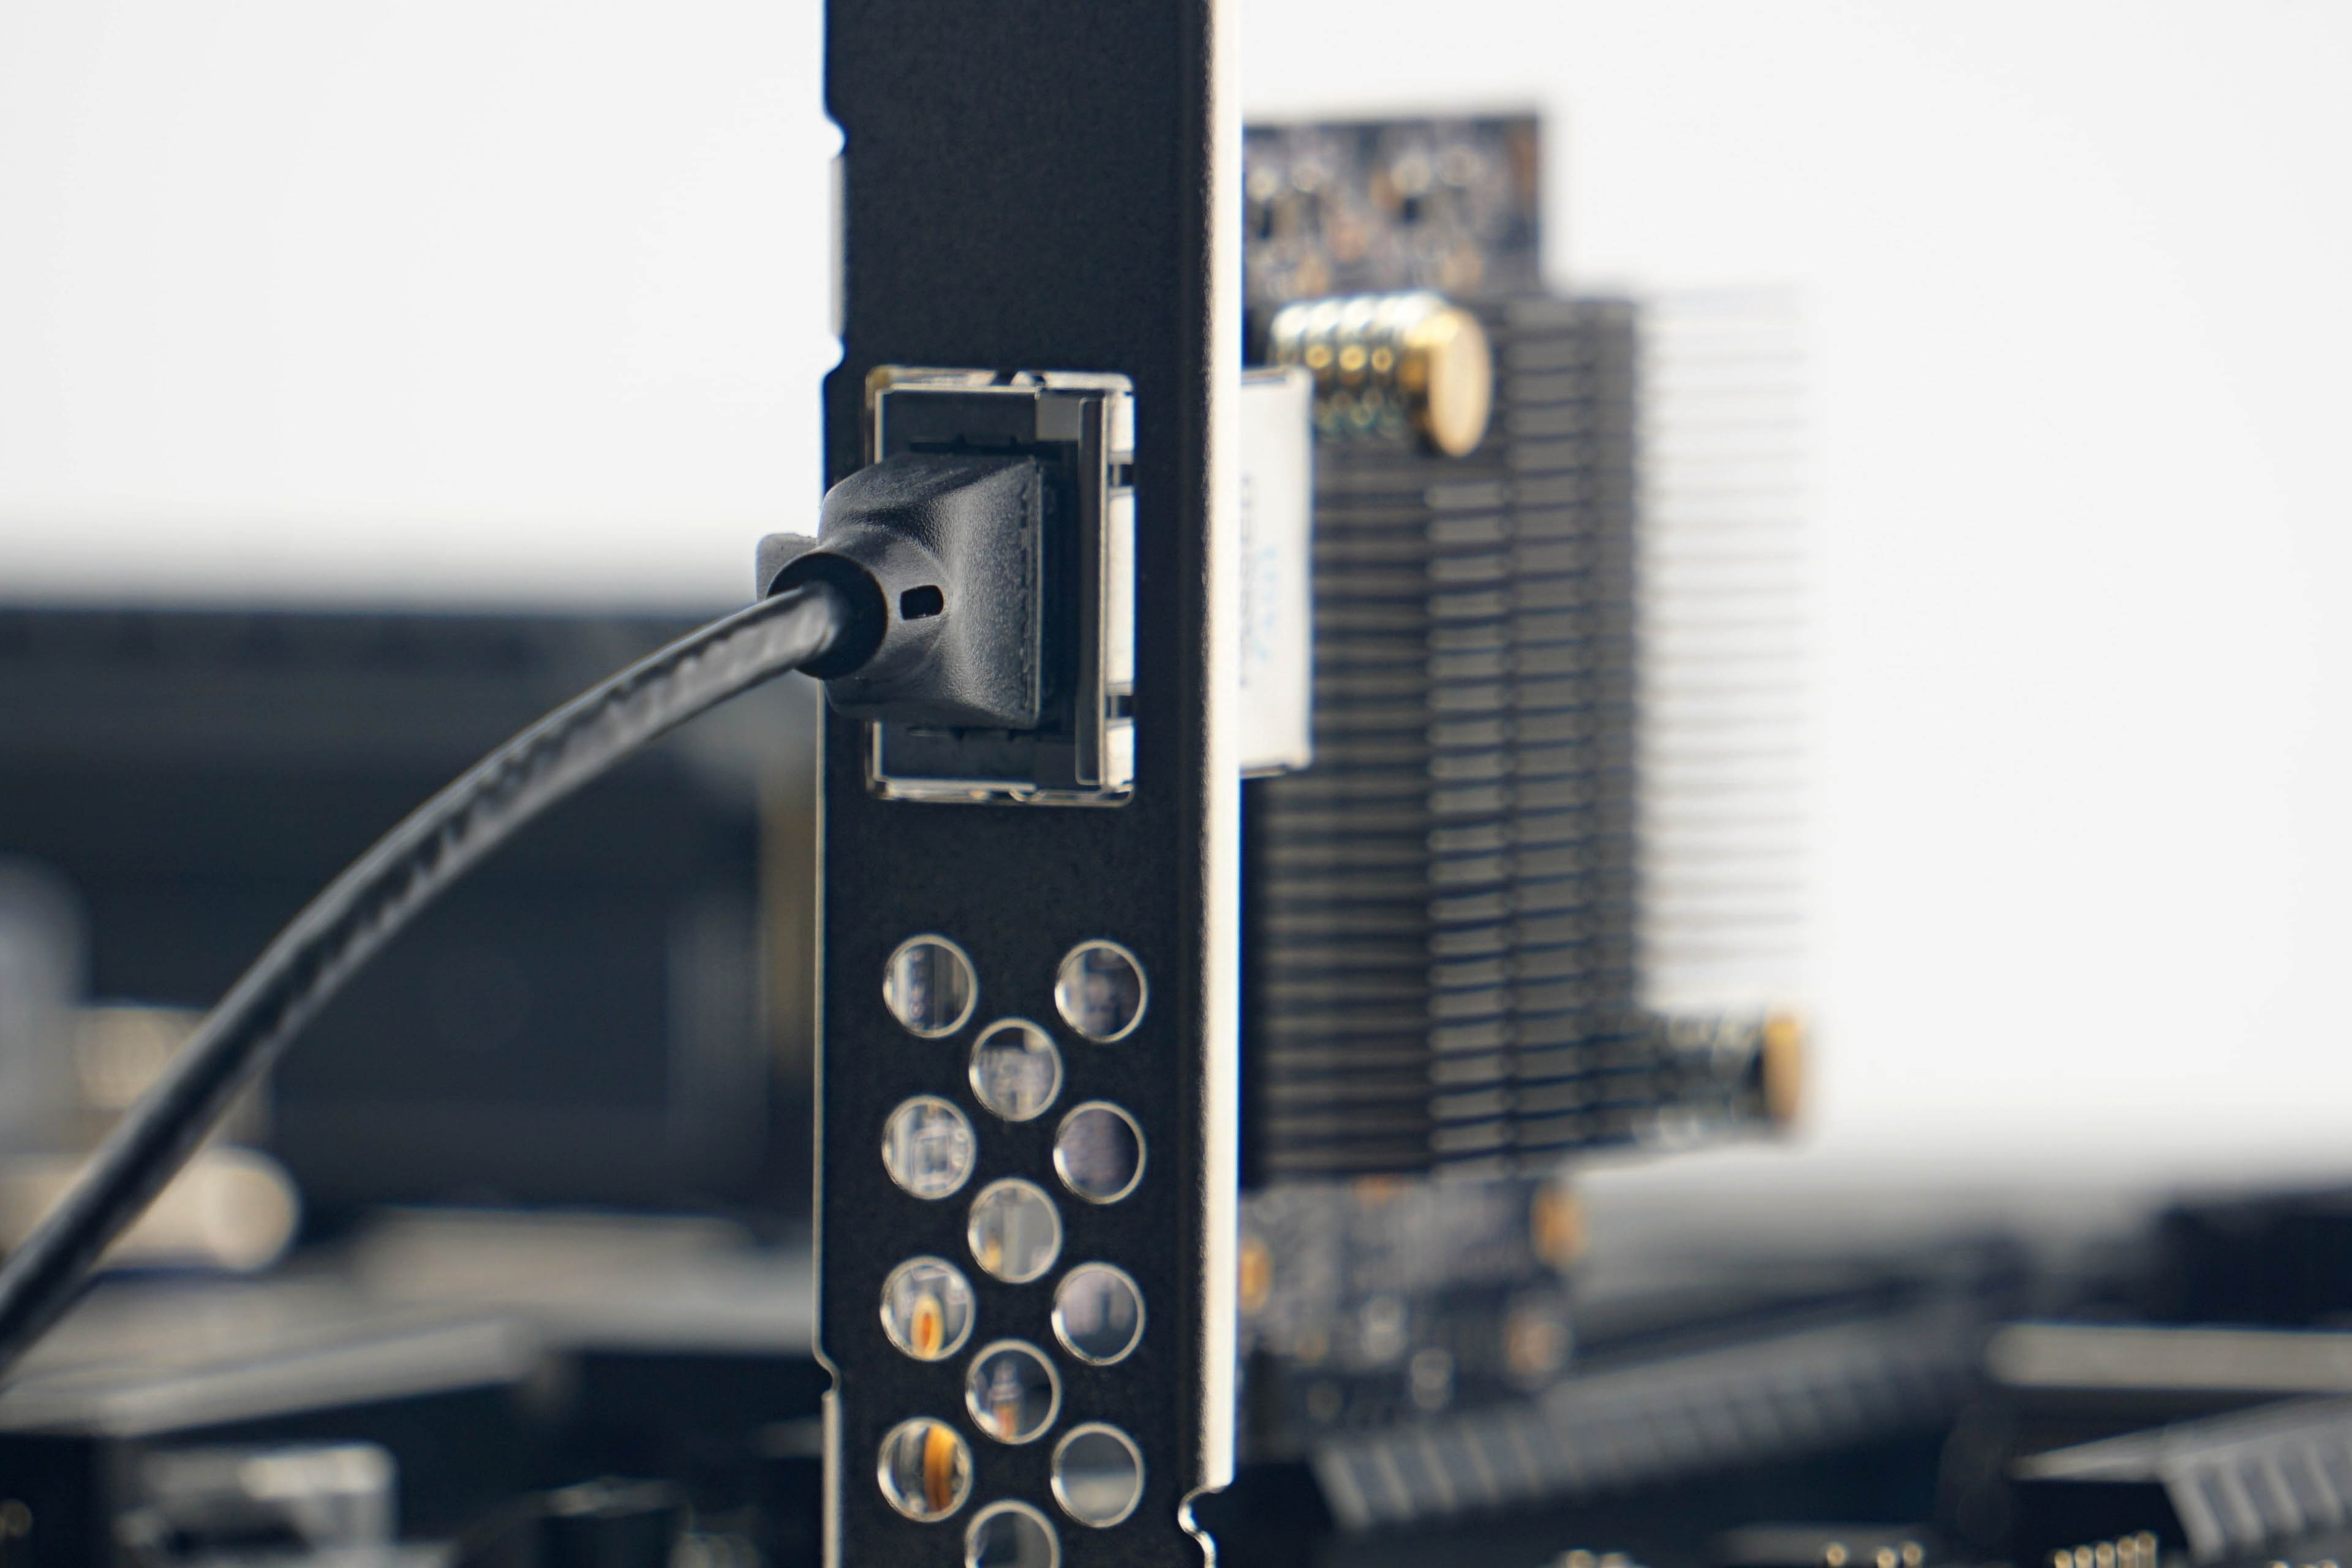
| Other internal connectors | 1× Thunderbolt Thunderbolt with RTD3 support, 1× TPM, 2× ARGB LED (5 V), 1× RGB LED (12 V) 1× jumper Clear CMOS | |
| POST display | no (but has debug LED) | |
| Buttons | N/A | |
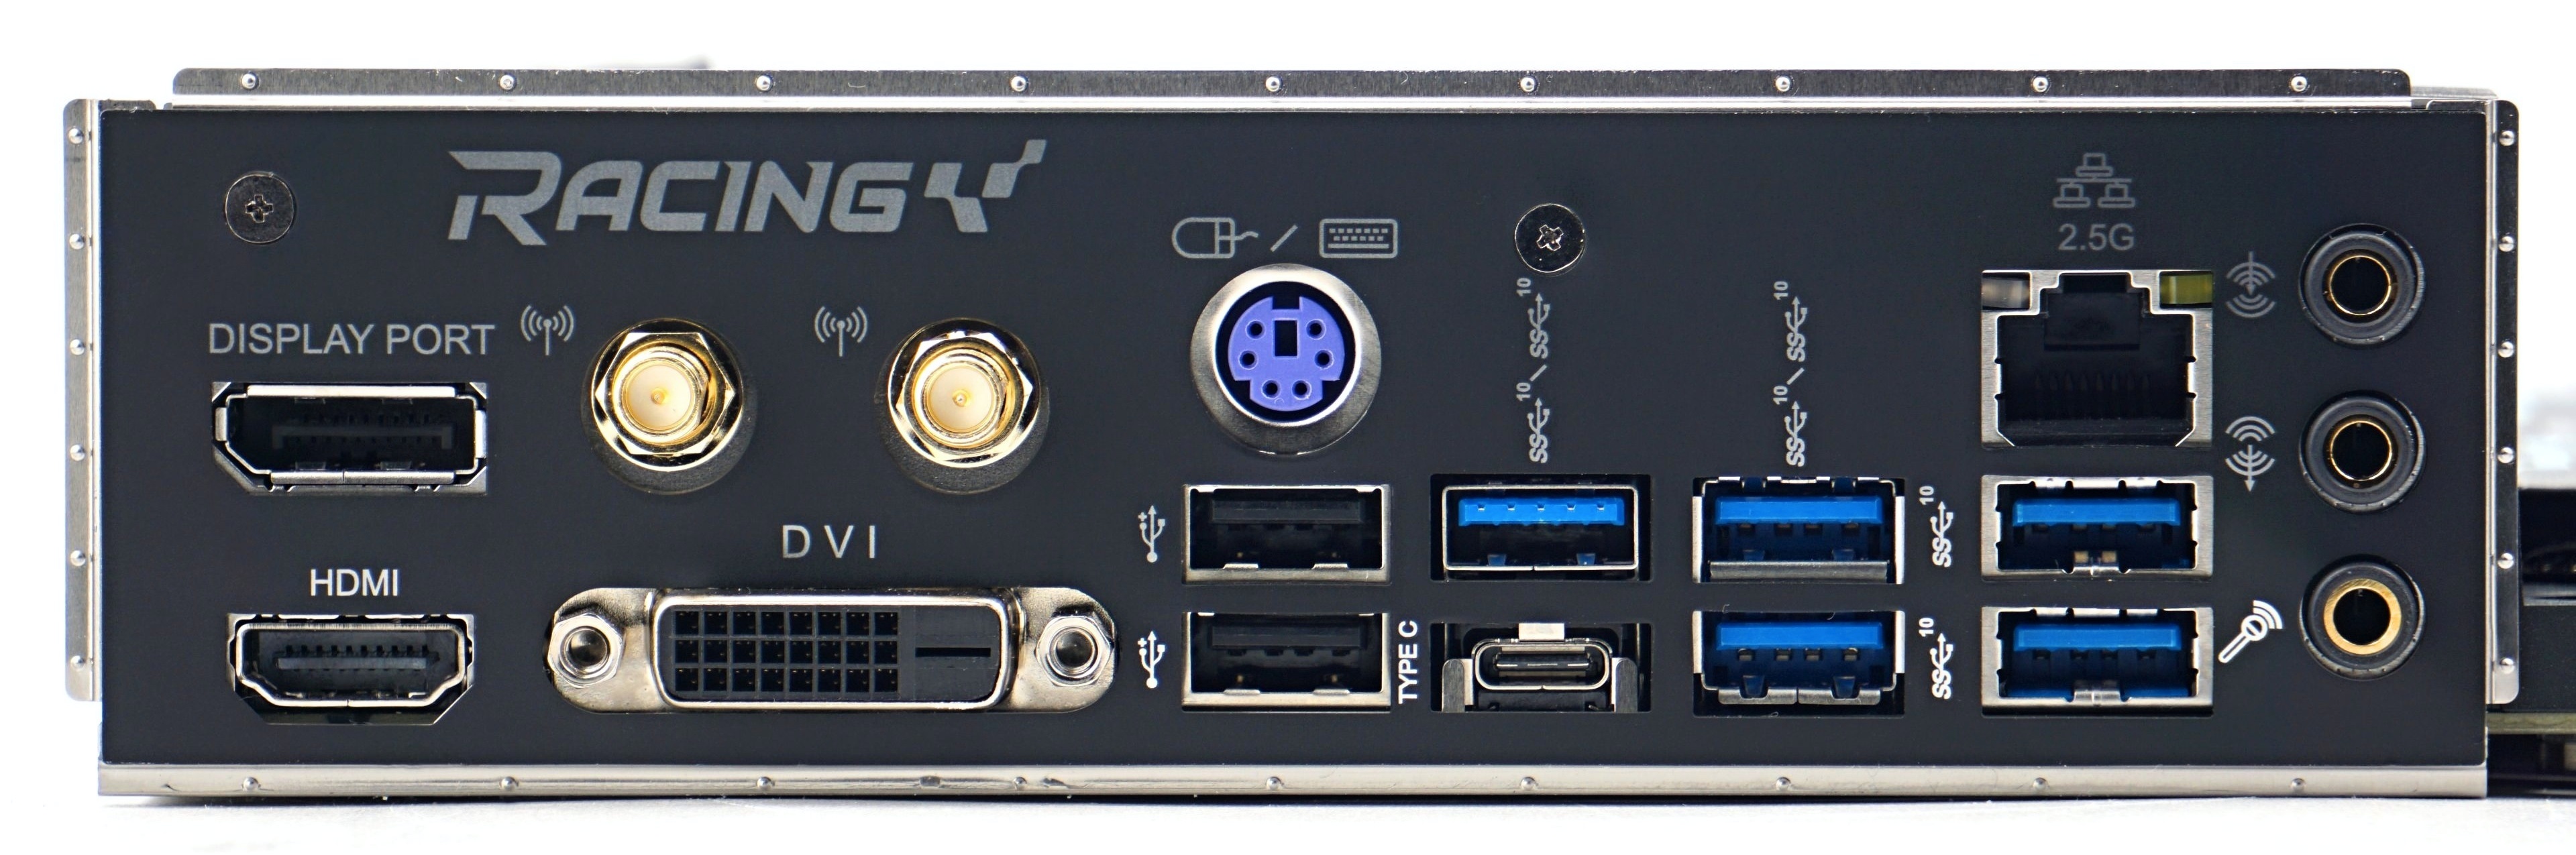
| External USB ports | 1× 3.2 gen. 2 type C, 5× 3.2 gen. 2 type A, 2× 2.0 type A | |
| Video outputs | 1× HDMI 2.0, 1× DisplayPort 1.4, 1× DVI-D | |
| Network | 1× RJ-45 (2,5 GbE) – Realtek RTL8125B | |
| Audio | Realtek ALC1220 (7.1) | |
| Other external connectors | 1× PS/2, 2× SMA | |
| Approximate retail price | 231 EUR |
Biostar B660GTA
Although this is Biostar’s most expensive board with the B660 chipset, it is still “grounded”. The features don’t include extra things for enthusiasts, which tend to increase the price significantly. Price-wise, the B660GTA from the Racing series is on par with the cheaper Z690 boards.
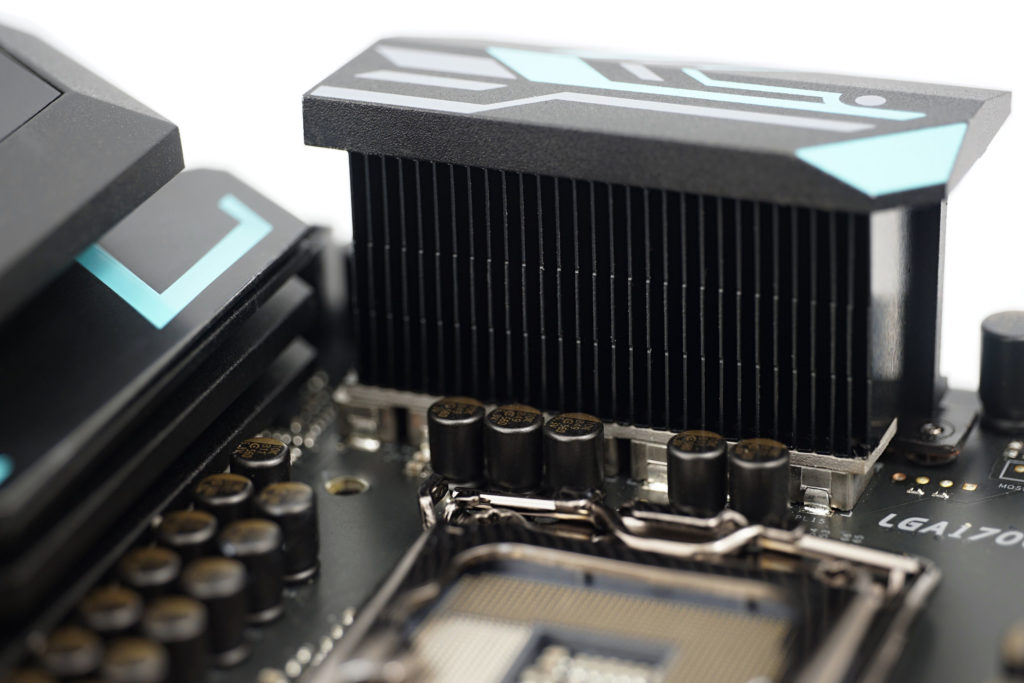
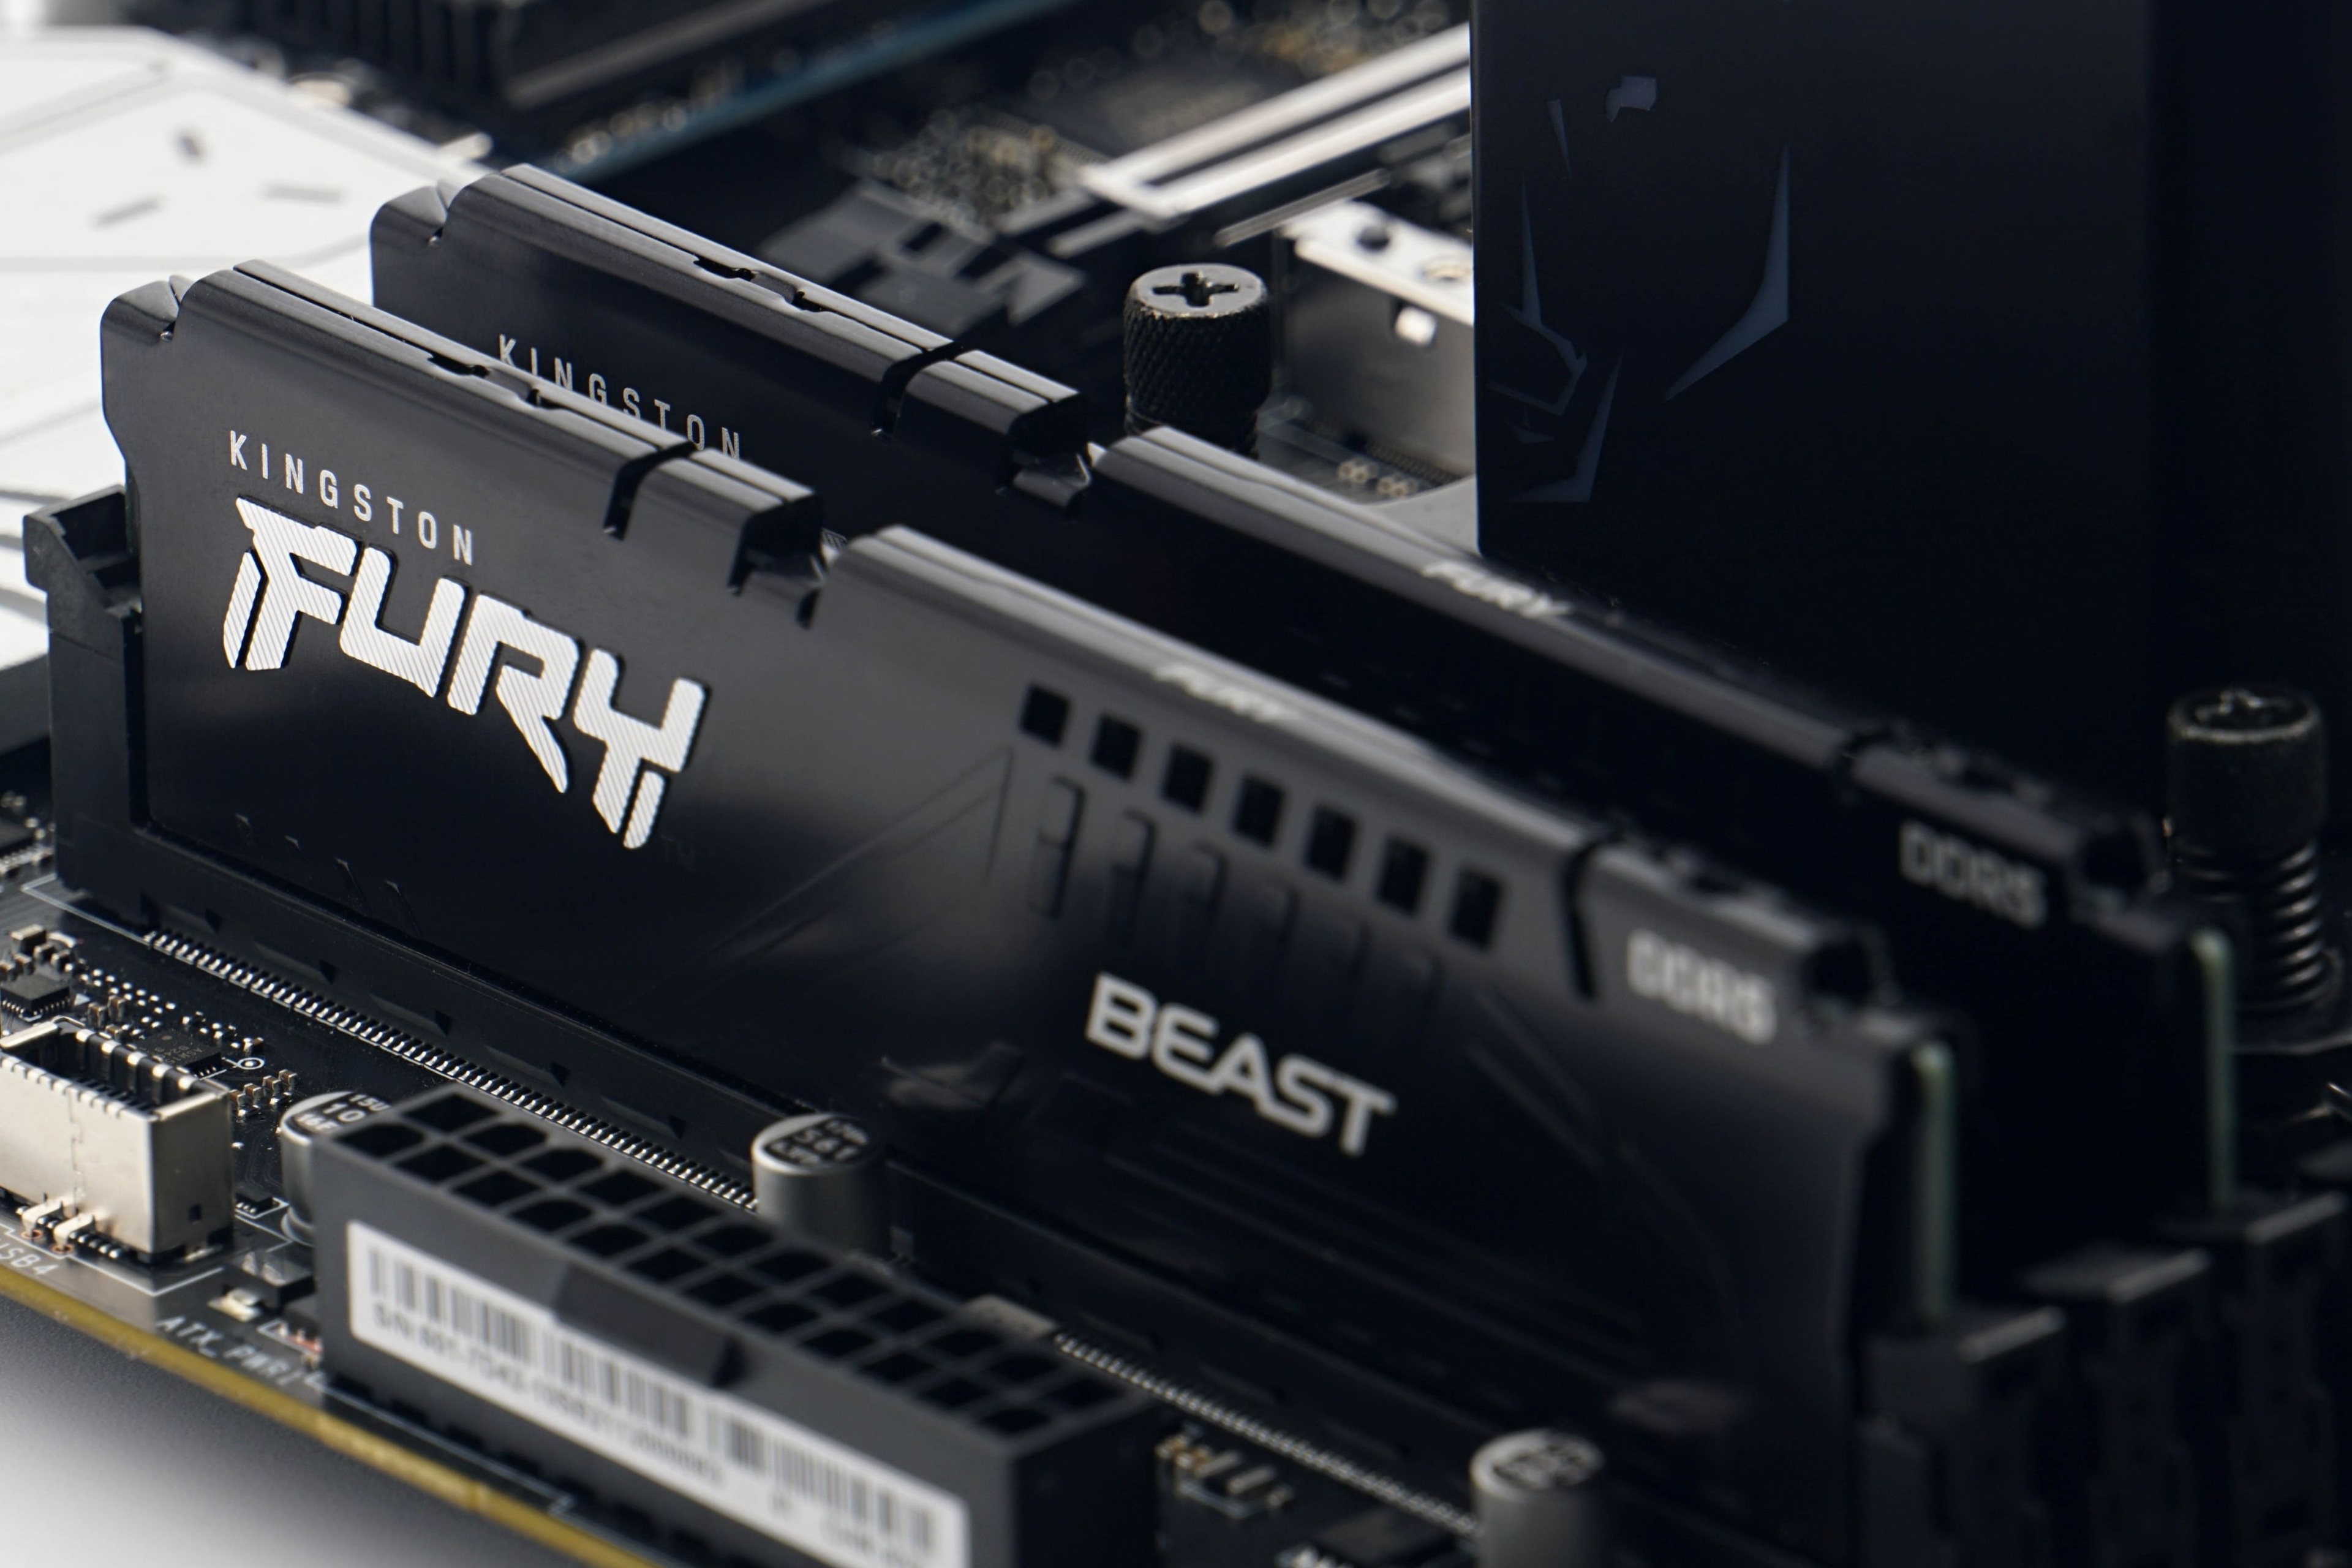
The format is ATX, i.e. 305 × 244 mm. The PCB with a regular shape is also traditional. Unusual or above-standard is the distance between the processor socket and the first PCI Express slot. The center distance (of both sockets) is up to 101 mm, which is 11 mm more than on the Gigabyte B660 Aorus Master DDR4 board. The greater the spacing here, the more convenient it is to remove the graphics card alongside a large tower cooler. From the centre of the CPU socket to the contacts of the first DIMM slot, it is a standard 56 mm (you can easily calculate whether the cooler will collide with the RAM heatsinks and in which positions). DDR4 memory is supported and space for four modules is available.
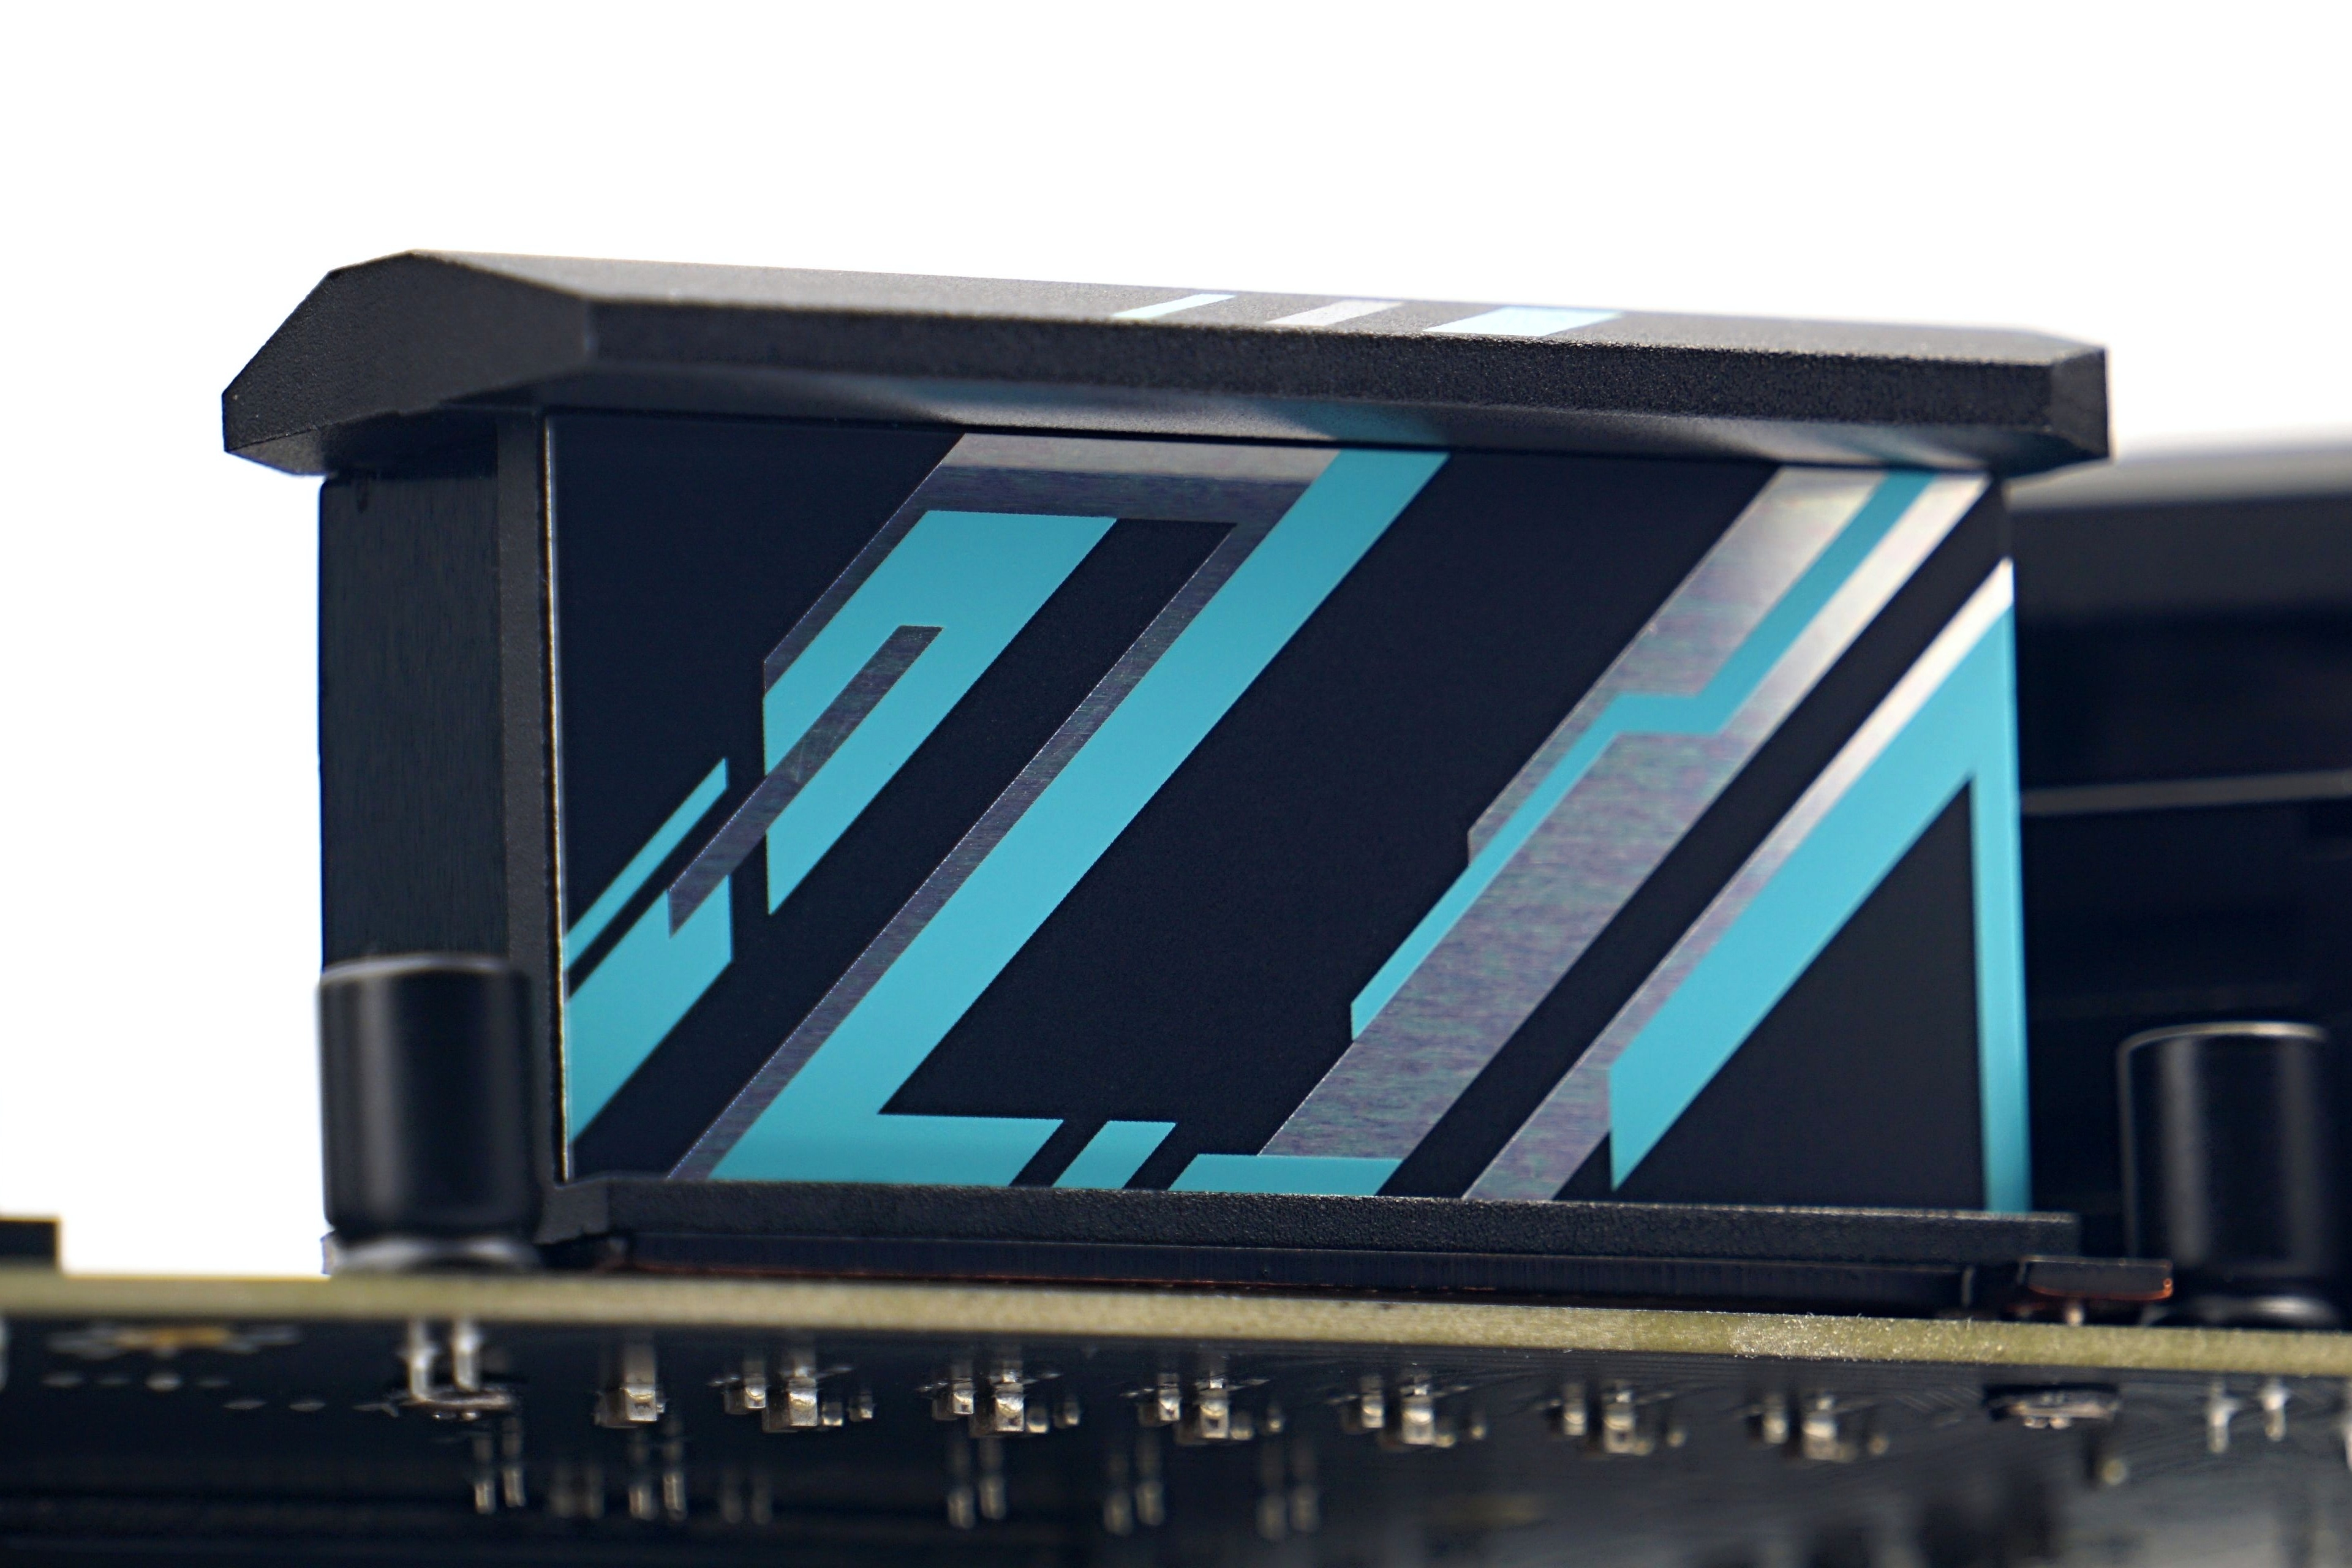
The heatsinks are robust, more robust than on the cheaper B660 boards. One of the VRM heatsinks even consists of thin “slice” fins, as you can see in the title photo. The radiating area is thus considerably larger than on most other boards, which admittedly use a lot of material, but with poorer segmentation. However, the effectiveness of this heatsink is somewhat unnecessarily killed by Biostar’s rear wall (cover?), which prevents airflow through the fins.
The weight of this heatsink is 84 g, the second (larger) one has 169 g.
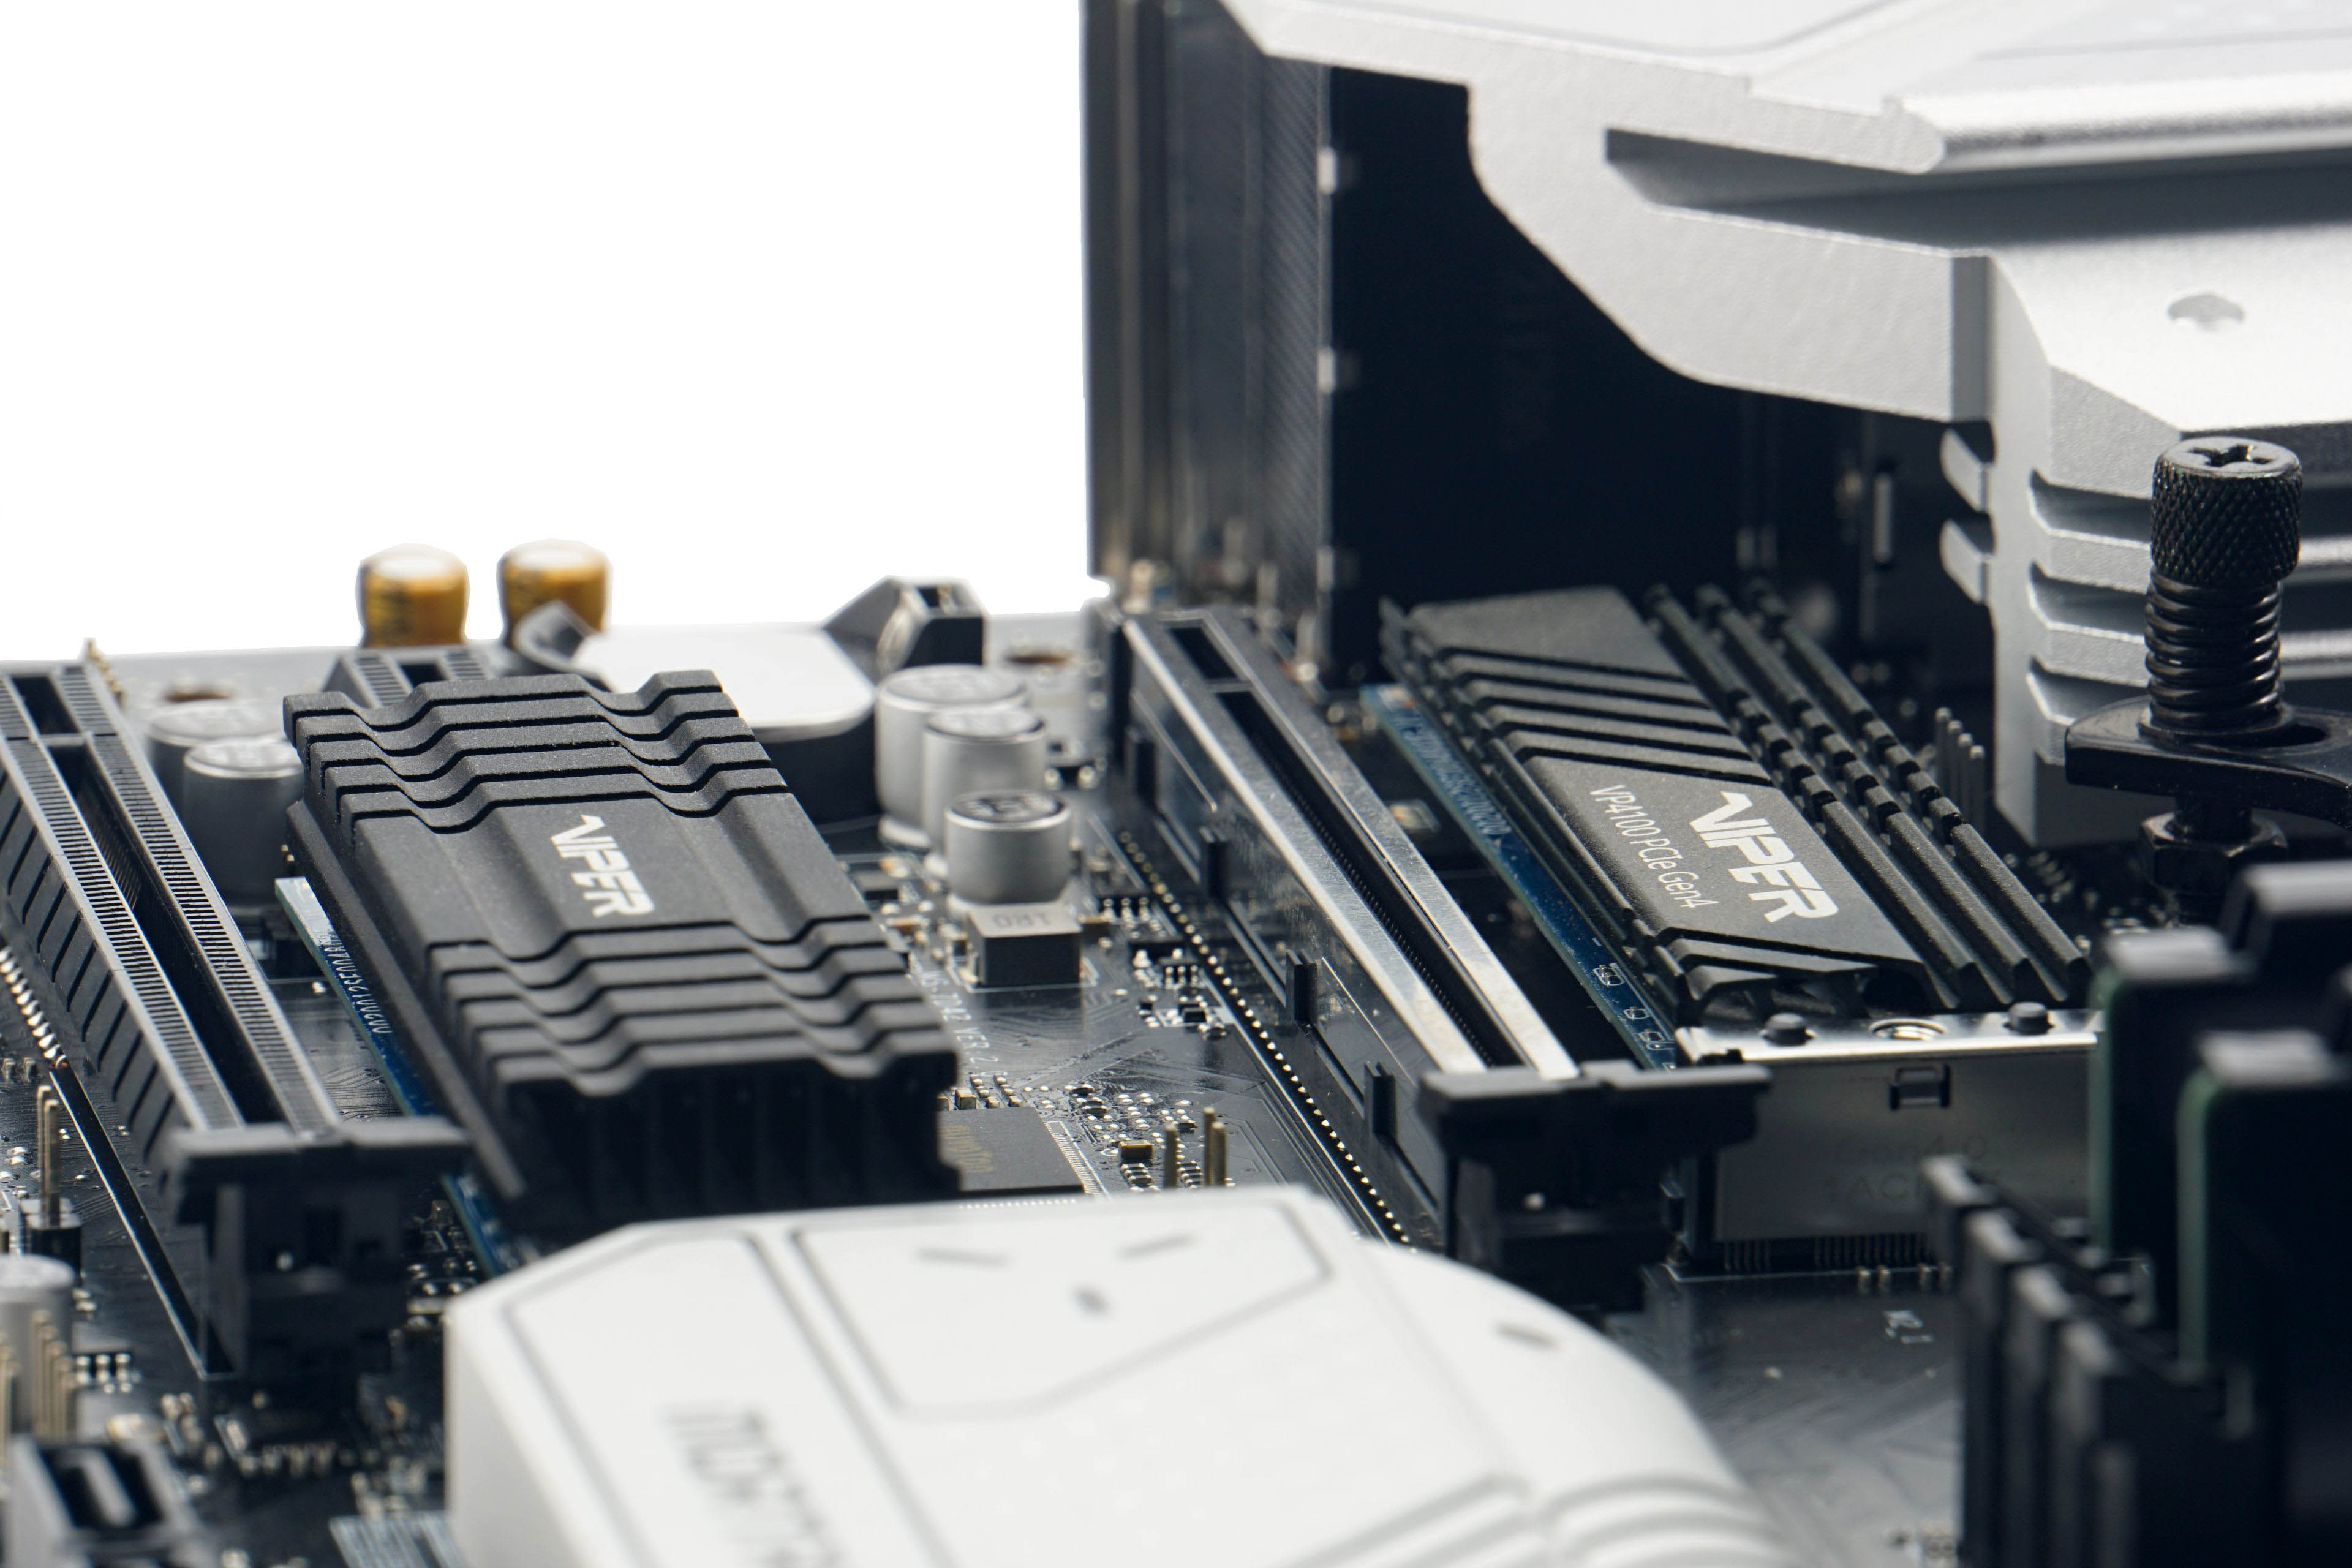
The SSD M.2 heatsinks also have a high weight. They are for all three slots and the largest, the bottom one, is up to 59 g. This is despite the fact that this M.2 slot, compared to the other two (PCIe 4.0 ×4), supports a half-speed interface (PCIe 3.0 ×4), which naturally makes lower demands on cooling as well. However, it is longer than the other heatsinks mainly because this slot is also the only one that supports SSD formats up to 110 mm in length. The other two max out at 80 mm and are reserved for NVMe SSDs. The third slot is a hybrid, it supports SATA in addition to PCIe.
Mounting an M.2 SSD is rather impractical. Fixing the SSDs themselves in the slots uses small screws (some boards already use more elegant locking levers), but also their heatsinks. Other manufacturers have had a lock in place on the heatsink level for a long time so that the screws can’t be lost. When that happens, you can’t just get replacements at the hardware store.
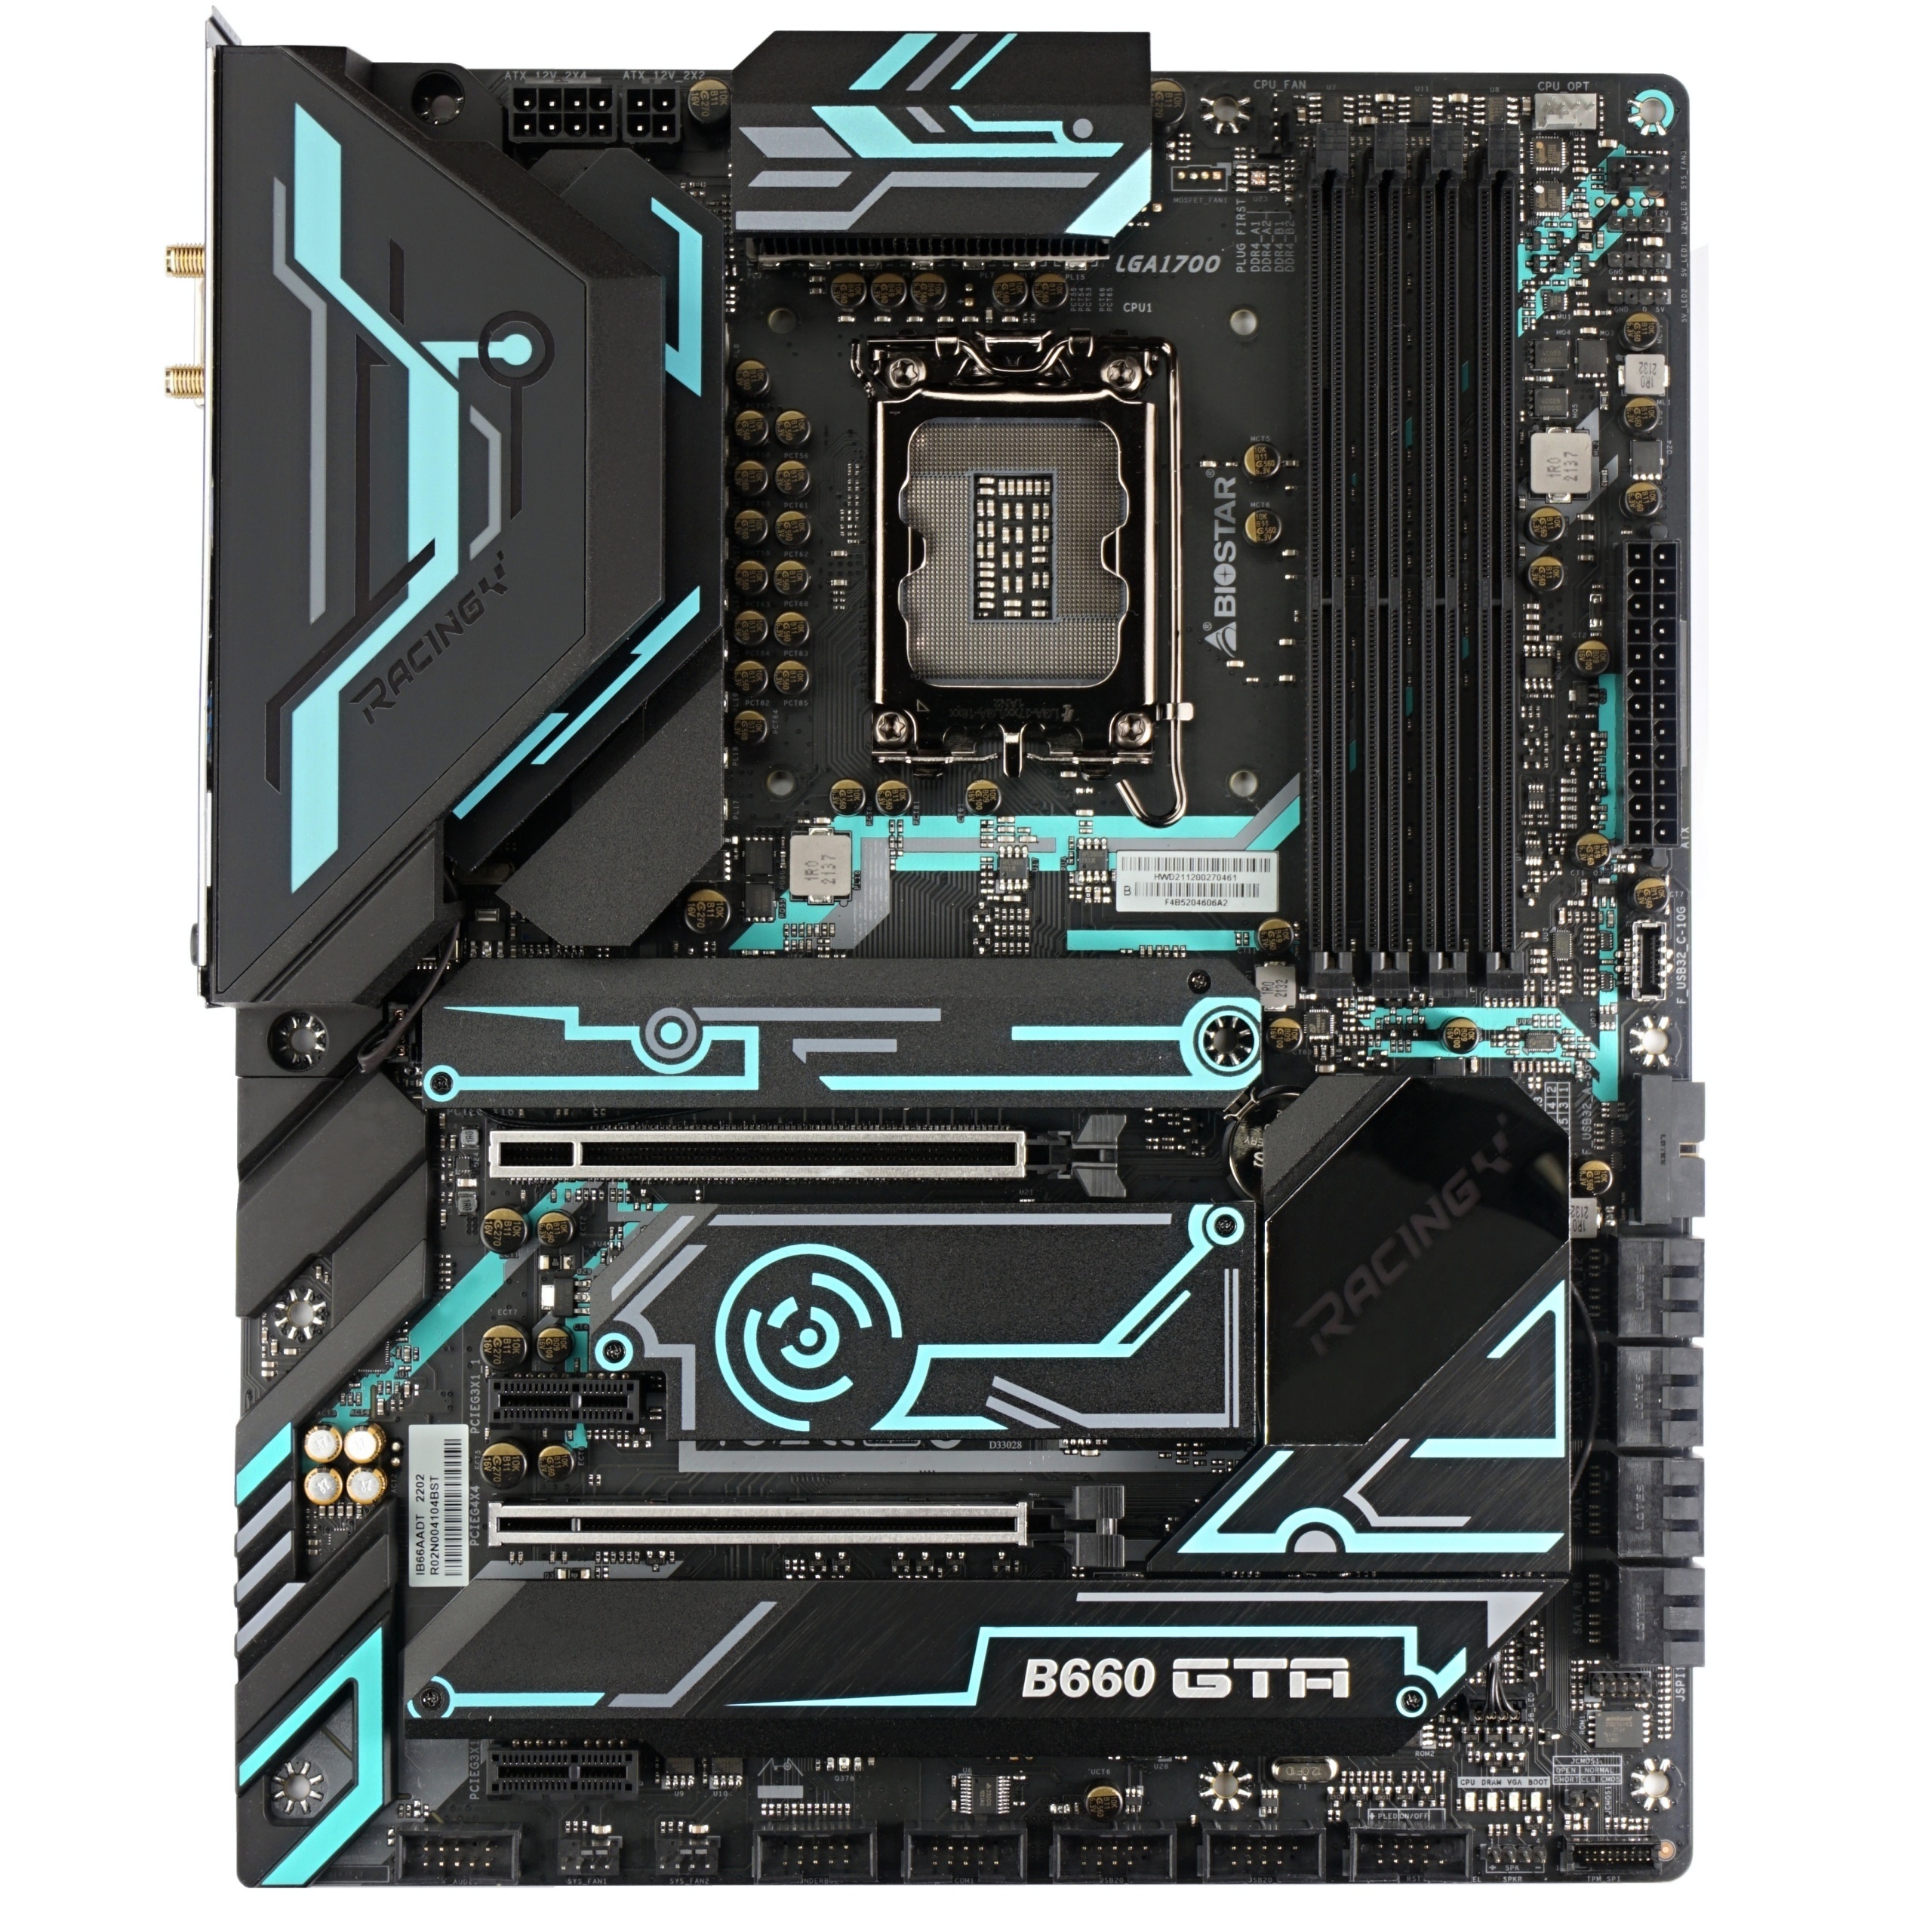
Storage support is above standard, especially for up to eight SATA connectors for SSD/HDD inch formats. The board is thus offered for server building. RAIDs supported are 0, 1, 5 and 10. But count on the fact that one SATA connector shares a line with a third M.2 connector. This means that if you install a SATA SSD in this slot (M.2), the eighth SATA connector will be disabled. If you want to use all the M.2 and SATA connectors, you have to install a PCIe (NVMe) SSD in the bottom M.2 connector. Somewhere Biostar giveth, somewhere else Biostar taketh. There are only five fan connectors, which is unusually few for an ATX board.
Atypical, and now with a positive connotation, is also the selection of external connectors. From the iGPU, besides HDMI (2.0/2.1) and DisplayPort 1.4, there is also a DVI-D output. Then there’s also a PS/2 for connecting a keyboard and mouse. In a typical server environment, this connectivity will find its use. The board will also be able to connect directly to older monitors that are still in use in this environment. PS/2 will again come in handy when typically outside of the OS the faster USB ports don’t work without a driver. Most of the USB ports are Gen. 2 standard 3.2, i.e. with 10 Gbps bandwidth. The Ethernet connector (RJ-45) is a single 2.5 Gb, there are also two SMA connectors on the rear panel to which the antennas are connected, but the RF module itself is no longer supplied with the board. You have to buy it separately.
It is rather strange that in this price range only three 3.5 mm jacks (without optical output) are provided. But we won’t criticize this too much, because behind the design it’s clear that Biostar has prioritized quality over quantity. You won’t be able to connect 5.1 and 7.1 systems with multiple satellites to the board, but the connectors that are there are proper – gold-plated. The audio adapter on the board is Realtek ALC1220.
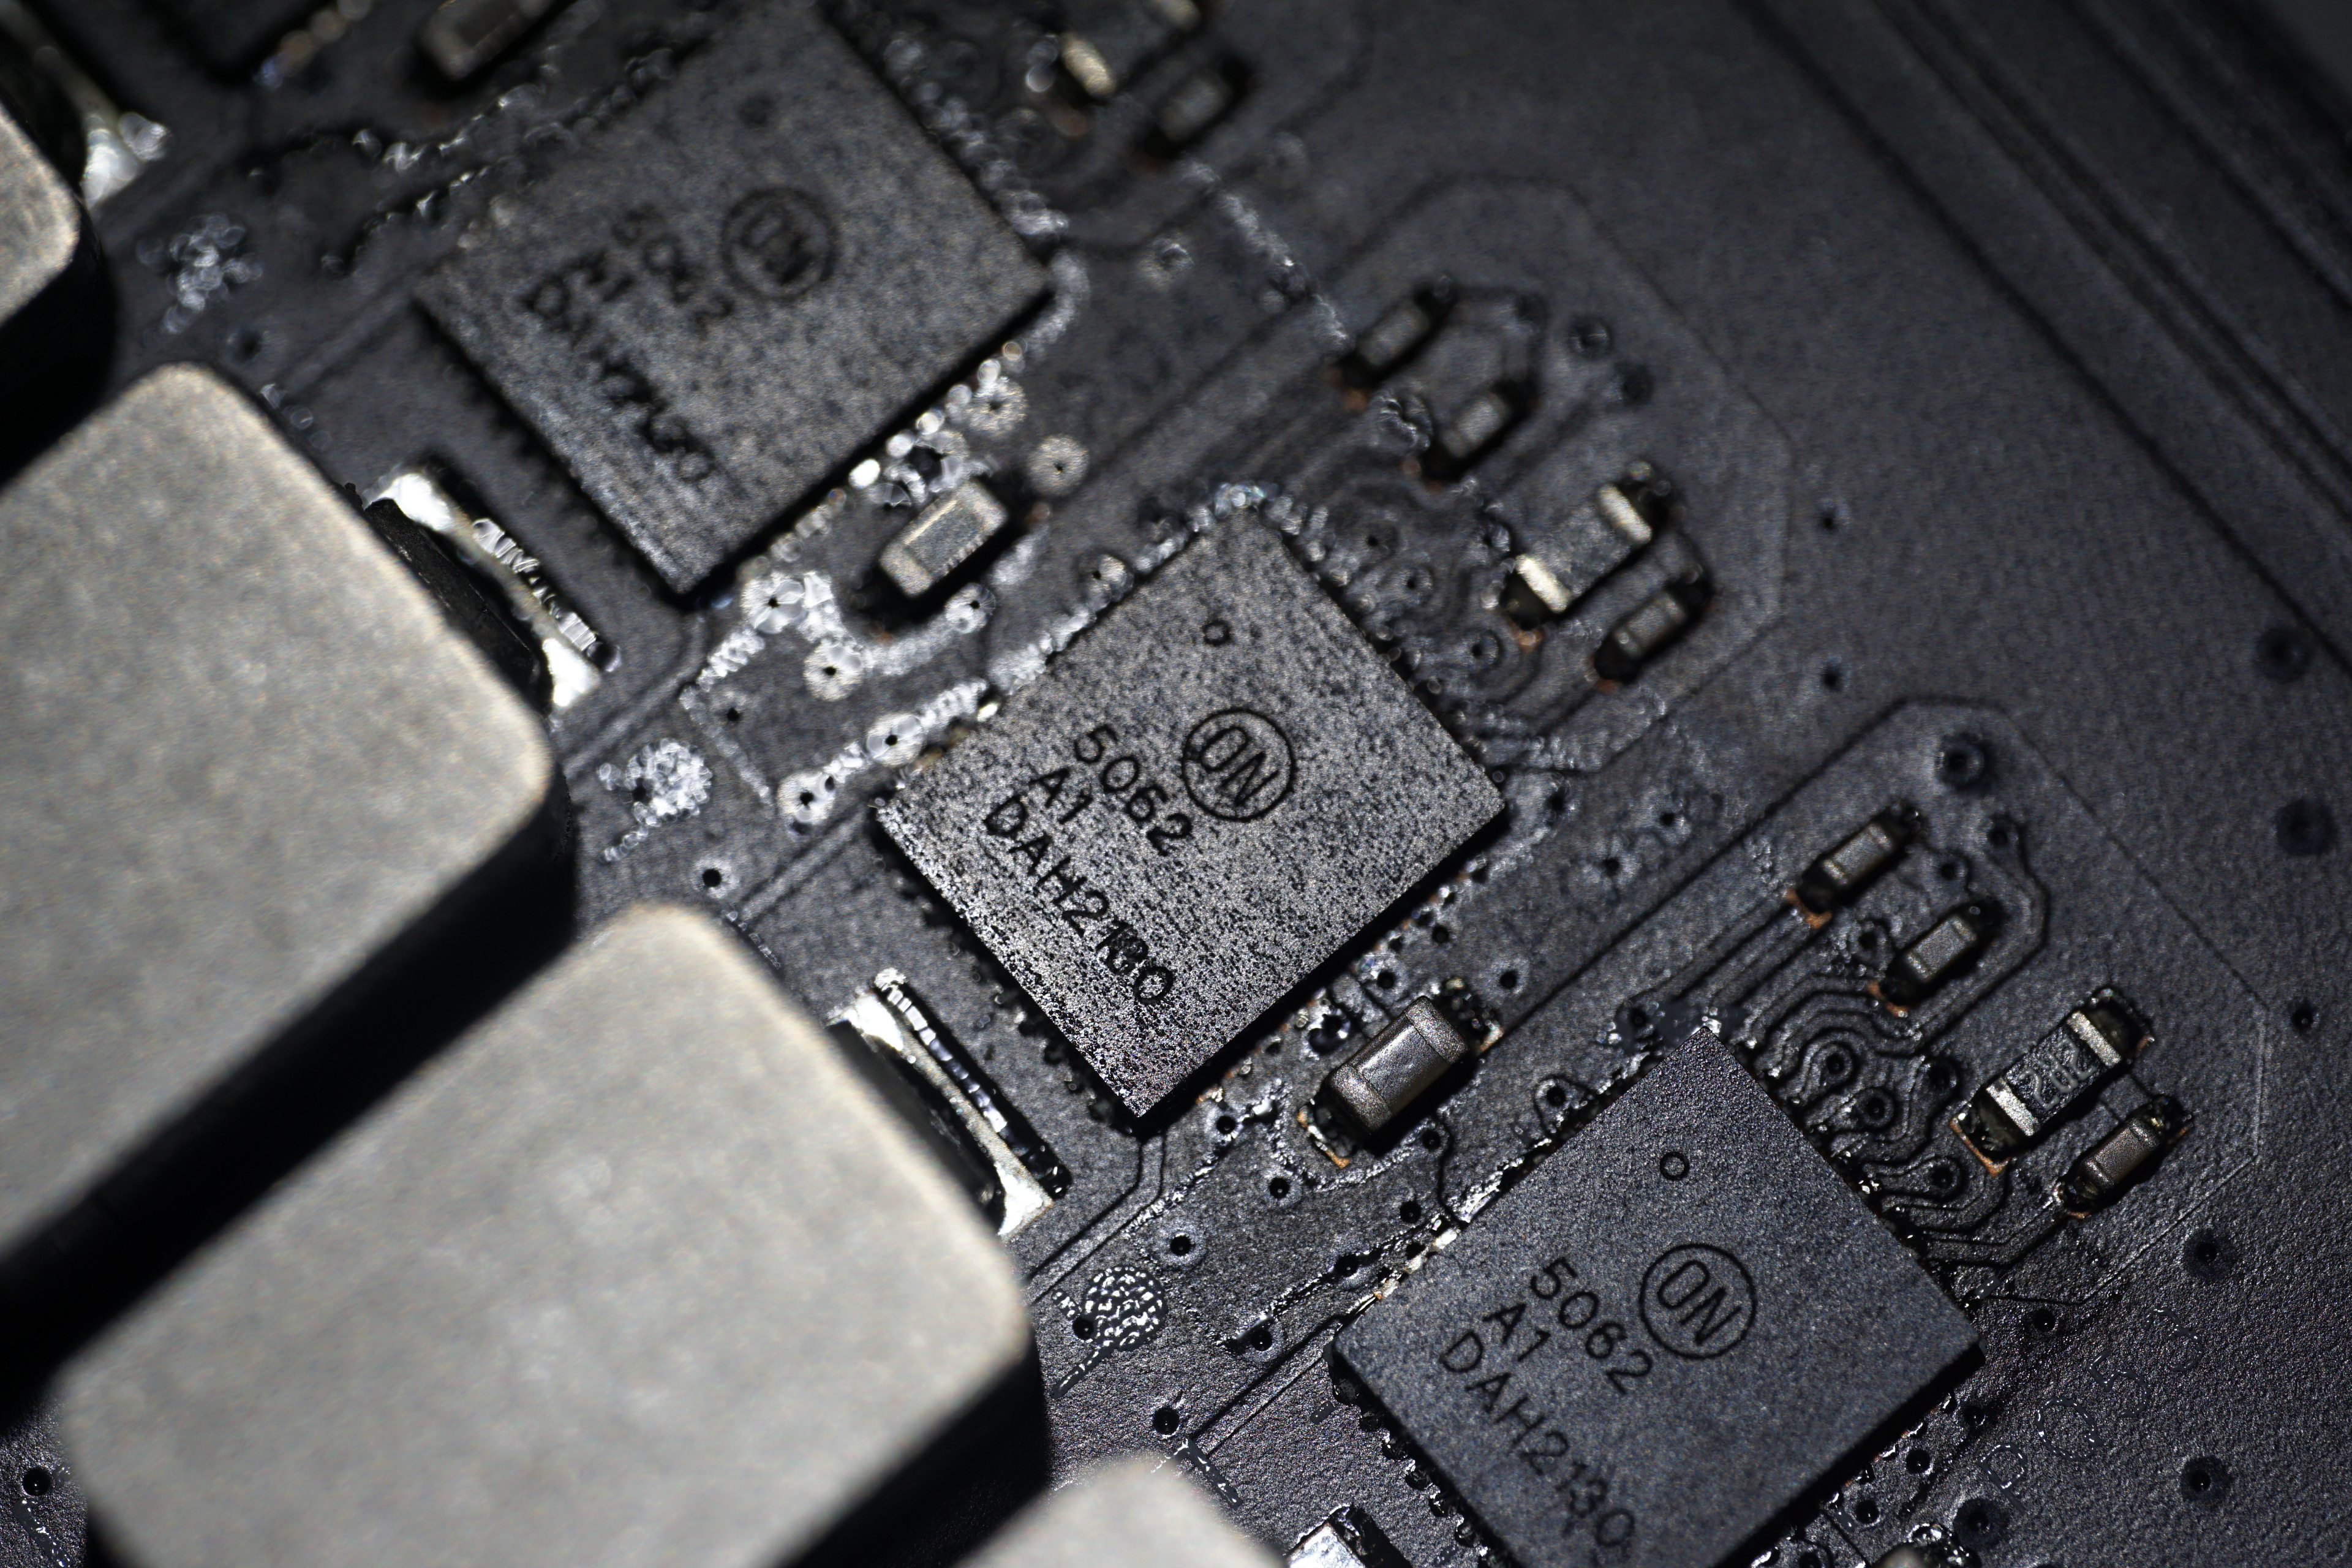
Finally the VRM. This is 17-phase (with a current capacity per phase of 70 A), built on Renessas RAA228228 PWM drivers and OnSemi FDMF5062 voltage regulators. The power delivery is therefore quite robust. What is its efficiency, you will find out from the tests.
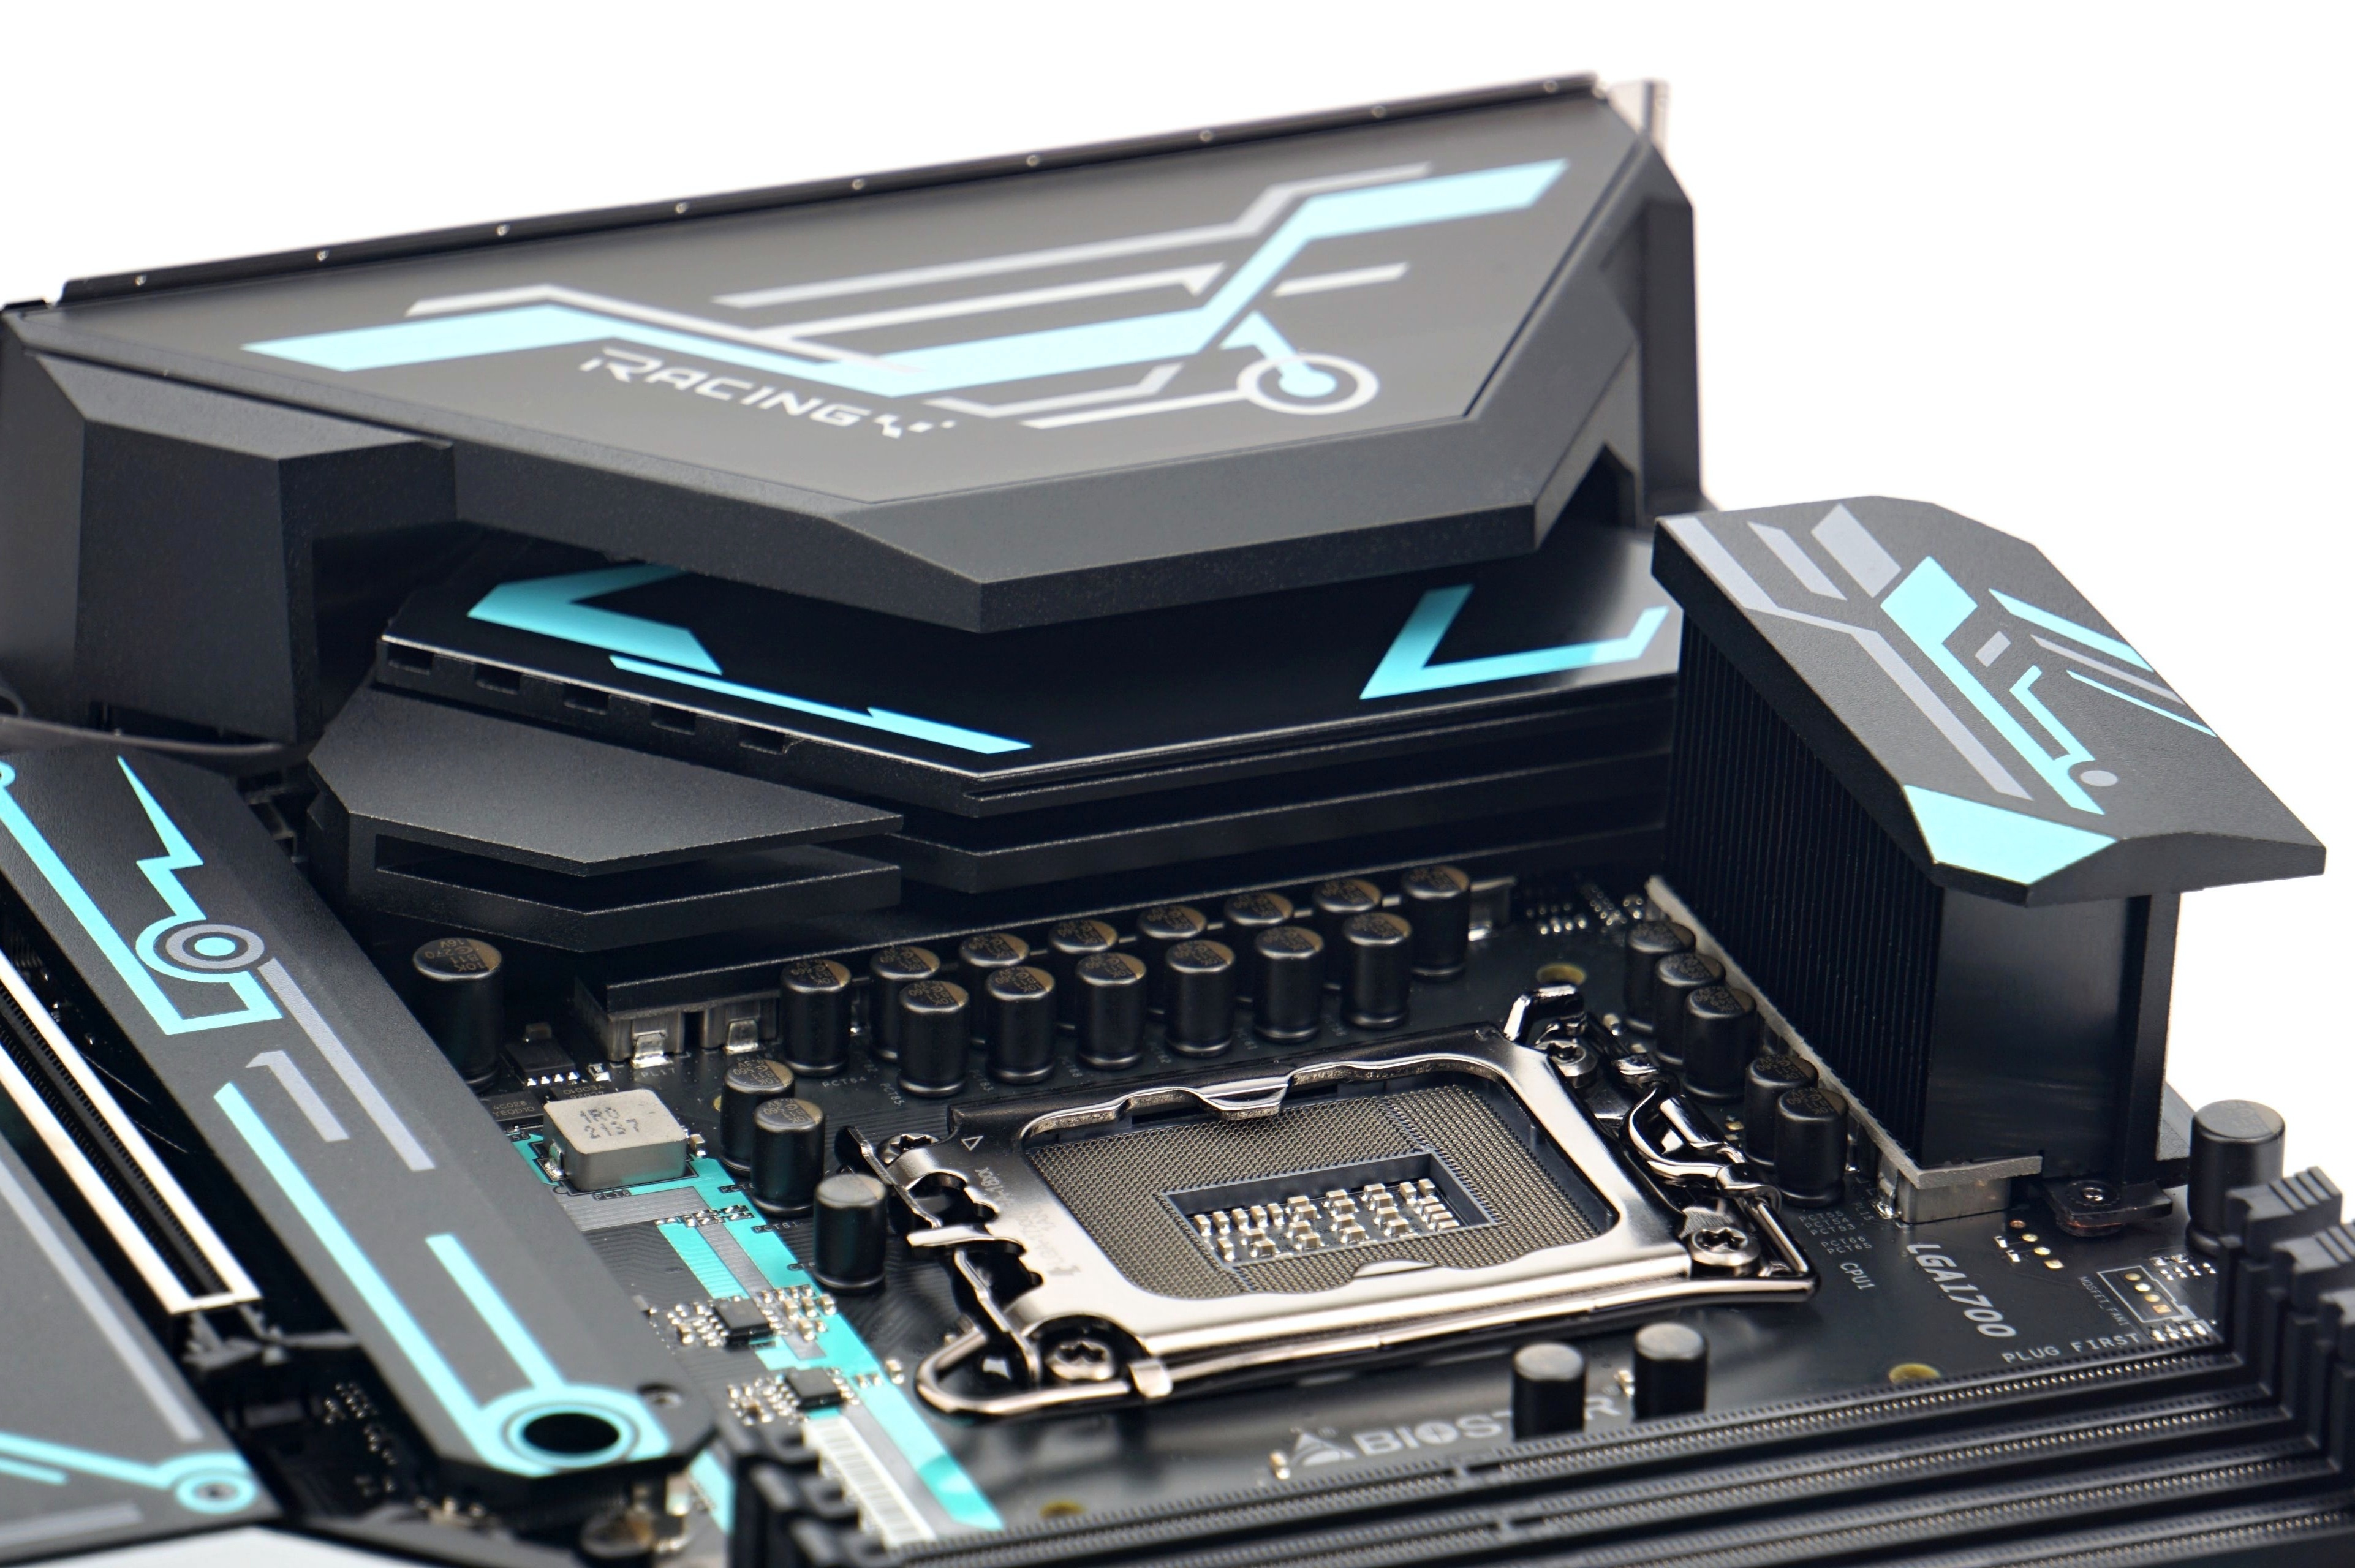
There are also RGB LED elements on the board in two places. On the plastic cover next to the VRM – their lightguides are in the photo below. Then the chipset heatsink is also backlit, but this is in the axis of the first PCI Express slot and will often be overlapped by the graphics card.
Most motherboards from the same classes look pretty much the same. While they differ in color scheme and heatsink shape, the layout, features, and overall operation (including power management) are like a carbon copy. The Biostar B660GTA goes upstream in many ways and presents an attractive option for those users who always find something lacking on boards in this price range.
What it looks like in the BIOS
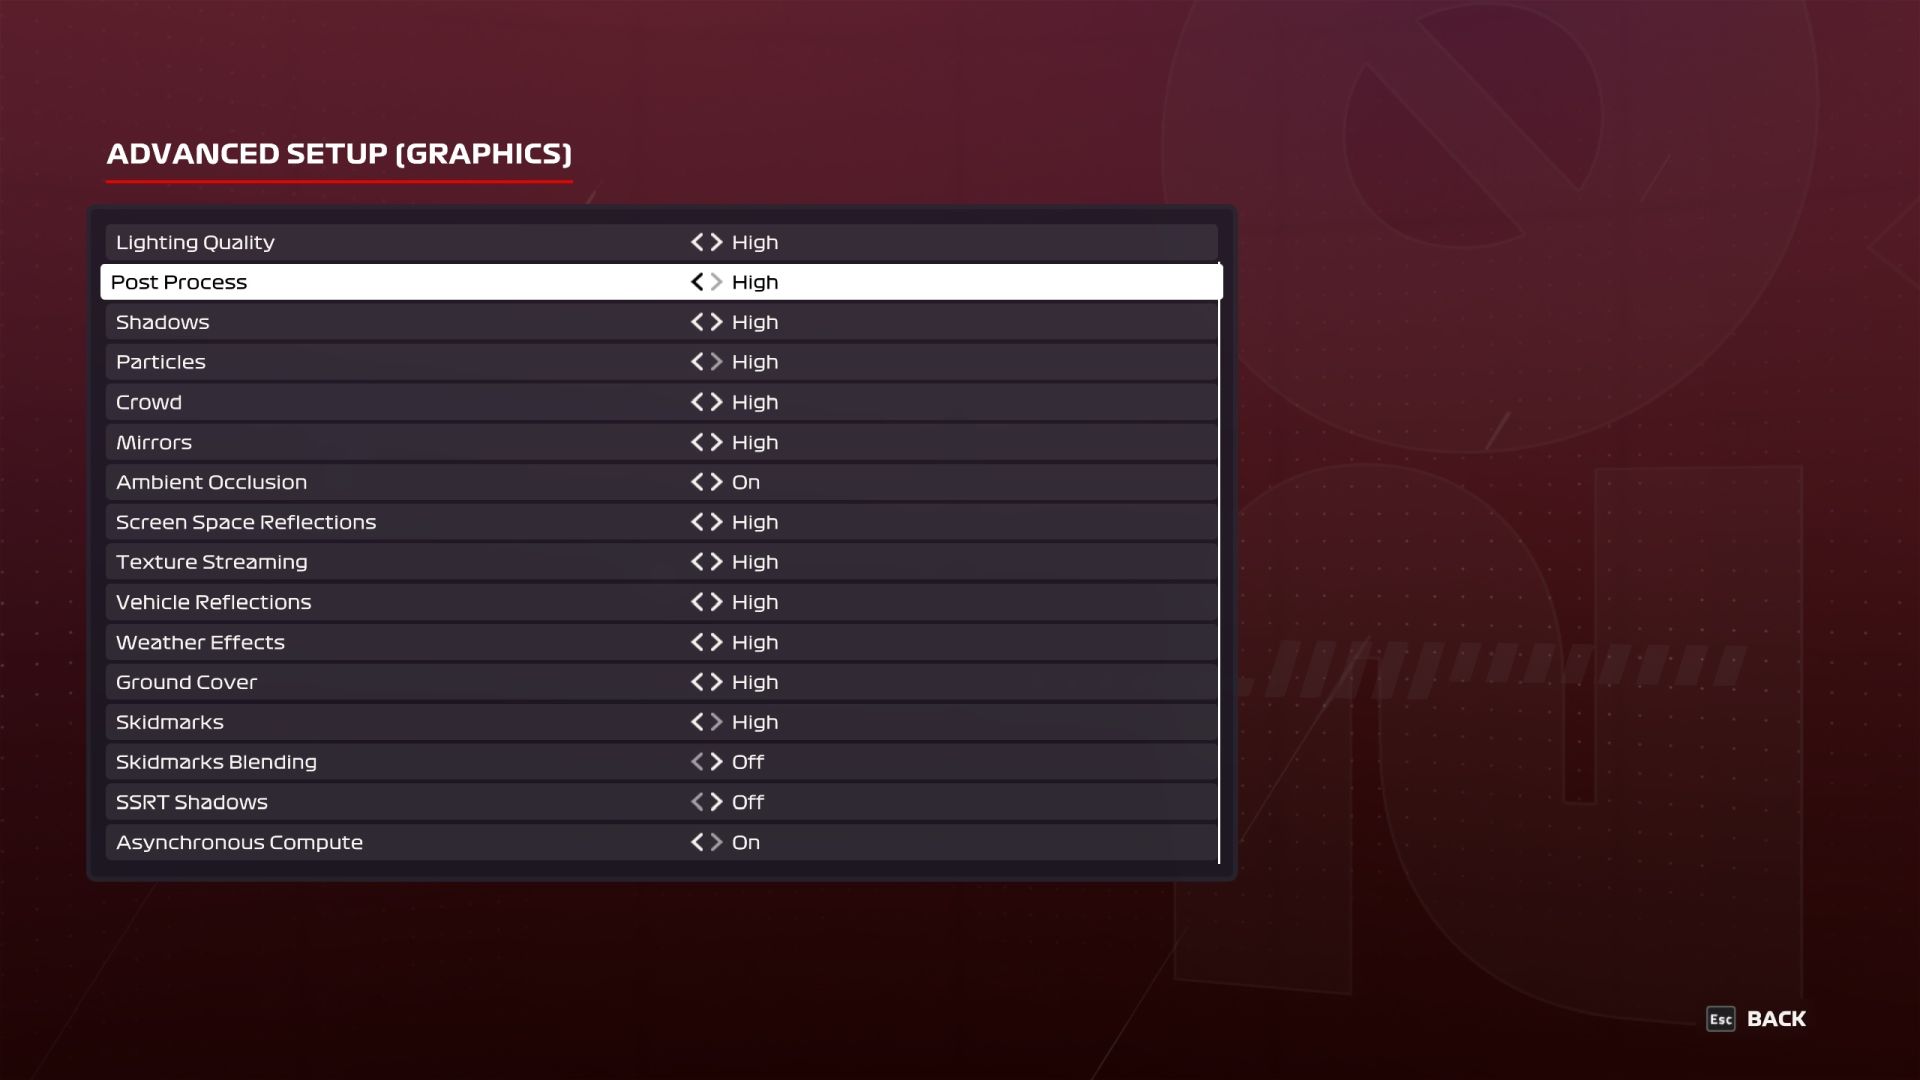
The UEFI GUI is unique in many ways, or rather, if you don’t already have some experience with Biostar boards, some of the details will be new to you. There are differences in the layout of individual elements, settings and some “special” features (or designations) across all manufacturers, but Biostar bypasses the conventions the most.
There is also a simplified view here. EZ Mode allows you to activate the memory profile (XMP), enable RAID or CSM with one button, set the boot priority or go to the fan management interface. A large space is also reserved for CPU, memory and attached storage information. It’s actually very similar in content to MSI’s Click BIOS, although the individual elements are in different places. We’ll leave it up to you to decide whether Biostar’s layout fares better or worse.
Although Biostar doesn’t use the same keyboard shortcuts for some things as others, the F7 key to go to a more advanced view has been retained. But screenshots, for example, are taken via F11 (instead of the traditional F12 key), and it’s also notable that you have to name the photo somehow before you can save it. A generic name with a changing number at the end of the file is commonly used.
On the “Advanced” tab there is a signpost to the basic settings that are also on other boards. Nothing that other manufacturers have is missing here. Detailed enough are the SATA settings, where you can configure the individual ports (AHCI/RAID, Hot Plug, …), NVMe or PCIe, where you can enable, for example, the Resizable BAR to increase the performance of the graphics card. The management of CPU settings is also fully featured.
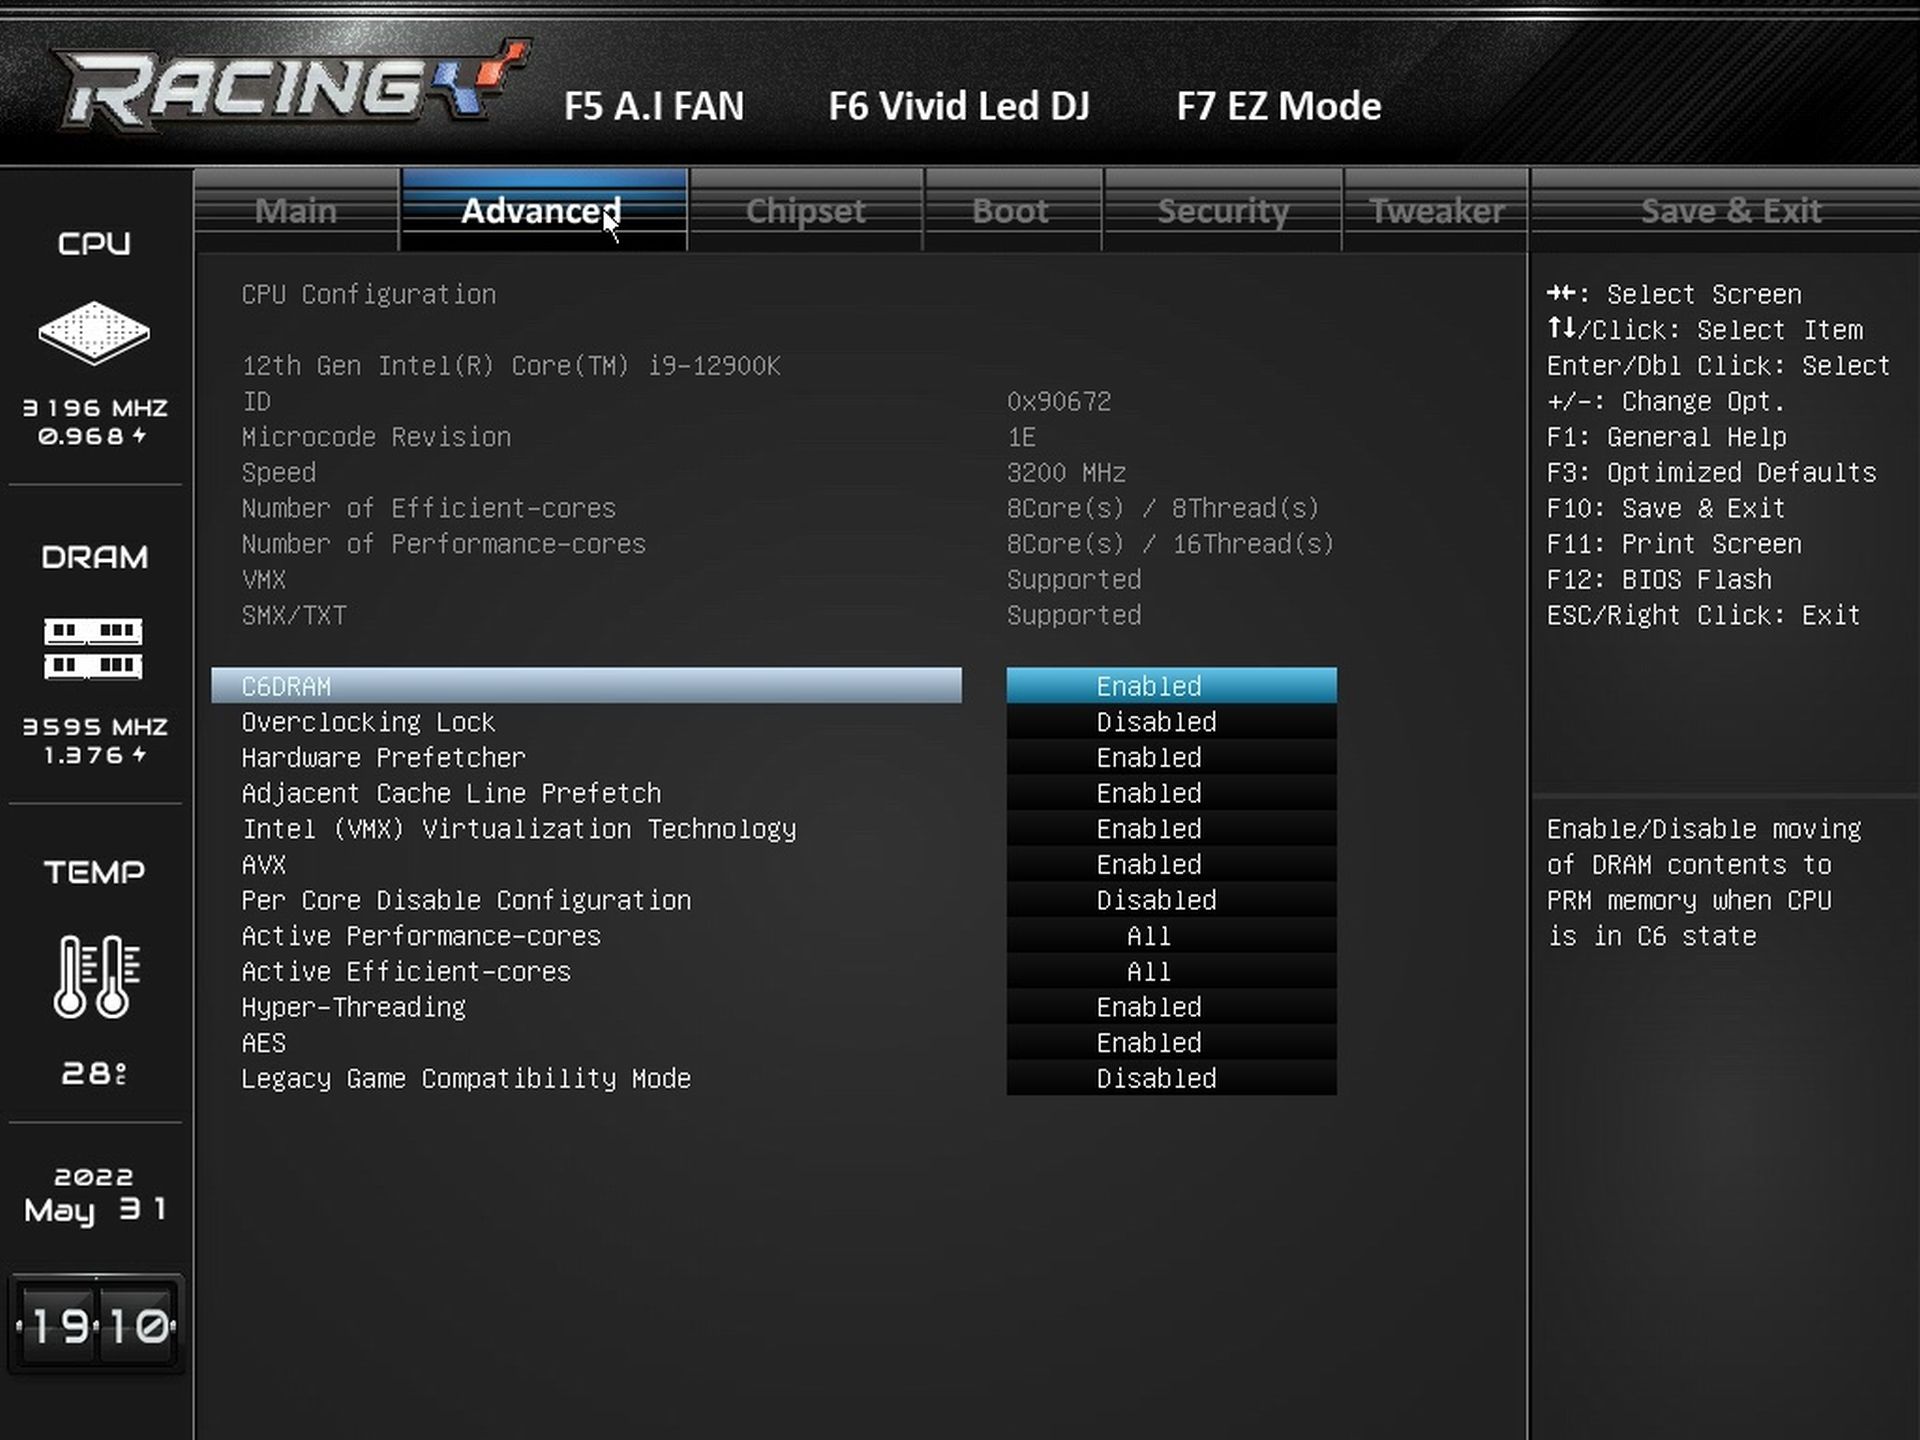
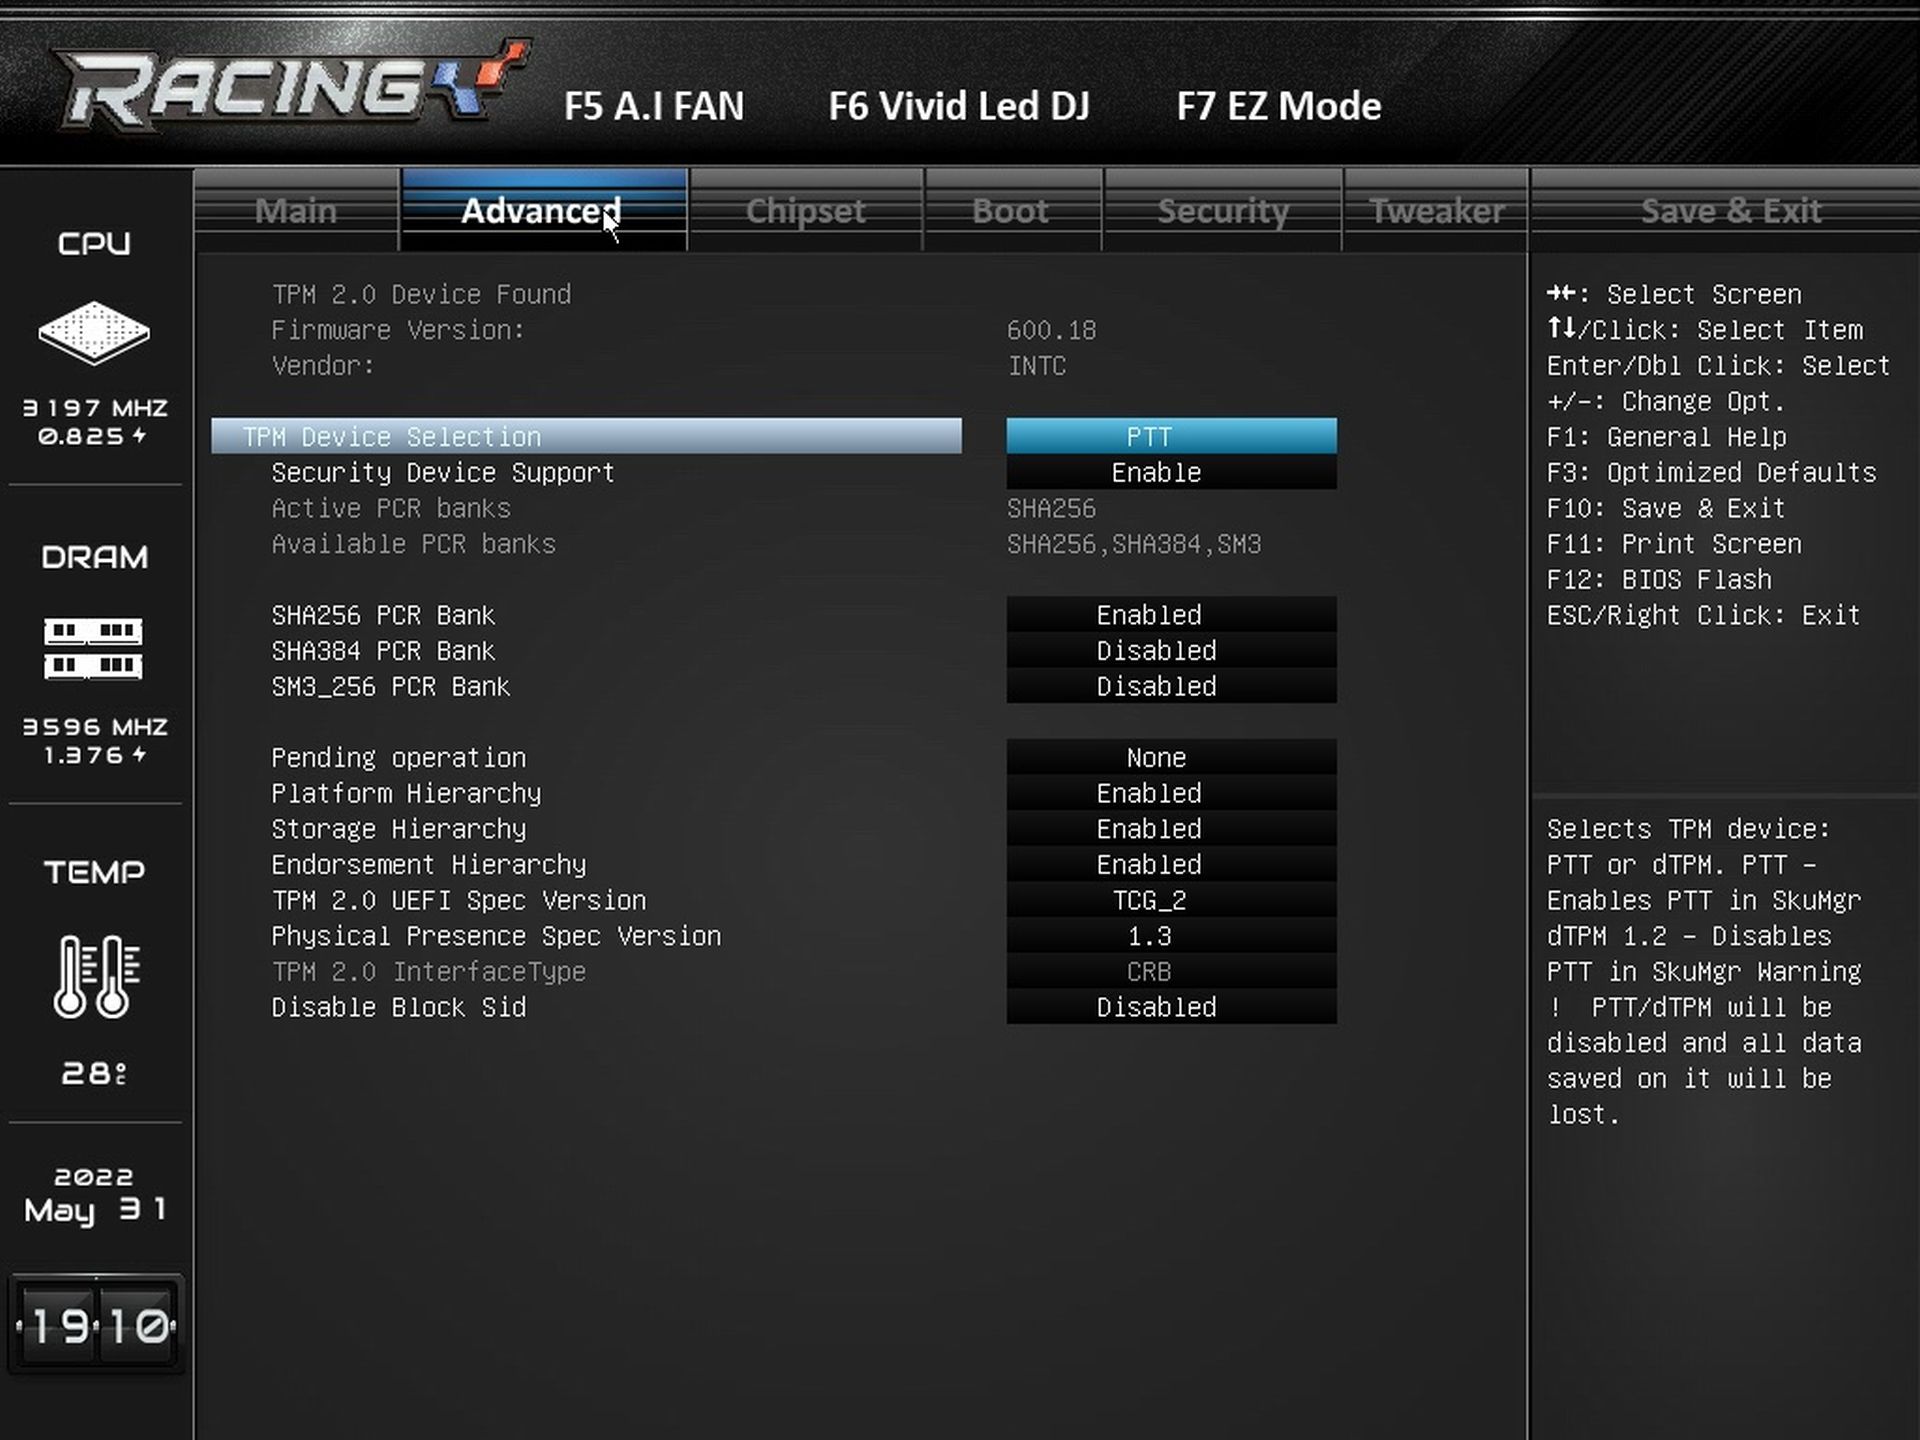
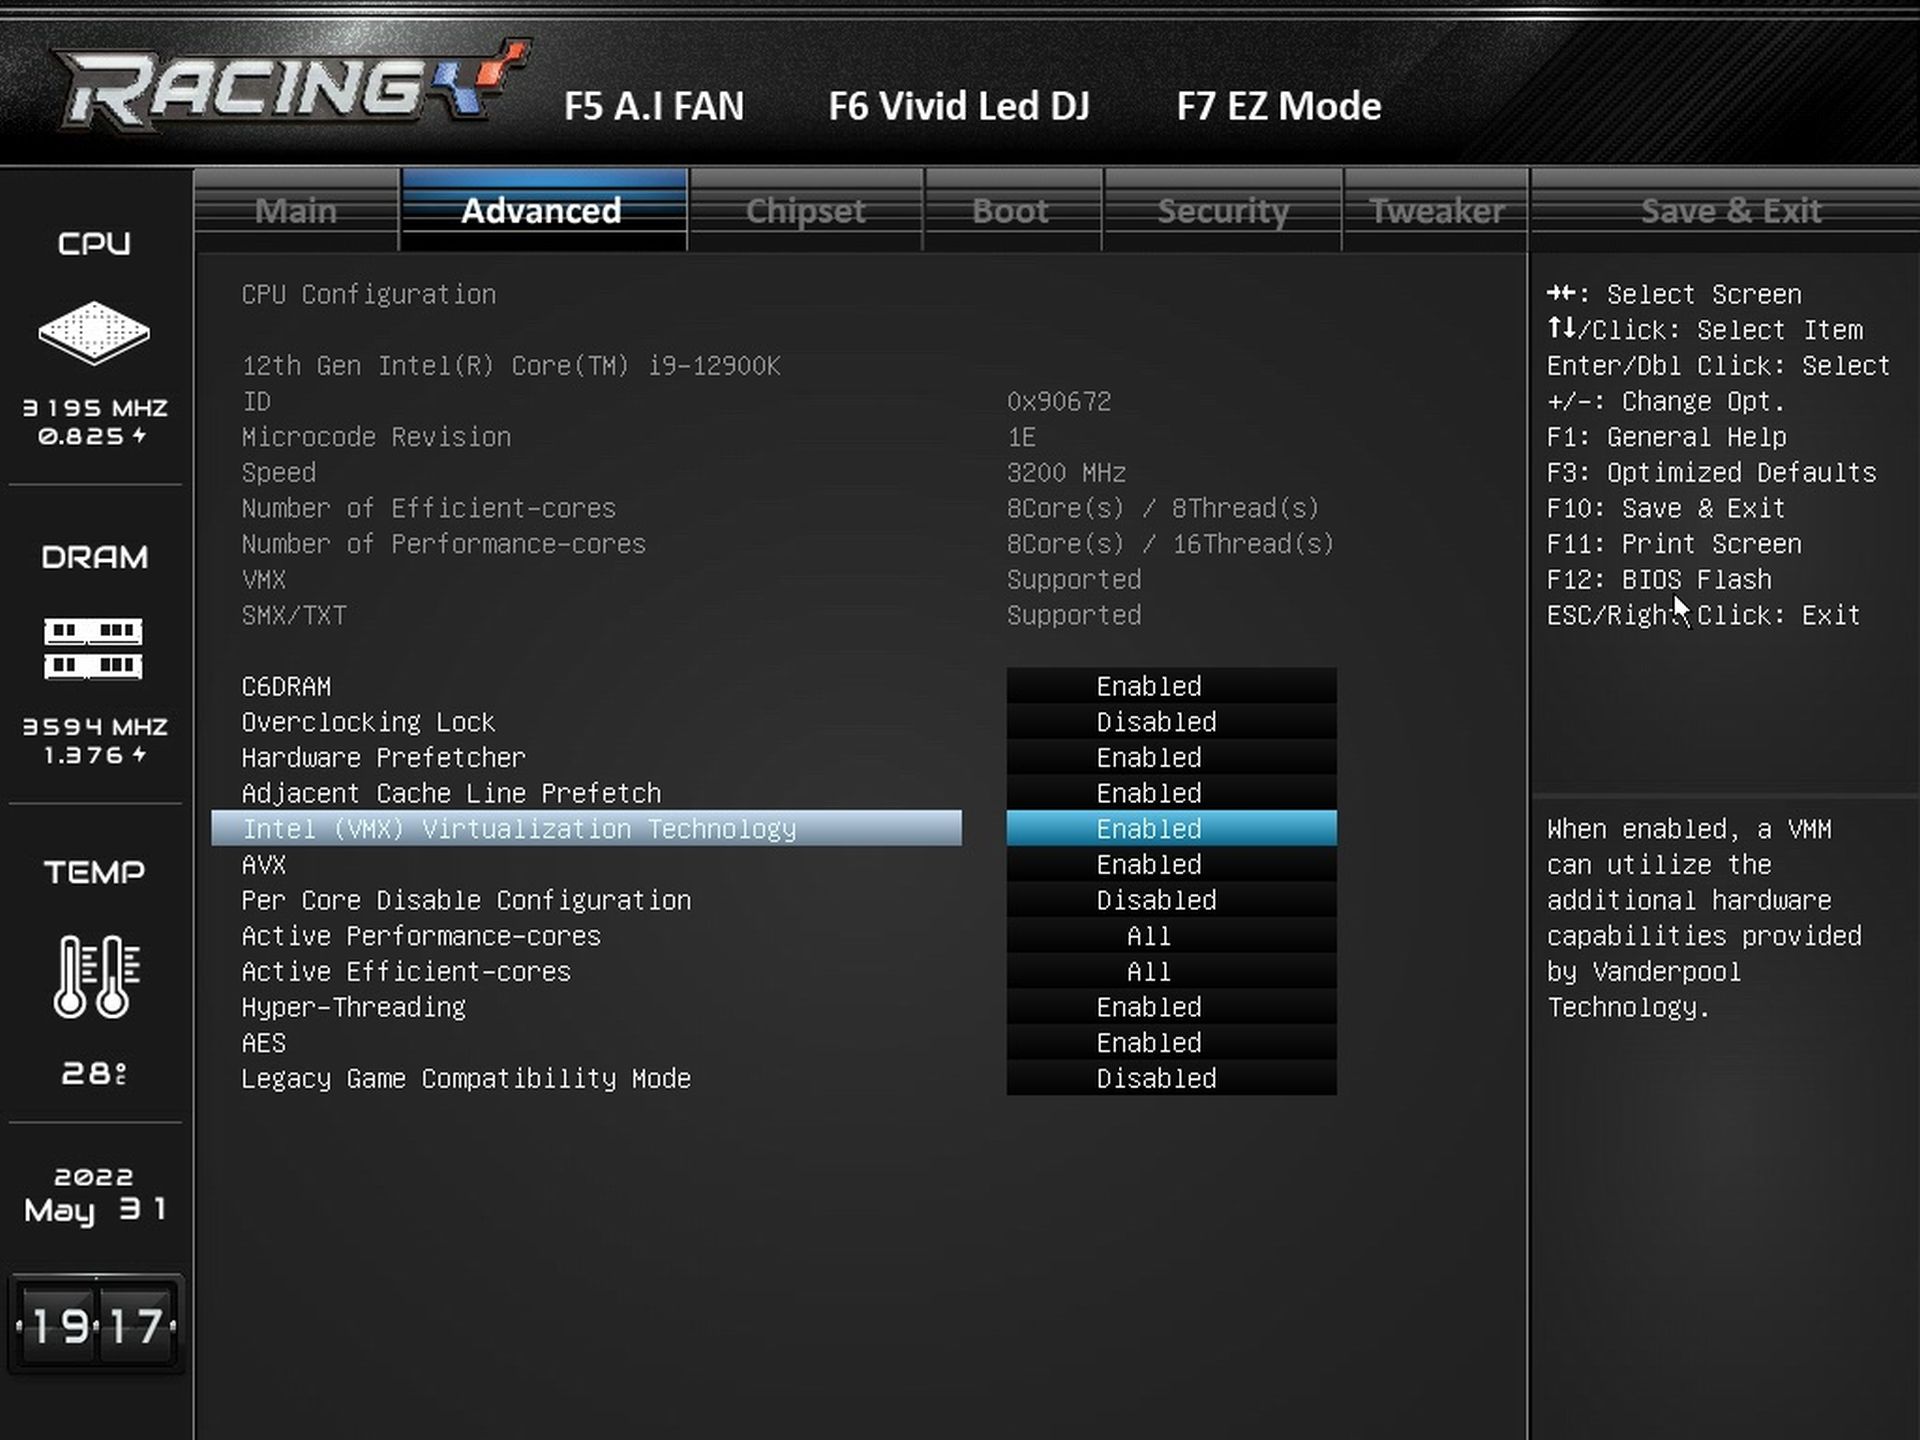
In addition to the possible disabling of arbitrary P/E CPU cores, you can disable virtualization, AVX instructions, AES encryption, Hyper-Threading, and similar basic things in case you need to. The TPM 2.0 settings also go into the greatest detail.
Temperature management allows you to set the temperature ranges that the board should hold the processor at and regulate the power supply accordingly. You can also set the maximum CPU temperature at which the board will shut down. Among the temperature sensors, the PCH (south bridge of the chipset) is missing, but again you have control over the temperature of the voltage regulators via the “MOS temperature”.
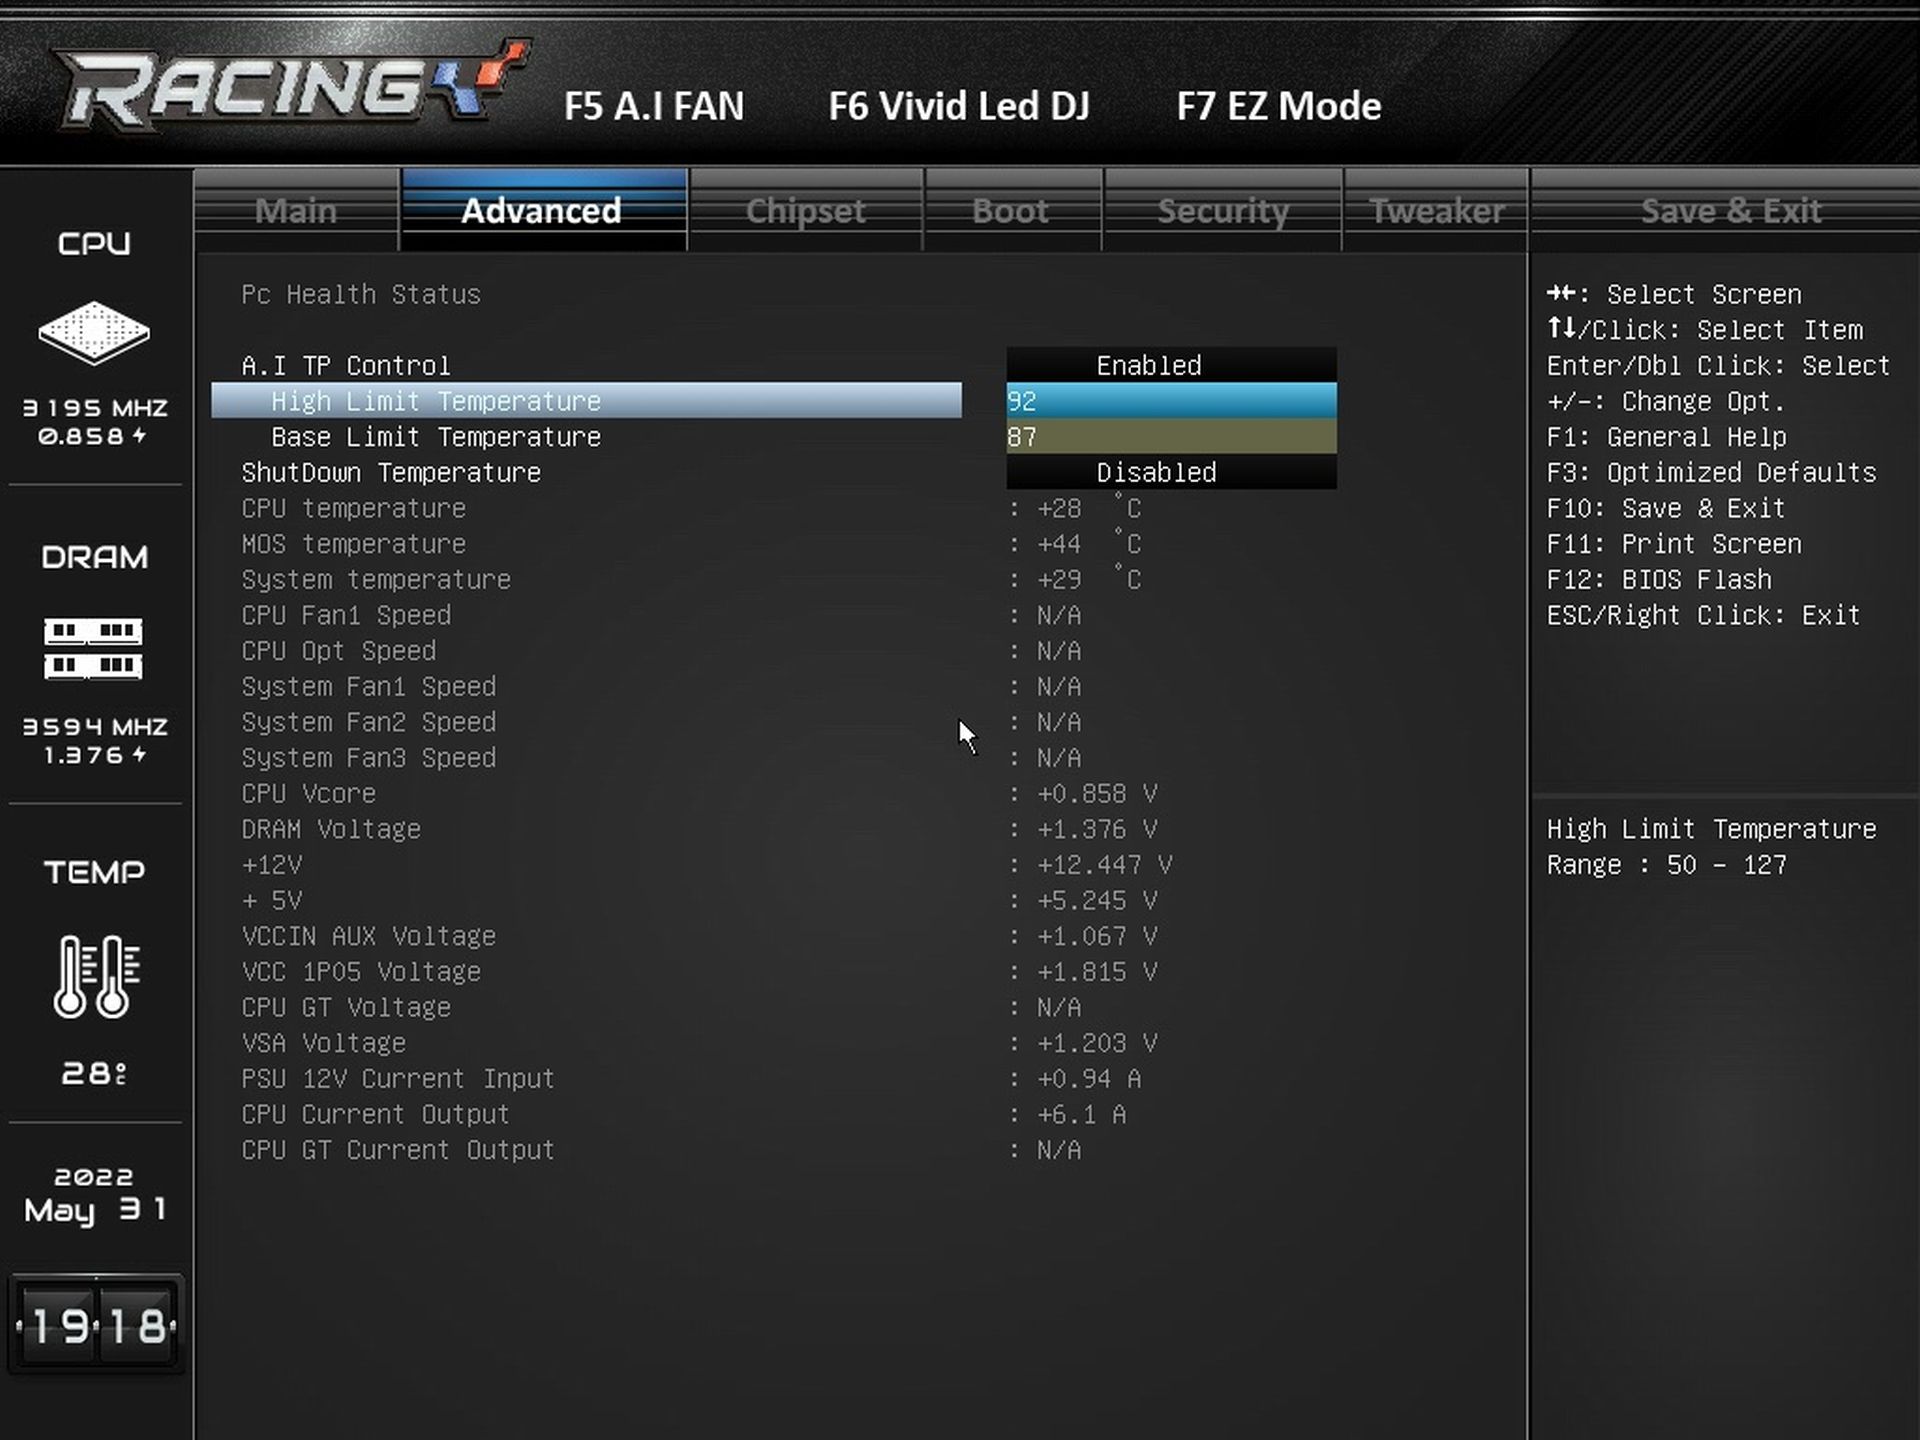
Power limits are set in the Tweaker tab, CPU Power Management section. By default both PL1 and PL2 are set to “Disabled”, then the CPU goes to full power regardless of the time. But for performance tests in mode without power limits, we still manually set them an maximum 4000 W. More often you will enter lower values, typically 125 W or 65 W. These values are always entered in milliwatts, so you would enter 125 W numerically as 125000. The Tau settings don’t allow you to specify a timeout, but the board accounts for it, and the power draw and clock speeds are according to PL2 the first 40 seconds or so.

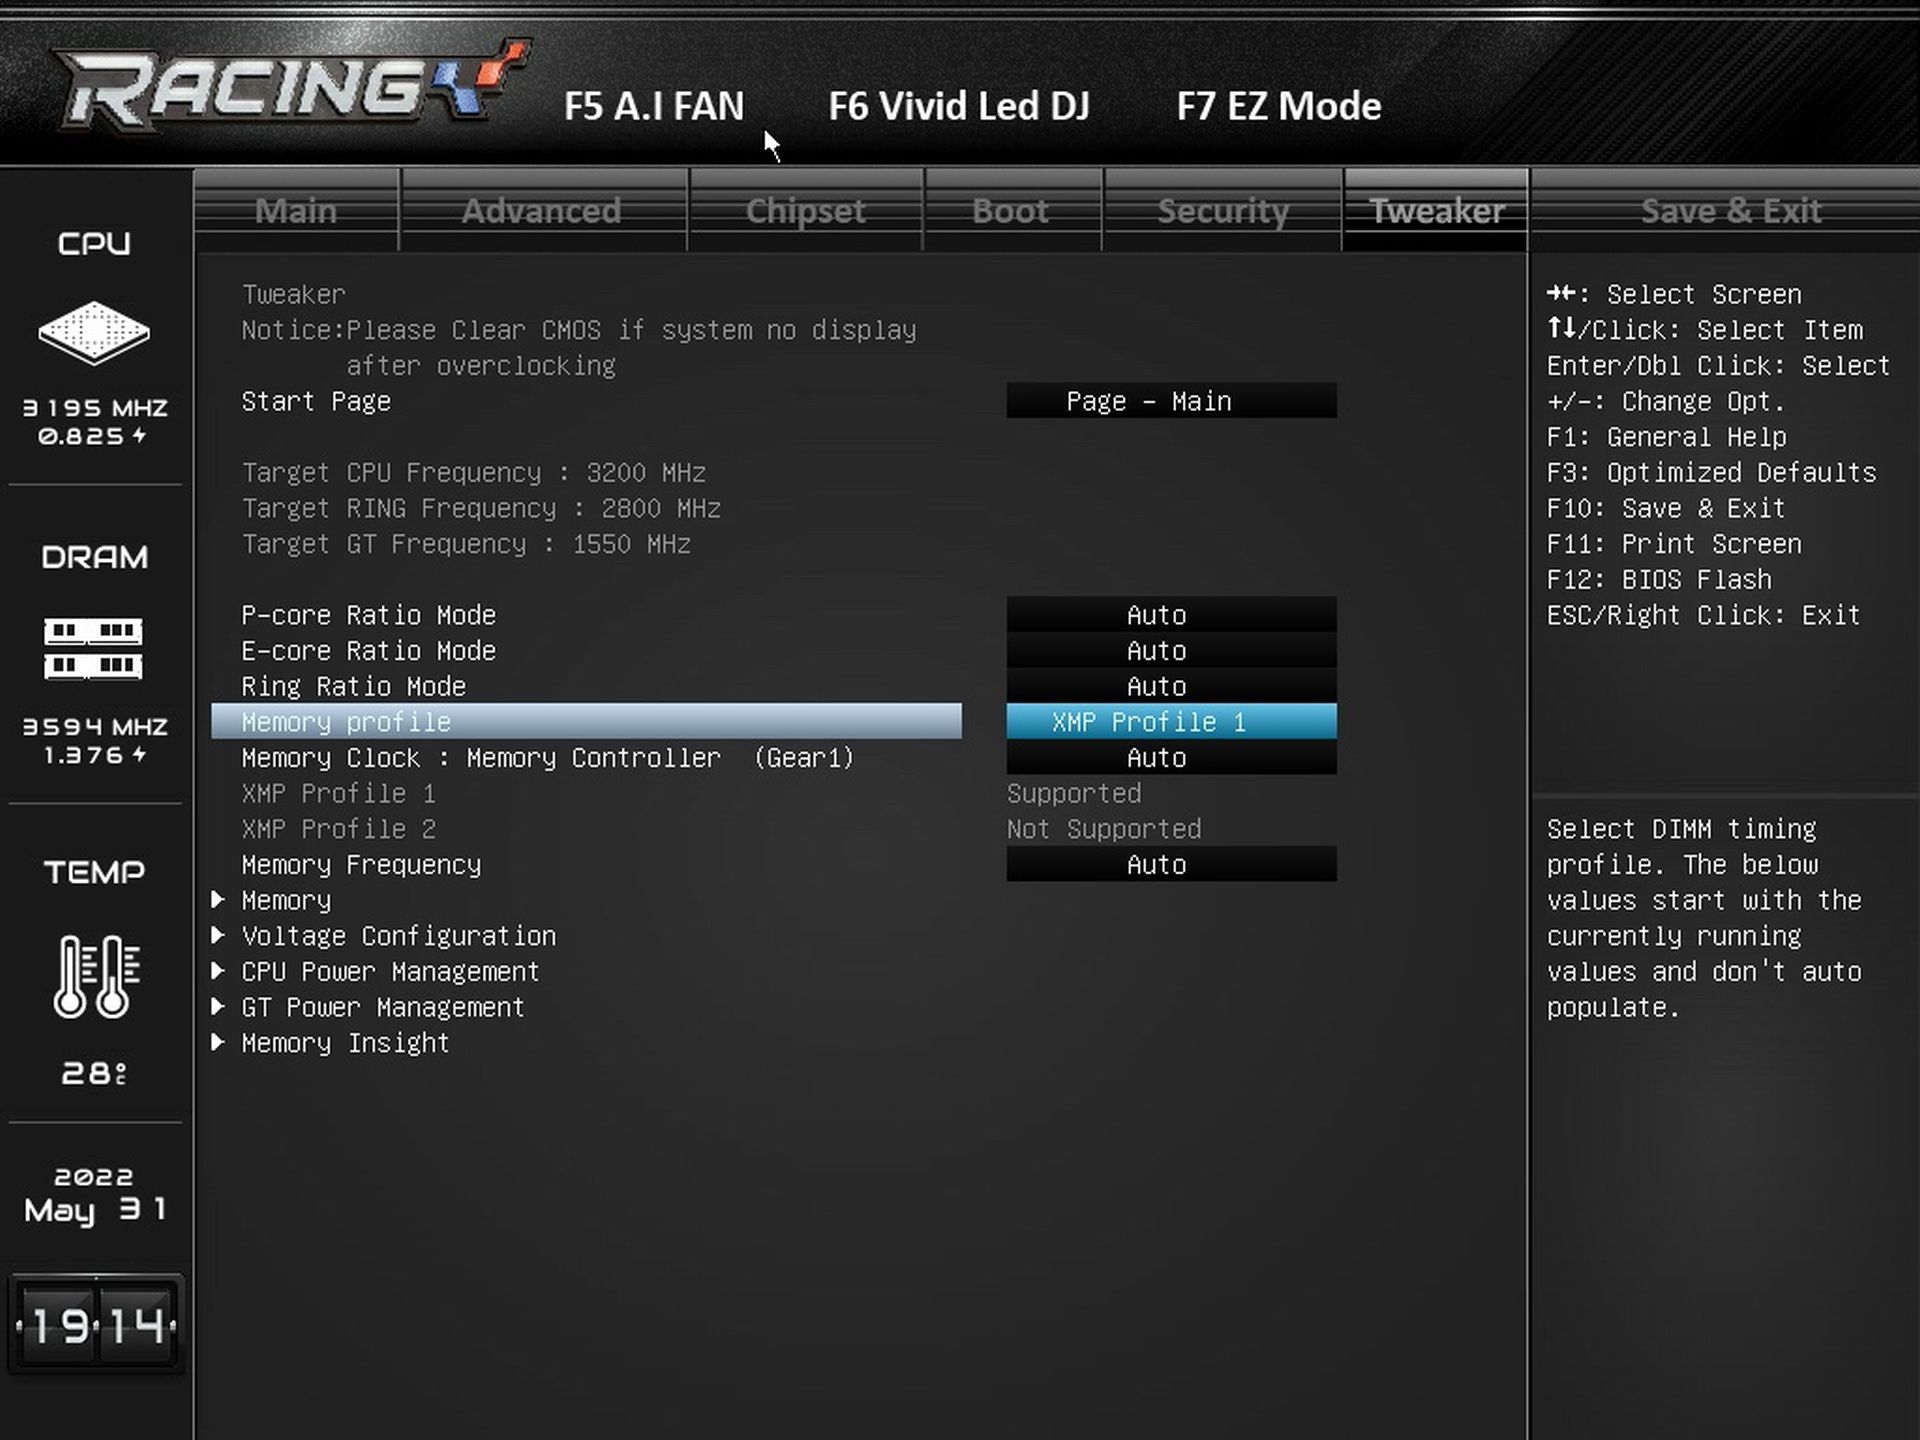
If you haven’t already done so in EZ Mode, the XMP setting is also possible in the Tweaker tab. This, of course, at a more detailed level where you can also adjust the memory controller clock speed or timing in the case of an optional setting.
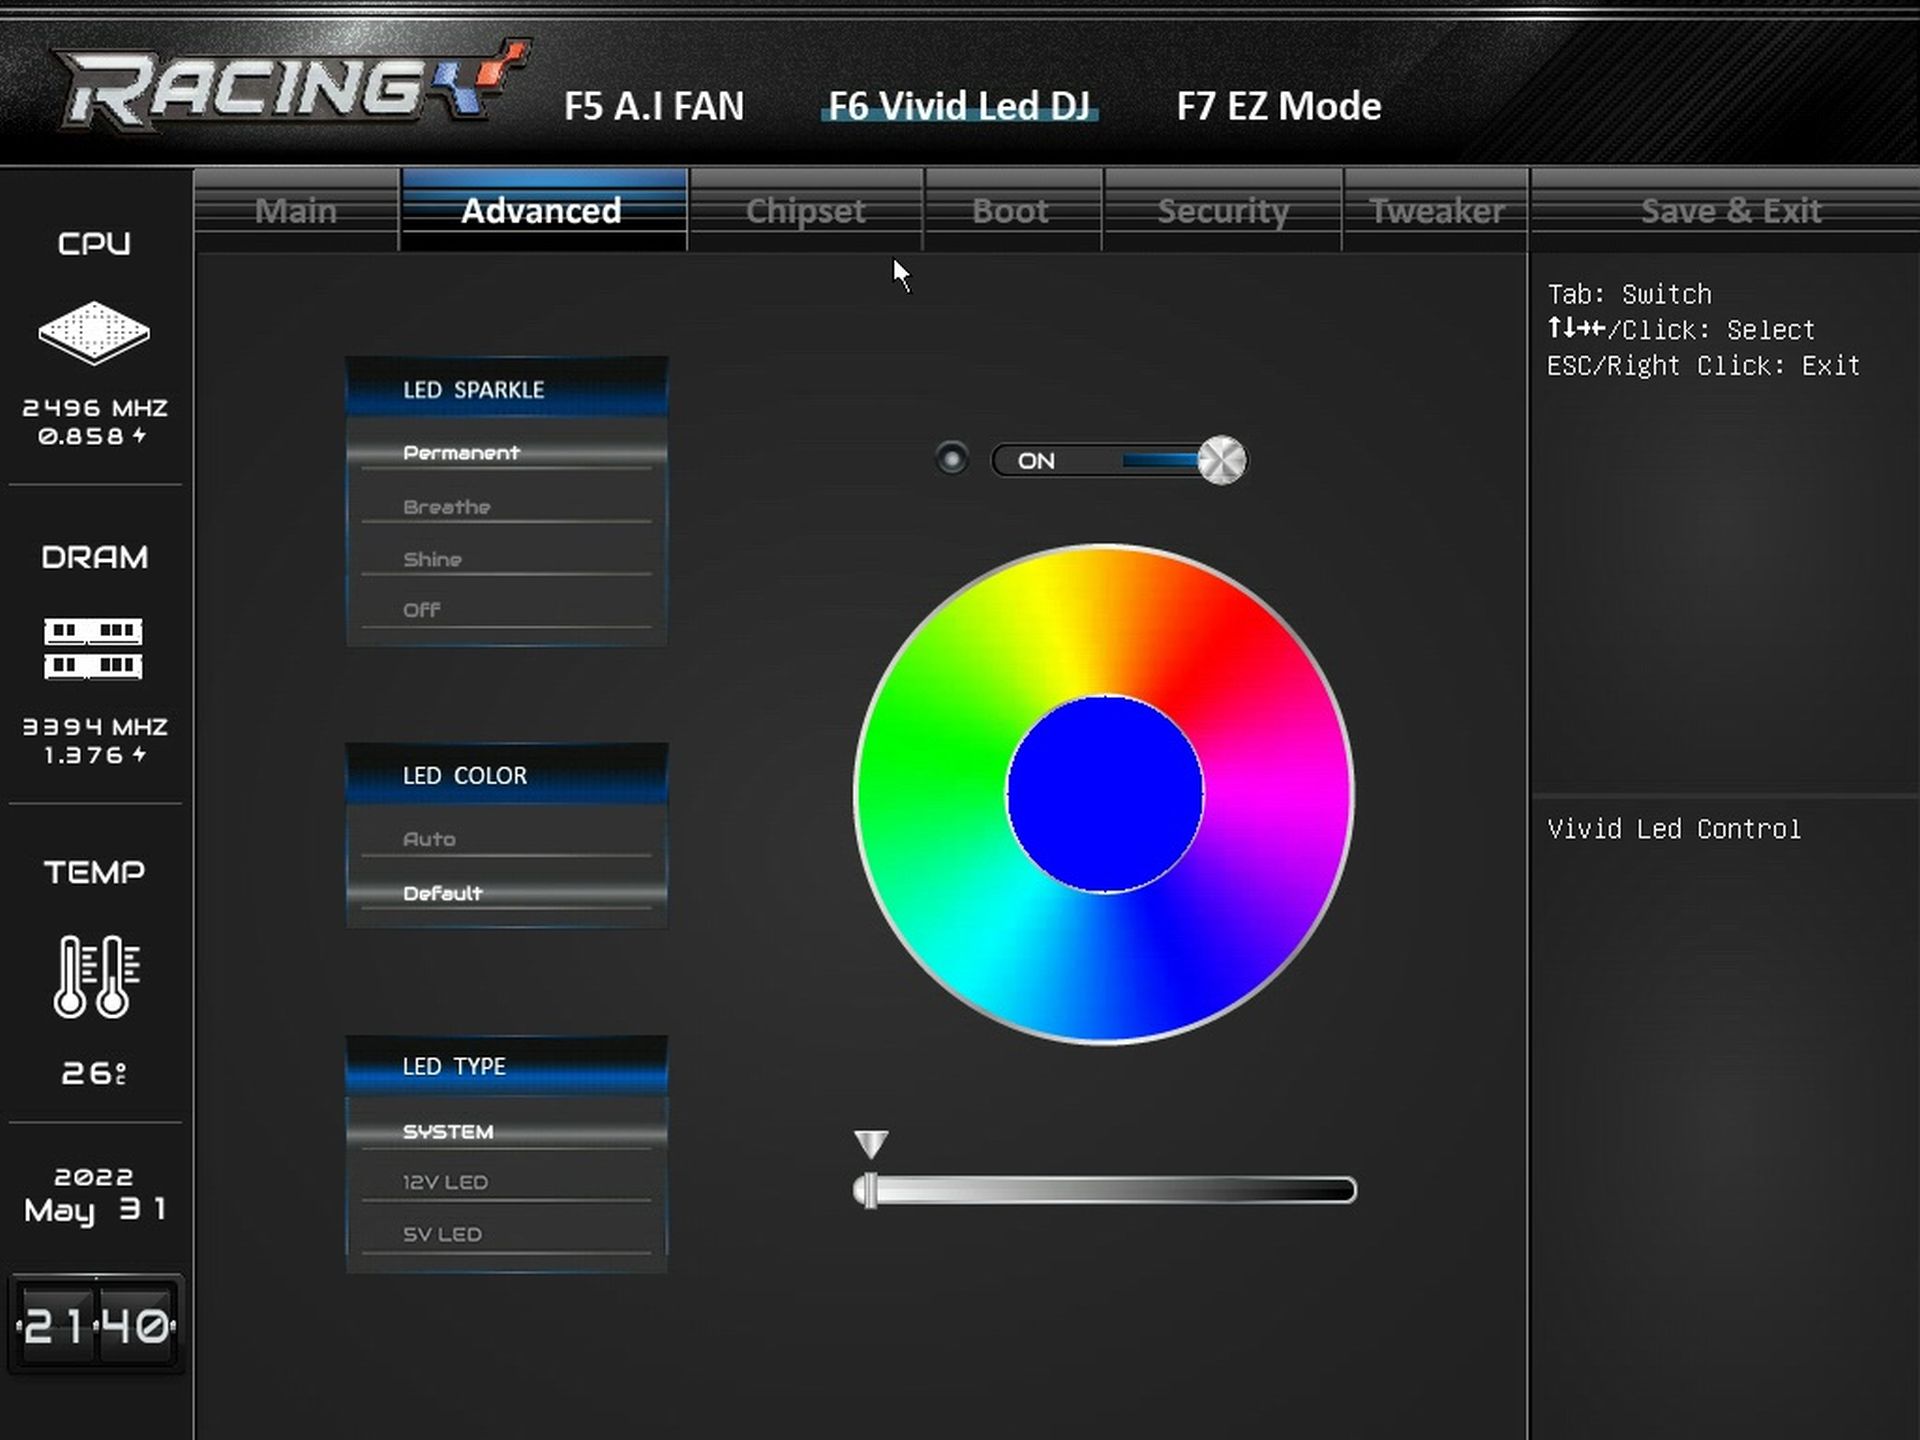
“Vivid LED DJ” is an RGB LED lighting management interface. Either built-in or expansion peripherals (typically coolers or fans) via internal connectors. Older devices with analogue connections via 12 V 4-pin can also be synchronised with modern (5 V 3-pin) devices. If you prefer an operating system interface for these things, you can download the Racing GT app on Biostar’s website.
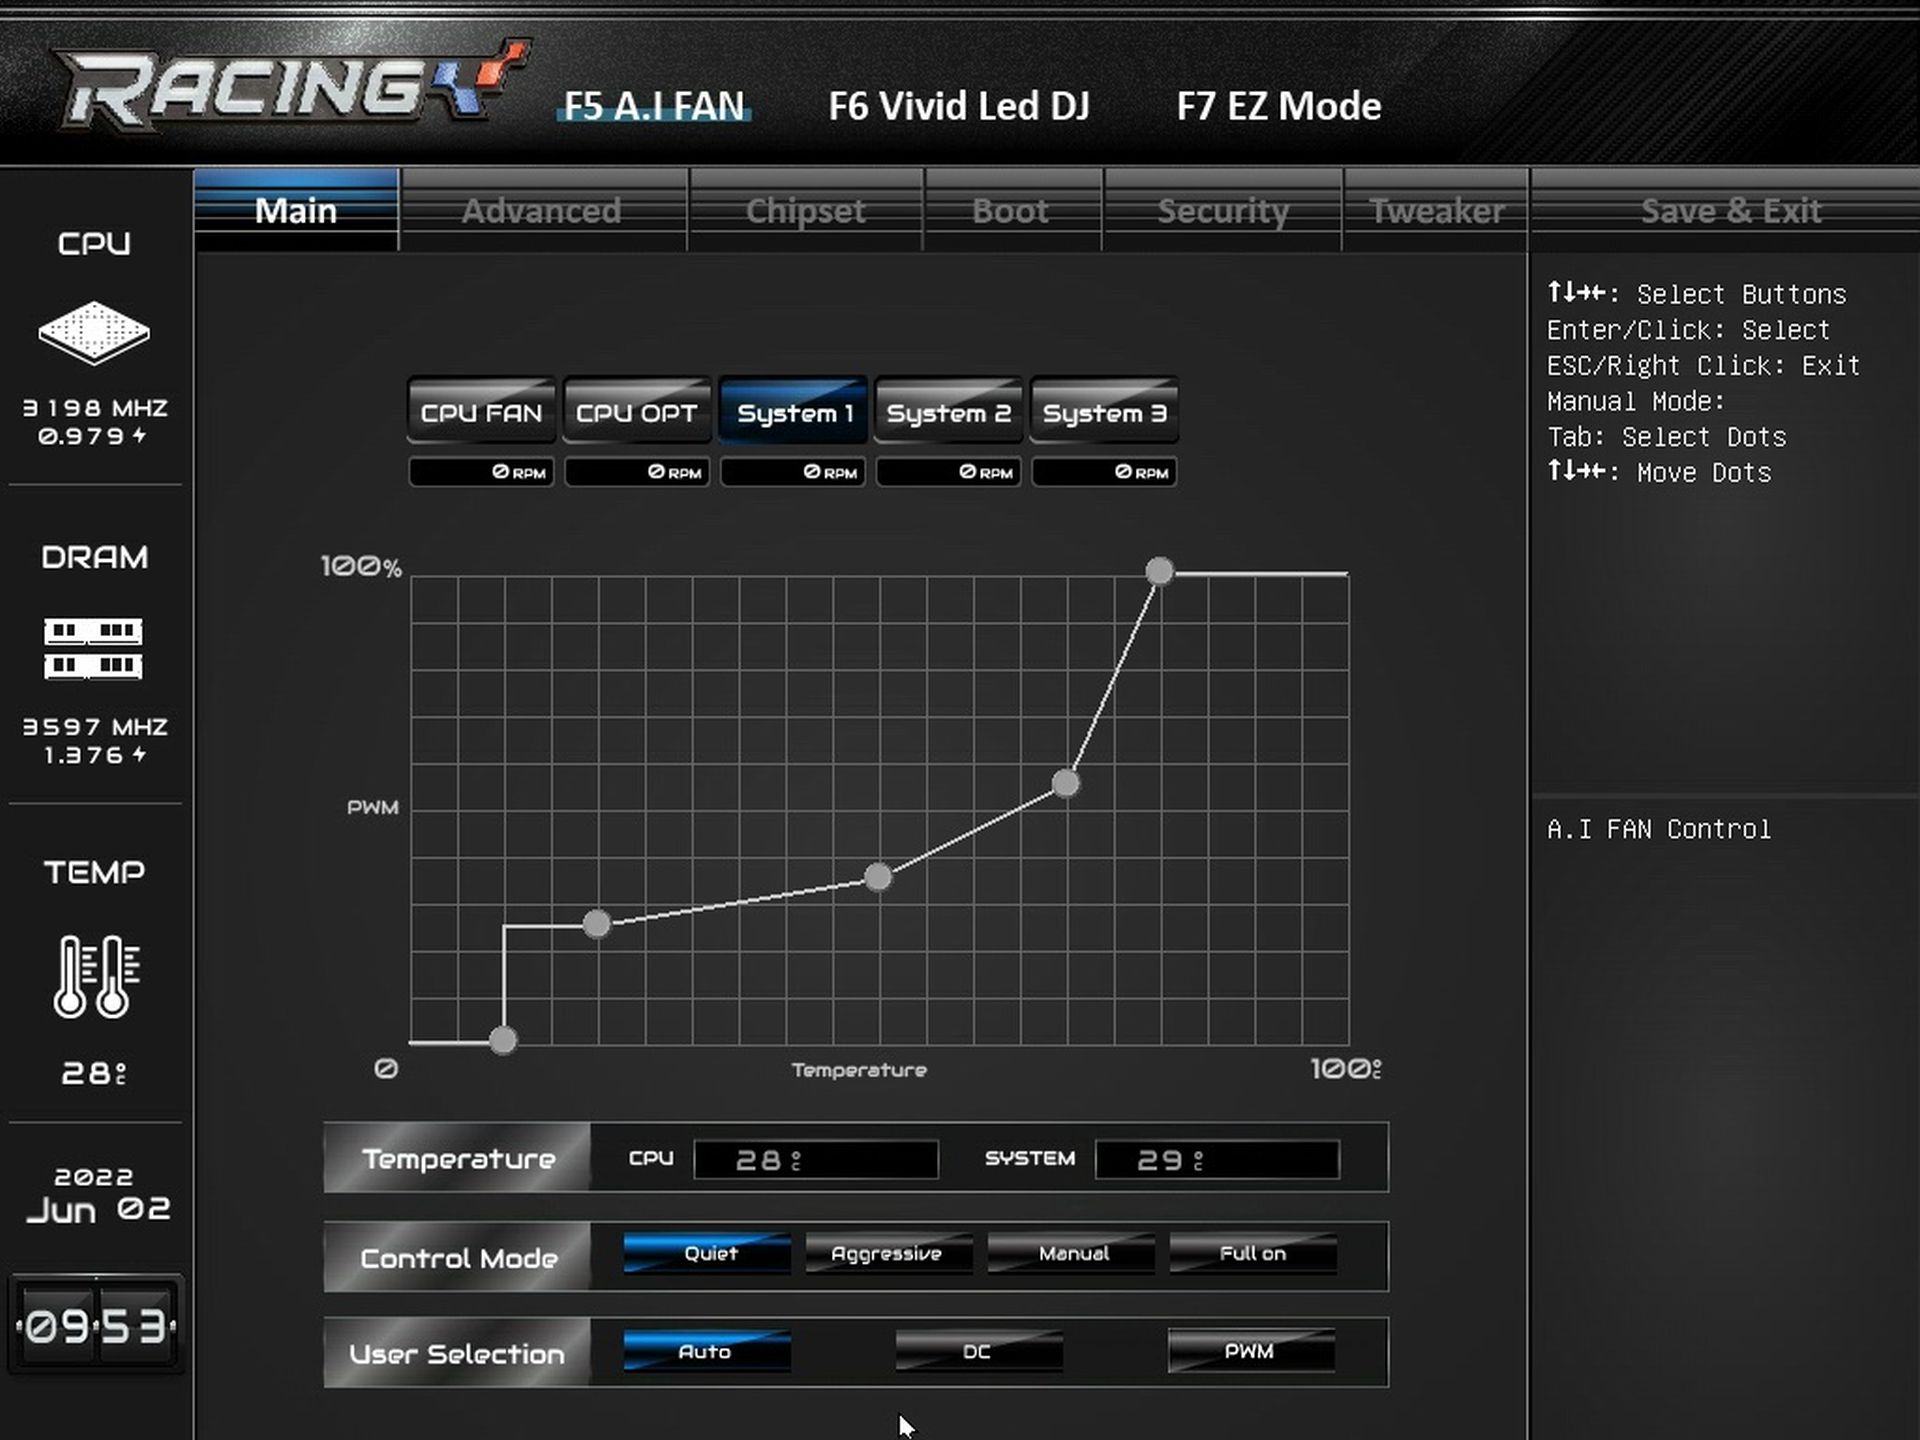
The settings options fall a little short in fan management. It’s a shame that the PWM curve can’t be matched to temperatures of sources other than the CPU sensor. Especially when the board can read the VRM temperatures. Otherwise, you have a choice of three preset PWM profiles (Quiet, Aggressive, Full on) and there is also a manual setting option. The control method is supposed to be detected automatically, but we always recommend setting this type of control manually in the case of PWM fans.

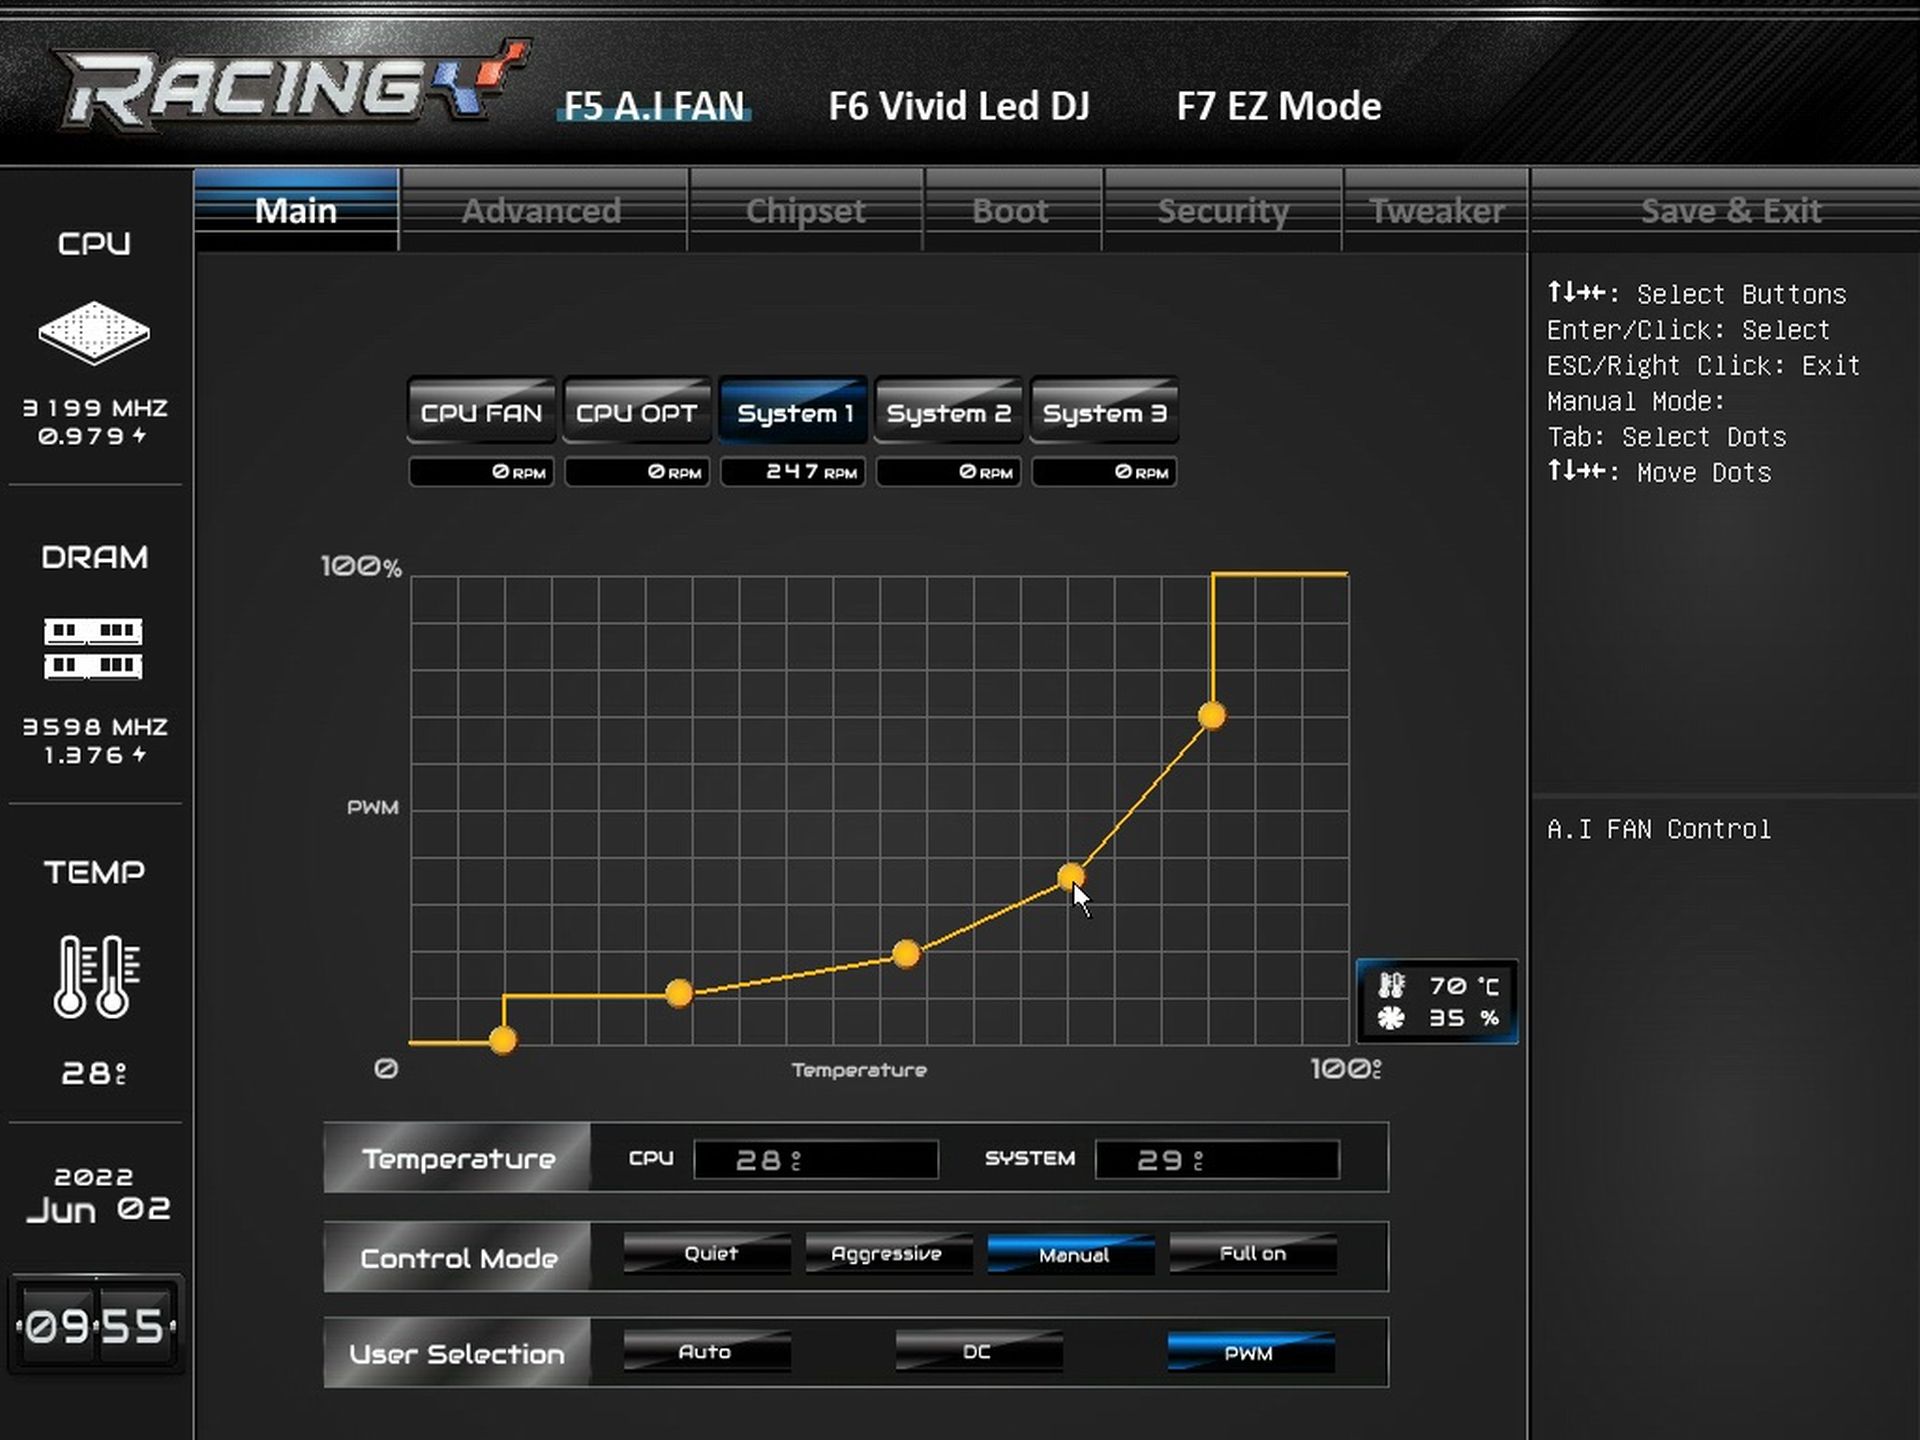
+
In fact, the detection of the board is rather unreliable. As you can see in the first two images from A.I Fan, the same fan (Noctua NF-A12x25 PWM) did not spin up at all on “Auto” and had to be manually switched to “PWM”. At that point, the fan was easily tuned to its minimum speed as well.
Most motherboards from the same classes look pretty much the same. While they differ in color scheme and heatsink shape, the layout, features, and overall operation (including power management) are like a carbon copy. The Biostar B660GTA goes upstream in many ways and presents an attractive option for those users who always find something lacking on boards in this price range.
Gaming tests…
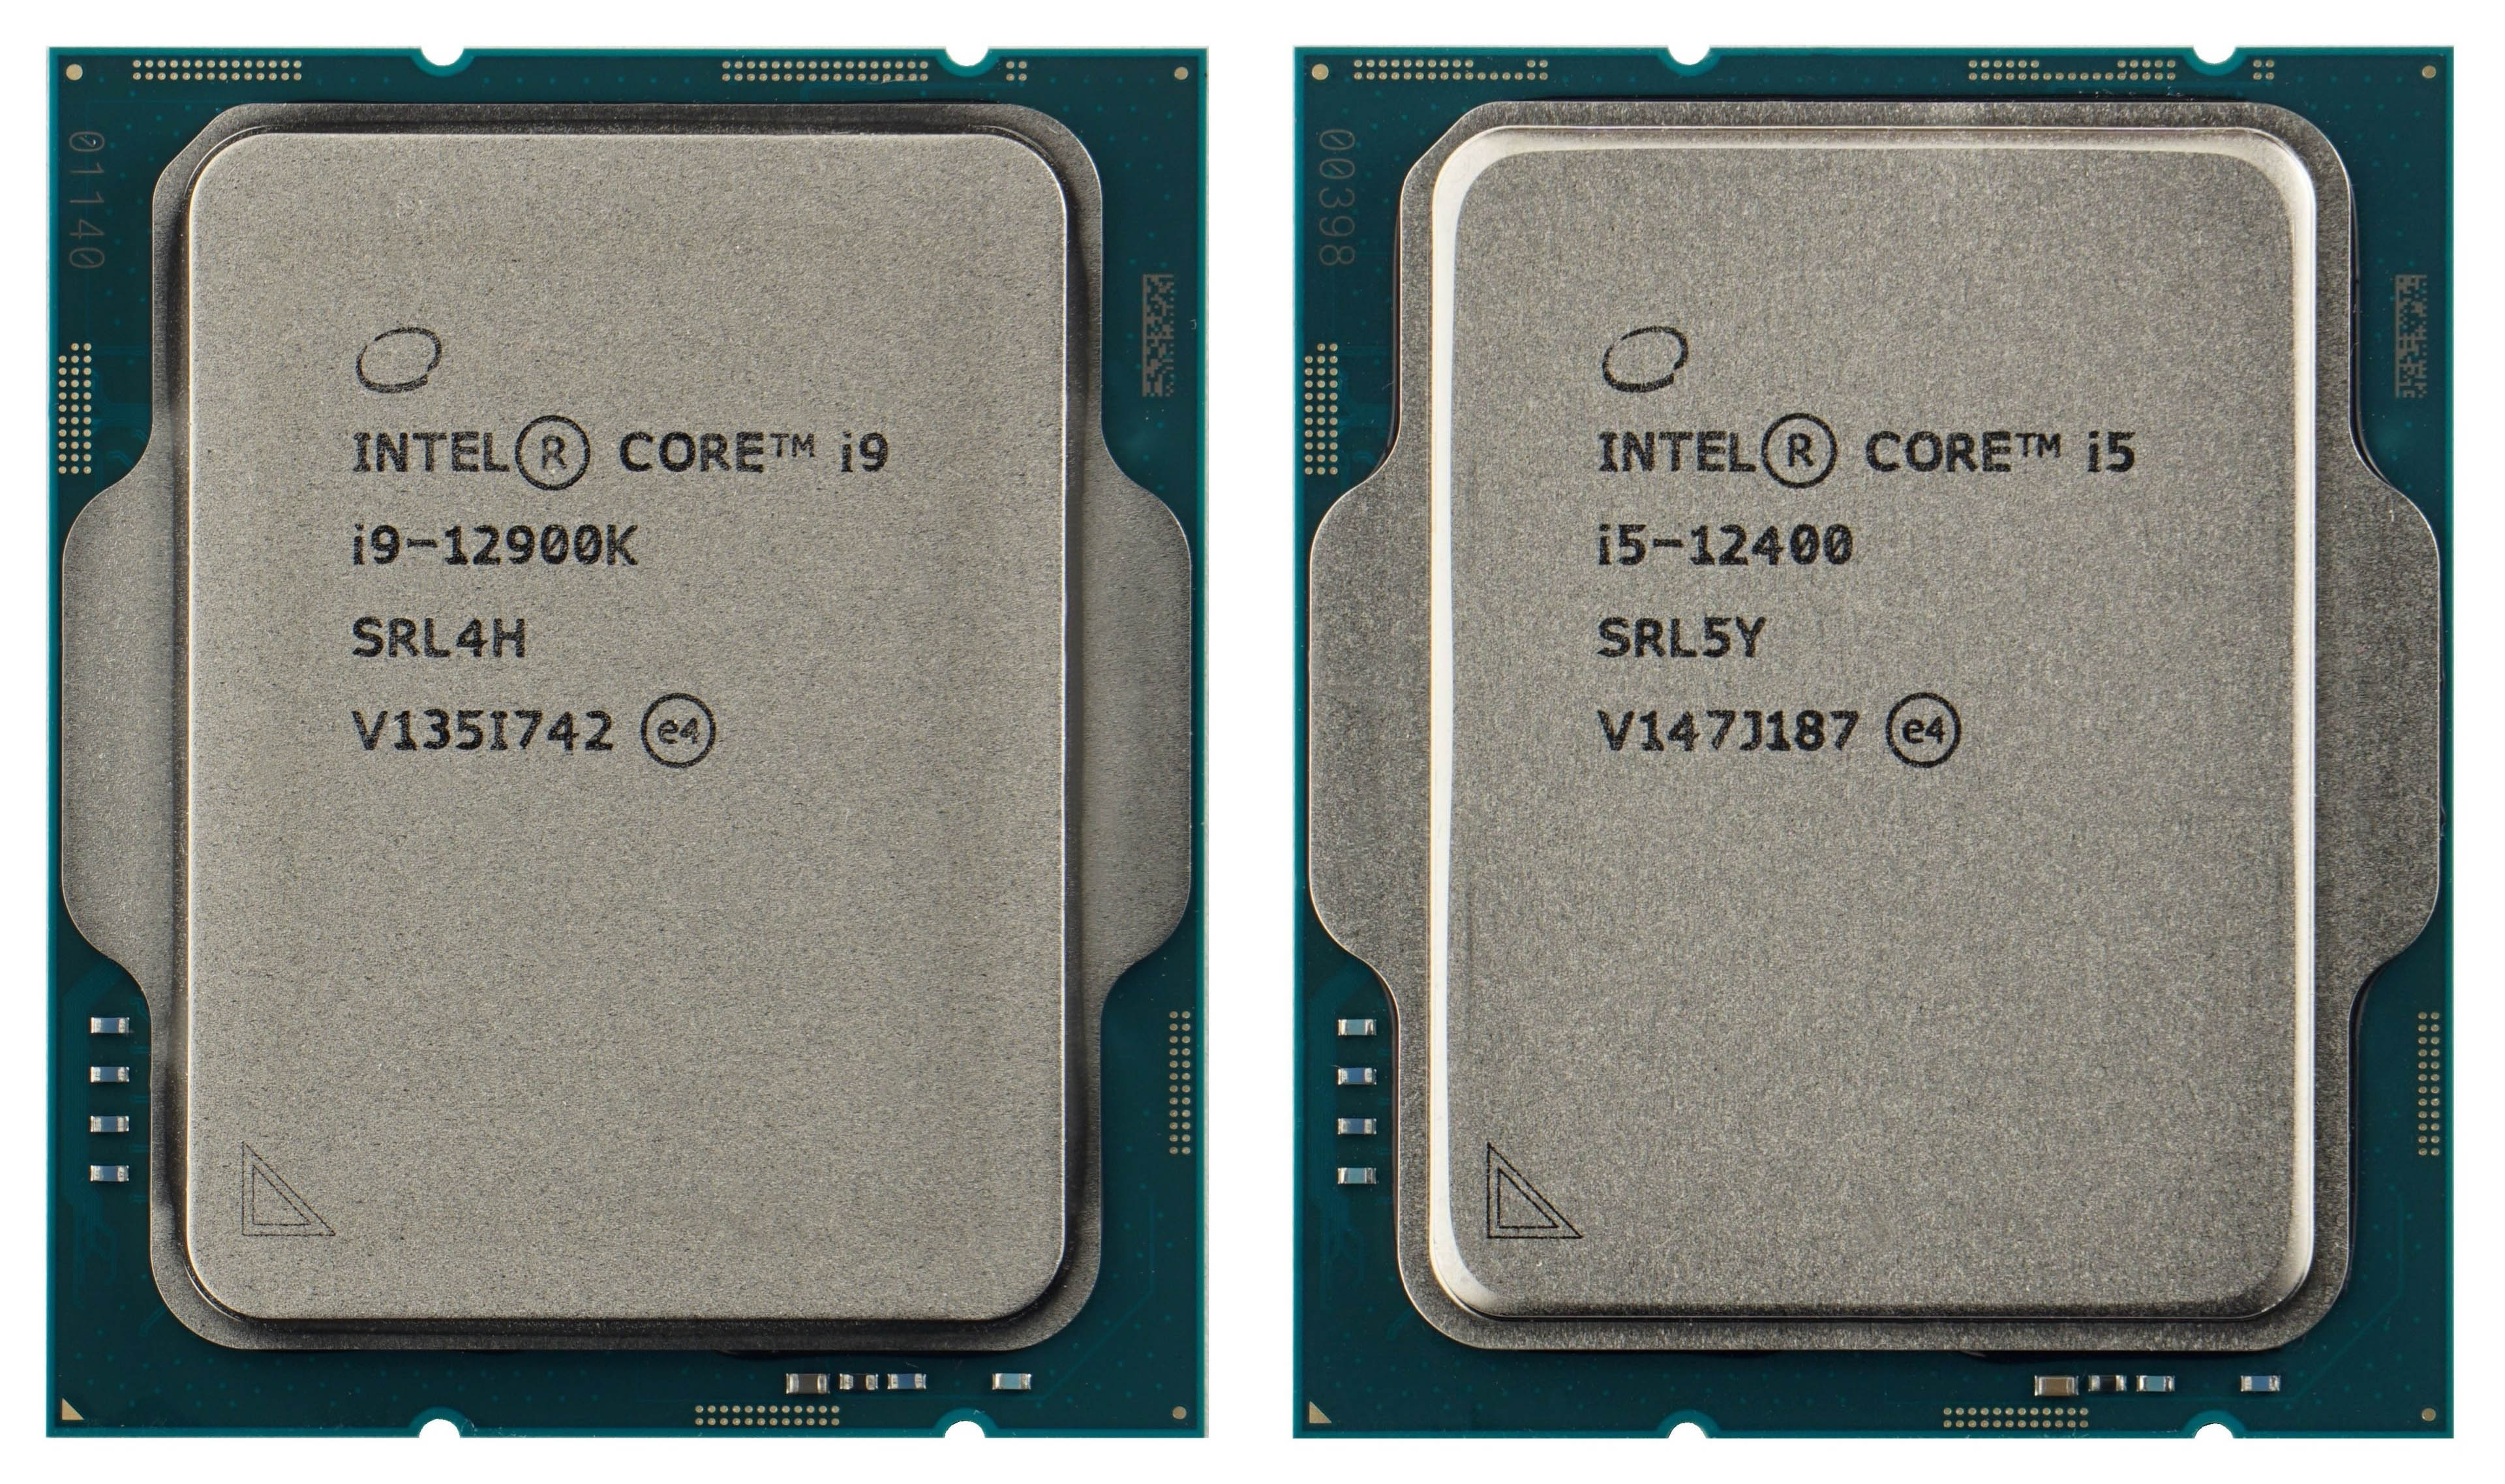
The vast majority of tests is based on the methodology for processors and graphics cards. The choice of games is slimmer for motherboards, but that’s in order to be able to run all the tests with two different processors as promised. Each board will always be tested with a more powerful processor from the top end, but also with a weaker, average one. The more powerful variant on the LGA 1700 platform is the Core i9-12900K and the mid-range one is the Core i5-12400.
Based on tests with processors from different classes, you’ll be able to easily decide whether a more expensive motherboard for a cheaper processor makes sense for you or, conversely, how good of an idea it is to skimp on a cheaper motherboard while using a more expensive and more powerful processor, which naturally also has higher power draw and places higher demands on the overall quality of the motherboard.
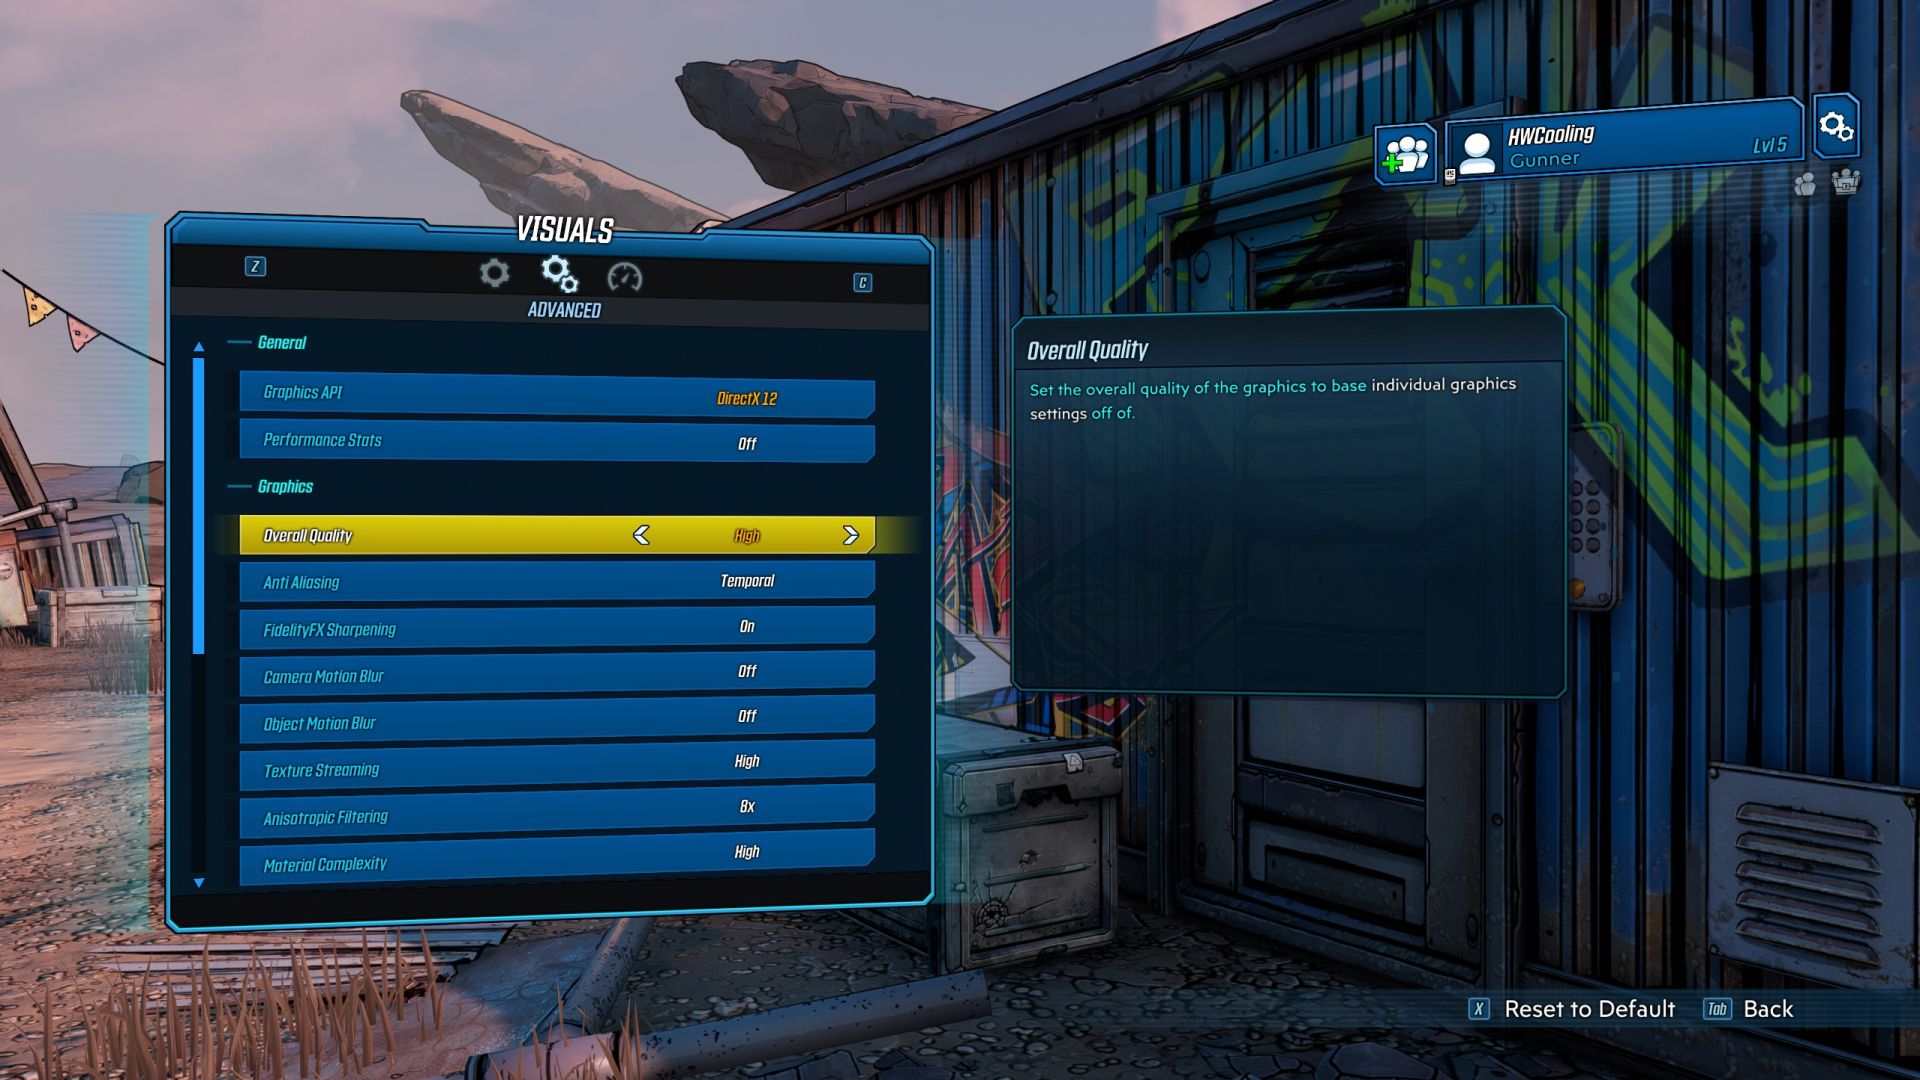
We’ve selected five titles from the games and we’re testing them in two resolutions. There are significantly fewer games than in the CPU or graphics card tests, but there is just enough for the motherboard tests. Few people consider performance in a particular game when choosing a motherboard. But an indicative overview of how a motherboard shapes gaming performance (compared to other motherboards) is a must. To avoid significantly skewing the result over time, we reached for relatively older titles that no longer receive significant updates.

These are Borderlands 3, F1 2020, Metro Exodus, Shadow of the Tomb Raider and Total War Saga: Troy. For newer games, there might be some performance changes over time (with updates) and especially in high resolutions with high details. This is one of the test setups (2160p and Ultra, or the highest visual detail but without ray-tracing) that focuses on comparing performance, for which the bottleneck is the graphics card. In other words, it will be clear from these tests which motherboard and to what extent can impact the graphics card’s performance for some reason. In contrast, a setup with Full HD resolution and with graphical details reduced to “High” will also reflect the CPU’s influence on the final gaming performance.
We use OCAT to record fps, or the times of individual frames, which are then used to calculate fps, and FLAT to analyze the CSV. The developer and author of articles (and videos) for the GPUreport.cz website is behind both.
For the highest accuracy, all runs are repeated three times and average values of average and minimum fps are displayed in the graphs. These multiple repetitions also apply to non-game tests.
… Computing tests, SSD tests, USB ports and network tests
We test application performance in a very similar way to the processor tests. Almost all tests are included, from the easier ones (such as those in a web environment) to those that push the CPU or graphics card to the limit. These are typically tests such as 3D rendering, video encoding (x264, x265, SVT-AV1) or other performance-intensive computing tasks. As with processors or graphics cards, we have a wide range of applications – users editing video (Adobe Premiere Pro, DaVinci Resolve Studio), graphic effects creators (Adobe Premiere Pro), graphic designers or photographers (Adobe Photoshop and Lightroom, Affinity Photo, AI applications Topaz Labs, …) will find their own in the results, and there are also tests of (de)encryption, (de)compression, numerical calculations, simulations and, of course, tests of memory.

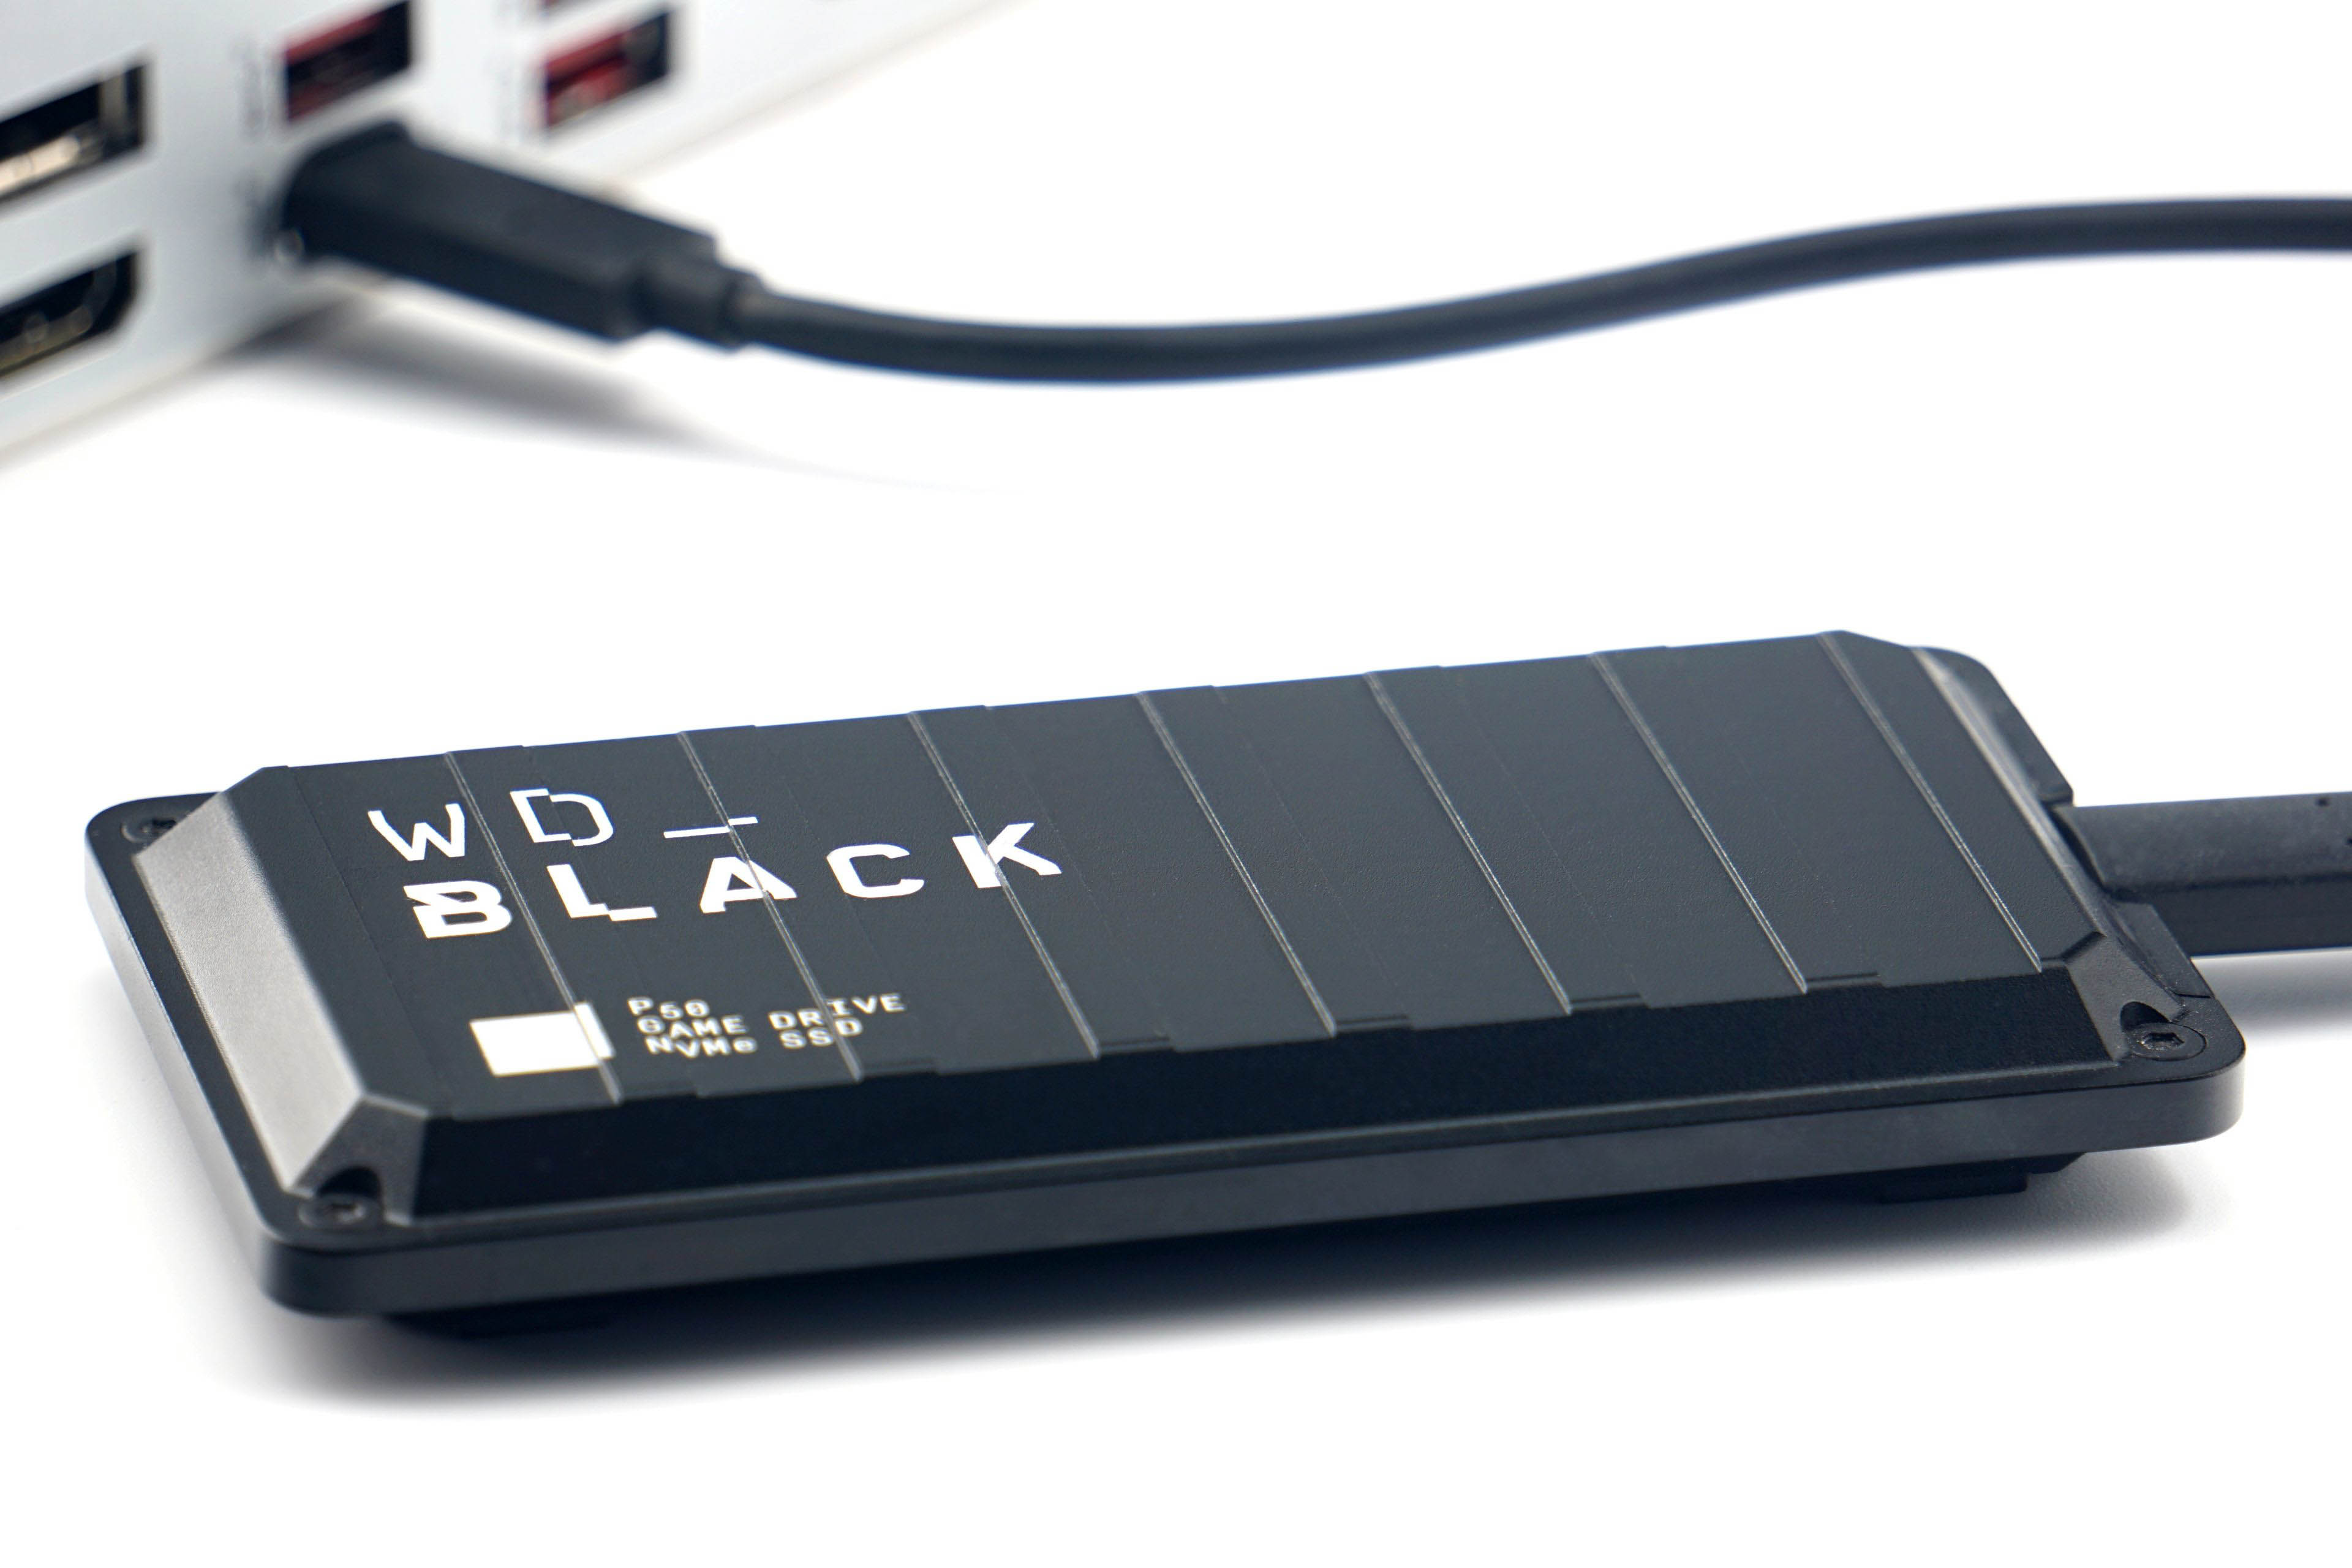
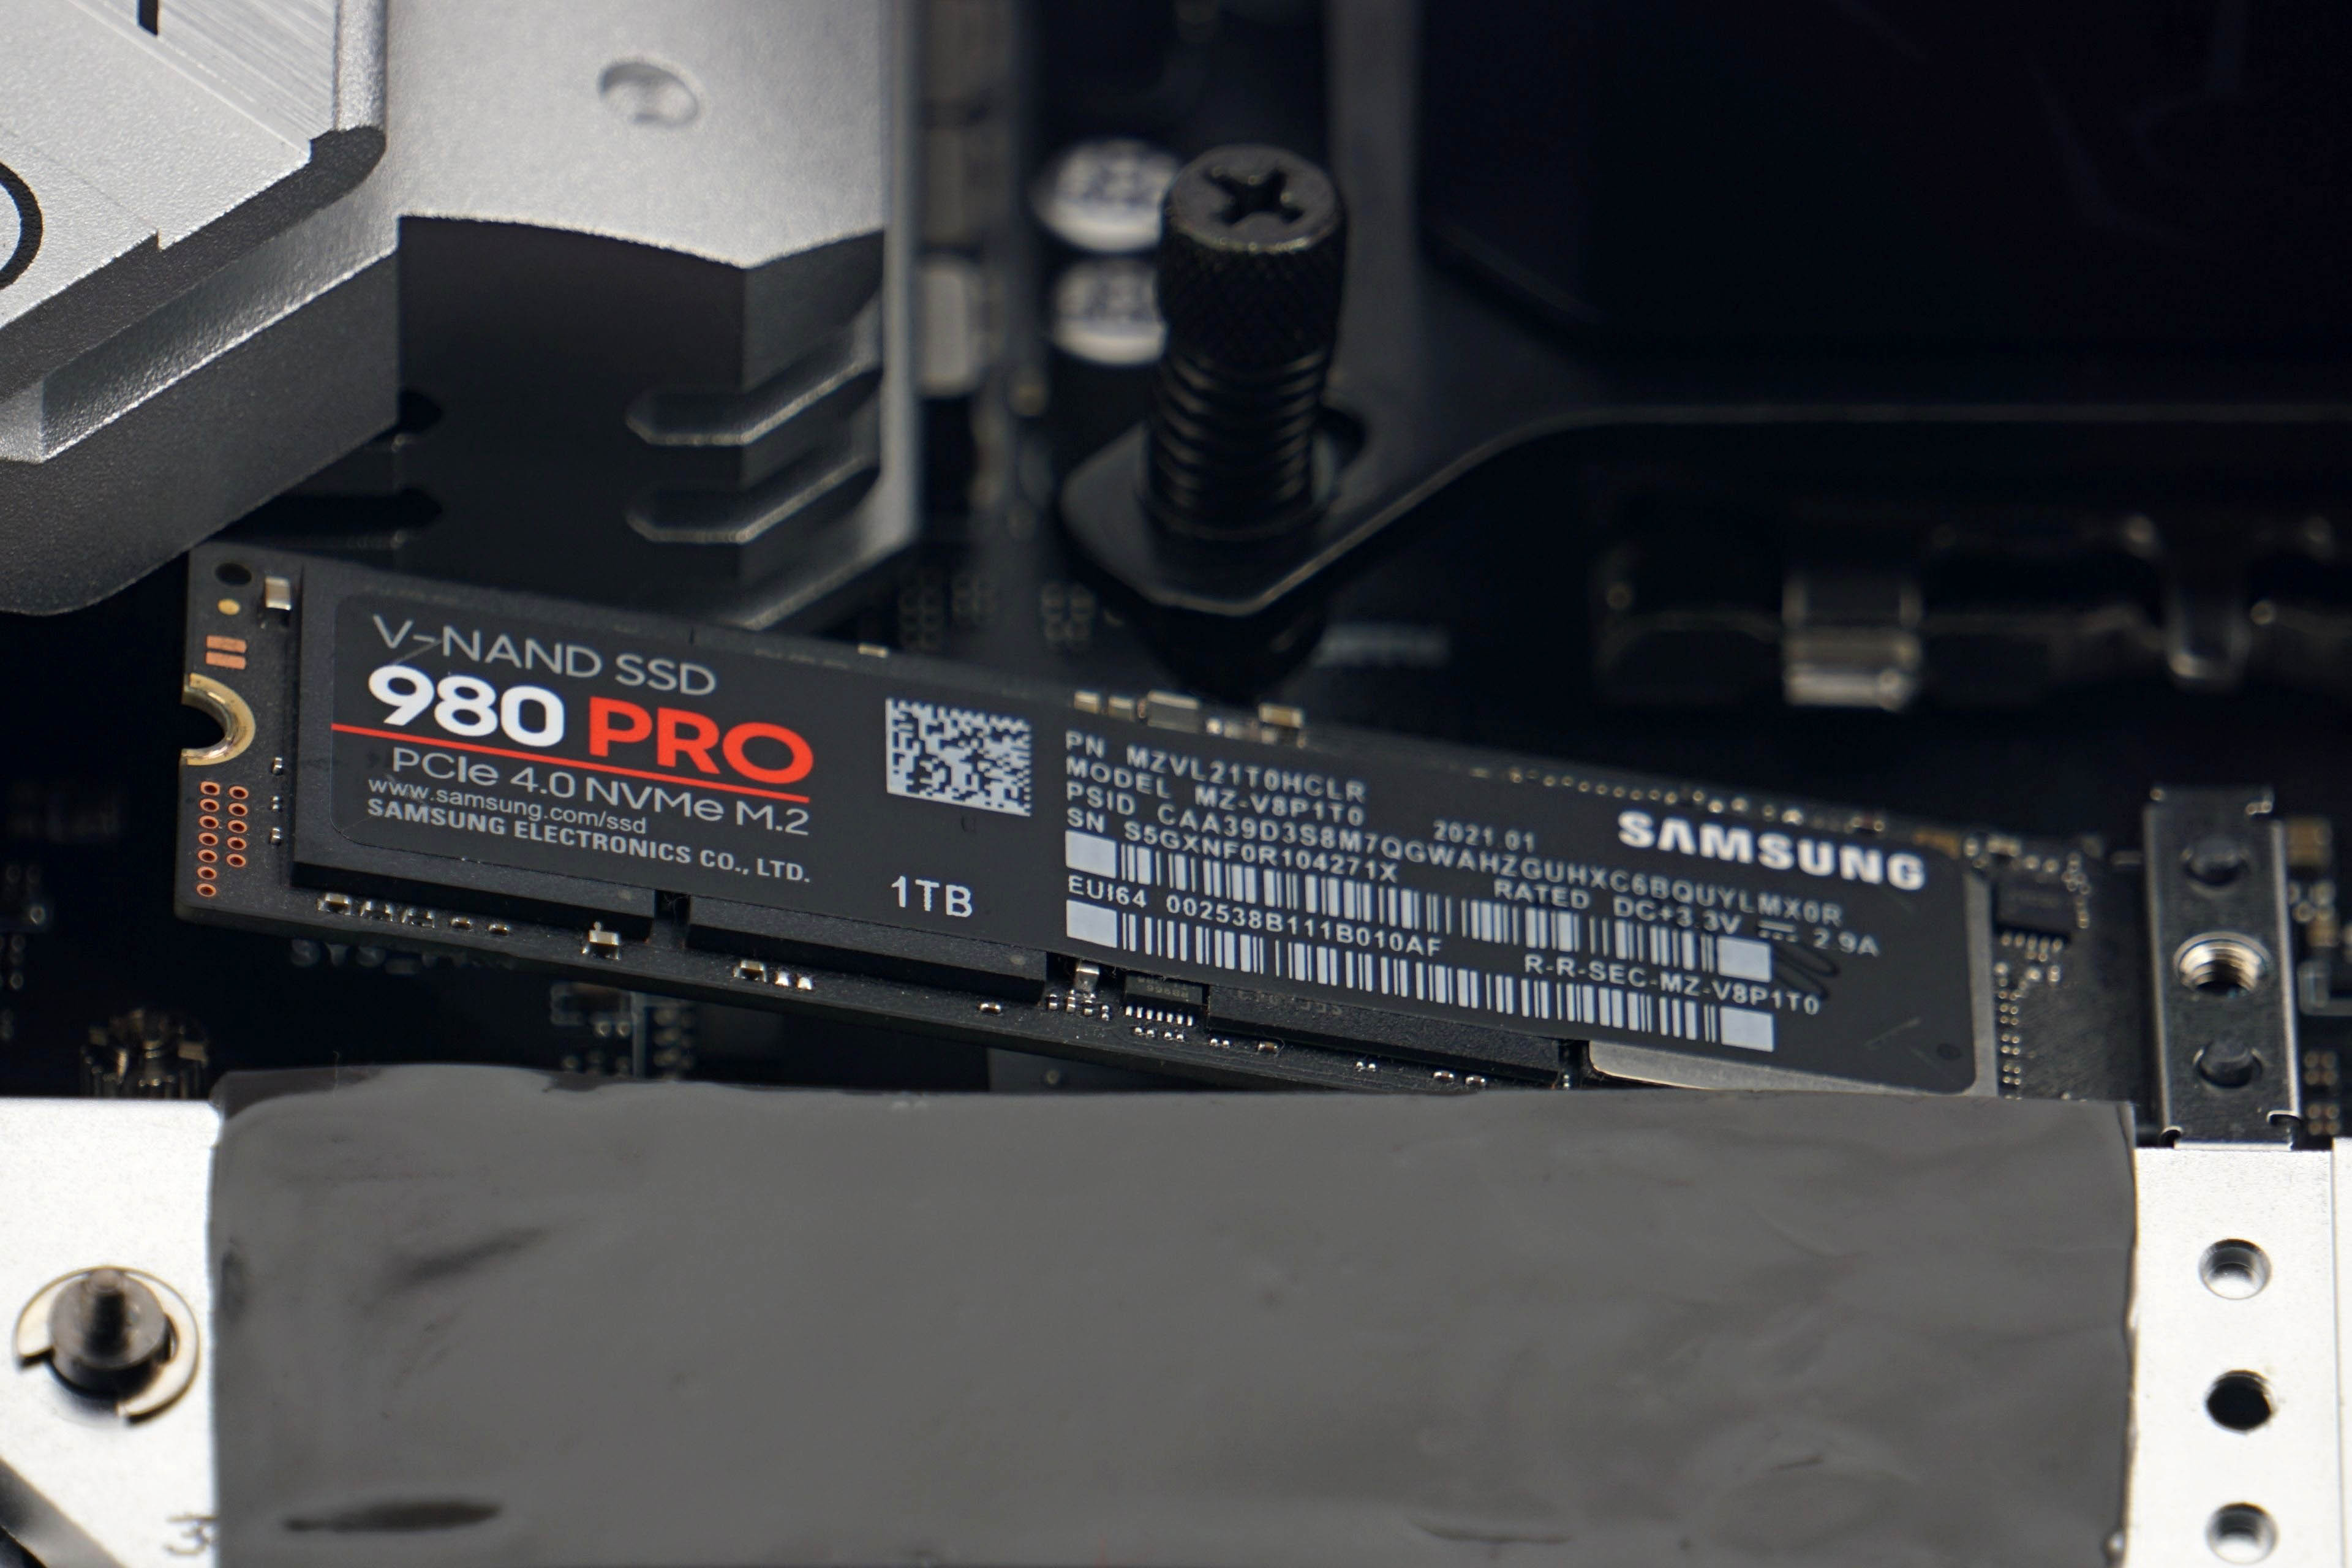
SSD performance tests are also important for motherboards. Therefore we test the maximum sequential read and write speeds on an empty Samsung 980 Pro SSD (1 TB) in the well distributed CrystalDiskMark, in all slots. We approach the USB port tests in the same way. We use a WD Black P50 external SSD to test them. It supports fast USB 3.2 gen. 2×2, so it won’t be a bottleneck for even the fastest USB controllers. We report only one result for each USB standard. This is calculated from the average of all available ports.
We won’t deprive you of network bandwidth tests either. We move large files in both directions within a local network between the motherboard network adapters and the Sonnet Solo10G 10-gigabit PCIe card. This from the aforementioned Samsung 980 Pro SSD to the Patriot Hellfire (480 GB), which is still fast enough to not slow down even the 10 Gb adapter.
The results of all performance tests are averaged over three repeated measurements for best accuracy.
CPU settings…
We primarily test processors without power limits, the way most motherboards have it in factory settings. For tests that have overlap with power, temperature and CPU frequency measurements, we also observe the behavior of boards with power limits set according to CPU manufacturers’ recommendations. We set PL1 to the TDP level, respecting also the tau timeout (56 s) for Intel CPUs. The upper power limit (PL2/PPT) is also set according to the official CPU specifications. Technologies for aggressive overclocking, such as PBO2 (AMD) or ABT (Intel), MCE (Asus) and the like, are not dealt with in our standard motherboard tests.
… and application updates
Tests should also take into account that over time, individual updates may skew performance comparisons. Some applications we use in portable versions that do not update or can be kept on a stable version, but for some this is not the case. Typically games get updated over time, which is natural, and keeping them on old versions out of reality would also be questionable.
In short, just count on the fact that the accuracy of the results you are comparing with each other decreases a bit as time goes on. To make this analysis easier, we’ve listed when each board was tested. You can find this out in the dialog box, where you can find information about the date of testing. This dialog is displayed in the interactive graphs, next to any result bar. Just hover over it.
Most motherboards from the same classes look pretty much the same. While they differ in color scheme and heatsink shape, the layout, features, and overall operation (including power management) are like a carbon copy. The Biostar B660GTA goes upstream in many ways and presents an attractive option for those users who always find something lacking on boards in this price range.
Methodology: How we measure power draw
Motherboard “power draw” analysis is an extremely attractive topic if approached methodically. What does it mean? Measuring the electric current and voltage directly on the wiring that powers the motherboard. Naturally, the processor, or the processor power supply, has the most significant draw, which we measure separately – just as in processor tests.
In addition to the EPS cable, there is also a 24-pin ATX cable with multiple voltages, which is good to keep track of. The key ones are +3.3 V (from which the chipset is typically powered), +5 V (memory) and +12 V, from which the PCI Express slots are powered, and the biggest draw will be in the case of our test configuration on the graphics card. All of these wires are closely monitored. But then within the ATX connector there are also a few relatively unimportant branches that are no longer even used in modern computers (that is, -12 V and -5 V) or are relatively unimportant in terms of power draw. For example +5 VSB (power supply for USB or ARGB lighting even when the computer is switched off; this can usually be switched off in the BIOS) or PG (Power Good), which is only informative and during operation it is only “an also-run”. These branches (-12 V, -5 V, +5 VSB and PG) always have only one wire and often with a smaller cross section, which is also a sign of always very low power draw.
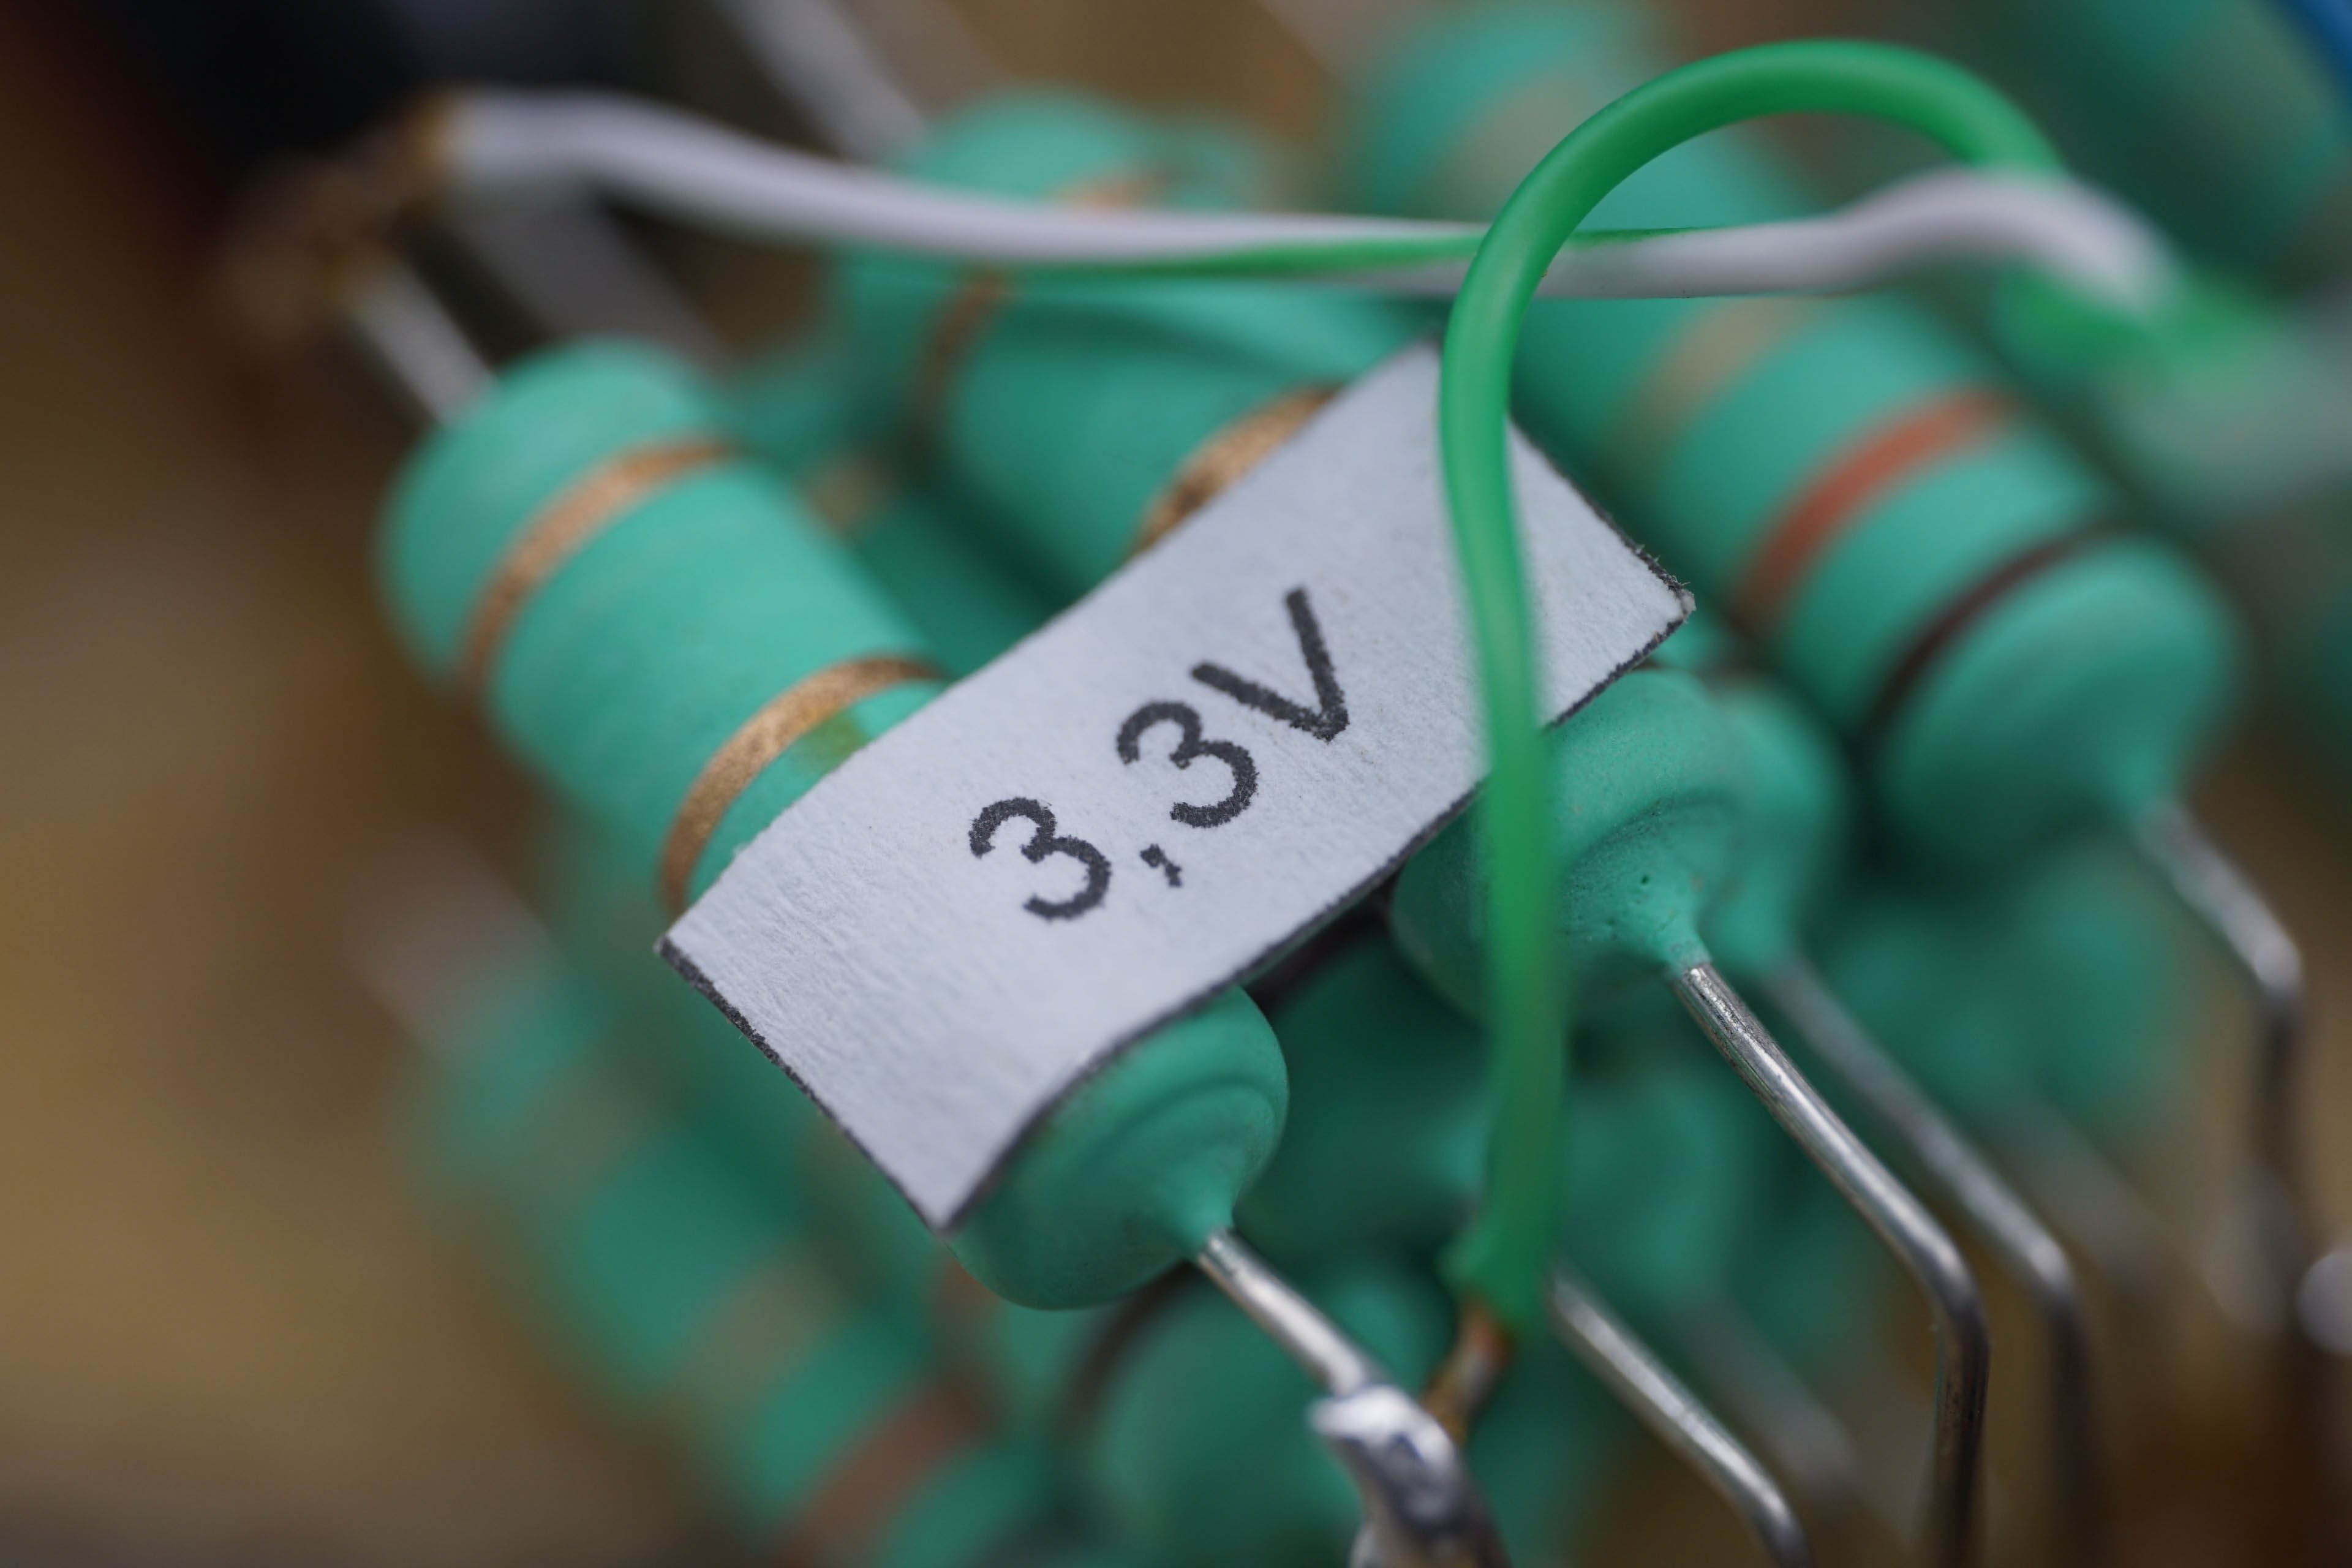
The 24-pin wires on which we measure the power draw are always connected in parallel and are at least in pairs (+12 V) or greater in number. For example, the +3.3 V branch uses four conductors to increase the cross section and the +5 V branch has up to five. However, this branch is quite oversized from today’s point of view, as historically it was intended to power more HDDs or their logical part (+12 V is used for the mechanical part).
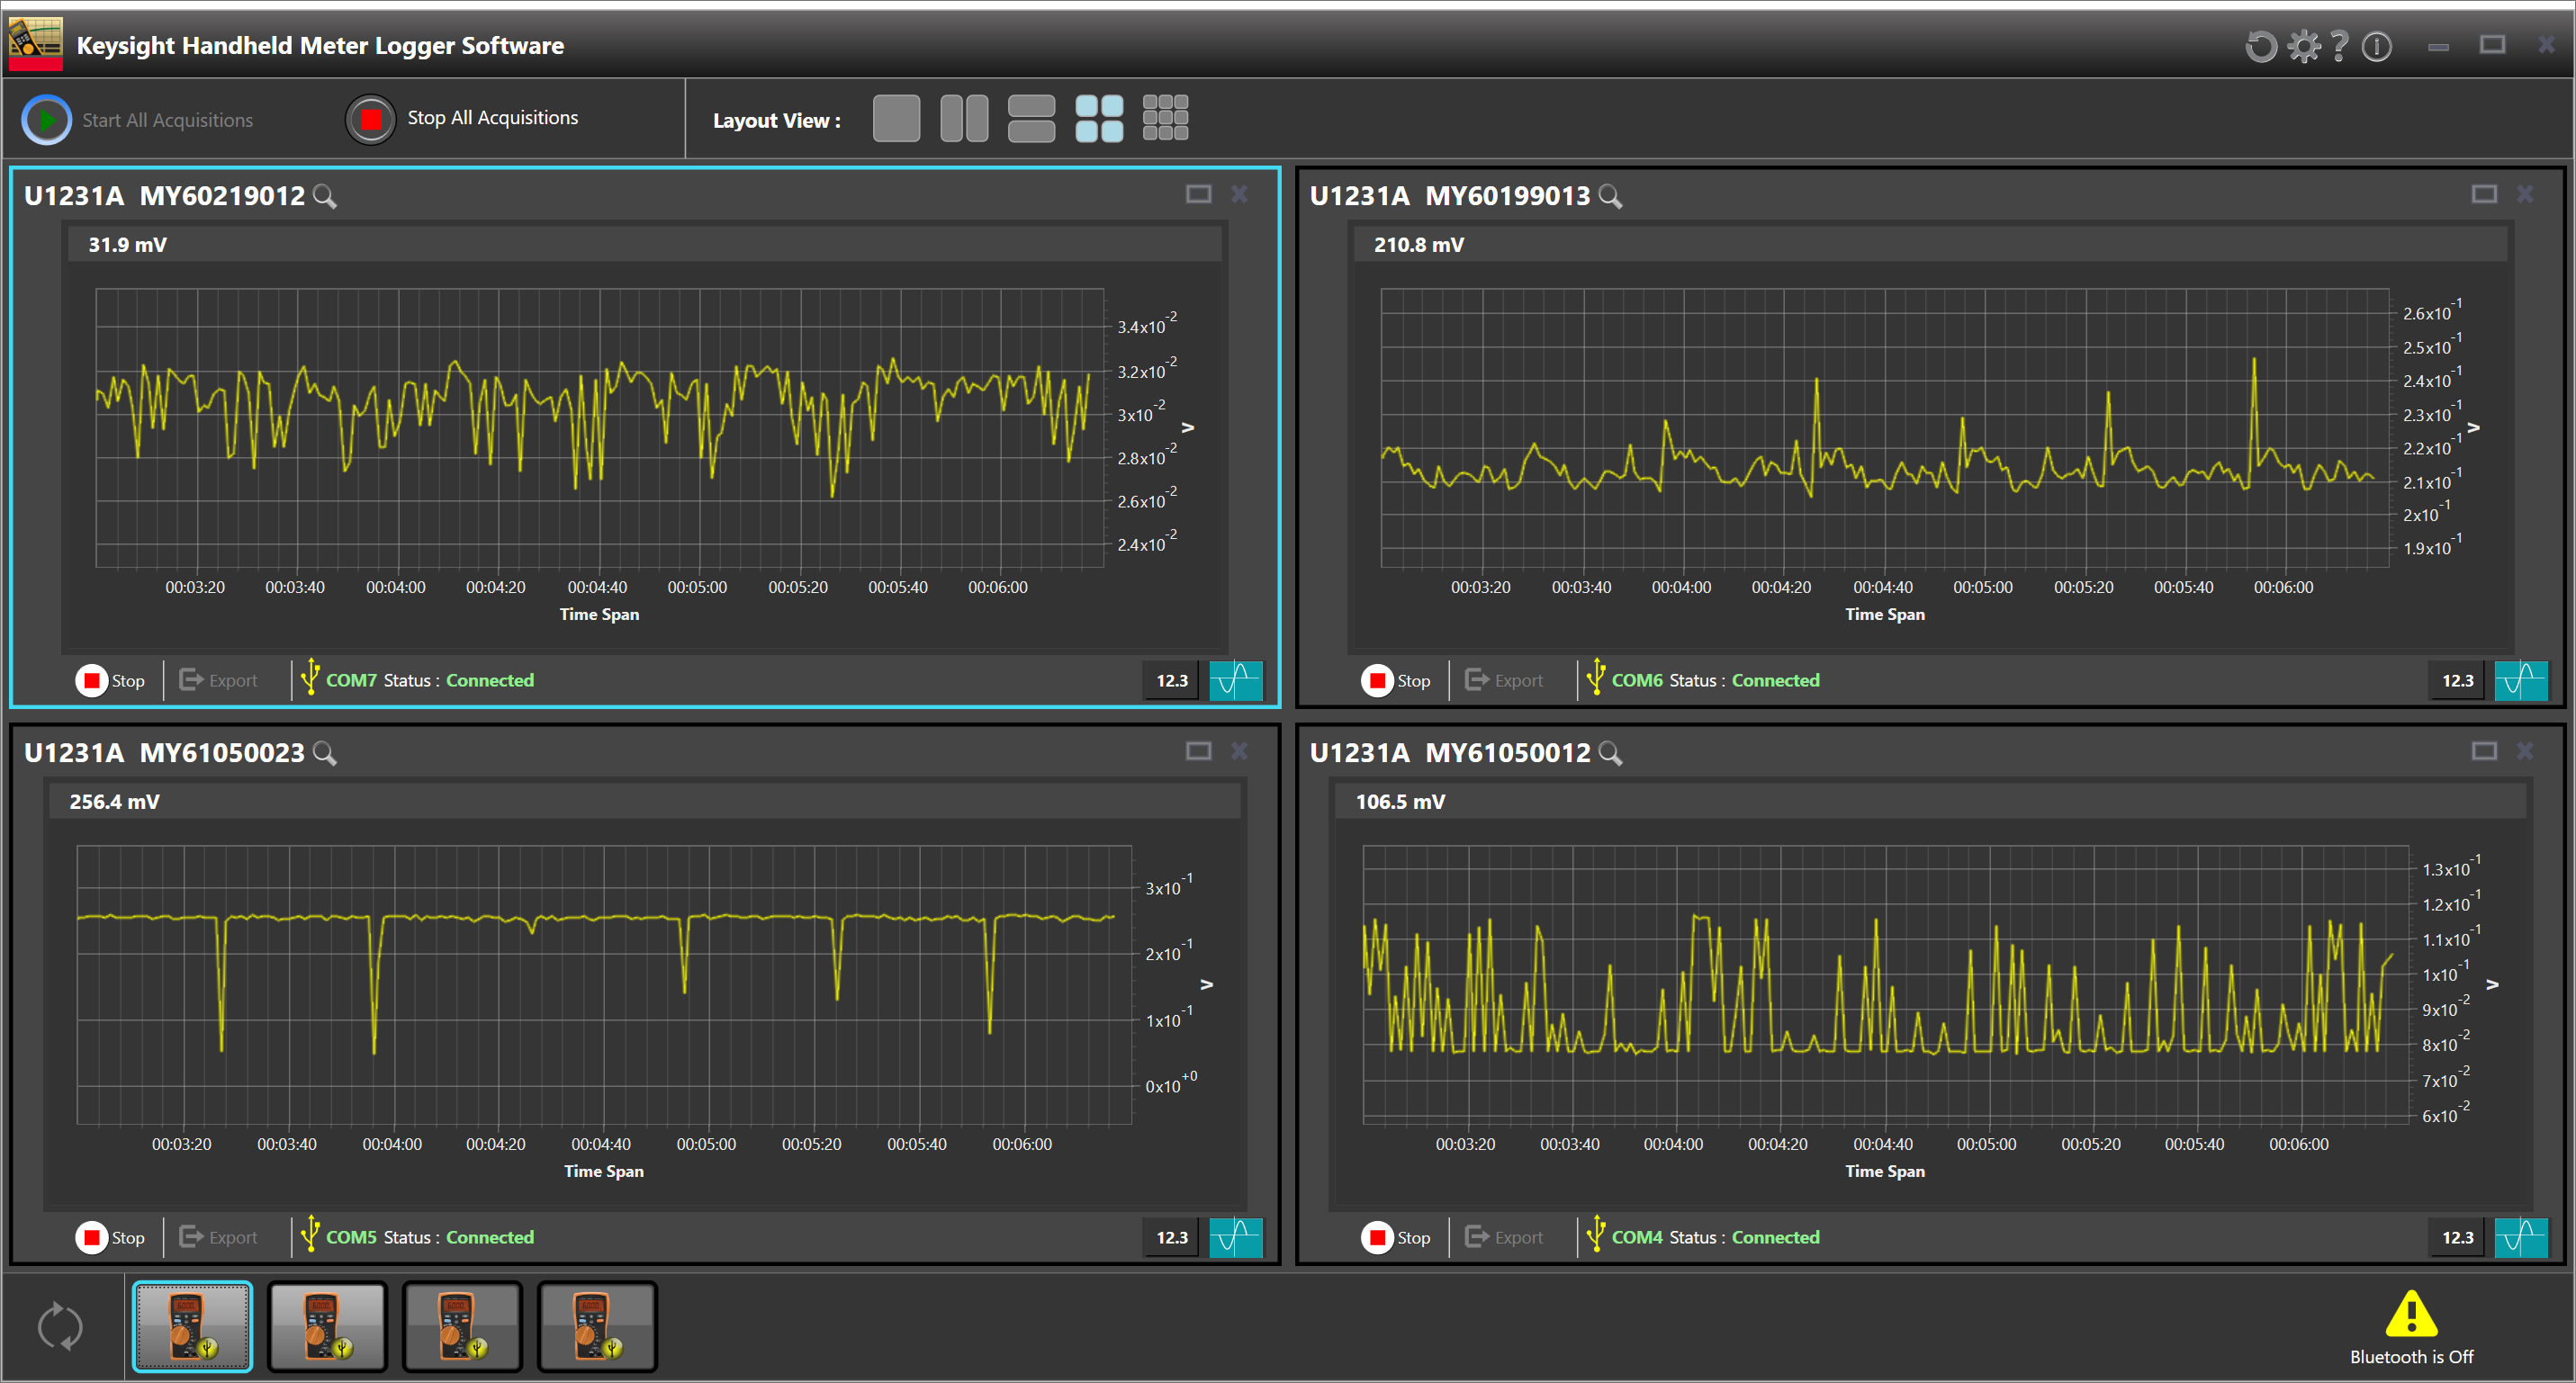
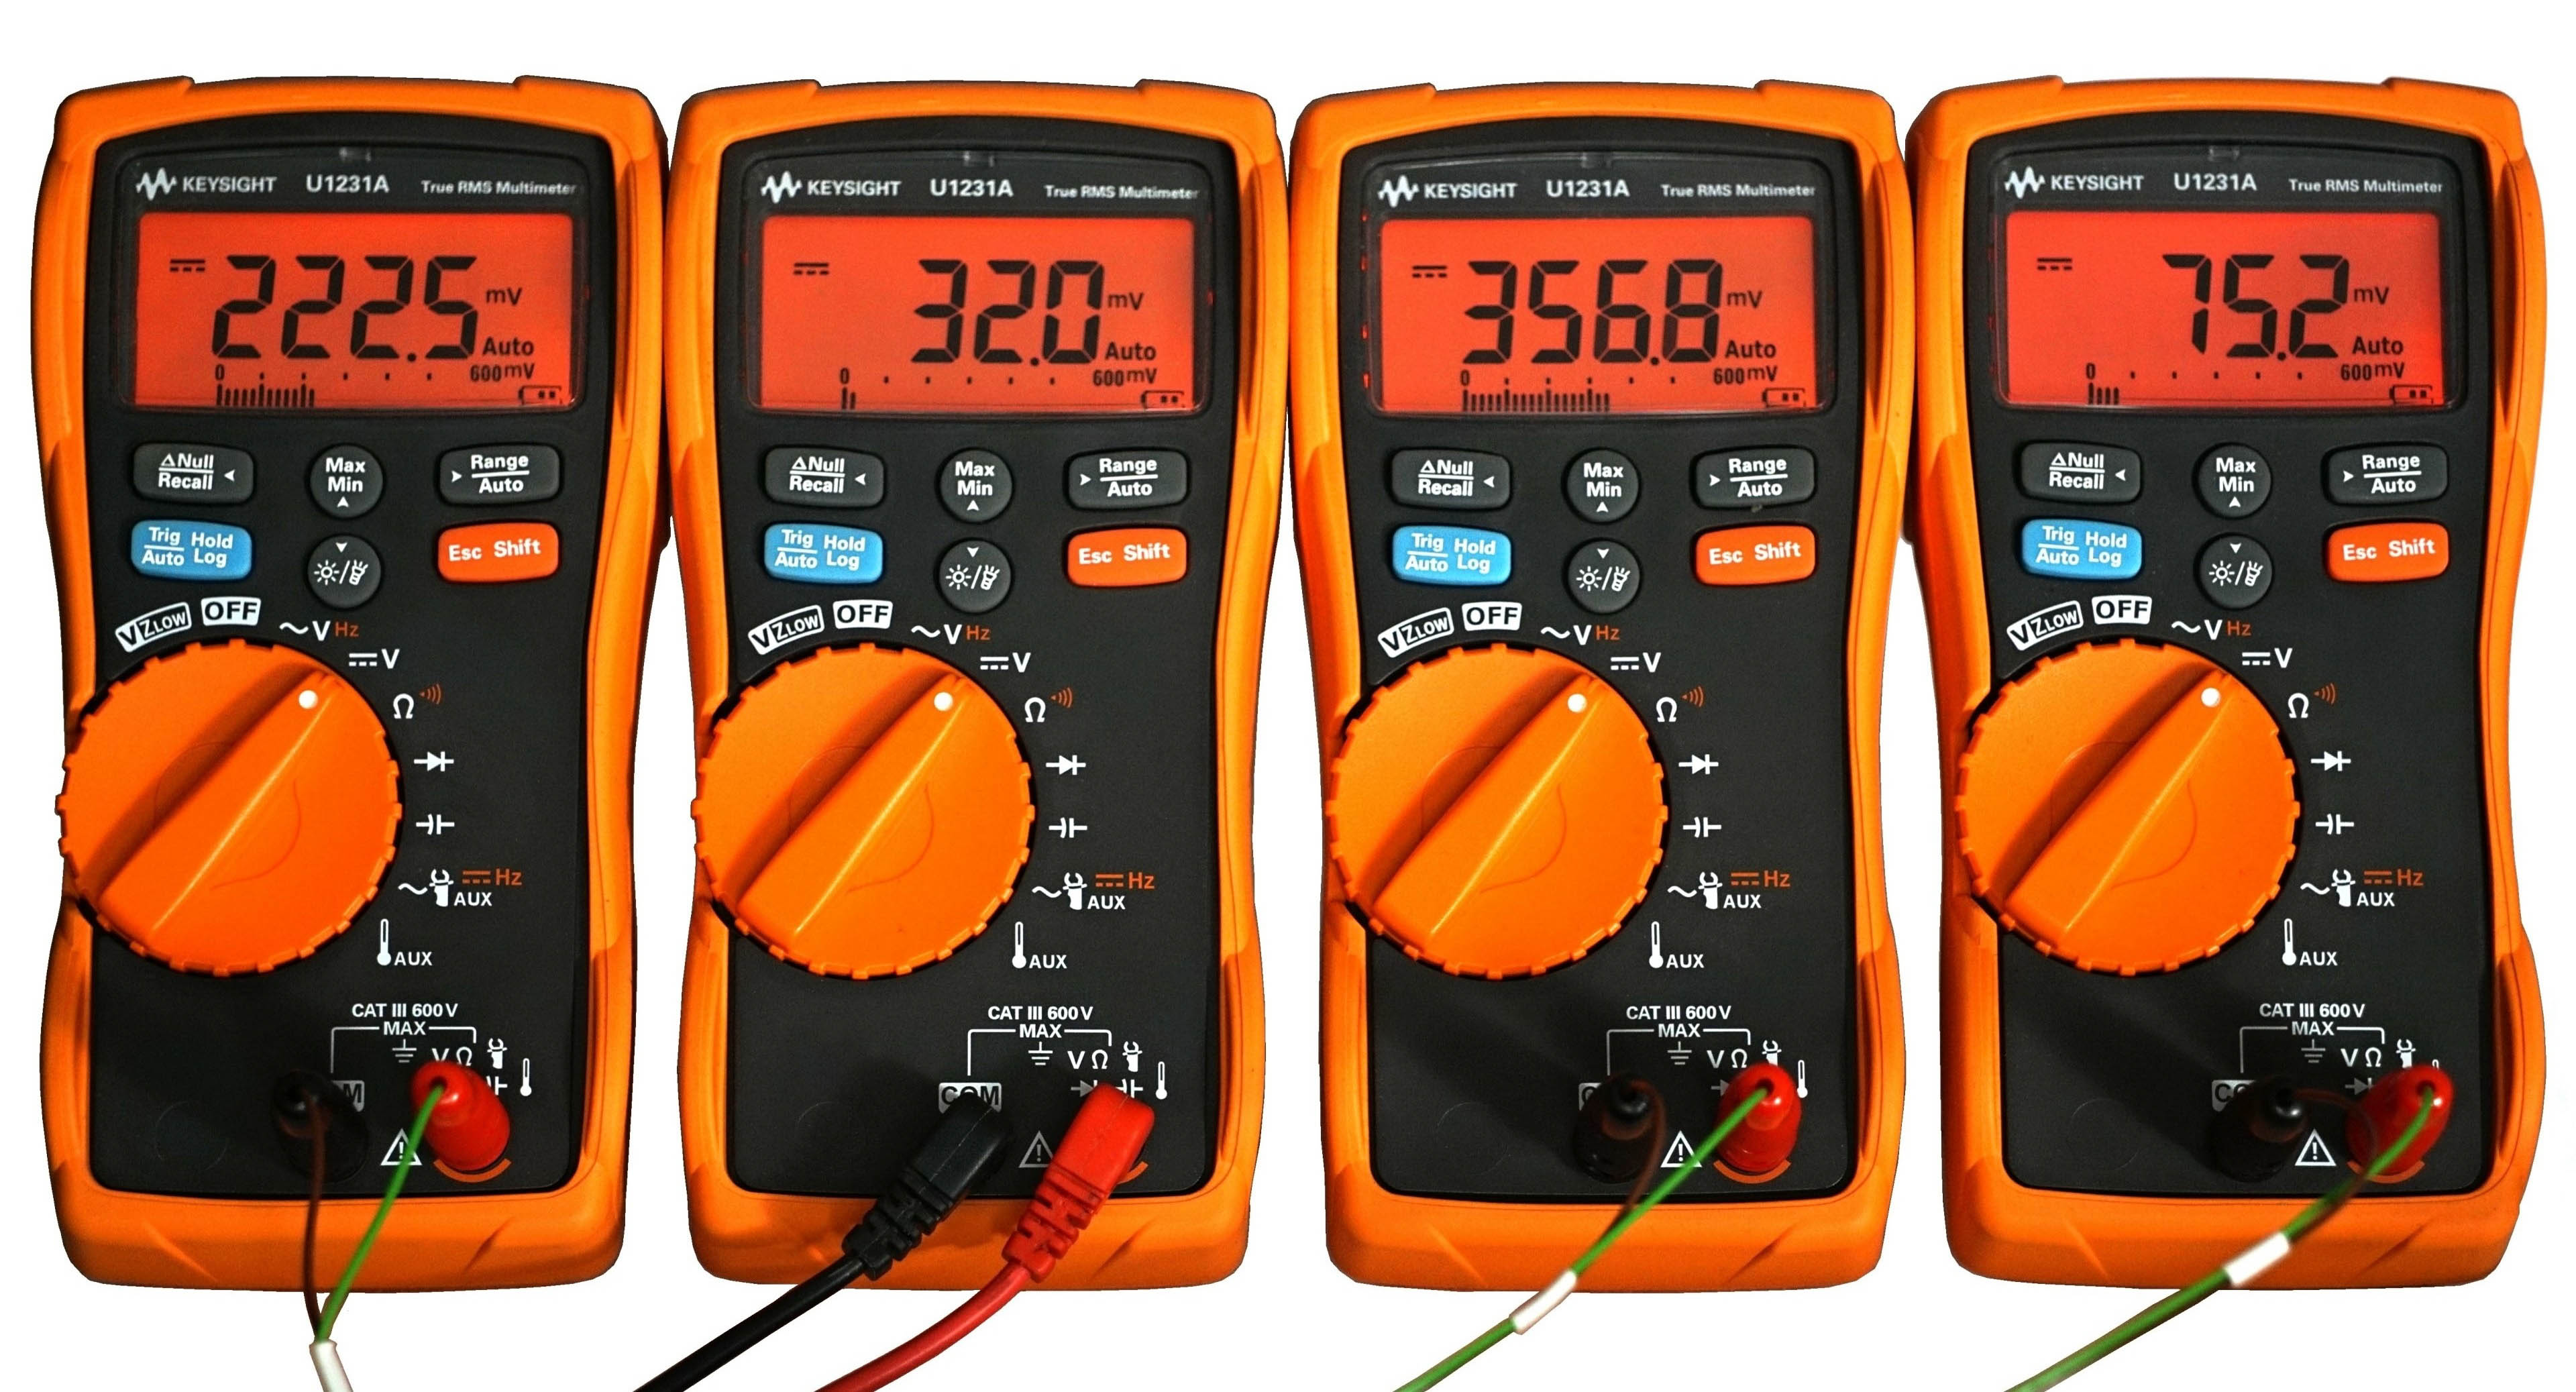
We use a shunt of our own making to measure the draw from the 24-pin. This is built on a very simple principle and consists of very low-value resistors. The value is set so low that the voltage drop is not higher than the ATX standard. Based on the known resistance in the circuit and the voltage drop across it, we can calculate the electric current, and once the output is substituted into the known formula to calculate the power, the mathematics is easy. Samples during the course of the tests are recorded using the Keysight U1231A multimeter array via a service application that allows the recorded data to be exported in CSV. And that’s the final destination for creating line graphs or counting averages (into bar interactive graphs). That’s how simple it is.
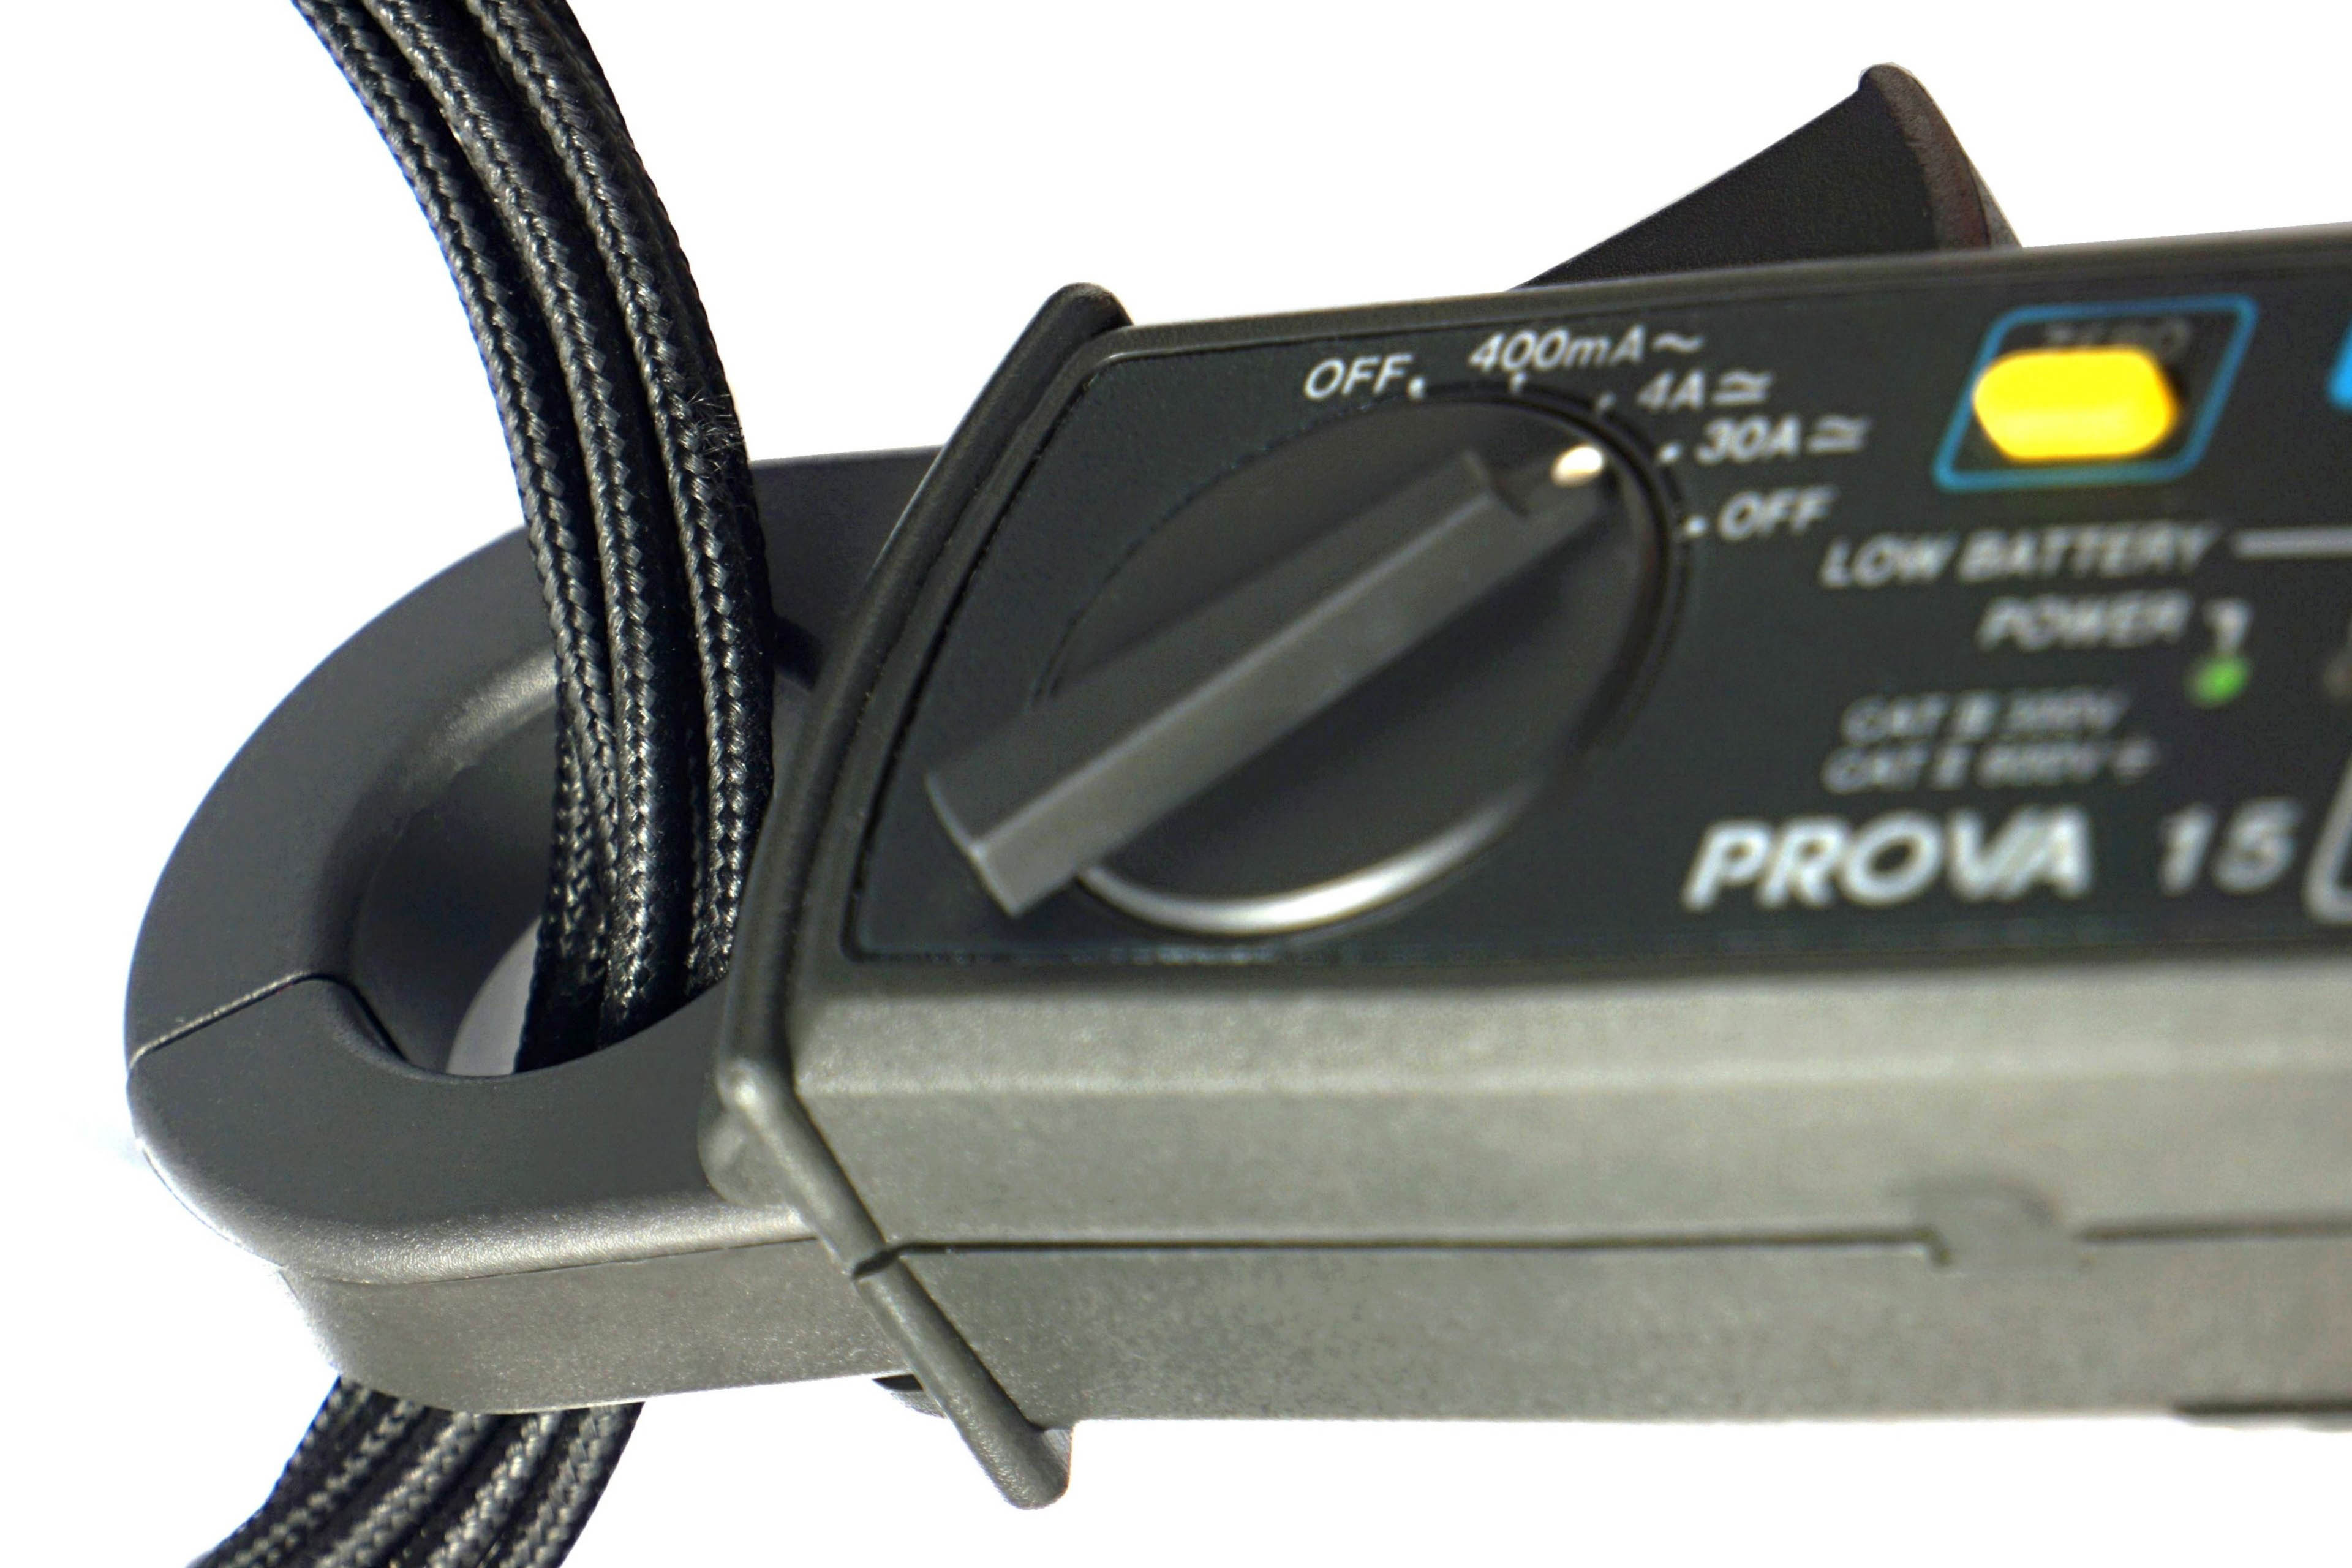
For completeness it is good to add that the current clamps for measuring the current draw from the EPS cables (power supply to the processor) are Prova 15. These will soon be replaced by a more practical solution for desktop use, namely a similar shunt we use for the ATX connector. The only reason it is not yet in circulation is its more complex design (as it has to account for very high currents) and the need for thorough testing, which we are yet to get to. Since we place a high emphasis on accuracy in our tests, all measuring devices are properly calibrated.
Most motherboards from the same classes look pretty much the same. While they differ in color scheme and heatsink shape, the layout, features, and overall operation (including power management) are like a carbon copy. The Biostar B660GTA goes upstream in many ways and presents an attractive option for those users who always find something lacking on boards in this price range.
Methodology: Temperature and frequency measurements
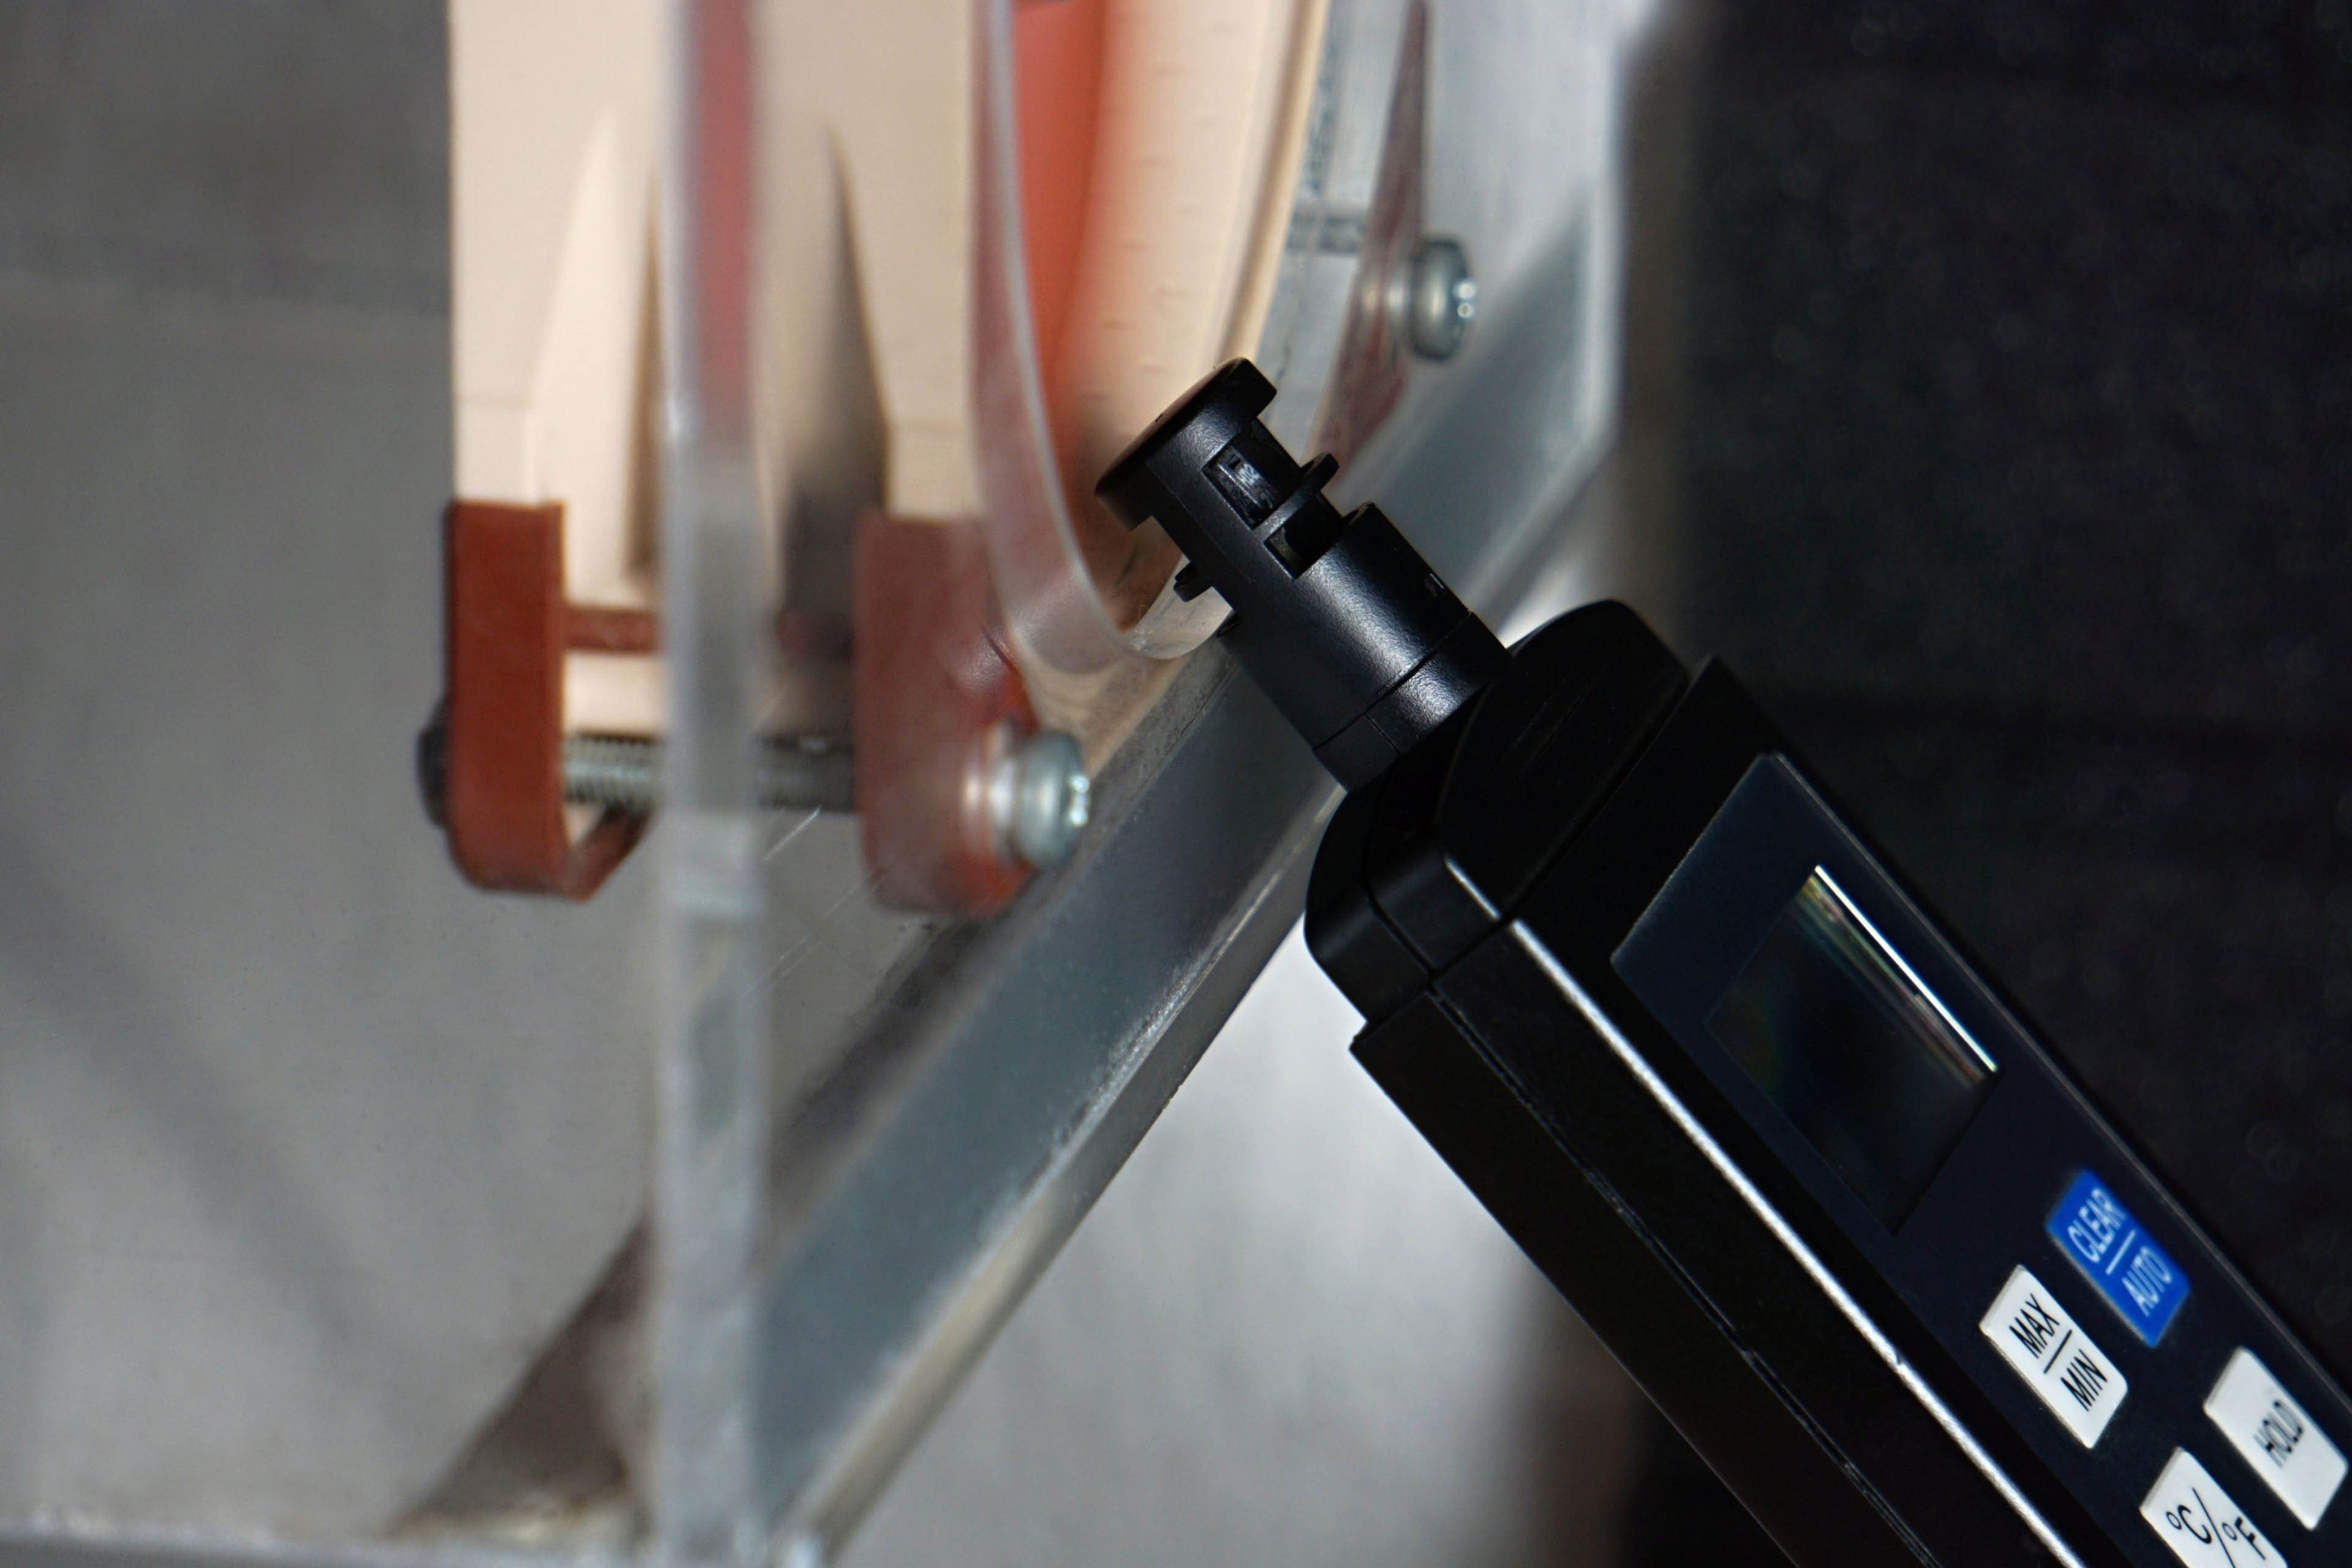
By far the most critical part in terms of temperatures on the motherboard is the power delivery (VRM) for the CPU. This is where we return to the Fluke Ti125 thermal imager, which produces temperature maps that can be used to locate the average temperature, as well as the hottest point. We record both these values (average and maximum temperature on the Vcore) in graphs, and we will later evaluate the efficiency of the VRM heatsinks based on the maximum one. However, we lack a suitable thermometer for that yet. Of course, the thermovision is implemented without a heatsink, and a thermocouple needs to be installed on the hottest MOSFET to detect the reduction of temperature with a heatsink. This will be added soon.
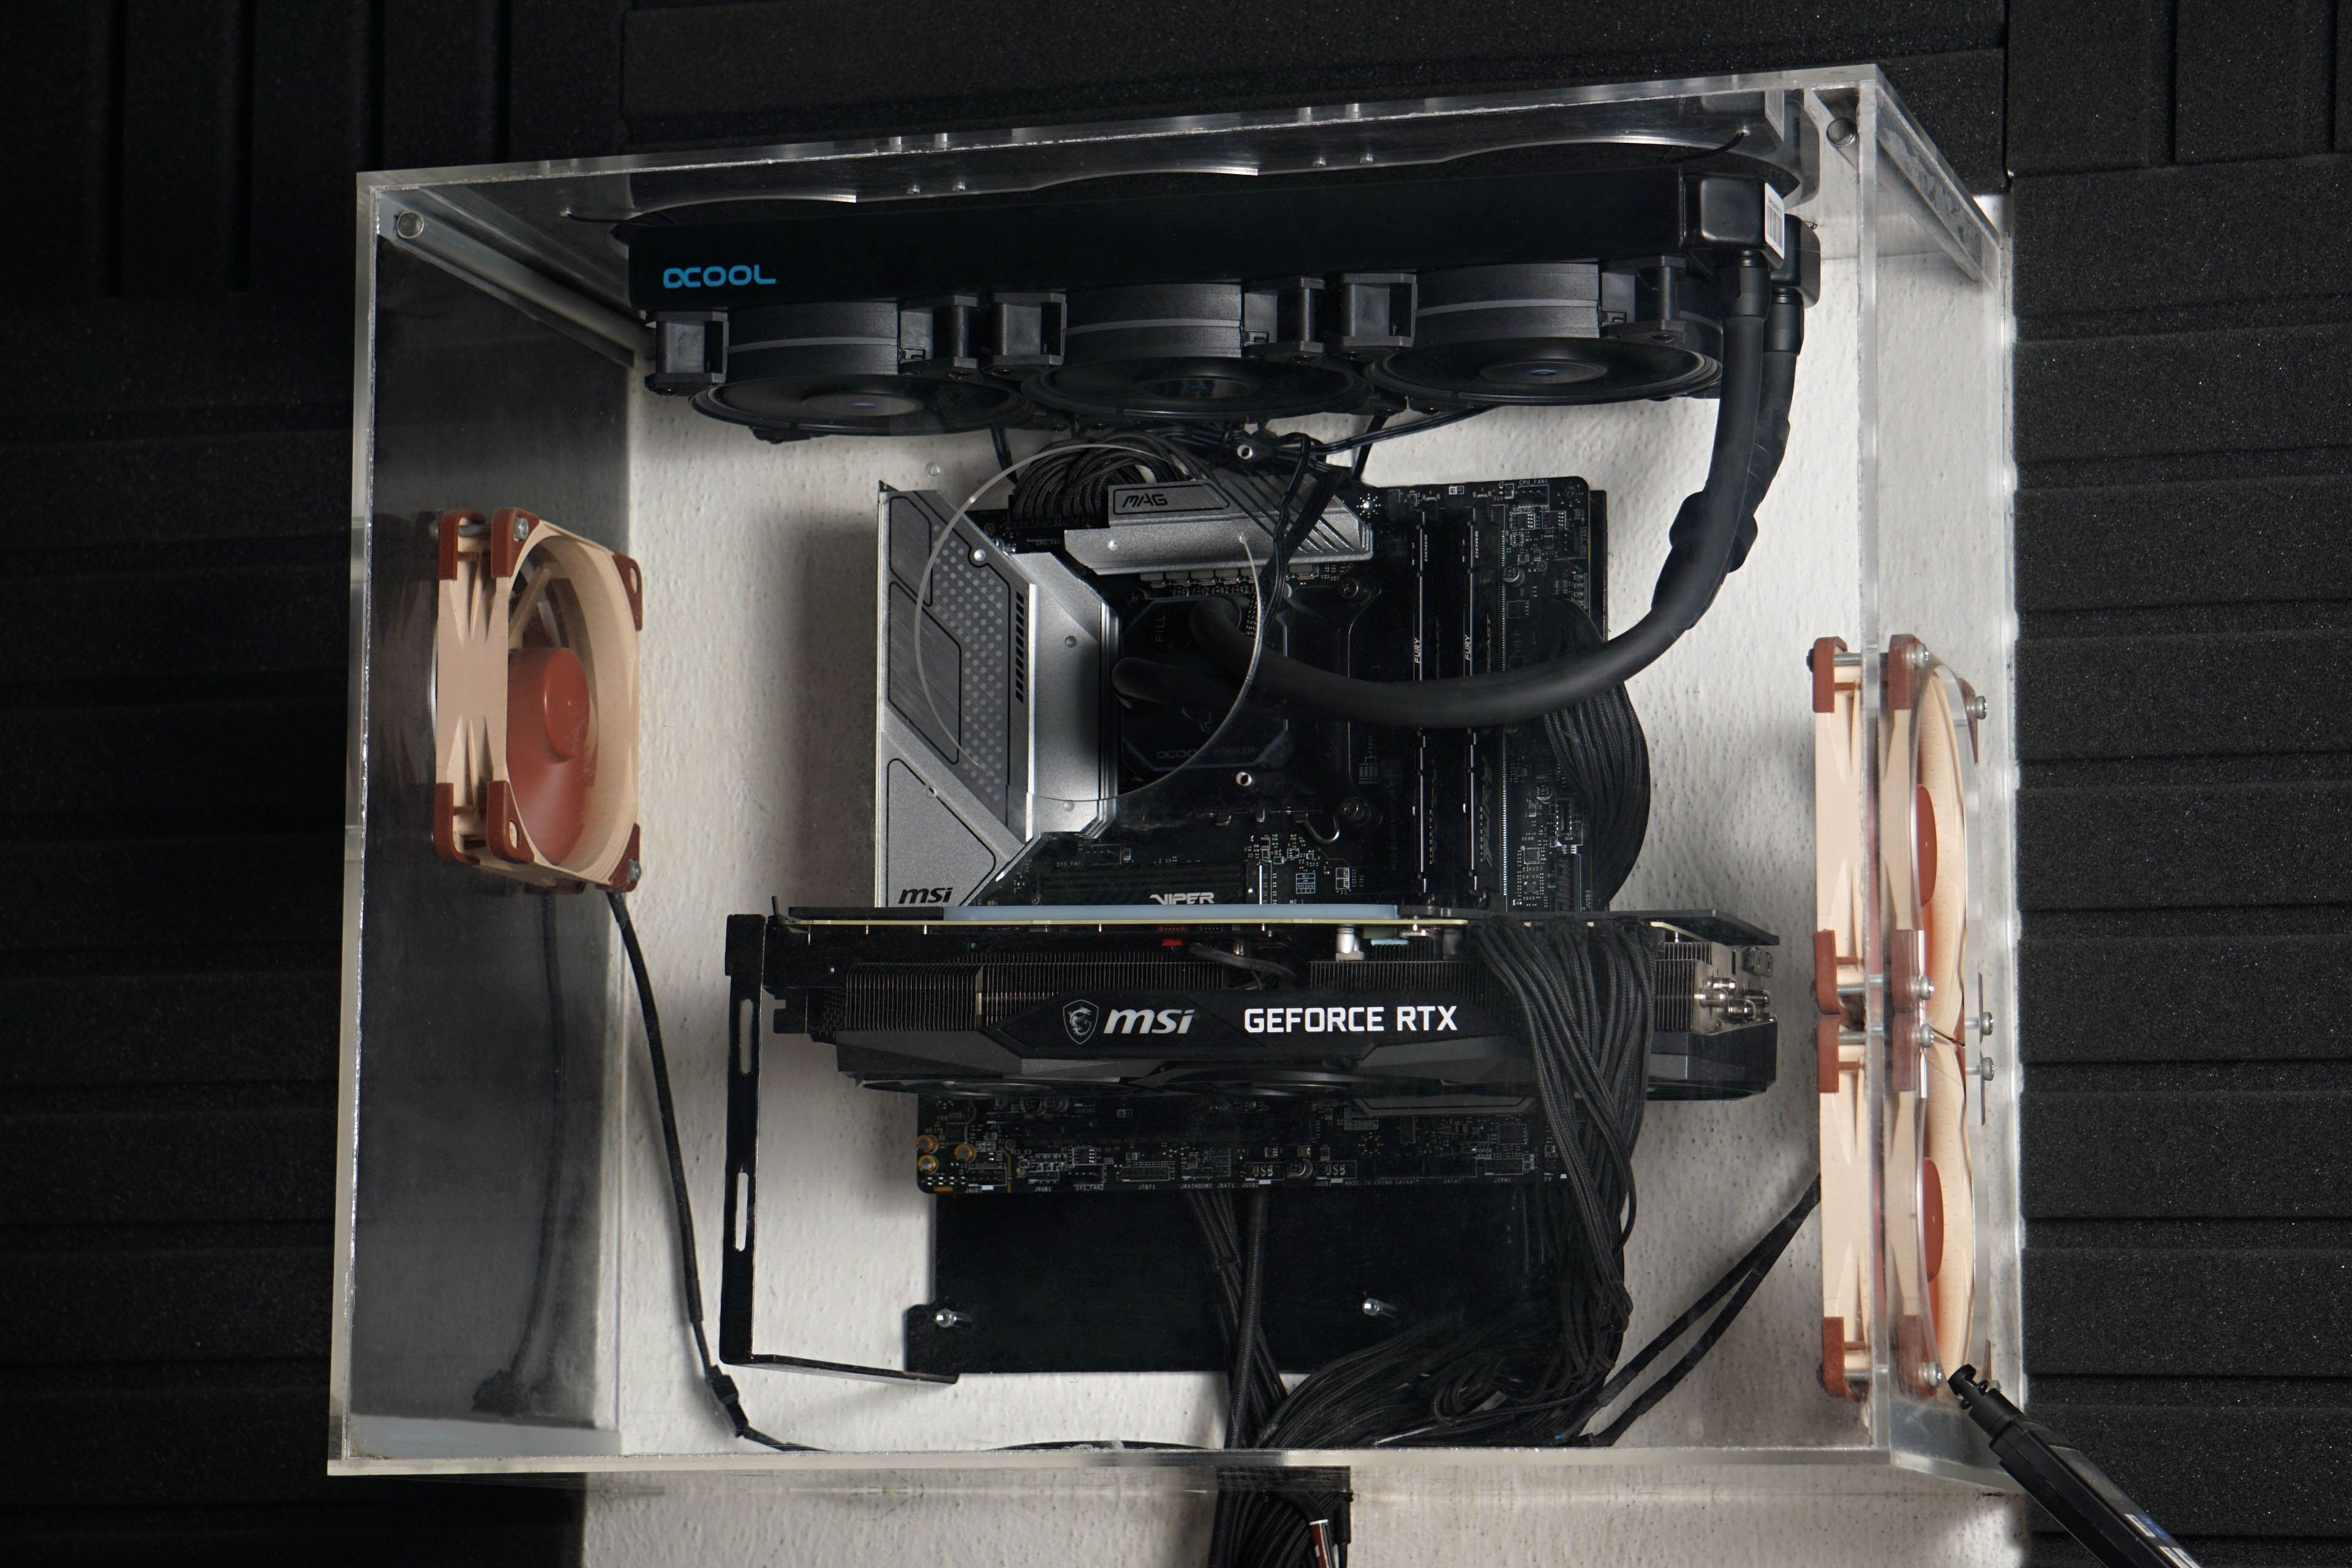
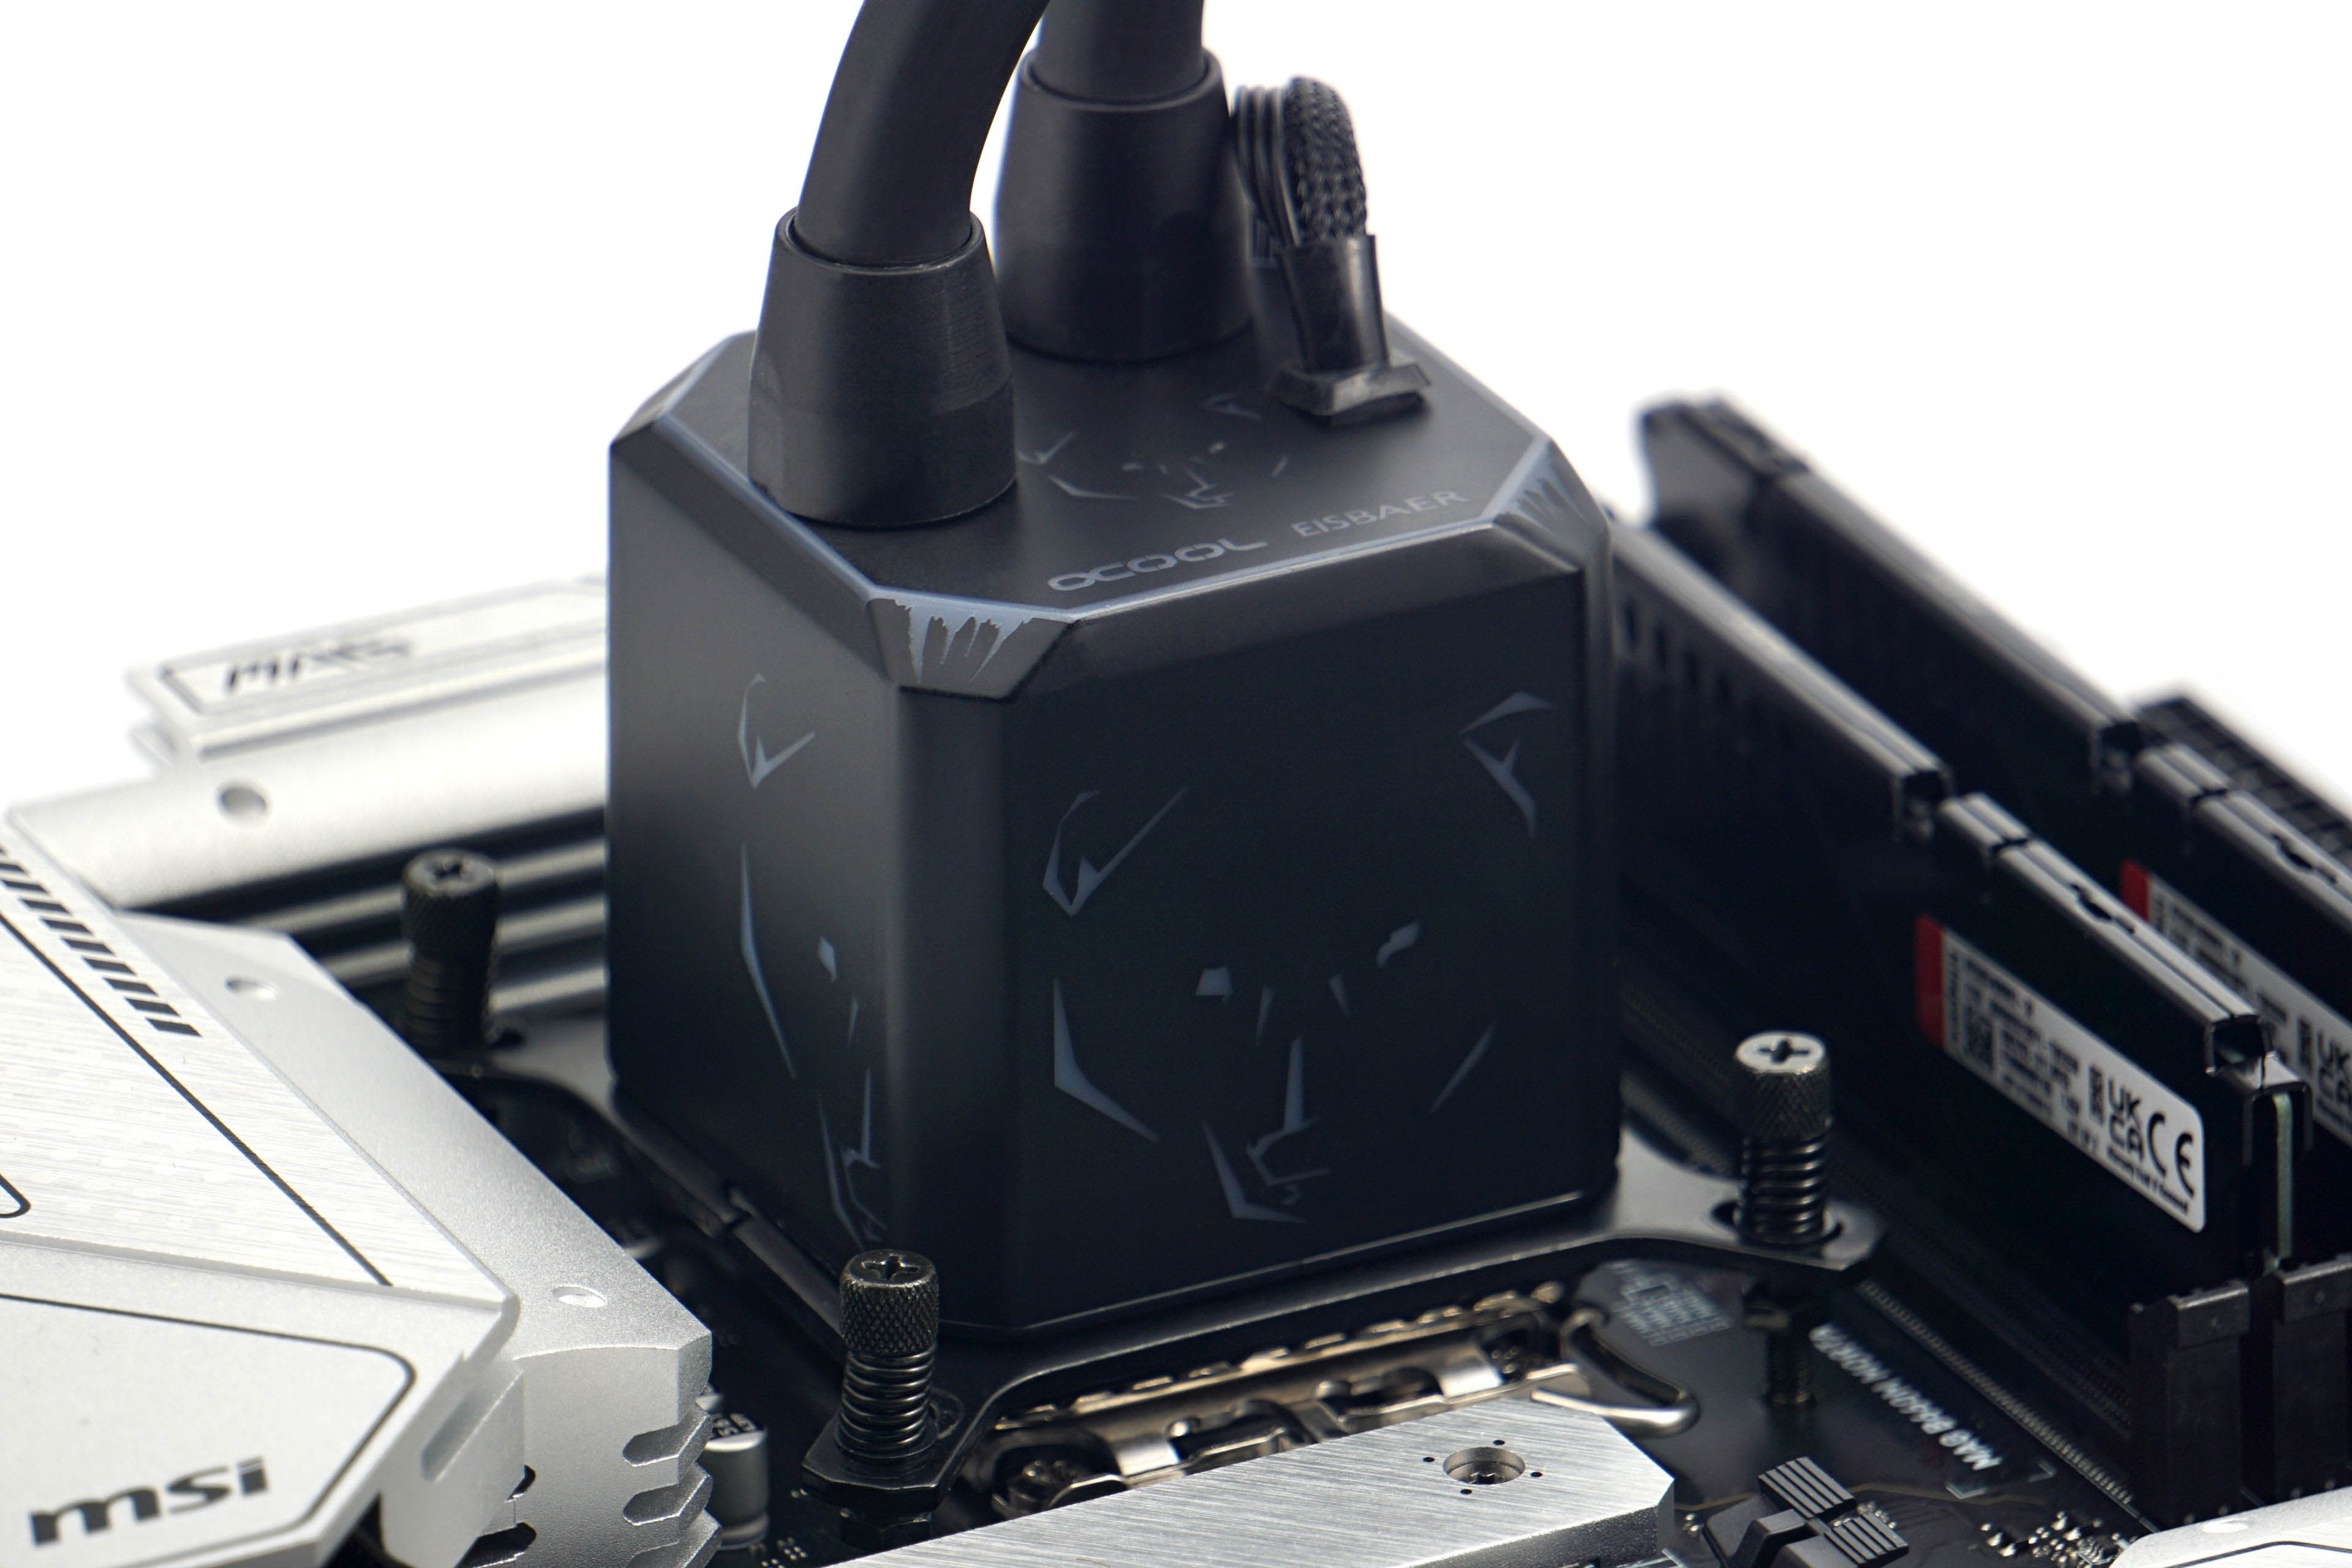
Thermovision always relates to operating with the more powerful of the pair of test processors. With it, the differences and possible limitations or impending risks (for example, even from thermal throttling) become more apparent. In order to have a good view of the VRM, we use an Alphacool Eisbaer 360 liquid cooler with the fans fixed at full power (12 V) instead of a tower cooler (from the CPU tests). The temperature tests also include CPU temperatures for completeness, and we also test the efficiency of the supplied SSD heatsinks as part of the motherboard tests. These are already included with virtually all better motherboards, and so the question naturally arises whether to use them or replace them with other, more finned ones. We will test these heatsinks on a Samsung 980 Pro SSD during ten minutes of intense load in CrystalDiskMark. Finally, the temperature of the chipset’s southbridge and the cooling efficiency in this direction is noteworthy as well.
All tests are conducted in a wind tunnel, so full system cooling is provided. This consists of three Noctua NF-S12A PWMs@5V (~550 rpm) . Two of which are intake, one is exhaust. But the three fast AIO fans also function as exhaust fans, so there is a vacuum in the case.
The temperature at the entrance to the tunnel is properly controlled and ranges between 21-21.3 °C. Maintaining a constant temperature at all times during testing is important not only for the accuracy of the temperature measurements, but also because a higher or lower ambient temperature also affects the eventual behaviour of the processors’ boost. And we also properly monitor and compare the frequencies, whether under all-core load or even single-threaded tasks. We use the HWiNFO application to record the frequencies and temperatures of the cores (sampling is set to two seconds).
Maintaining a constant temperature at the intake is necessary not only for a proper comparison of processor temperatures, but especially for objective performance comparisons. The frequency development, and specially the single core boost, is precisely based on the temperature. Typically in summer, at higher temperatures than is normal in living quarters in winter, processors can be slower.
Temperatures are always read as maximum (both from the VRM thermovision and average, but still from the local maximum values at the end of Cinebench R23). For Intel processors, for each test we read the maximum temperature of the cores, usually all of them. These maxima are then averaged and the result represents the final value in the graph. From the single-threaded workload outputs, we extract only the recorded values from the active cores (there are usually two of these, and they alternate between each other during the test). For AMD processors it is a bit different. They don’t have temperature sensors for each core. In order to make the procedure methodically as similar as possible to the one we apply on Intel processors, we define the average temperature of all cores by the highest value reported by the CPU Tdie (average) sensor. However, for single-core workloads we already use the CPU sensor (Tctl/Tdie), which usually reports a slightly higher value that better corresponds to hotspots of one or two cores. However, these values as well as the values from all internal sensors should be taken with a grain of salt, the accuracy of sensors across CPUs varies.
Frequency evaluation is more accurate, each core has its own sensor even on AMD processors. However, unlike the temperatures, we write the average values of the frequencies during the tests in the graphs. We monitor the temperatures and frequencies of the CPU cores in the same tests in which we also measure power draw. Thus, sequentially from the lowest desktop idle load in Windows 10, through audio encoding (single-threaded load), gaming load in Shadow of the Tomb Raider to Cinebench R23.
Most motherboards from the same classes look pretty much the same. While they differ in color scheme and heatsink shape, the layout, features, and overall operation (including power management) are like a carbon copy. The Biostar B660GTA goes upstream in many ways and presents an attractive option for those users who always find something lacking on boards in this price range.
Test setup
| Testovacia konfigurácia | |
| Chladič CPU | Noctua NH-U14S@12 V |
| Teplovodivá pasta | Noctua NT-H2 |
| Základná doska * | MSI MAG Z690 Tomahawk WiFi DDR4 (BIOS 7D32v11) |
| Pamäte (RAM) | Patriot Blackout, 4× 8 GB, 3600 MHz/CL18 |
| Grafická karta | MSI RTX 3080 Gaming X Trio, Resizable BAR off |
| SSD | 2× Patriot Viper VPN100 (512 GB + 2 TB) |
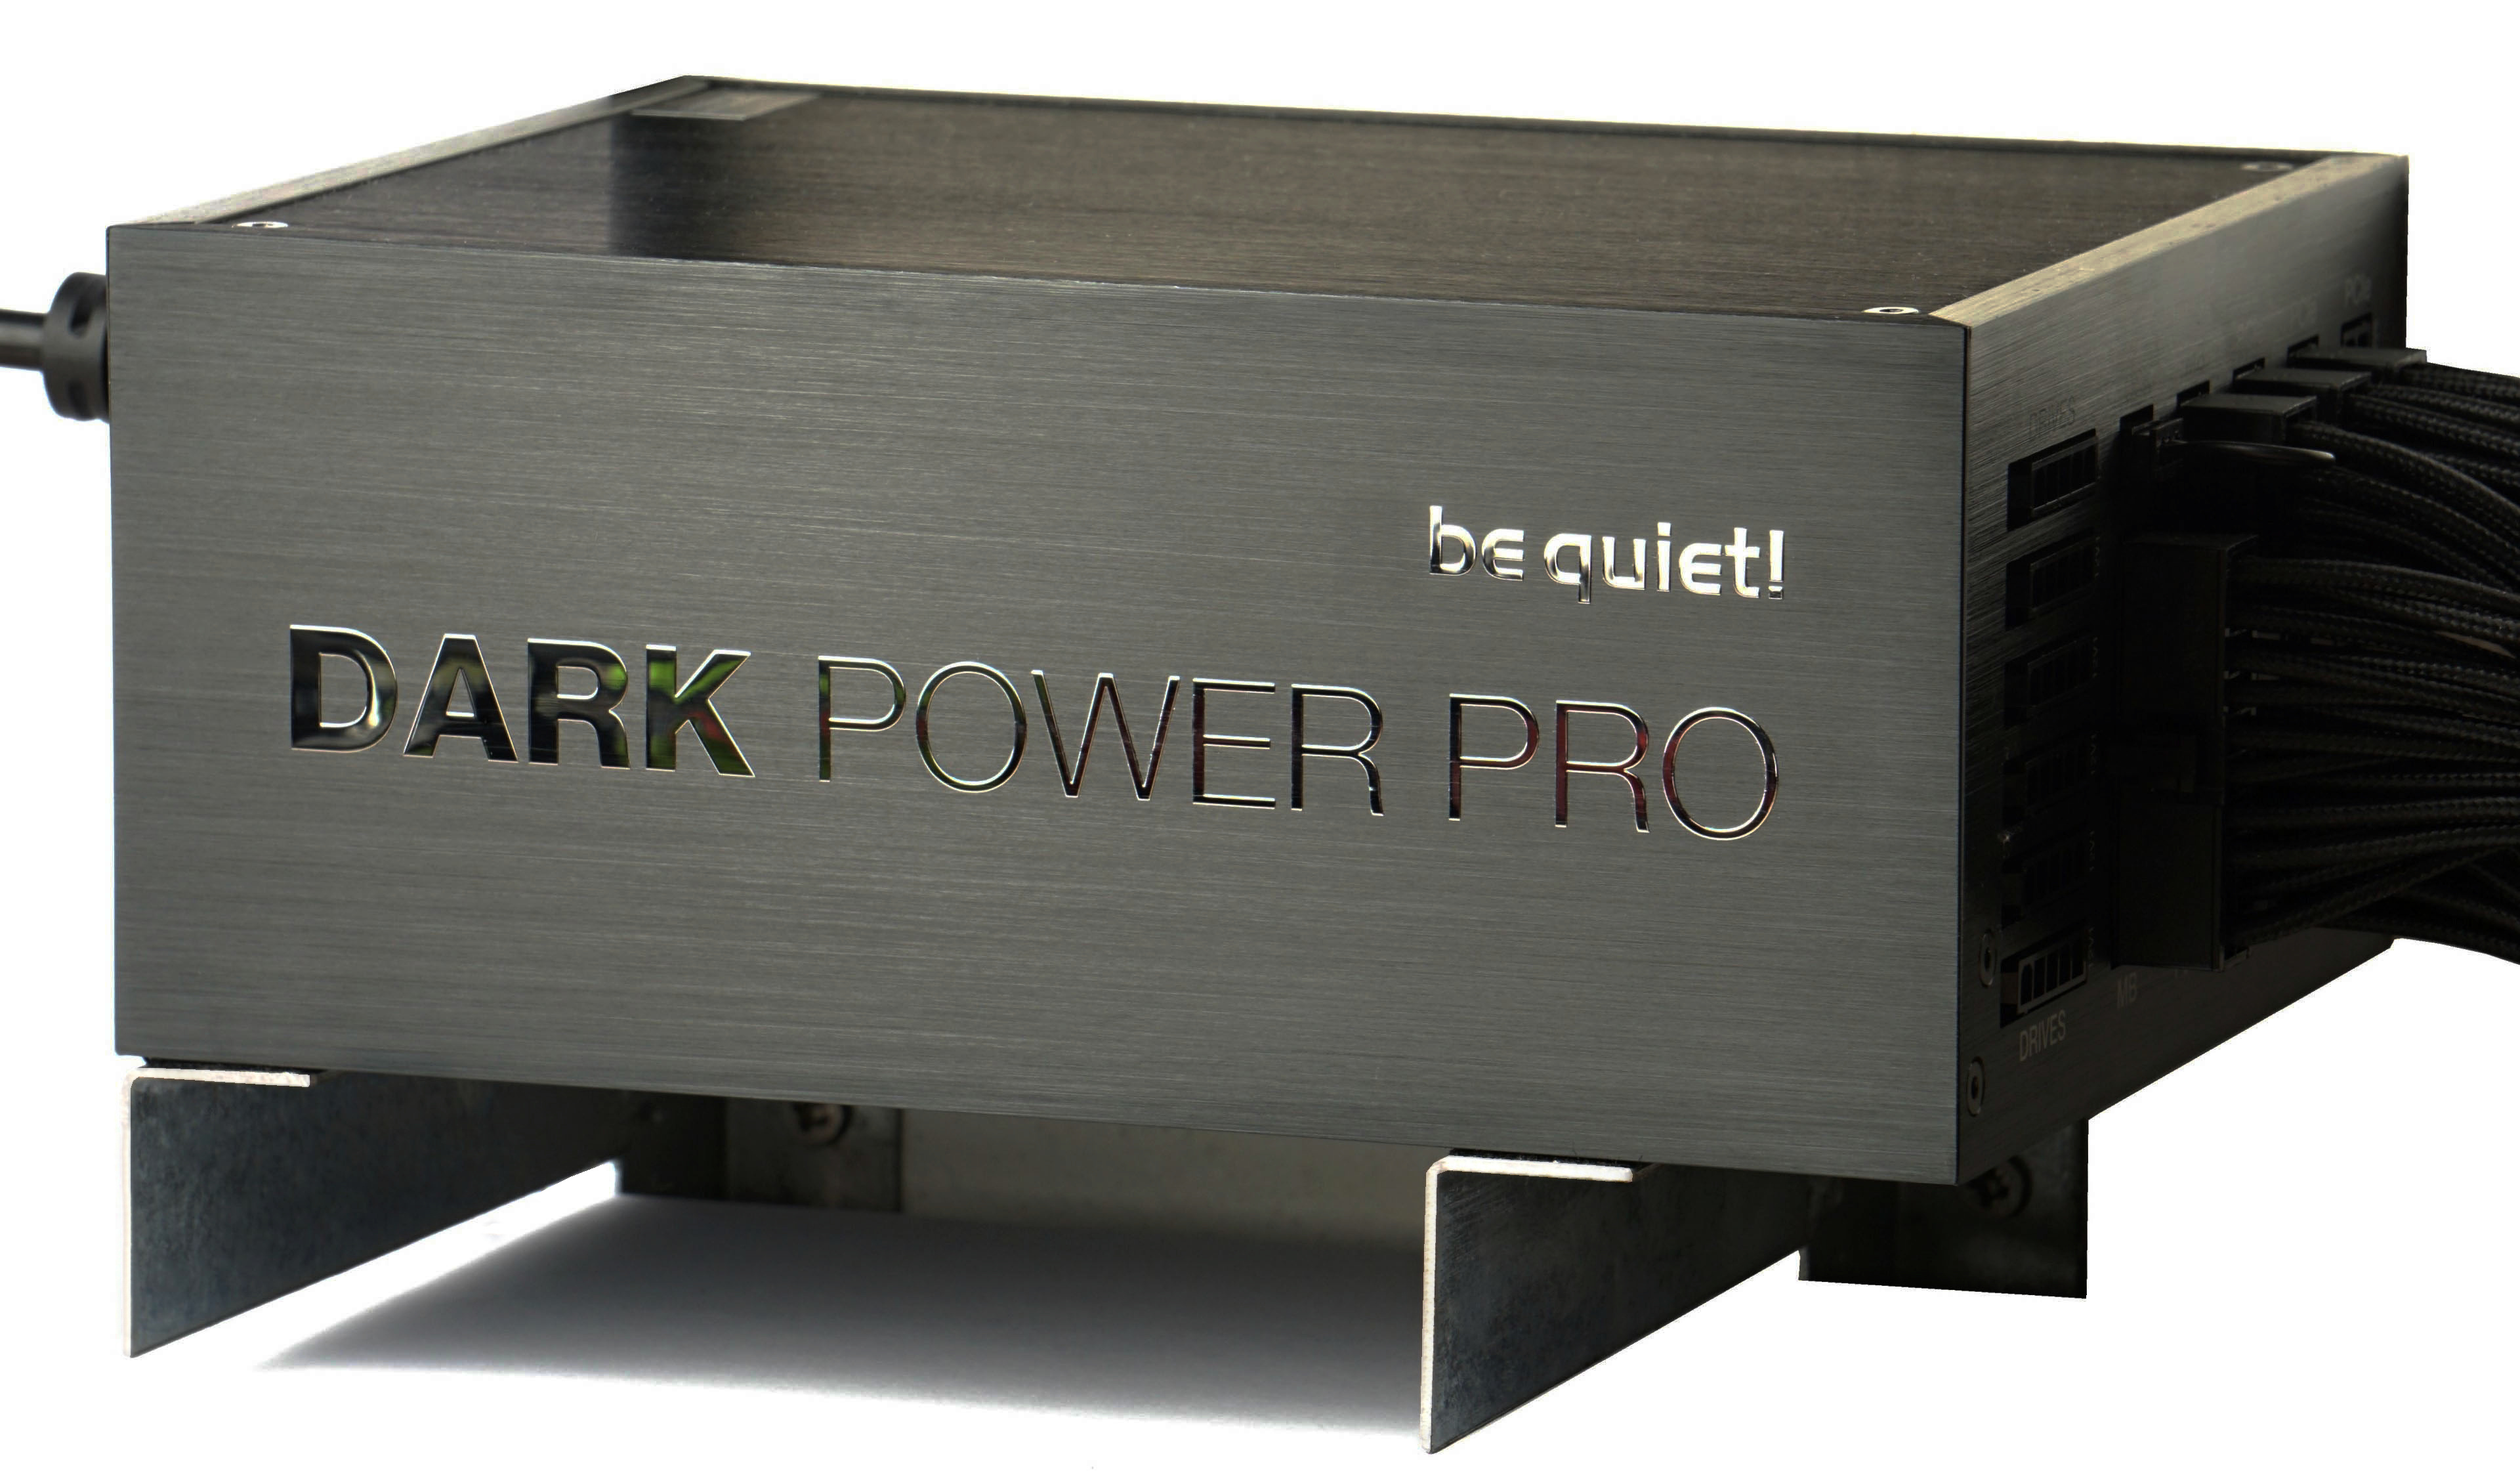
| Napájací zdroj | BeQuiet! Dark Power Pro 12 (1200 W) |
Note: Graphics drivers used at the time of testing: Nvidia GeForce 466.77 and OS Windows 10 build 19043
Most motherboards from the same classes look pretty much the same. While they differ in color scheme and heatsink shape, the layout, features, and overall operation (including power management) are like a carbon copy. The Biostar B660GTA goes upstream in many ways and presents an attractive option for those users who always find something lacking on boards in this price range.
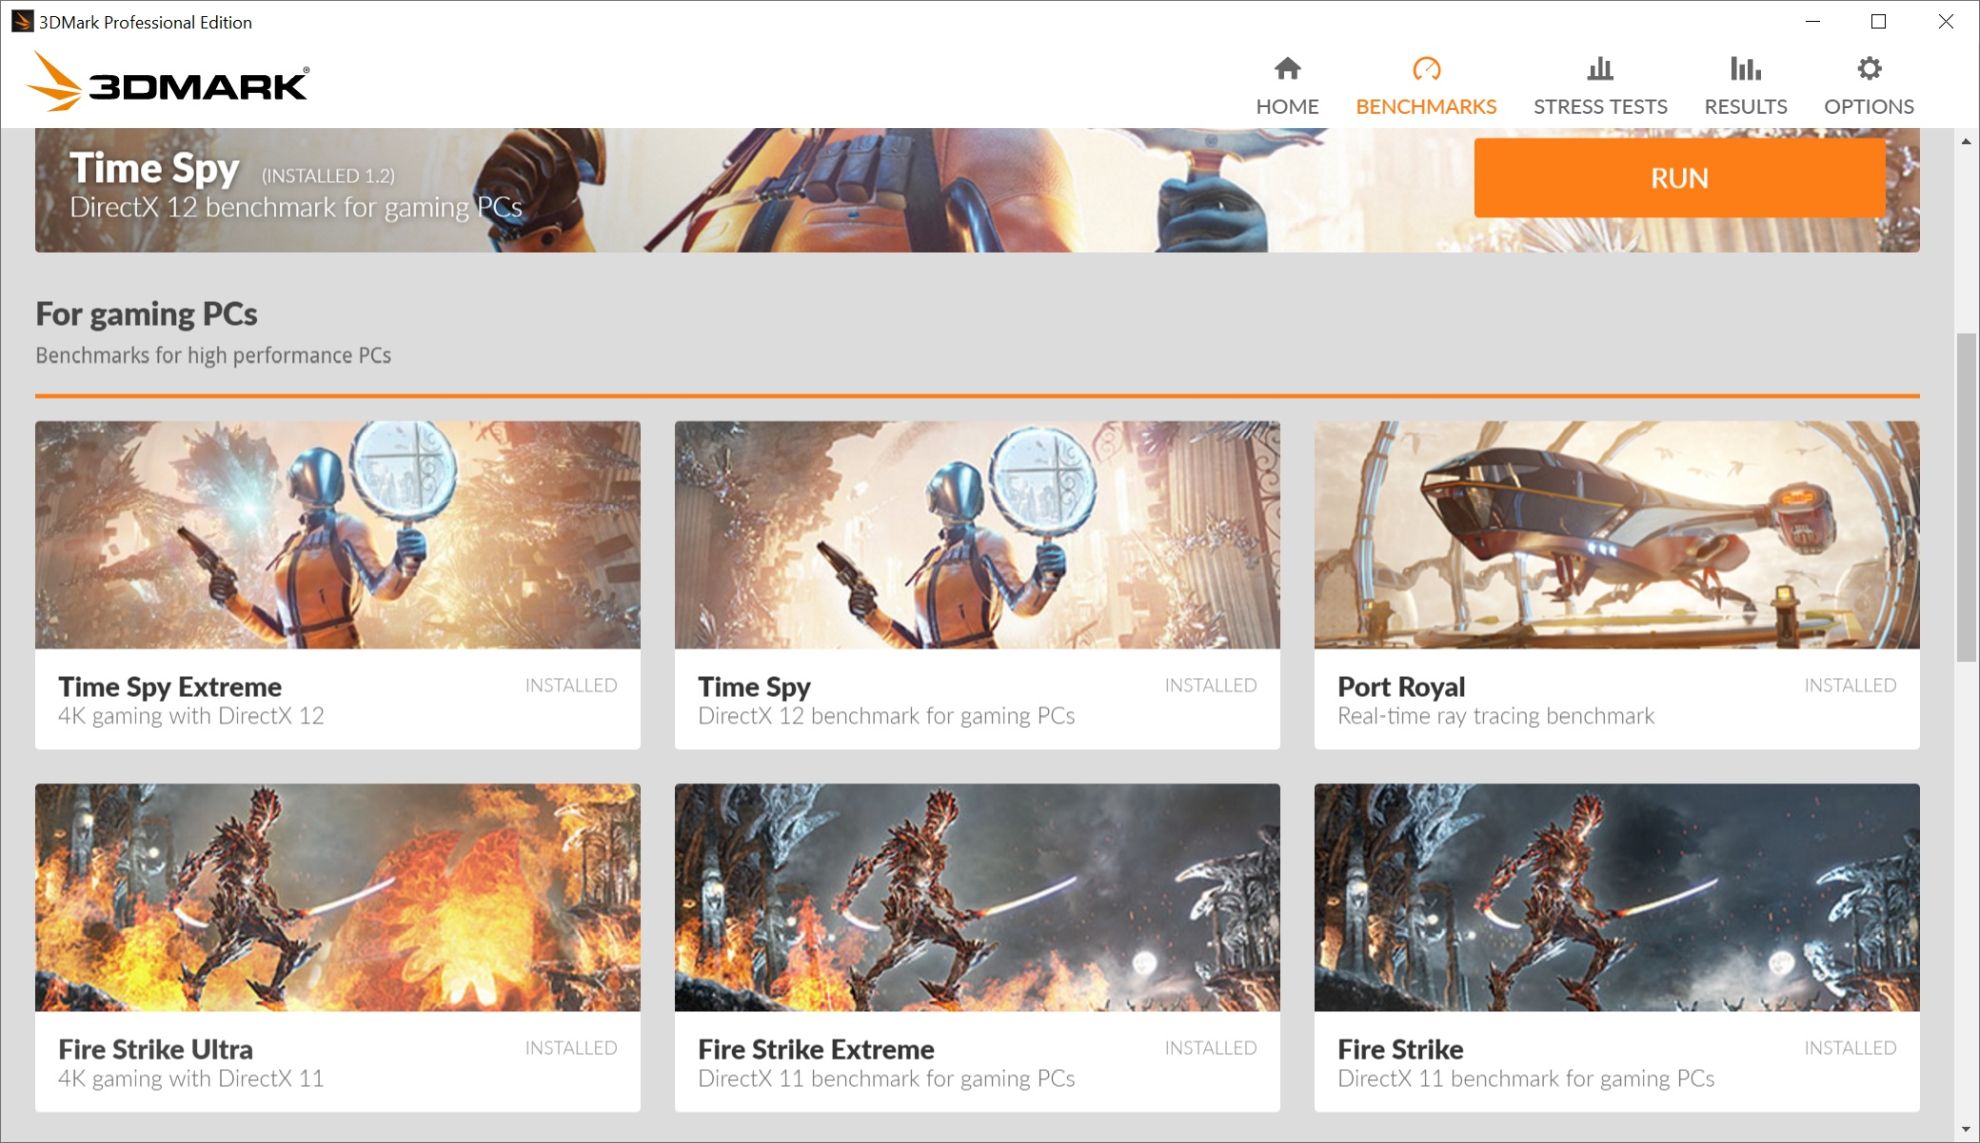
3DMark
We use 3DMark Professional for our tests and from the tests, Night Raid (DirectX 12), Fire Strike (DirectX 11) and Time Spy (DirectX 12). In the graphs you will find the CPU sub-scores, the combined scores, as well as the graphics scores. From this you can see to what extent a given CPU is limiting the graphics card.

Most motherboards from the same classes look pretty much the same. While they differ in color scheme and heatsink shape, the layout, features, and overall operation (including power management) are like a carbon copy. The Biostar B660GTA goes upstream in many ways and presents an attractive option for those users who always find something lacking on boards in this price range.
Borderlands 3

Test environment: resolution 1920 × 1080 px; graphics settings preset High; API DirectX 12; extra settings Anti-Aliasing: None; test scene: built-in benchmark.
Test environment: resolution 3840 × 2160 px; graphics settings preset Ultra; API DirectX 12; no extra settings; test scene: built-in benchmark.
Most motherboards from the same classes look pretty much the same. While they differ in color scheme and heatsink shape, the layout, features, and overall operation (including power management) are like a carbon copy. The Biostar B660GTA goes upstream in many ways and presents an attractive option for those users who always find something lacking on boards in this price range.
F1 2020
Test environment: resolution 1920 × 1080 px; graphics settings preset High; API DirectX 12; extra settings Anti-Aliasing: off, Skidmarks Blending: off; test scene: built-in benchmark (Australia, Clear/Dry, Cycle).
Test environment: resolution 3840 × 2160 px; graphics settings preset Ultra High; API DirectX 12; extra settings Anti-Aliasing: TAA, Skidmarks Blending: off; test scene: built-in benchmark (Australia, Clear/Dry, Cycle).
Most motherboards from the same classes look pretty much the same. While they differ in color scheme and heatsink shape, the layout, features, and overall operation (including power management) are like a carbon copy. The Biostar B660GTA goes upstream in many ways and presents an attractive option for those users who always find something lacking on boards in this price range.
Metro Exodus

Test environment: resolution 1920 × 1080 px; graphics settings preset High; API DirectX 12; no extra settings; test scene: built-in benchmark.

Test environment: resolution 3840 × 2160 px; graphics settings preset Extreme; API DirectX 12; no extra settings; test scene: built-in benchmark.

Most motherboards from the same classes look pretty much the same. While they differ in color scheme and heatsink shape, the layout, features, and overall operation (including power management) are like a carbon copy. The Biostar B660GTA goes upstream in many ways and presents an attractive option for those users who always find something lacking on boards in this price range.
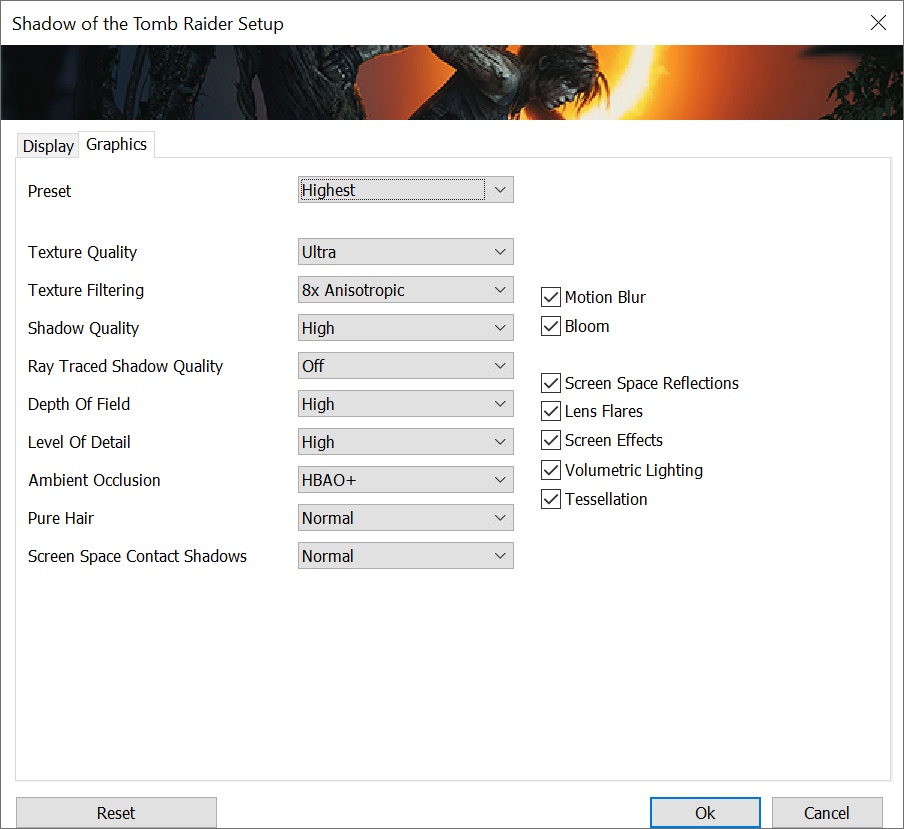
Shadow of the Tomb Raider
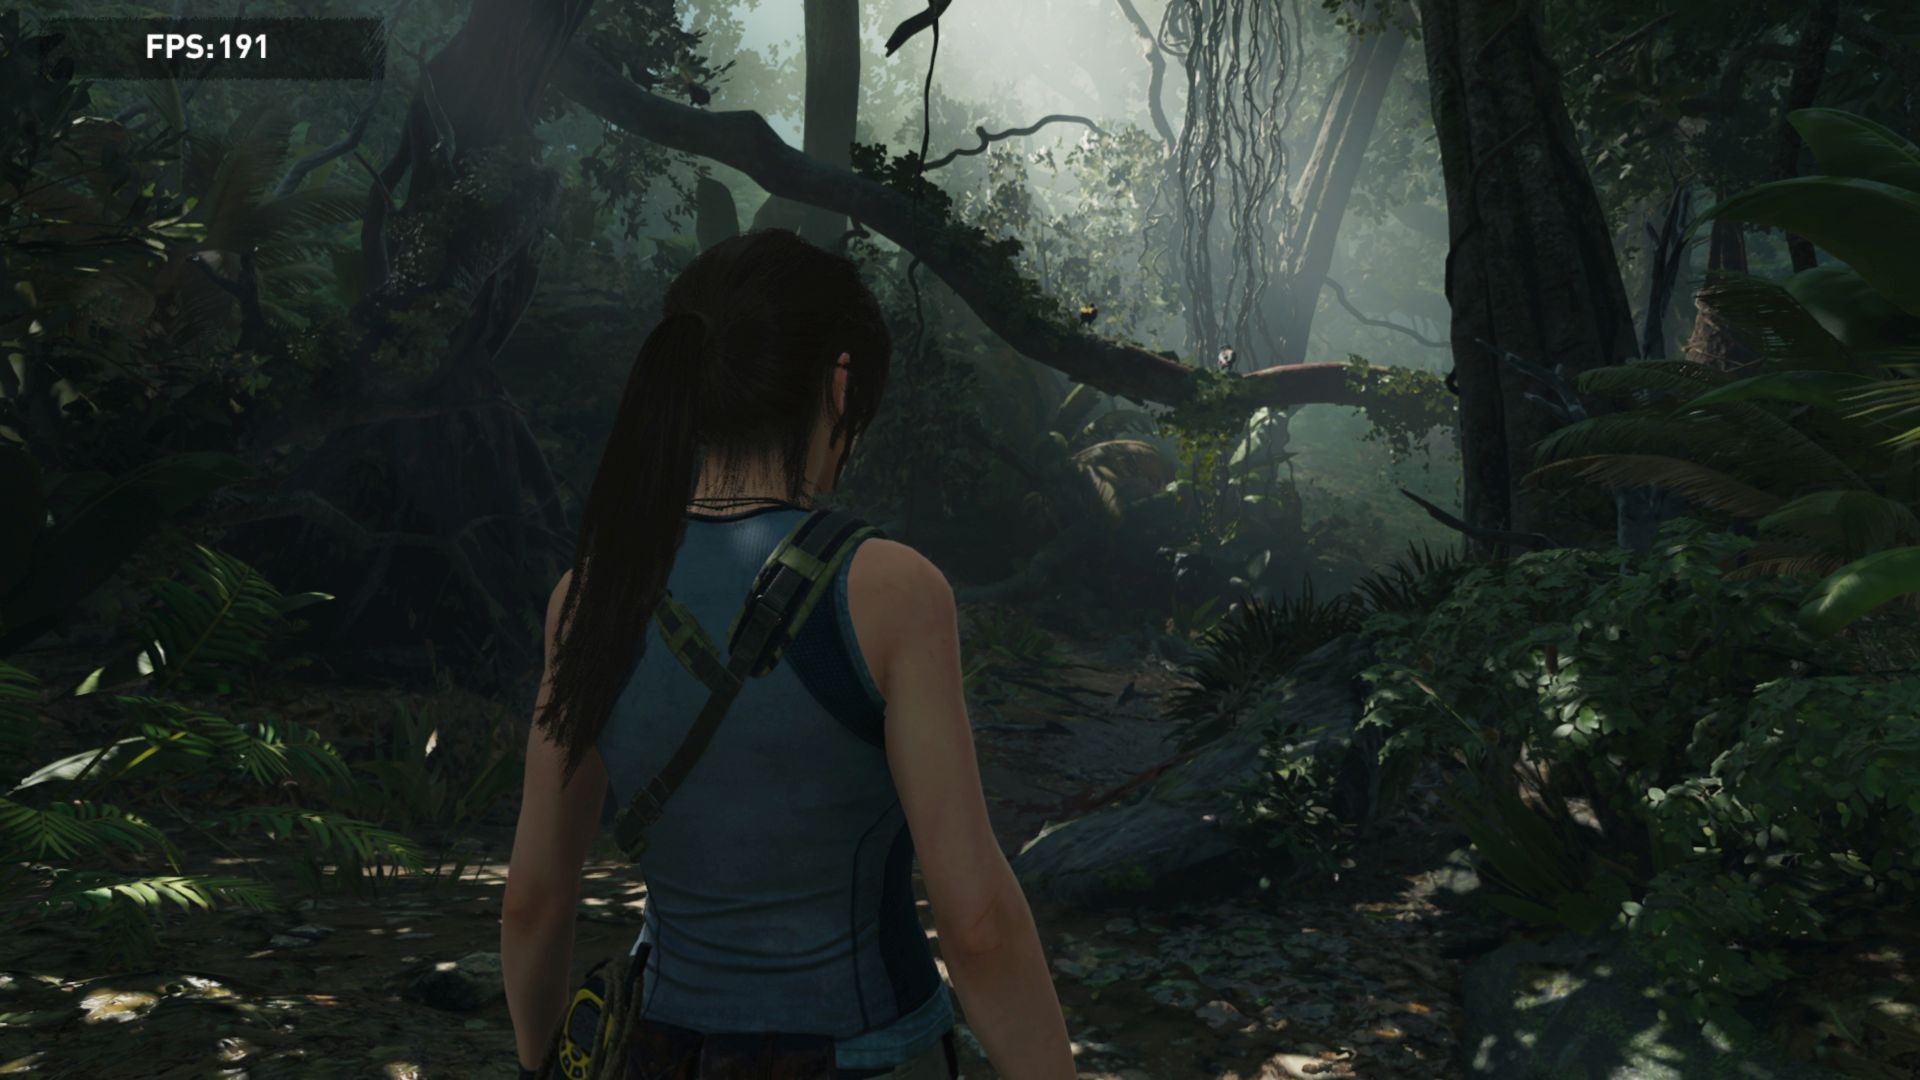
Test environment: resolution 1920 × 1080 px; graphics settings preset High; API DirectX 12; extra settings Anti-Aliasing: off; test scene: built-in benchmark.
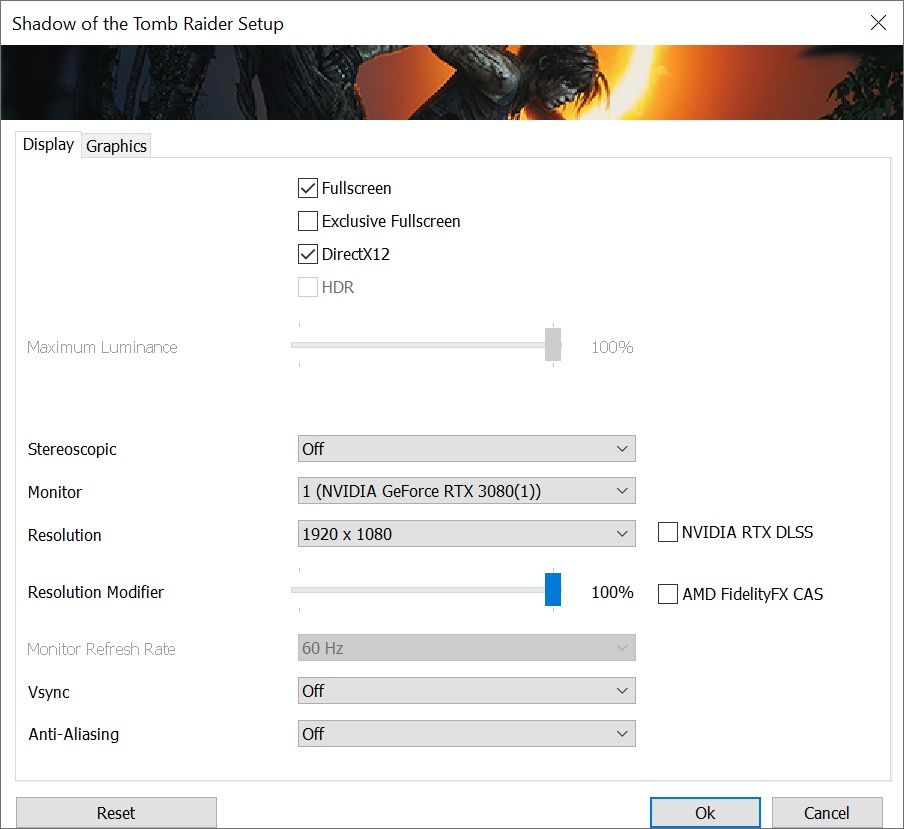


Test environment: resolution 3840 × 2160 px; graphics settings preset Highest; API DirectX 12; extra settings Anti-Aliasing: TAA; test scene: built-in benchmark.
Most motherboards from the same classes look pretty much the same. While they differ in color scheme and heatsink shape, the layout, features, and overall operation (including power management) are like a carbon copy. The Biostar B660GTA goes upstream in many ways and presents an attractive option for those users who always find something lacking on boards in this price range.
Total War Saga: Troy
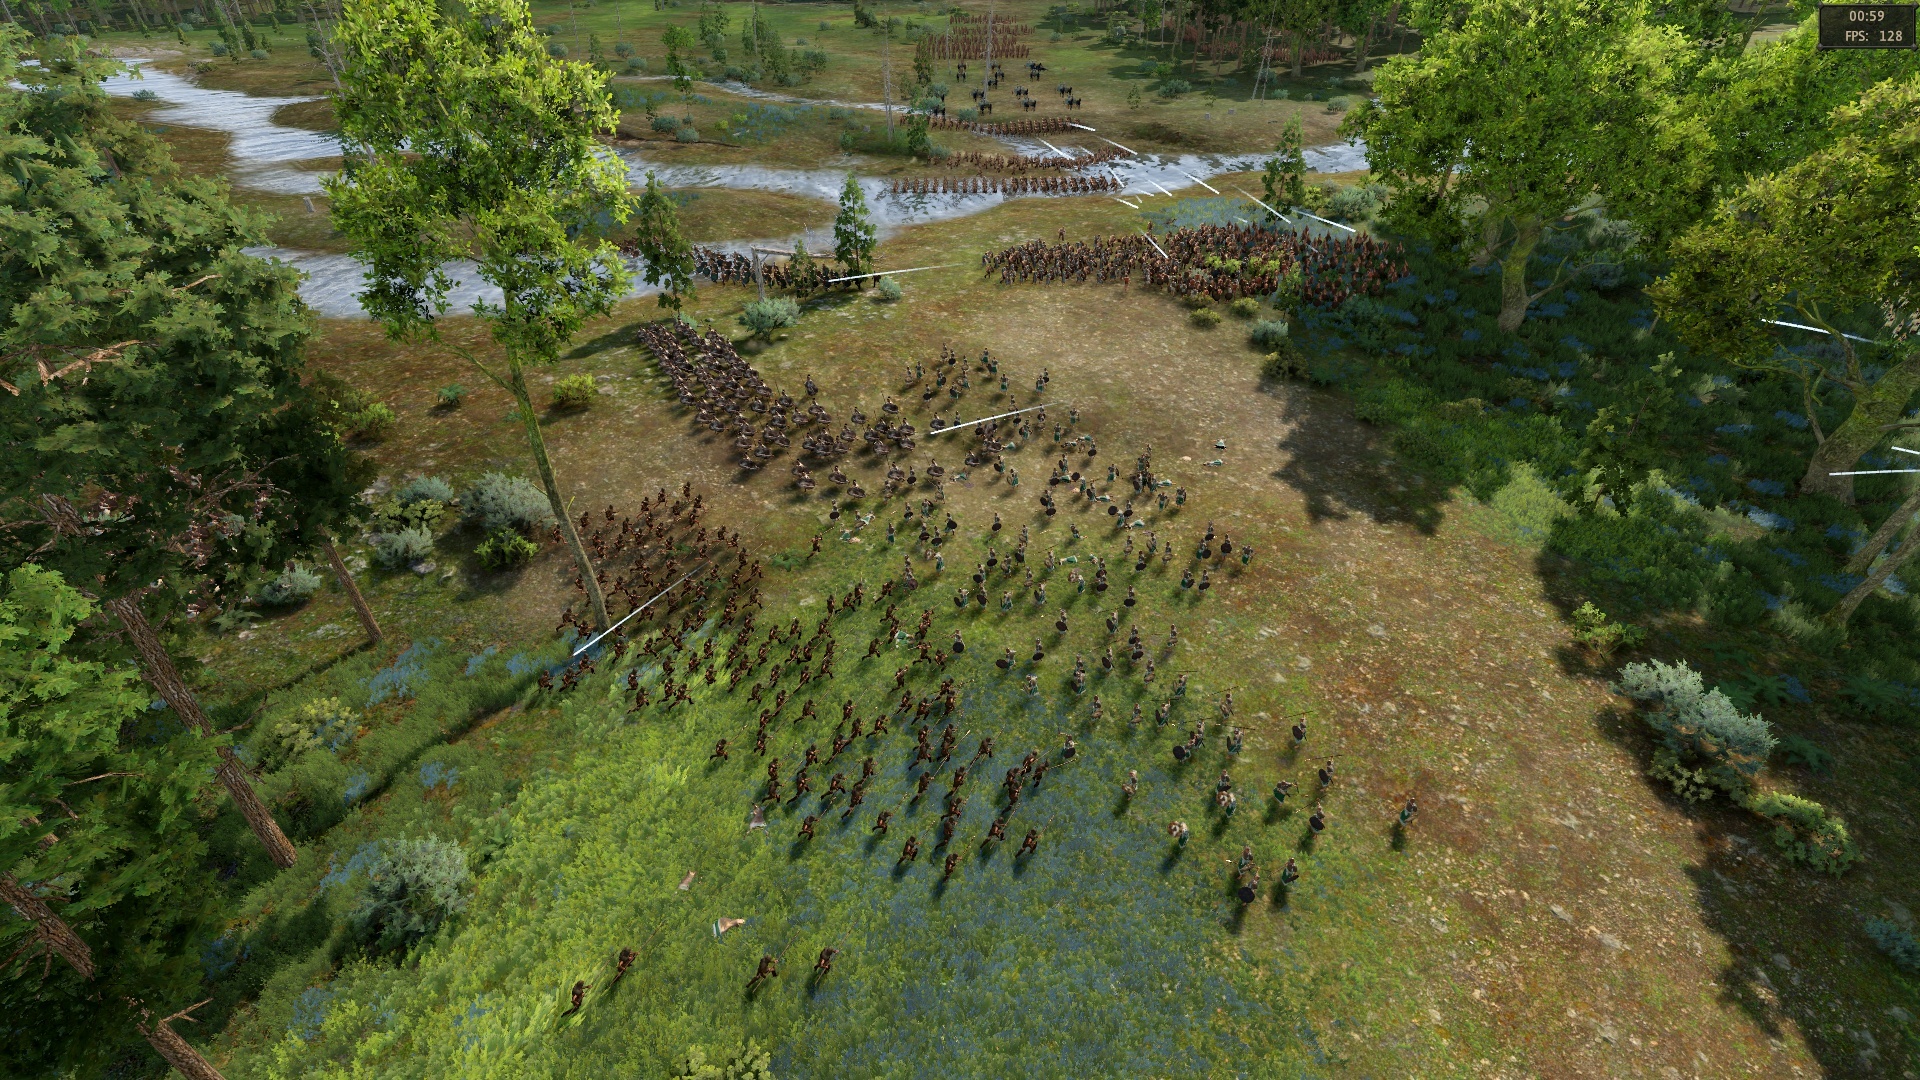
Test environment: resolution 1920 × 1080 px; graphics settings preset High; API DirectX 11; no extra settings; test scene: built-in benchmark.
Test environment: resolution 3840 × 2160 px; graphics settings preset Ultra; API DirectX 11; no extra settings; test scene: built-in benchmark.

Most motherboards from the same classes look pretty much the same. While they differ in color scheme and heatsink shape, the layout, features, and overall operation (including power management) are like a carbon copy. The Biostar B660GTA goes upstream in many ways and presents an attractive option for those users who always find something lacking on boards in this price range.
PCMark
Geekbench
Most motherboards from the same classes look pretty much the same. While they differ in color scheme and heatsink shape, the layout, features, and overall operation (including power management) are like a carbon copy. The Biostar B660GTA goes upstream in many ways and presents an attractive option for those users who always find something lacking on boards in this price range.
Speedometer (2.0) and Octane (2.0)
Test environment: To ensure that results are not affected by web browser updates over time, we use a portable version of Google Chrome (91.0.472.101), a 64-bit build. Hardware GPU acceleration is enabled as well, as it is by default for every user.
Note: The values in the graphs represent the average of the scores obtained in the subtasks, which are grouped according to their nature into seven categories (Core language features, Memory and GC, Strings and arrays, Virtual machine and GC, Loading and Parsing, Bit and Math operations, and Compiler and GC latency).
Most motherboards from the same classes look pretty much the same. While they differ in color scheme and heatsink shape, the layout, features, and overall operation (including power management) are like a carbon copy. The Biostar B660GTA goes upstream in many ways and presents an attractive option for those users who always find something lacking on boards in this price range.
Cinebench R20
Cinebench R23
Blender@Cycles
Test environment: We use well distributed projects BMW (510 tiles) and Classroom (2040 tiles) and the renderer Cycles. Render settings are set to None, with which all the work falls on the CPU.
LuxRender (SPECworkstation 3.1)
Most motherboards from the same classes look pretty much the same. While they differ in color scheme and heatsink shape, the layout, features, and overall operation (including power management) are like a carbon copy. The Biostar B660GTA goes upstream in many ways and presents an attractive option for those users who always find something lacking on boards in this price range.
Adobe Premiere Pro (PugetBench)
Test environment: set of PugetBench tests. App version of Adobe Premiere Pro is 15.2.
Most motherboards from the same classes look pretty much the same. While they differ in color scheme and heatsink shape, the layout, features, and overall operation (including power management) are like a carbon copy. The Biostar B660GTA goes upstream in many ways and presents an attractive option for those users who always find something lacking on boards in this price range.
DaVinci Resolve Studio (PugetBench)
Test environment: set of PugetBench tests, test type: standard. App version of DaVinci Resolve Studio is 17.2.1 (build 12).
Most motherboards from the same classes look pretty much the same. While they differ in color scheme and heatsink shape, the layout, features, and overall operation (including power management) are like a carbon copy. The Biostar B660GTA goes upstream in many ways and presents an attractive option for those users who always find something lacking on boards in this price range.
Graphics effects: Adobe After Effects
Test environment: set of PugetBench tests. App version of Adobe After Effects is 18.2.1.
Most motherboards from the same classes look pretty much the same. While they differ in color scheme and heatsink shape, the layout, features, and overall operation (including power management) are like a carbon copy. The Biostar B660GTA goes upstream in many ways and presents an attractive option for those users who always find something lacking on boards in this price range.
HandBrake
Test environment: For video conversion we’re using a 4K video LG Demo Snowboard with a 43,9 Mb/s bitrate. AVC (x264) and HEVC (x265) profiles are set for high quality and encoder profiles are “slow”. HandBrake version is 1.3.3 (2020061300).
x264 and x265 benchmarks
Naposledy sme sa zaoberali základnou doskou, ktorá, ktorá je aj vďaka nižšej cene vhodná najmä na použitie s lacnejšími procesormi. Teraz tu máme o zhruba 50 eur drahšiu Gigabyte B660 Aorus Master DDR4. Príplatok tu má jasné opodstatnenie a odzkadľuje sa na lepších vlastnostiach. Napájacia kaskáda je výrazne efektívnejšia, chladiče sú účinnejšie a výbava je celkovo bohatšia, vrátane svetielok.
Audio encoding
Test environment: Audio encoding is done using command line encoders, we measure the time it takes for the conversion to finish. The same 42-minute long 16-bit WAV file (stereo) with 44.1 kHz is always used (Love Over Gold by Dire Straits album rip in a single audio file).
Encoder settings are selected to achieve maximum or near maximum compression. The bitrate is relatively high, with the exception of lossless FLAC of about 200 kb/s.
Note: These tests measure single-thread performance.
FLAC: reference encoder 1.3.2, 64-bit build. Launch options: flac.exe -s -8 -m -e -p -f
MP3: encoder lame3.100.1, 64-bit build (Intel 19 Compiler) from RareWares. Launch options: lame.exe -S -V 0 -q 0
AAC: uses Apple QuickTime libraries, invoked through the application from the command line, QAAC 2.72, 64-bit build, Intel 19 Compiler (does not require installation of the whole Apple package). Launch options: qaac64.exe -V 100 -s -q 2
Opus:reference encoder 1.3.1, Launch options: opusenc.exe –comp 10 –quiet –vbr –bitrate 192
Most motherboards from the same classes look pretty much the same. While they differ in color scheme and heatsink shape, the layout, features, and overall operation (including power management) are like a carbon copy. The Biostar B660GTA goes upstream in many ways and presents an attractive option for those users who always find something lacking on boards in this price range.

Adobe Photoshop (PugetBench)
Test environment: set of PugetBench tests. App version of Adobe Photoshop is 22.4.2.
Affinity Photo (benchmark)
Test environment: built-in benchmark.
Topaz Labs AI apps
Topaz DeNoise AI, Gigapixel AI and Sharpen AI. These single-purpose applications are used for restoration of low-quality photos. Whether it is high noise (caused by higher ISO), raster level (typically after cropping) or when something needs extra focus. The AI performance is always used.
Test environment: As part of batch editing, 42 photos with a lower resolution of 1920 × 1280 px are processed, with the settings from the images above. DeNoise AI is in version 3.1.2, Gigapixel in 5.5.2 and Sharpen AI in 3.1.2.
Most motherboards from the same classes look pretty much the same. While they differ in color scheme and heatsink shape, the layout, features, and overall operation (including power management) are like a carbon copy. The Biostar B660GTA goes upstream in many ways and presents an attractive option for those users who always find something lacking on boards in this price range.
WinRAR 6.01
7-Zip 19.00
Most motherboards from the same classes look pretty much the same. While they differ in color scheme and heatsink shape, the layout, features, and overall operation (including power management) are like a carbon copy. The Biostar B660GTA goes upstream in many ways and presents an attractive option for those users who always find something lacking on boards in this price range.
TrueCrypt 7.1a
Aida64 (AES, SHA3)
Most motherboards from the same classes look pretty much the same. While they differ in color scheme and heatsink shape, the layout, features, and overall operation (including power management) are like a carbon copy. The Biostar B660GTA goes upstream in many ways and presents an attractive option for those users who always find something lacking on boards in this price range.
Aida64, FPU tests
FSI (SPECworkstation 3.1)
Kirchhoff migration (SPECworkstation 3.1)
Python36 (SPECworkstation 3.1)
SRMP (SPECworkstation 3.1)
Octave (SPECworkstation 3.1)
FFTW (SPECworkstation 3.1)
Convolution (SPECworkstation 3.1)
CalculiX (SPECworkstation 3.1)
Most motherboards from the same classes look pretty much the same. While they differ in color scheme and heatsink shape, the layout, features, and overall operation (including power management) are like a carbon copy. The Biostar B660GTA goes upstream in many ways and presents an attractive option for those users who always find something lacking on boards in this price range.
RodiniaLifeSci (SPECworkstation 3.1)
WPCcfd (SPECworkstation 3.1)
Poisson (SPECworkstation 3.1)
LAMMPS (SPECworkstation 3.1)
NAMD (SPECworkstation 3.1)
Most motherboards from the same classes look pretty much the same. While they differ in color scheme and heatsink shape, the layout, features, and overall operation (including power management) are like a carbon copy. The Biostar B660GTA goes upstream in many ways and presents an attractive option for those users who always find something lacking on boards in this price range.
Memory tests…
… and cache (L1, L2, L3)
Most motherboards from the same classes look pretty much the same. While they differ in color scheme and heatsink shape, the layout, features, and overall operation (including power management) are like a carbon copy. The Biostar B660GTA goes upstream in many ways and presents an attractive option for those users who always find something lacking on boards in this price range.
M.2 (SSD) slots speed
Most motherboards from the same classes look pretty much the same. While they differ in color scheme and heatsink shape, the layout, features, and overall operation (including power management) are like a carbon copy. The Biostar B660GTA goes upstream in many ways and presents an attractive option for those users who always find something lacking on boards in this price range.
USB ports speed
Most motherboards from the same classes look pretty much the same. While they differ in color scheme and heatsink shape, the layout, features, and overall operation (including power management) are like a carbon copy. The Biostar B660GTA goes upstream in many ways and presents an attractive option for those users who always find something lacking on boards in this price range.
Ethernet speed
Most motherboards from the same classes look pretty much the same. While they differ in color scheme and heatsink shape, the layout, features, and overall operation (including power management) are like a carbon copy. The Biostar B660GTA goes upstream in many ways and presents an attractive option for those users who always find something lacking on boards in this price range.<!–more→
Analysis of power draw (EPS + ATX connector) w/o power limits
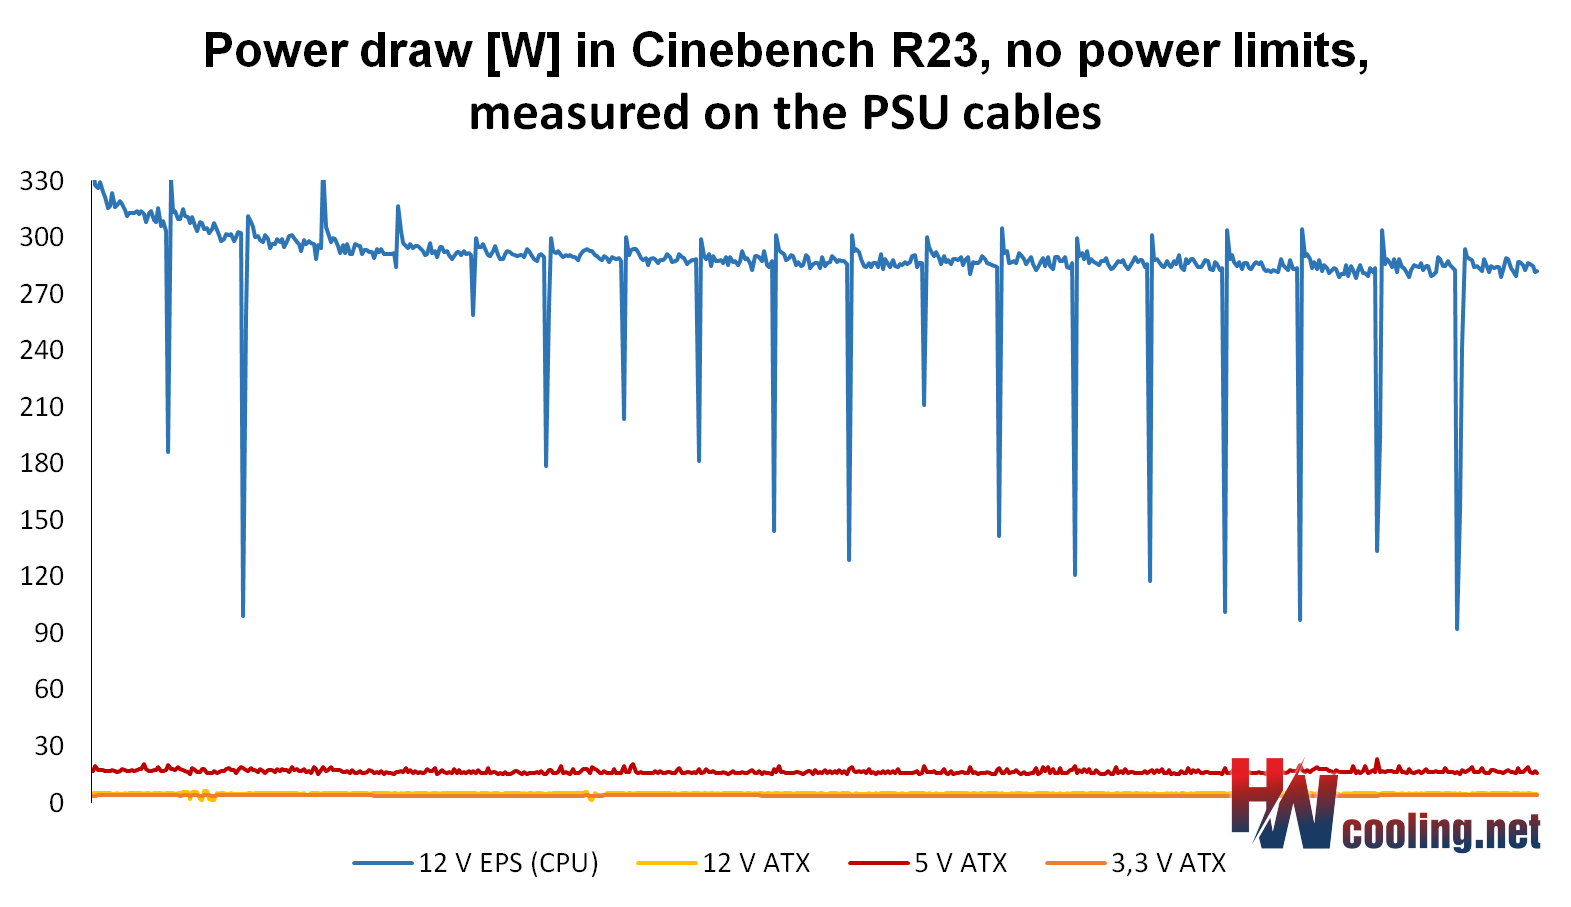
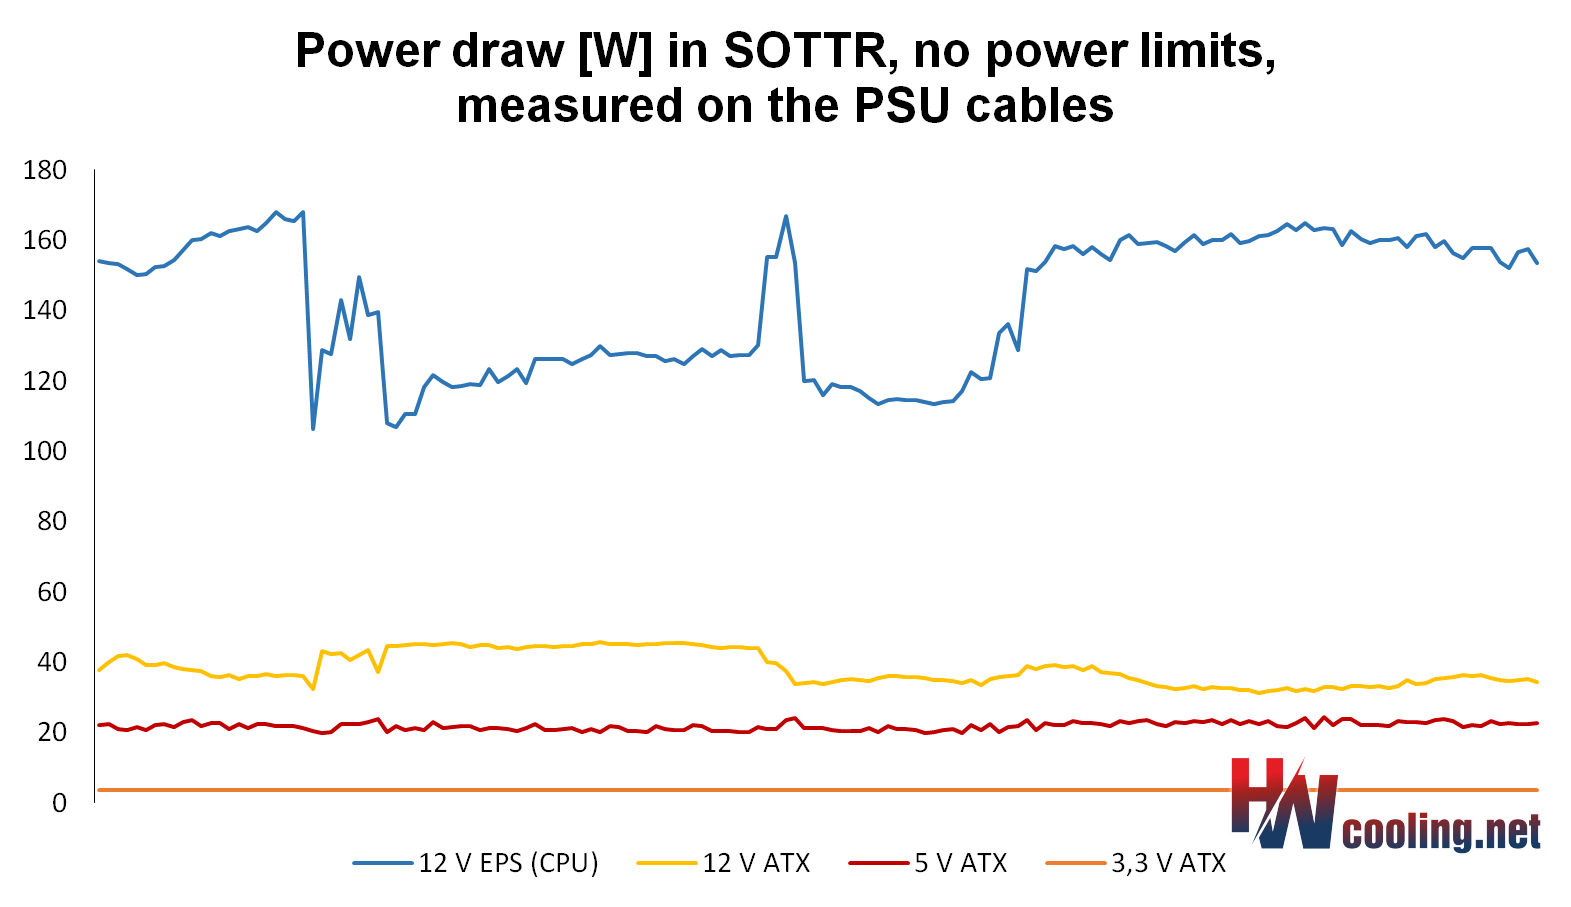
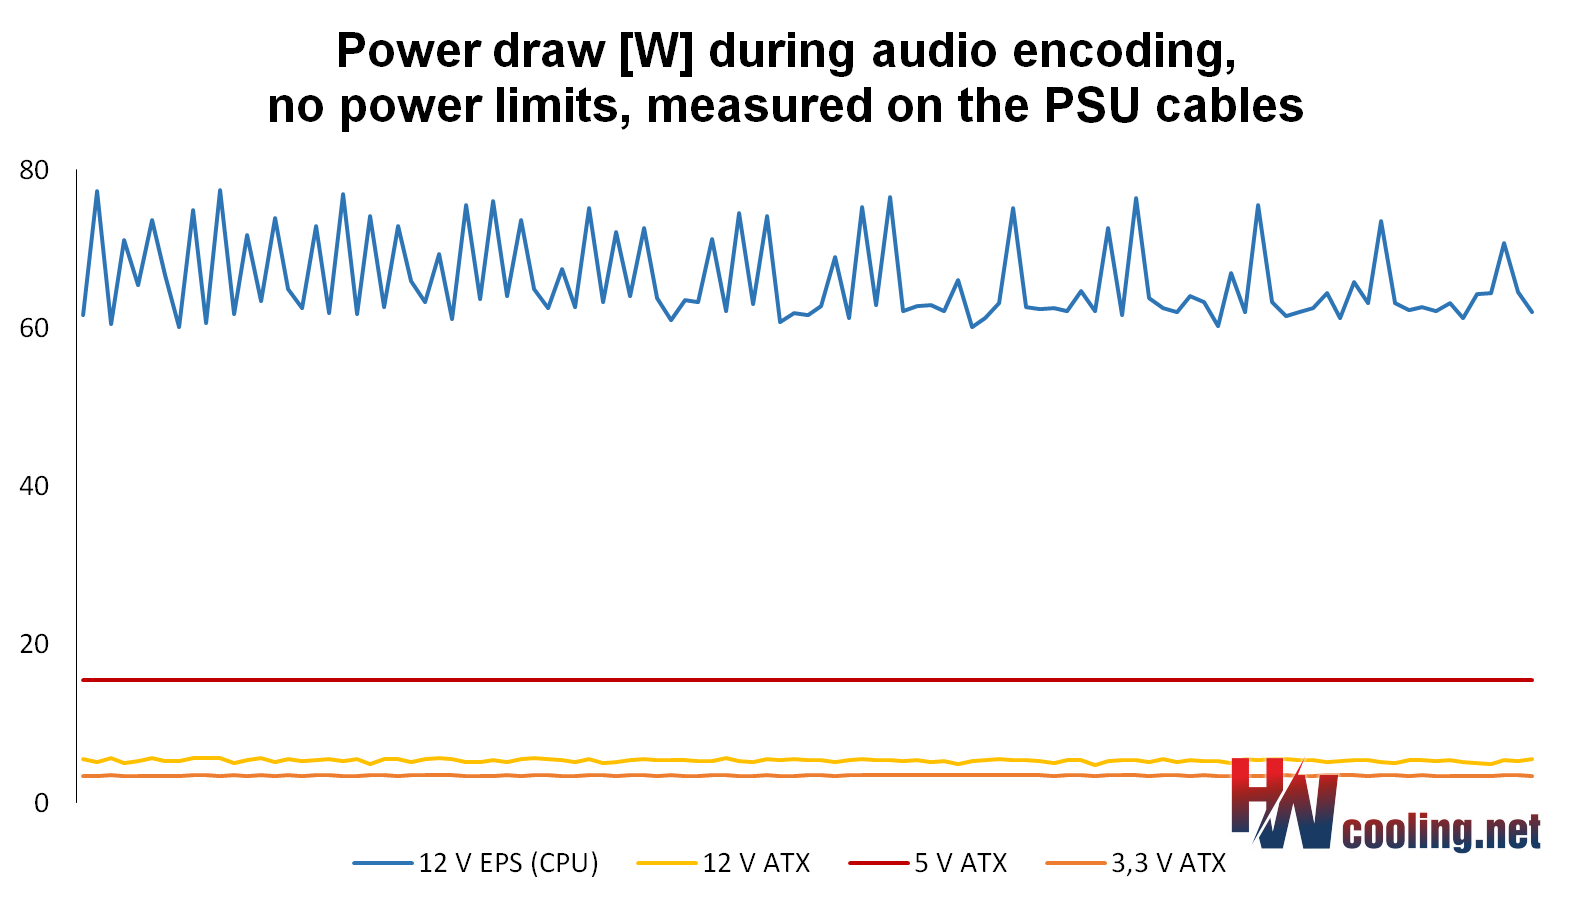
Most motherboards from the same classes look pretty much the same. While they differ in color scheme and heatsink shape, the layout, features, and overall operation (including power management) are like a carbon copy. The Biostar B660GTA goes upstream in many ways and presents an attractive option for those users who always find something lacking on boards in this price range.
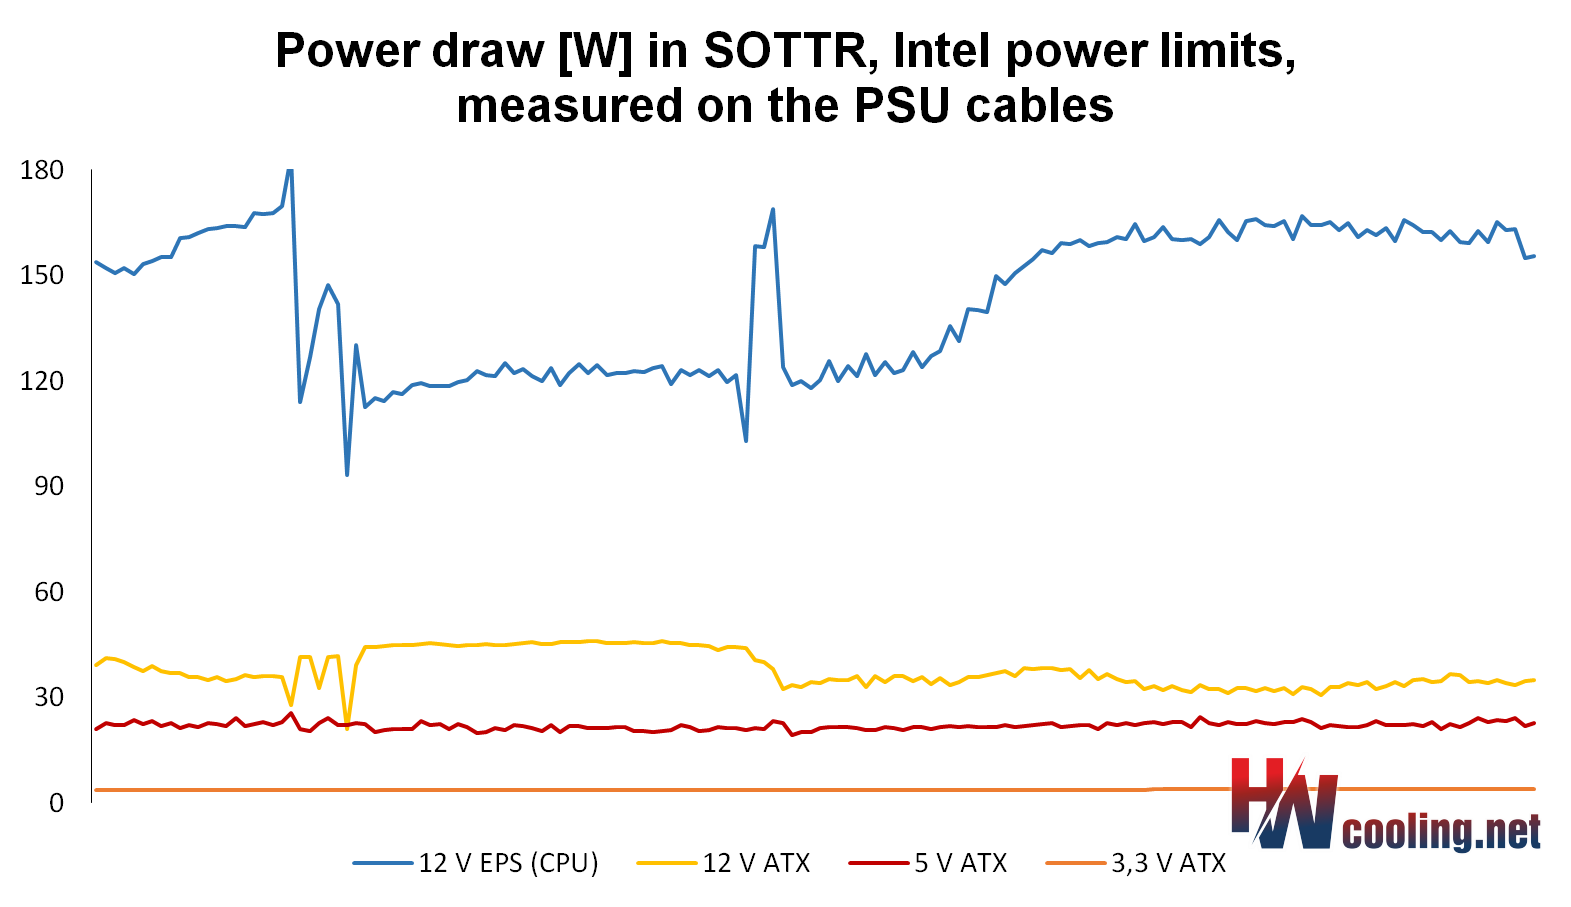
Analysis of power draw (EPS + ATX connector) with Intel’s power limits
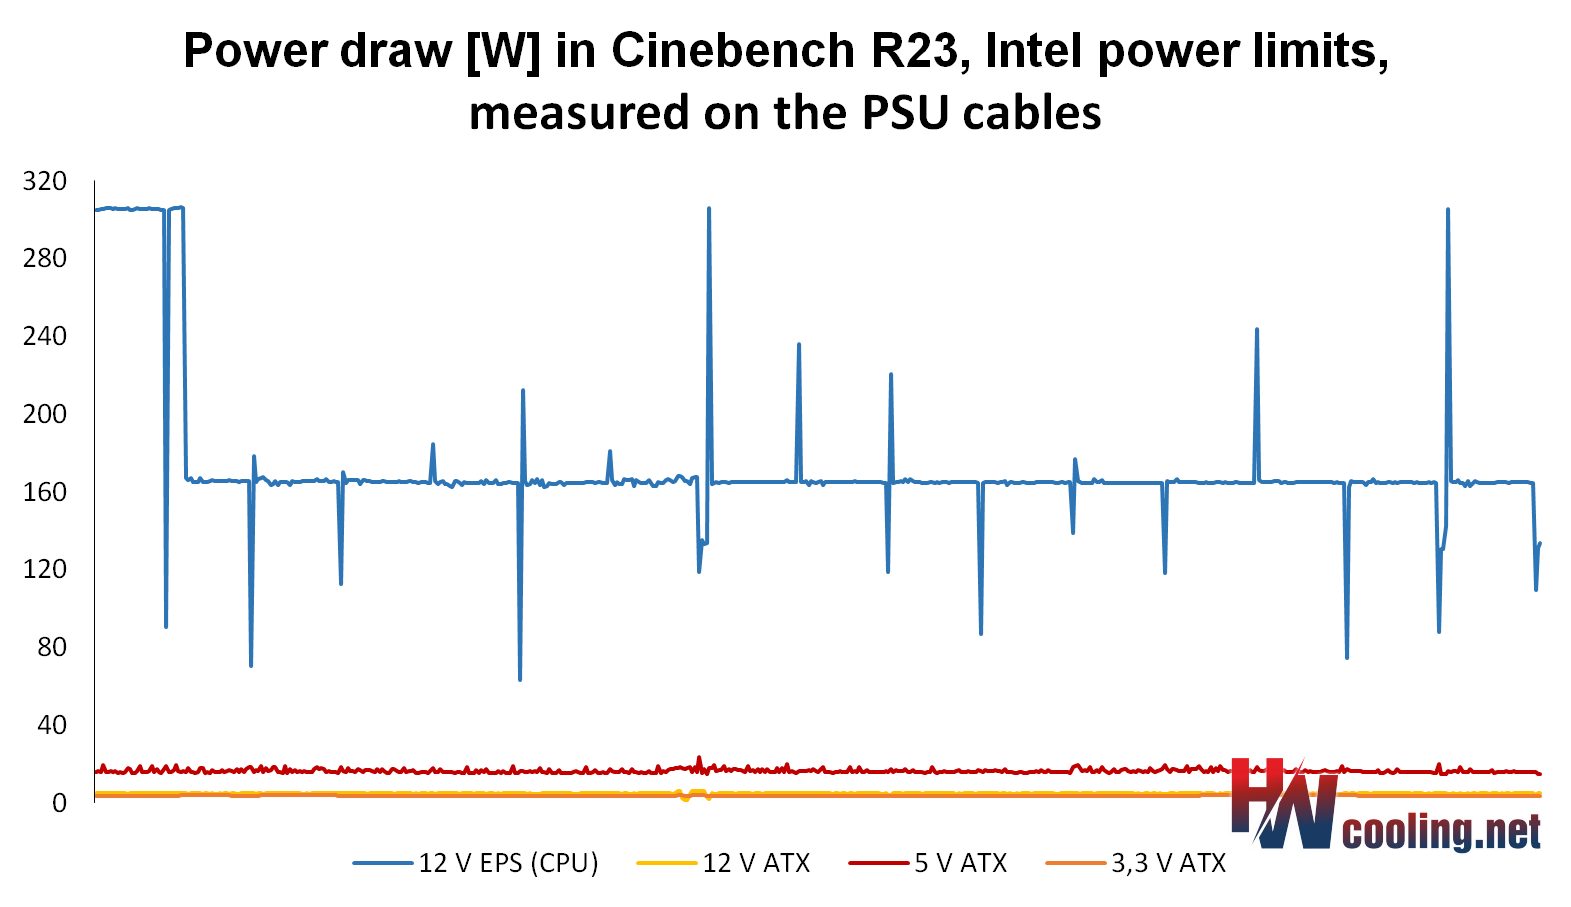
Most motherboards from the same classes look pretty much the same. While they differ in color scheme and heatsink shape, the layout, features, and overall operation (including power management) are like a carbon copy. The Biostar B660GTA goes upstream in many ways and presents an attractive option for those users who always find something lacking on boards in this price range.
Total power draw w/o power limits…
… and with Intel’s power limits
Most motherboards from the same classes look pretty much the same. While they differ in color scheme and heatsink shape, the layout, features, and overall operation (including power management) are like a carbon copy. The Biostar B660GTA goes upstream in many ways and presents an attractive option for those users who always find something lacking on boards in this price range.
Achieved CPU clock speed w/o power limits…
… and with Intel’s power limits
Most motherboards from the same classes look pretty much the same. While they differ in color scheme and heatsink shape, the layout, features, and overall operation (including power management) are like a carbon copy. The Biostar B660GTA goes upstream in many ways and presents an attractive option for those users who always find something lacking on boards in this price range.
CPU temperatures w/o power limits…
… and with Intel’s power limits
Most motherboards from the same classes look pretty much the same. While they differ in color scheme and heatsink shape, the layout, features, and overall operation (including power management) are like a carbon copy. The Biostar B660GTA goes upstream in many ways and presents an attractive option for those users who always find something lacking on boards in this price range.
VRM temperatures w/o power limits…
… and with Intel’s power limits
Most motherboards from the same classes look pretty much the same. While they differ in color scheme and heatsink shape, the layout, features, and overall operation (including power management) are like a carbon copy. The Biostar B660GTA goes upstream in many ways and presents an attractive option for those users who always find something lacking on boards in this price range.
SSD temperatures
Most motherboards from the same classes look pretty much the same. While they differ in color scheme and heatsink shape, the layout, features, and overall operation (including power management) are like a carbon copy. The Biostar B660GTA goes upstream in many ways and presents an attractive option for those users who always find something lacking on boards in this price range.
Chipset temperatures (south bridge)
Most motherboards from the same classes look pretty much the same. While they differ in color scheme and heatsink shape, the layout, features, and overall operation (including power management) are like a carbon copy. The Biostar B660GTA goes upstream in many ways and presents an attractive option for those users who always find something lacking on boards in this price range.
Conclusion
For whom is the Biostar B660GTA interesting? First and foremost, for users who appreciate a high number of SATA connectors or DVI-D video output and don’t mind only five connectors for connecting fans. There are more of those advantages over some other boards, of course, but whether they’re worth the 50-euro premium over the Asus TUF Gaming B660 Plus WiFi D4 we dare not claim.
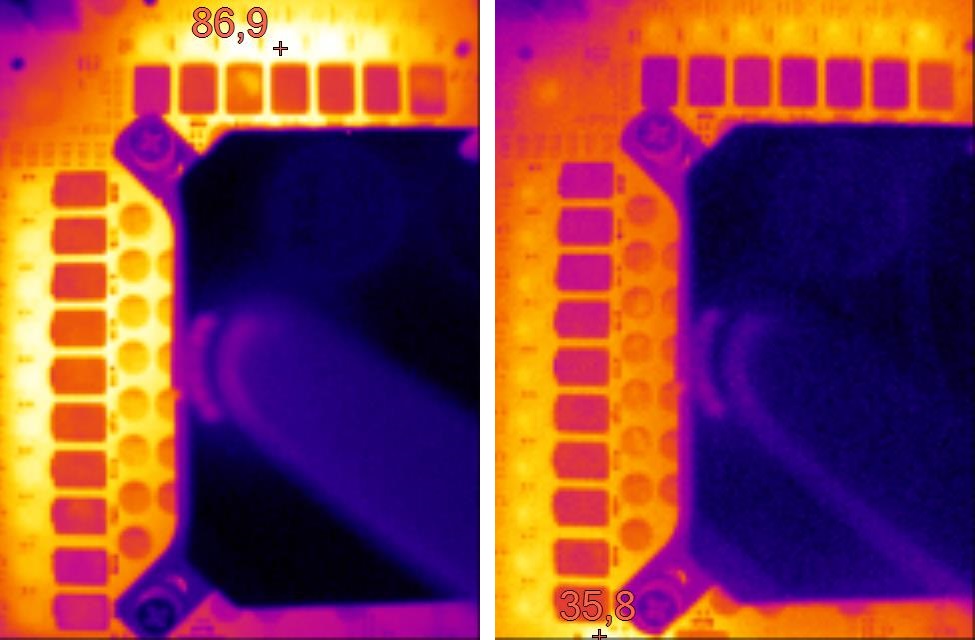
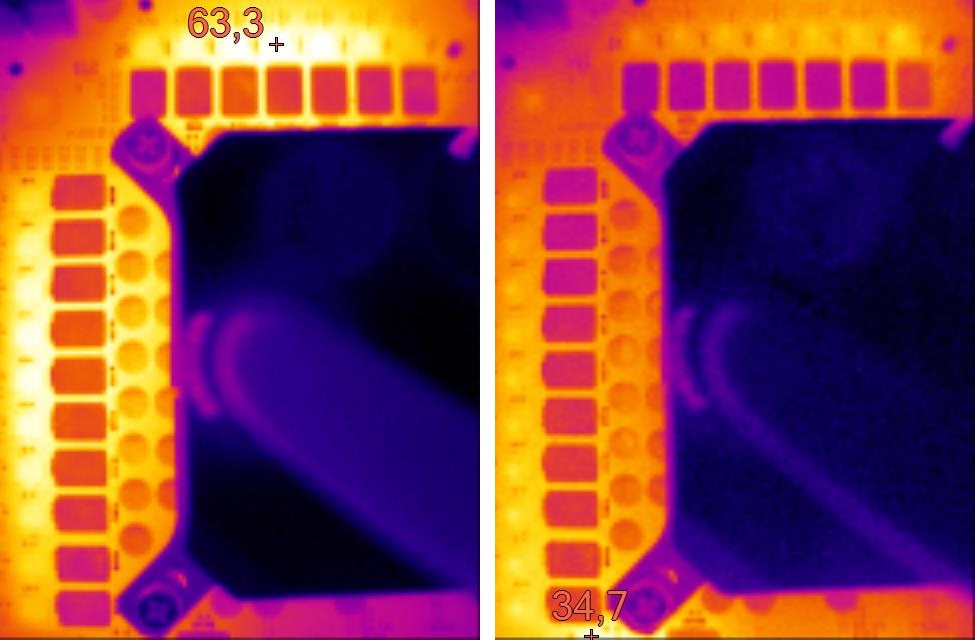
Compared to the above mentioned board, the B660GTA’s CPU power delivery efficiency, which is even a few percent lower, is a bit disappointing. Certainly, with more low-power processors, for which this board makes more sense, the differences disappear. Measurements with the Core i9-12900K limited to 125 W/TDP show this. But even under these conditions, the Biostar board doesn’t match the Gigabyte B660 Aorus Master DDR4 for similar money in this regard. Compared to the TUF Gaming B660 Plus WiFi D4, however, it has the advantage of a more even load on the voltage regulators. While the average temperature on them is virtually the same, the hotspots on the B660GTA are some ten degrees Celsius lower at around 290 W. This way, the Biostar board doesn’t get into trouble due to critically high temperatures and is better prepared for the more tropical ambient air.
Remarkably, in a “hard” single-threaded workload, the Biostar B660GTA gets the best results with the Core i9-12900K.Both in Cinebench R20/23 and in Geekbench. But this is no longer the case in web or office environments, which are also single-threaded but typically lower load. For live H.264 playback in Adobe Premiere Pro or encoding audio recordings, the Biostar board is already in the lead. However, this is only with the use of a more powerful processor, with the Core i5-12400, it no longer excels in this way. At least not in terms of single-threaded performance. The B660GTA achieves significantly better results with Core i5 than Core i9 in WinRAR, but also when encoding video (x265) in HandBrake or while gaming in Shadow of the Tomb Raider in Full HD (i.e. at a resolution where CPU performance is more prominent). But these are always relatively small differences and there are never any unnatural fluctuations in performance.

The power and clock speed managements are also worth a more detailed analysis. Of the boards tested so far, this is the only one that achieves lower CPU core clock speeds on average in games than in rendering. This represents a naturally higher load, which also results in significantly higher power draw, and the processor usually ends up at lower clock speeds mainly due to the negative offset of the multiplier for AVX instructions. This is also the case here, but even so, the achieved “gaming” CPU clock speeds are often lower. The idle cores actually crash the multiplier to 8 (800 MHz), which does not normally happen. However, this does not mean lower performance (game and background busy cores go to 4.9 GHz), but neither does it mean lower power draw, which one might expect from this.
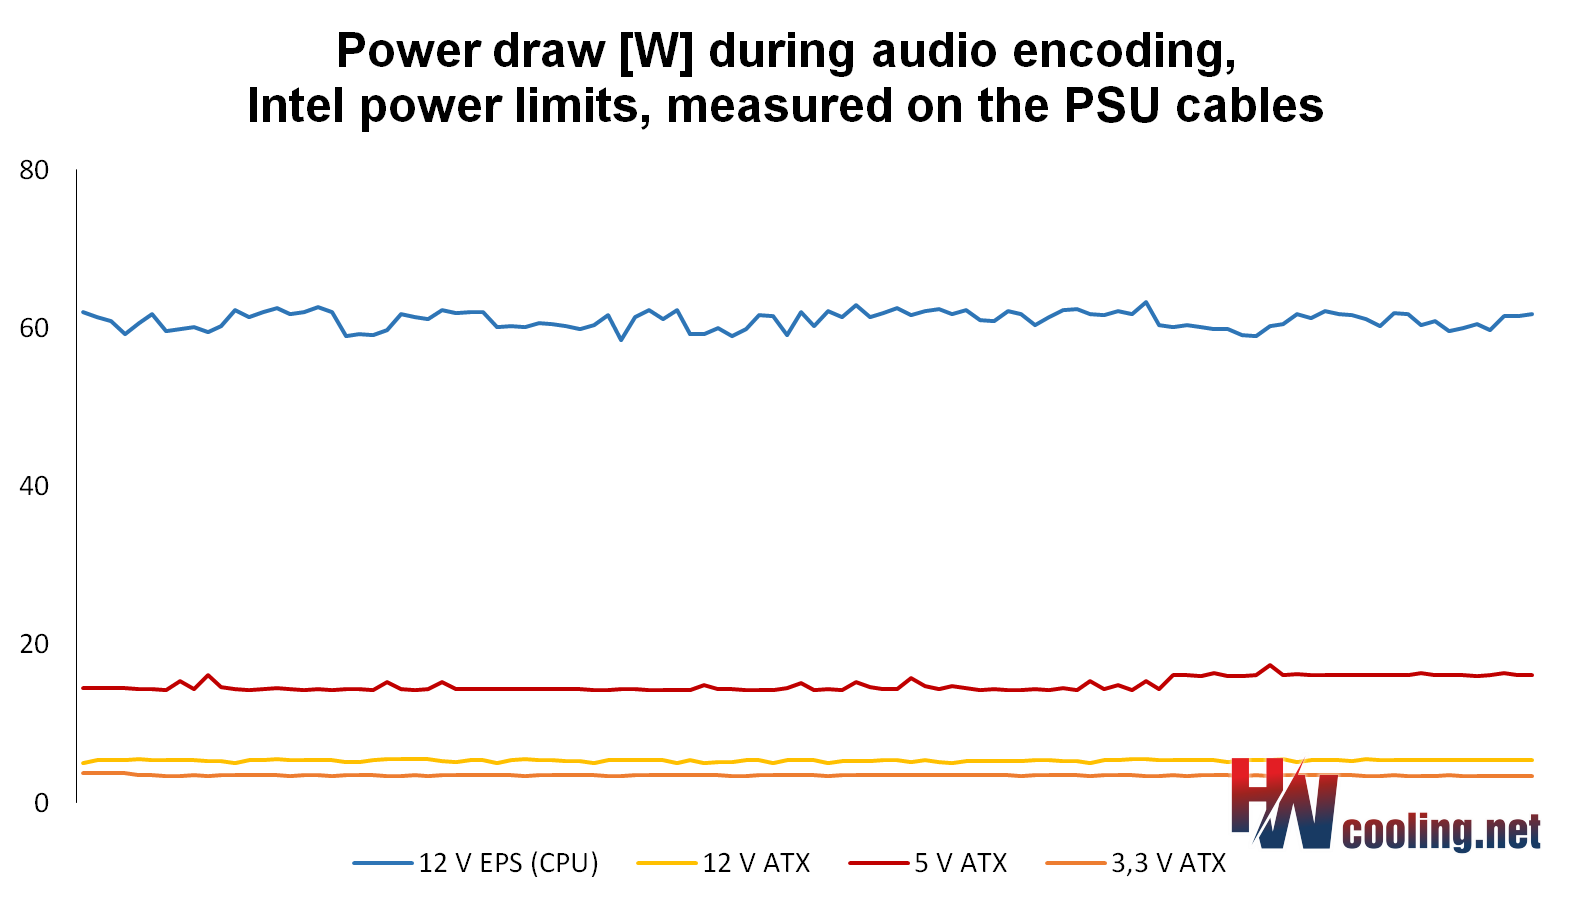
The clock speed management is also quite active in single-threaded tasks. These never actually run on a single core (although in one cycle the maximum single-core boost is only achieved on a single core), but multiple cores are used, alternating between them. This is also for the sake of better cooling. This behaviour is common, but the Biostar board works with more cores (usually two) and at a higher speed. The result is that with the highest power draw yet the lowest temperature is achieved. So we can conclude that such an operation on the B660GTA has a positive impact on better cooling, but power efficiency is weaker. These more chaotic jumps in clock speeds and power supply are well illustrated by the jagged power draw curve. And speaking of power draw, it’s always high under heavy load as well as in idle, higher than all boards tested so far (2–3 times compared to the most economical one, depending on the processor used) There is also a higher power draw on the 5 V and 3.3 V branches.This is not addressed by Intel’s power-limit mode such as the B660M Mortar WiFi or the less aggressive CPU Lite Load.
The effective SSD heatsinks are worth praising, but it’s the rarer connectivity options that pull the Biostar B660GTA out of mediocrity in the first place. Visually, turquoise on a black background is also original. And in combination with RGB LEDs… some people don’t need more.
English translation and edit by Jozef Dudáš
| Biostar B660GTA |
| + Robust 14-phase power delivery (VRM)... |
| + ... handles even the Core i9-12900K without power limits with no power loss |
| + Rare features in this class. Up to eight SATA connectors and DVI-D video output |
| + Eventually above-standard single-threaded performance |
| + Bidirectionally fast Ethernet connection |
| + Effective SSD heatsinks |
| + Wide gap between the socket and the first PCIe ×16 slot (convenient graphics card removal) |
| + Up to six fast USB 3.2 gen. 2 connectors... |
| - ... but without USB 3.2 gen. 2×2, which is also found on significantly cheaper B660 boards |
| - Lower power delivery efficiency – higher power draw per unit of performance |
| - Only five fan connectors. Not enough for an ATX board |
| - High idle power draw |
| Approximate retail price: 231 EUR |
Games for testing are from Jama levova
![]()

Special thanks to Blackmagic Design (for licenses for DeNoise AI, Gigapixel AI and Sharpen AI) and Topaz Labs (for licenses for DeNoise AI, Gigapixel AI and Sharpen AI)
- Contents
- Biostar B660GTA in detail
- What it looks like in the BIOS
- Methodology: Performance tests
- Methodology: How we measure power draw
- Methodology: Temperature and frequency measurements
- Test setup
- 3DMark
- Borderlands 3
- F1 2020
- Metro Exodus
- Shadow of the Tomb Raider
- Total War Saga: Troy
- PCMark and Geekbench
- Web performance
- 3D rendering: Cinebench, Blender, ...
- Video 1/2: Adobe Premiere Pro
- Video 2/2: DaVinci Resolve Studio
- Graphics effects: Adobe After Effects
- Video encoding
- Audio encoding
- Photos: Adobe Photoshop, Affinity Photo, ...
- (De)compression
- (De)cryption
- Numerical computing
- Simulations
- Memory and cache tests
- M.2 (SSD) slots speed
- USB ports speed
- Ethernet speed
- Power draw curve (EPS + ATX connector) w/o power limits
- Power draw curve (EPS + ATX connector) with Intel’s power limits
- Total power draw (EPS + ATX connector)
- Achieved CPU clock speed
- CPU temperatures
- VRM temperatures – thermovision of Vcore and SOC
- SSD temperatures
- Chipset temperatures (south bridge)
- Conclusion