


MSI RTX 4070 Ti Suprim X 12G in detail
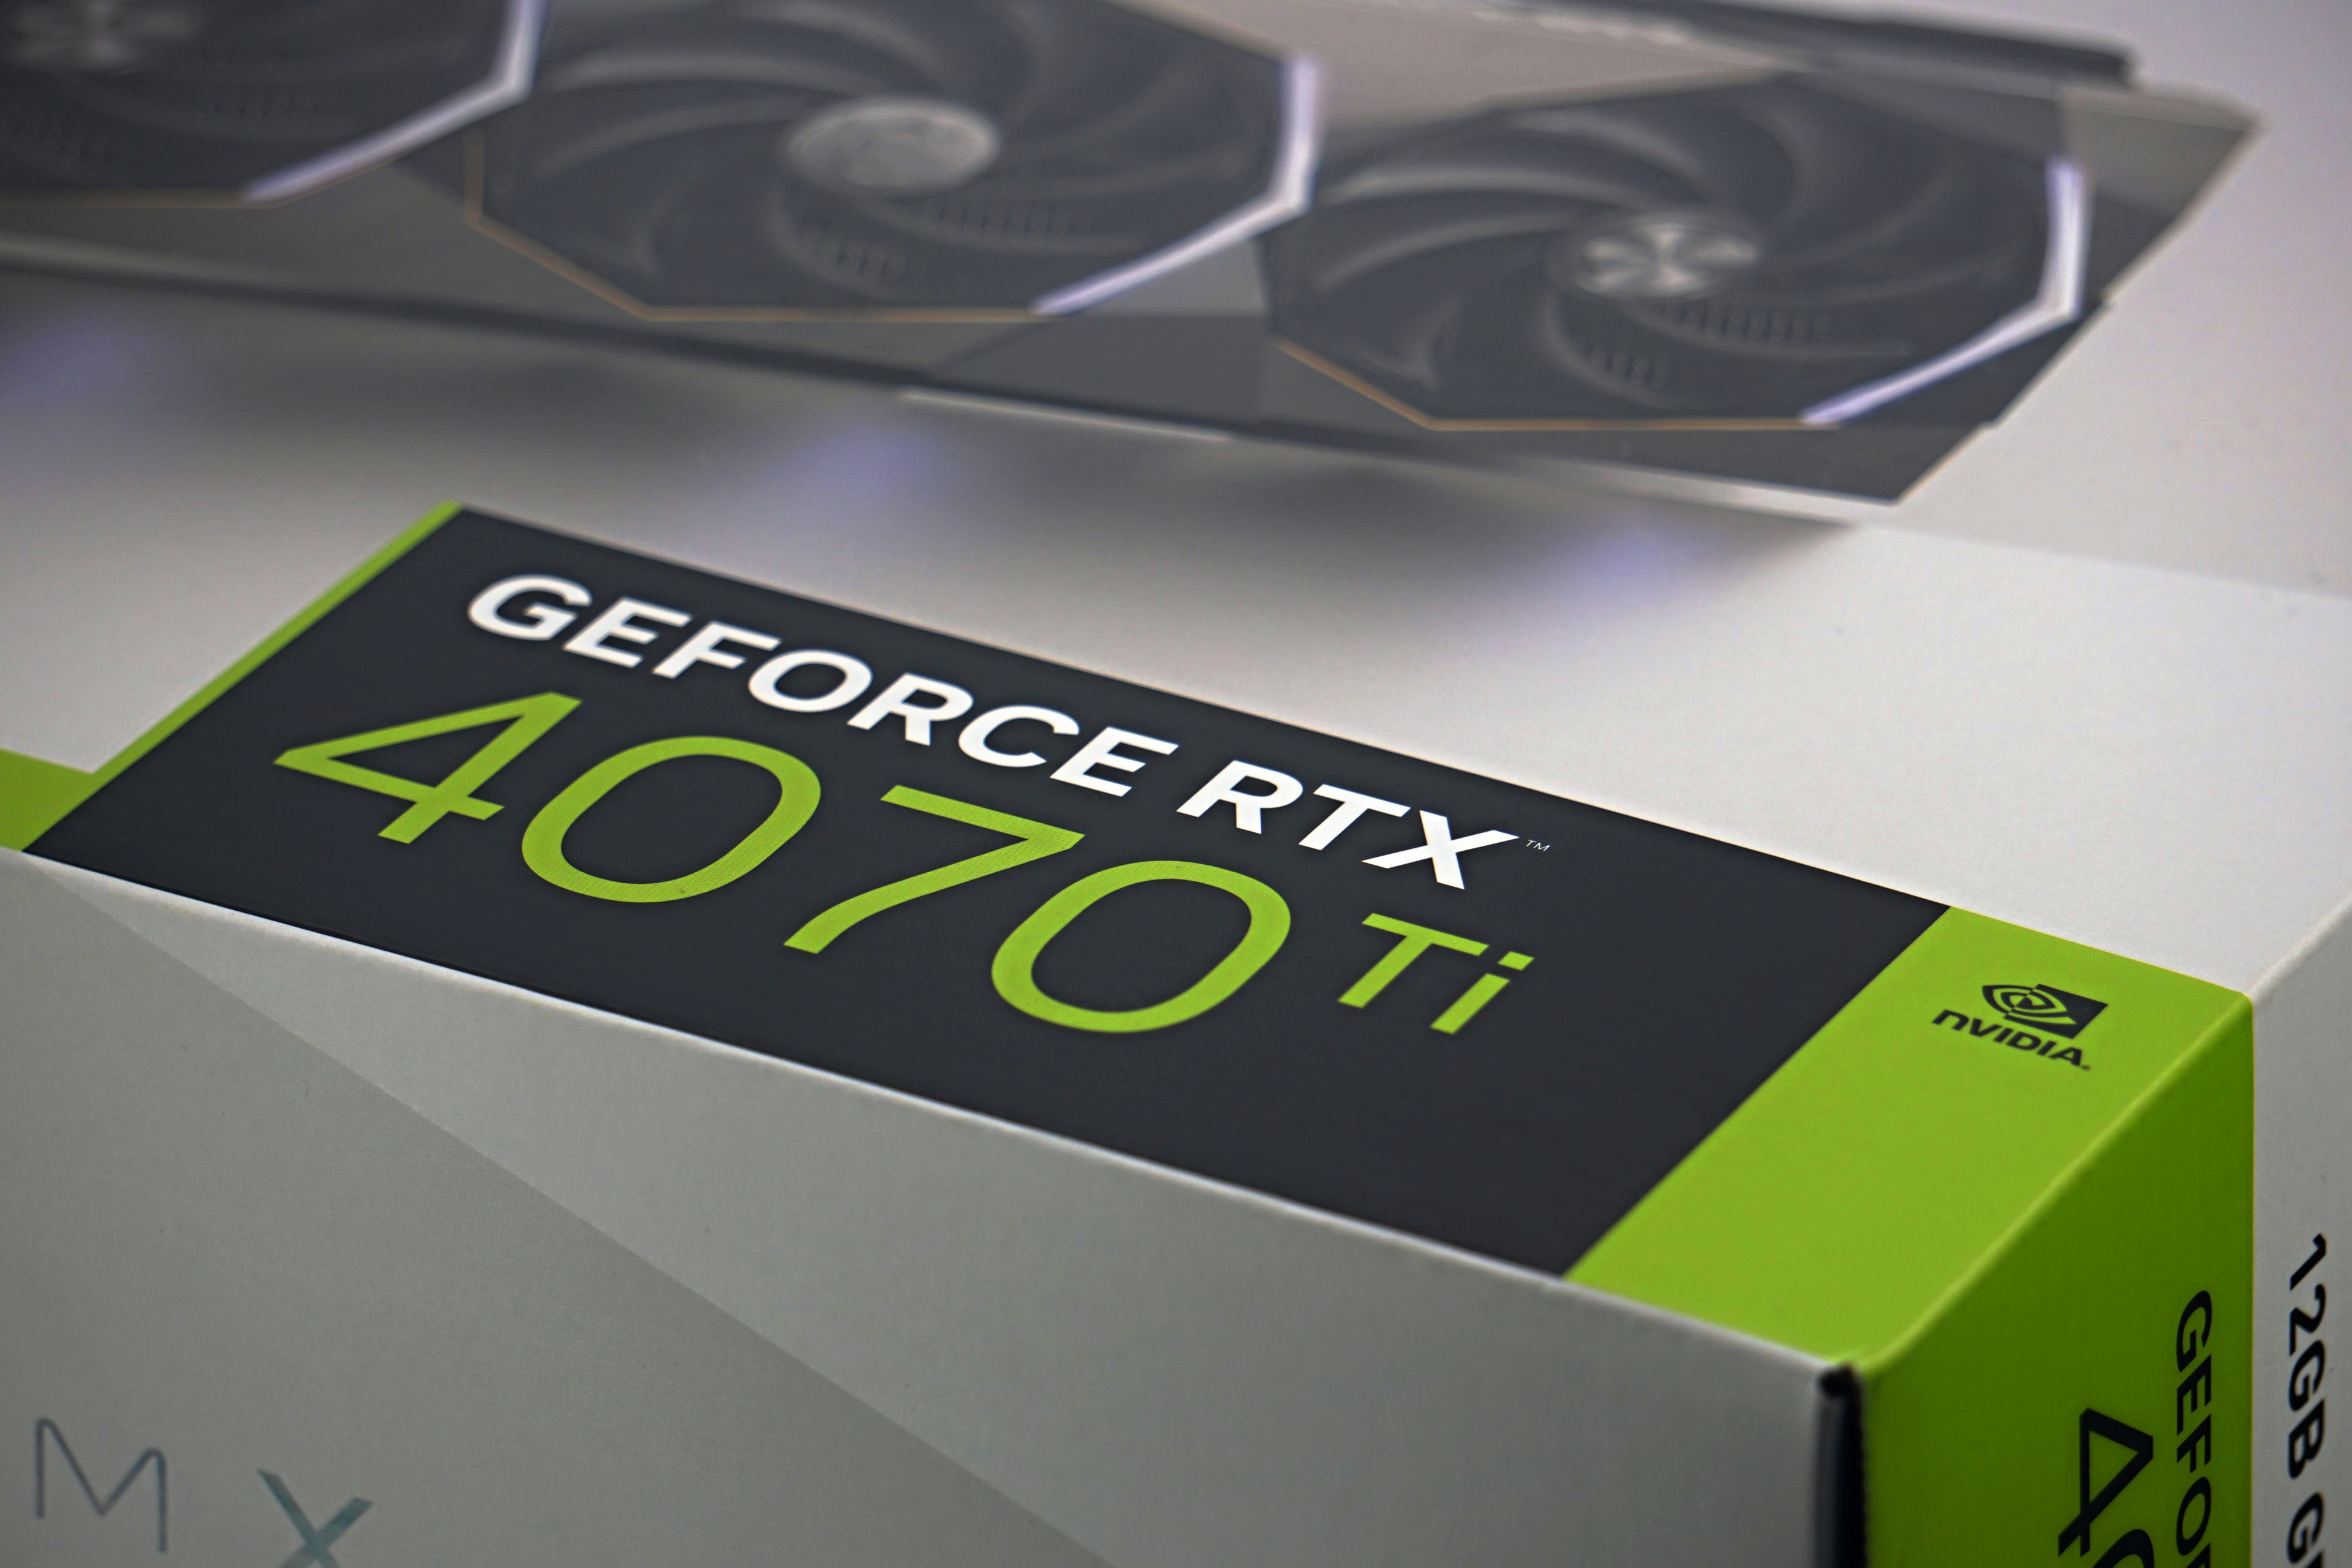
After the GeForce RTX 4080 graphics cards, which wasn’t to many people’s taste due to the higher price, Nvidia has released a significantly cheaper GPU for the GeForce RTX 4070 Ti. The performance versus the RTX 4080 is admittedly noticeably weaker, but percentage-wise not by as much as the roughly two-thirds lower price of the RTX 4070 Ti. In our tests, we analyze MSI’s non-reference design from the top-of-the-line Suprim series.
Nvidia was probably right to abandon the original plan with two RTX 4080s, where one (with a better-equipped GPU and 16GB of VRAM) was supposed to be more powerful and the other (12-gigabyte) slower. The latter, even in terms of better orientation, fits better with the final RTX 4070 Ti designation. This graphics card is built on the AD104 chip, which at 295 mm2 is approximately 22% smaller in area compared to the one (AD103) in the RTX 4080. The RTX 4070 Ti is also “stripped” in this ratio by SM blocks (60) and has 7680 shaders. In terms of clock speed, however, the GPU in the RTX 4070 Ti is always faster, the base clock speed is higher by 105 MHz (2310 MHz). In practice, however, the clock speed is usually significantly higher – MSI guarantees at least 2775 MHz for the tested Suprim X variant in boost.
One of the main differences of the RTX 4070 Ti over the RTX 4080 is the size of the video memory, it is 4 GB smaller (12 GB), but still fast GDDR6X modules are used. However, they are connected with “only” a 192-bit bus, so the bandwidth is ultimately lower by almost 30%.
MSI RTX 4070 Ti Suprim X 12G in detail
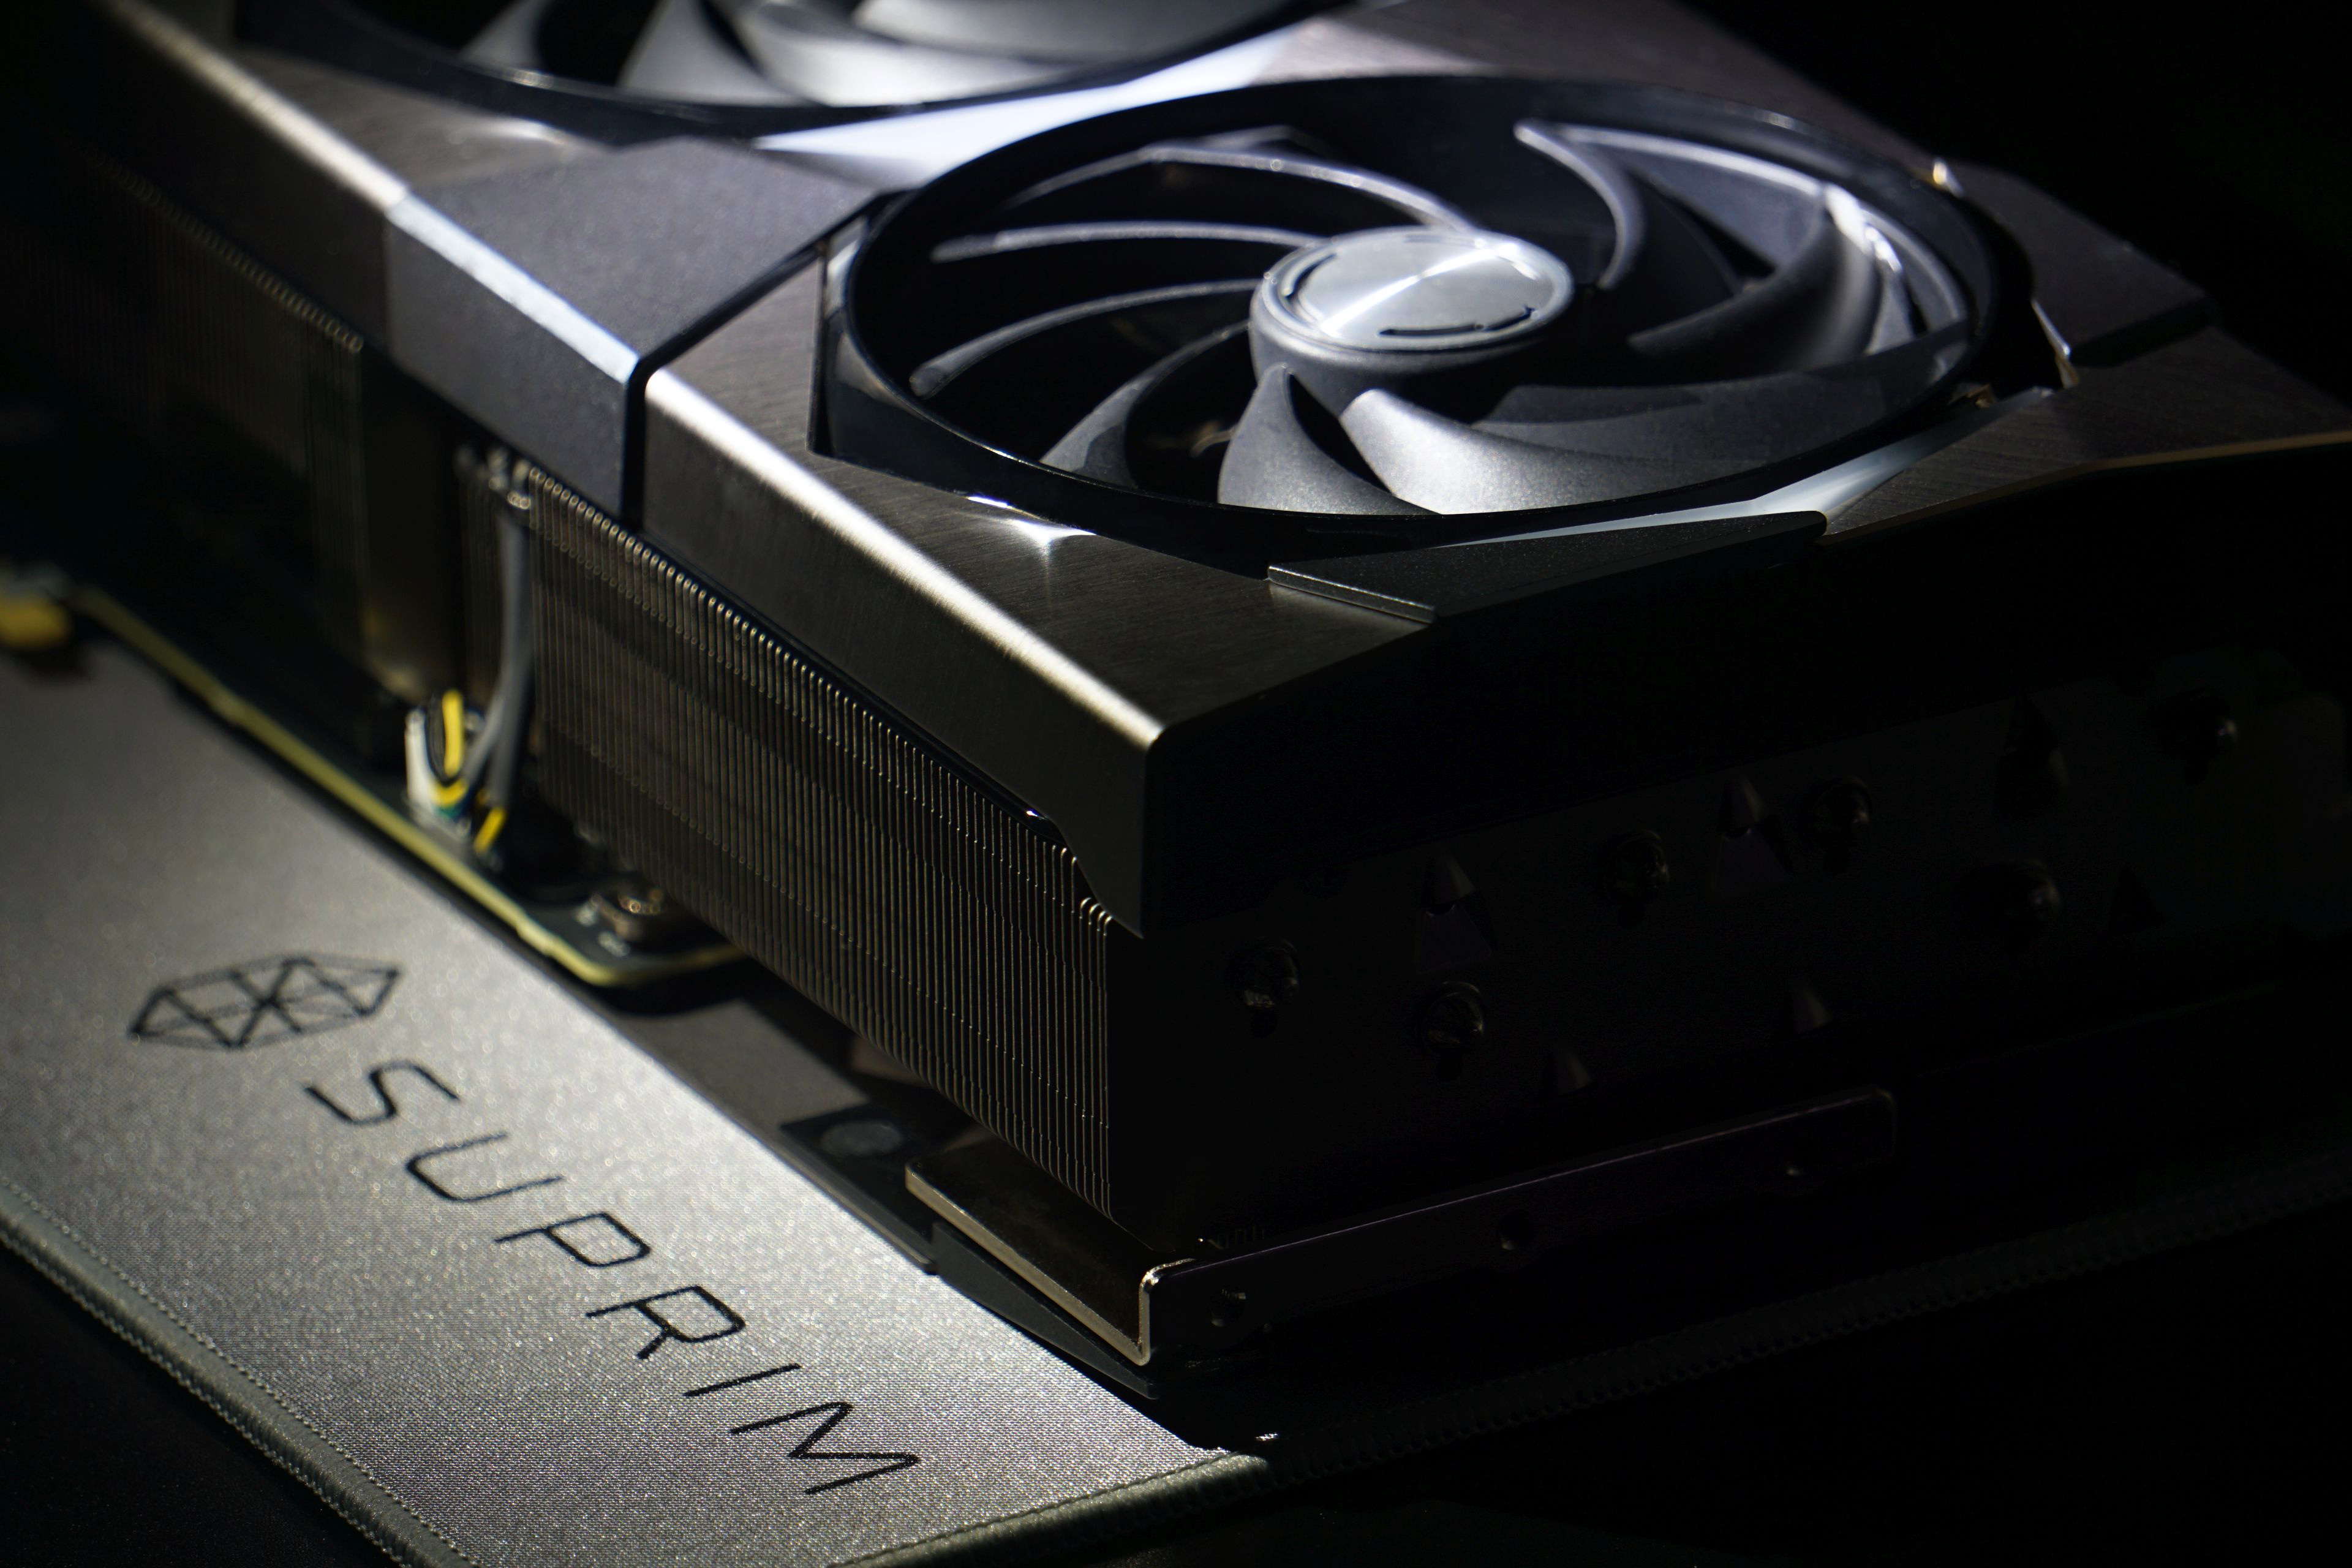
From some, let’s say more general parameters, we’ll move on to more specific details regarding MSI’s flagship design – the Suprim X. Besides it, MSI also has cheaper variants, the Ventus 3X (OC) and the Gaming (X) Trio (even in white), but the fastest option with the most effective cooler is embodied by the Suprim X. Alternatively, a Suprim without the “X” is also available with the same cooler with slightly lower clock speeds.
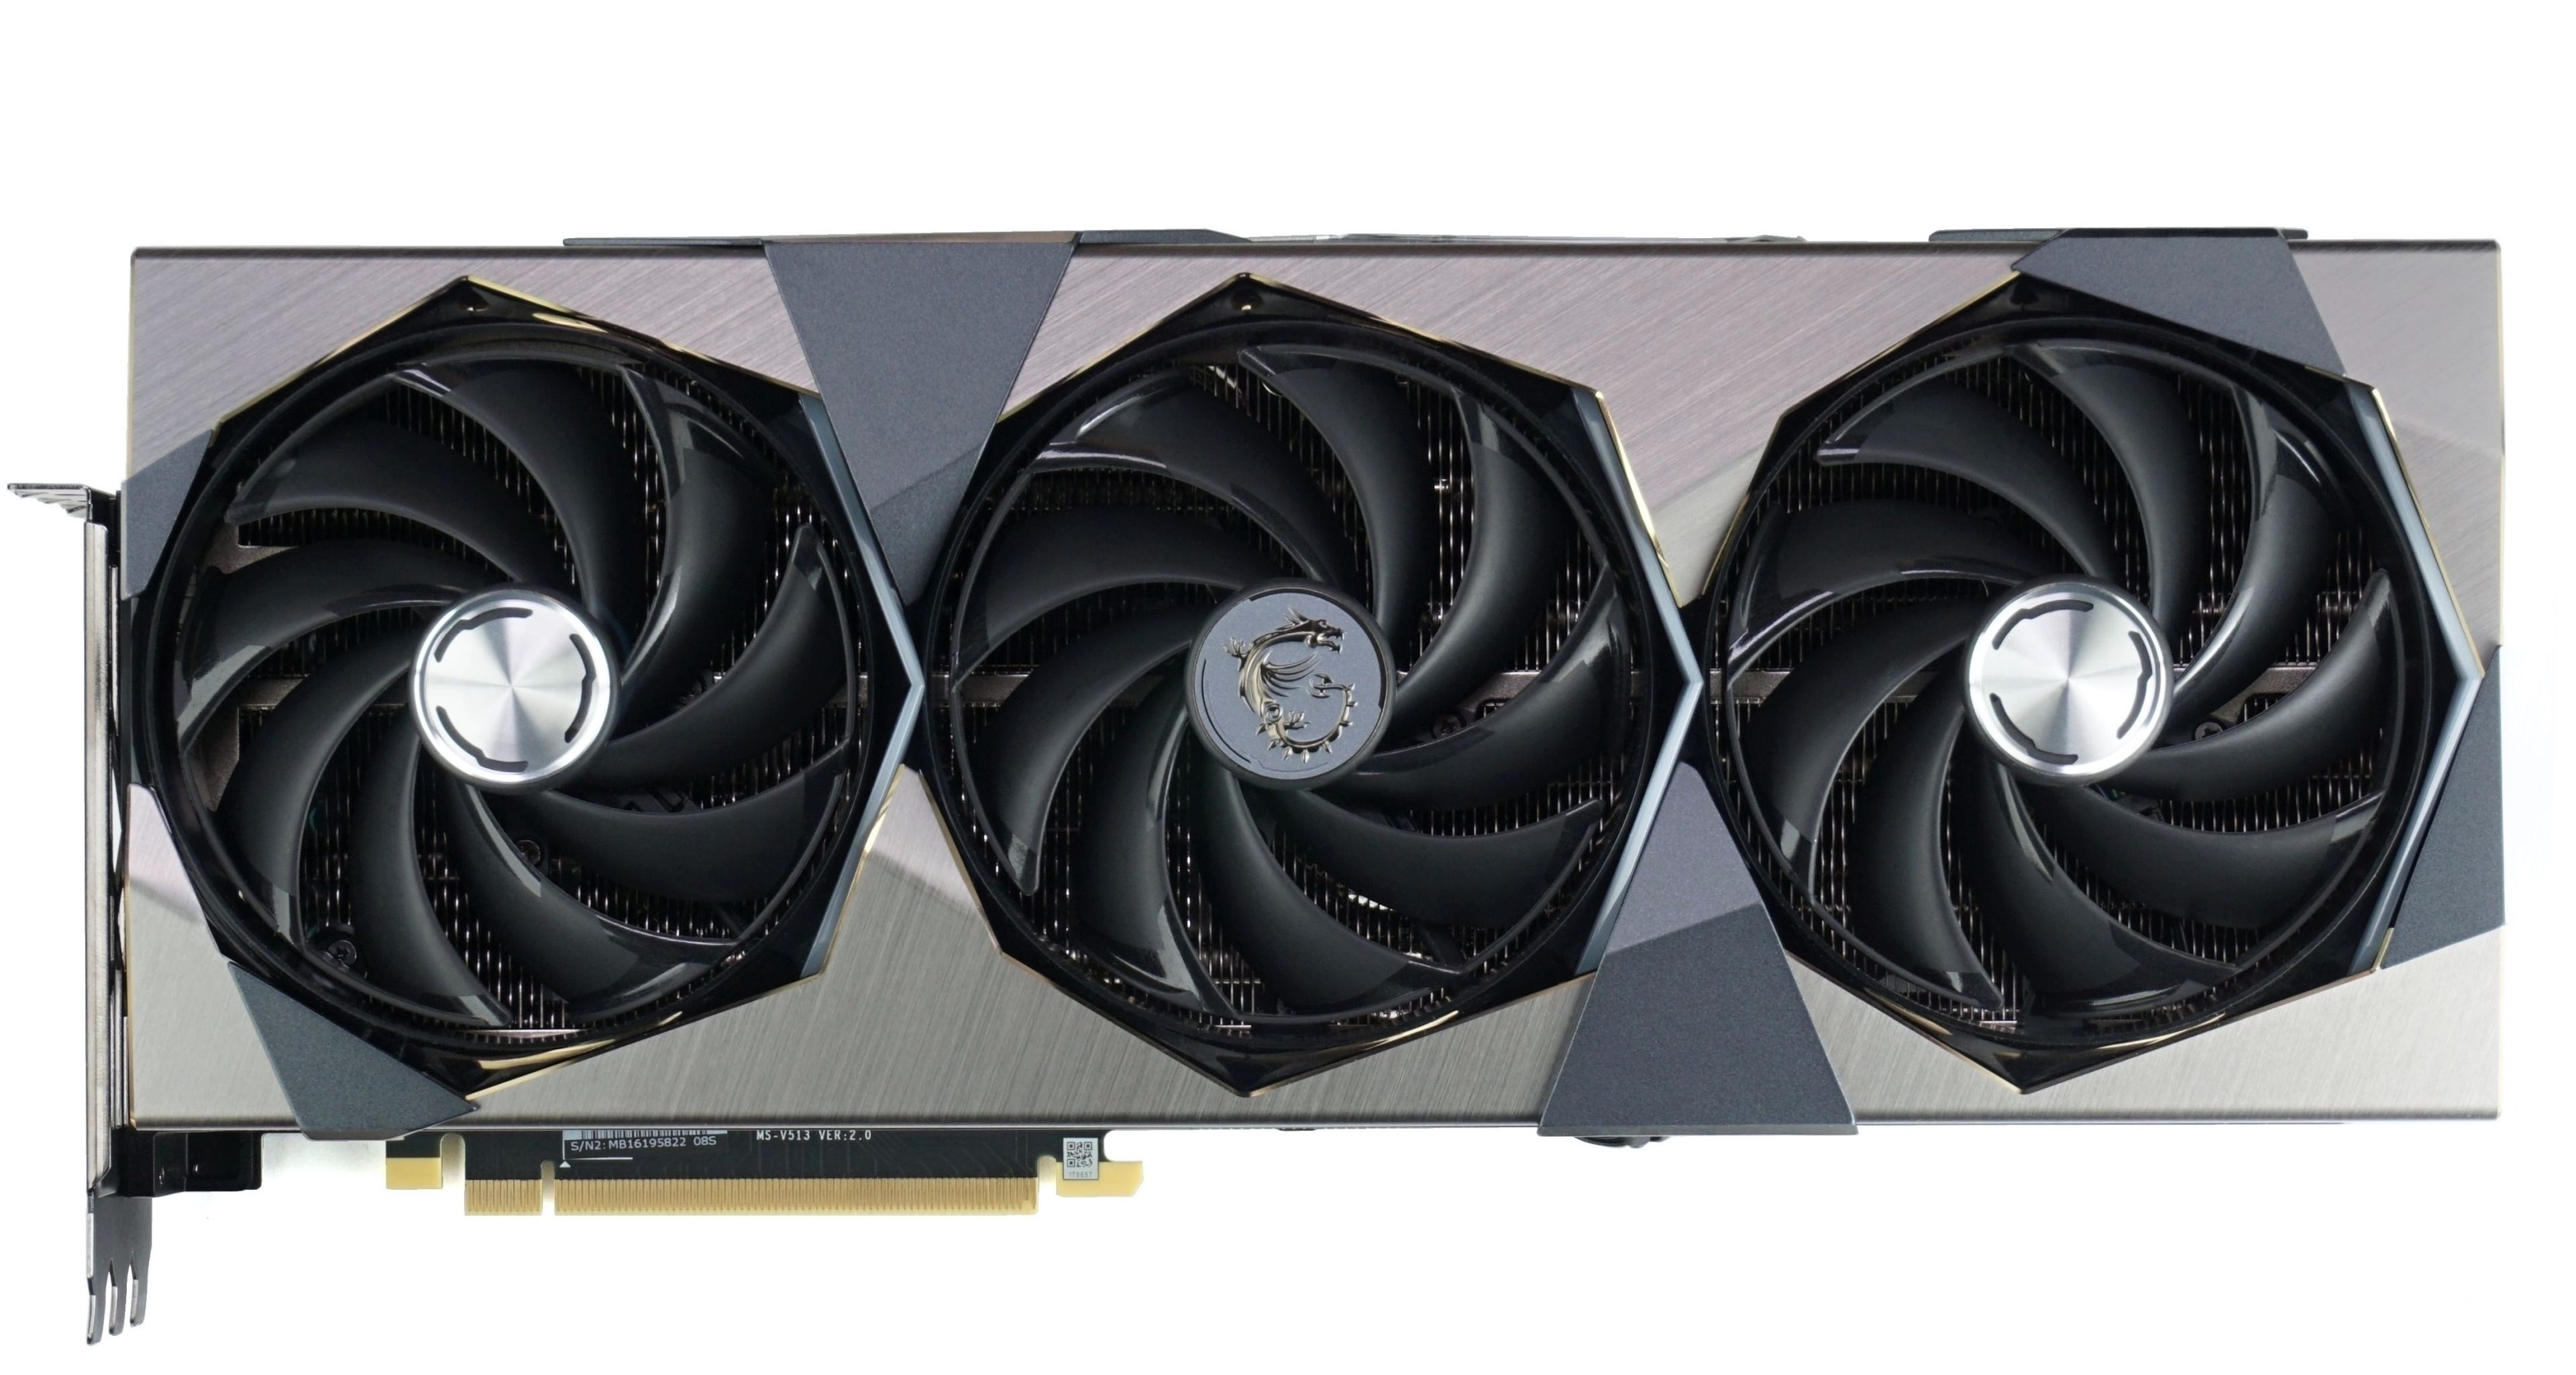
The body of the RTX 4070 Ti Suprim X is huge. It is 338 mm in length and 73 mm in height. The cooler has a slightly (proportionally to the lower TDP) lower profile than the RTX 4080 Suprim X, but you still have to take into account that the graphics card will occupy three PCI Express slots in addition to its own. Manufacturers of motherboards (and especially Gigabyte) optimize their motherboards quite well with regard to “thick” graphics cards – the second PCIe slot usually keeps a good distance from the first one and the space in between is efficiently filled by M.2 positions for SSDs.
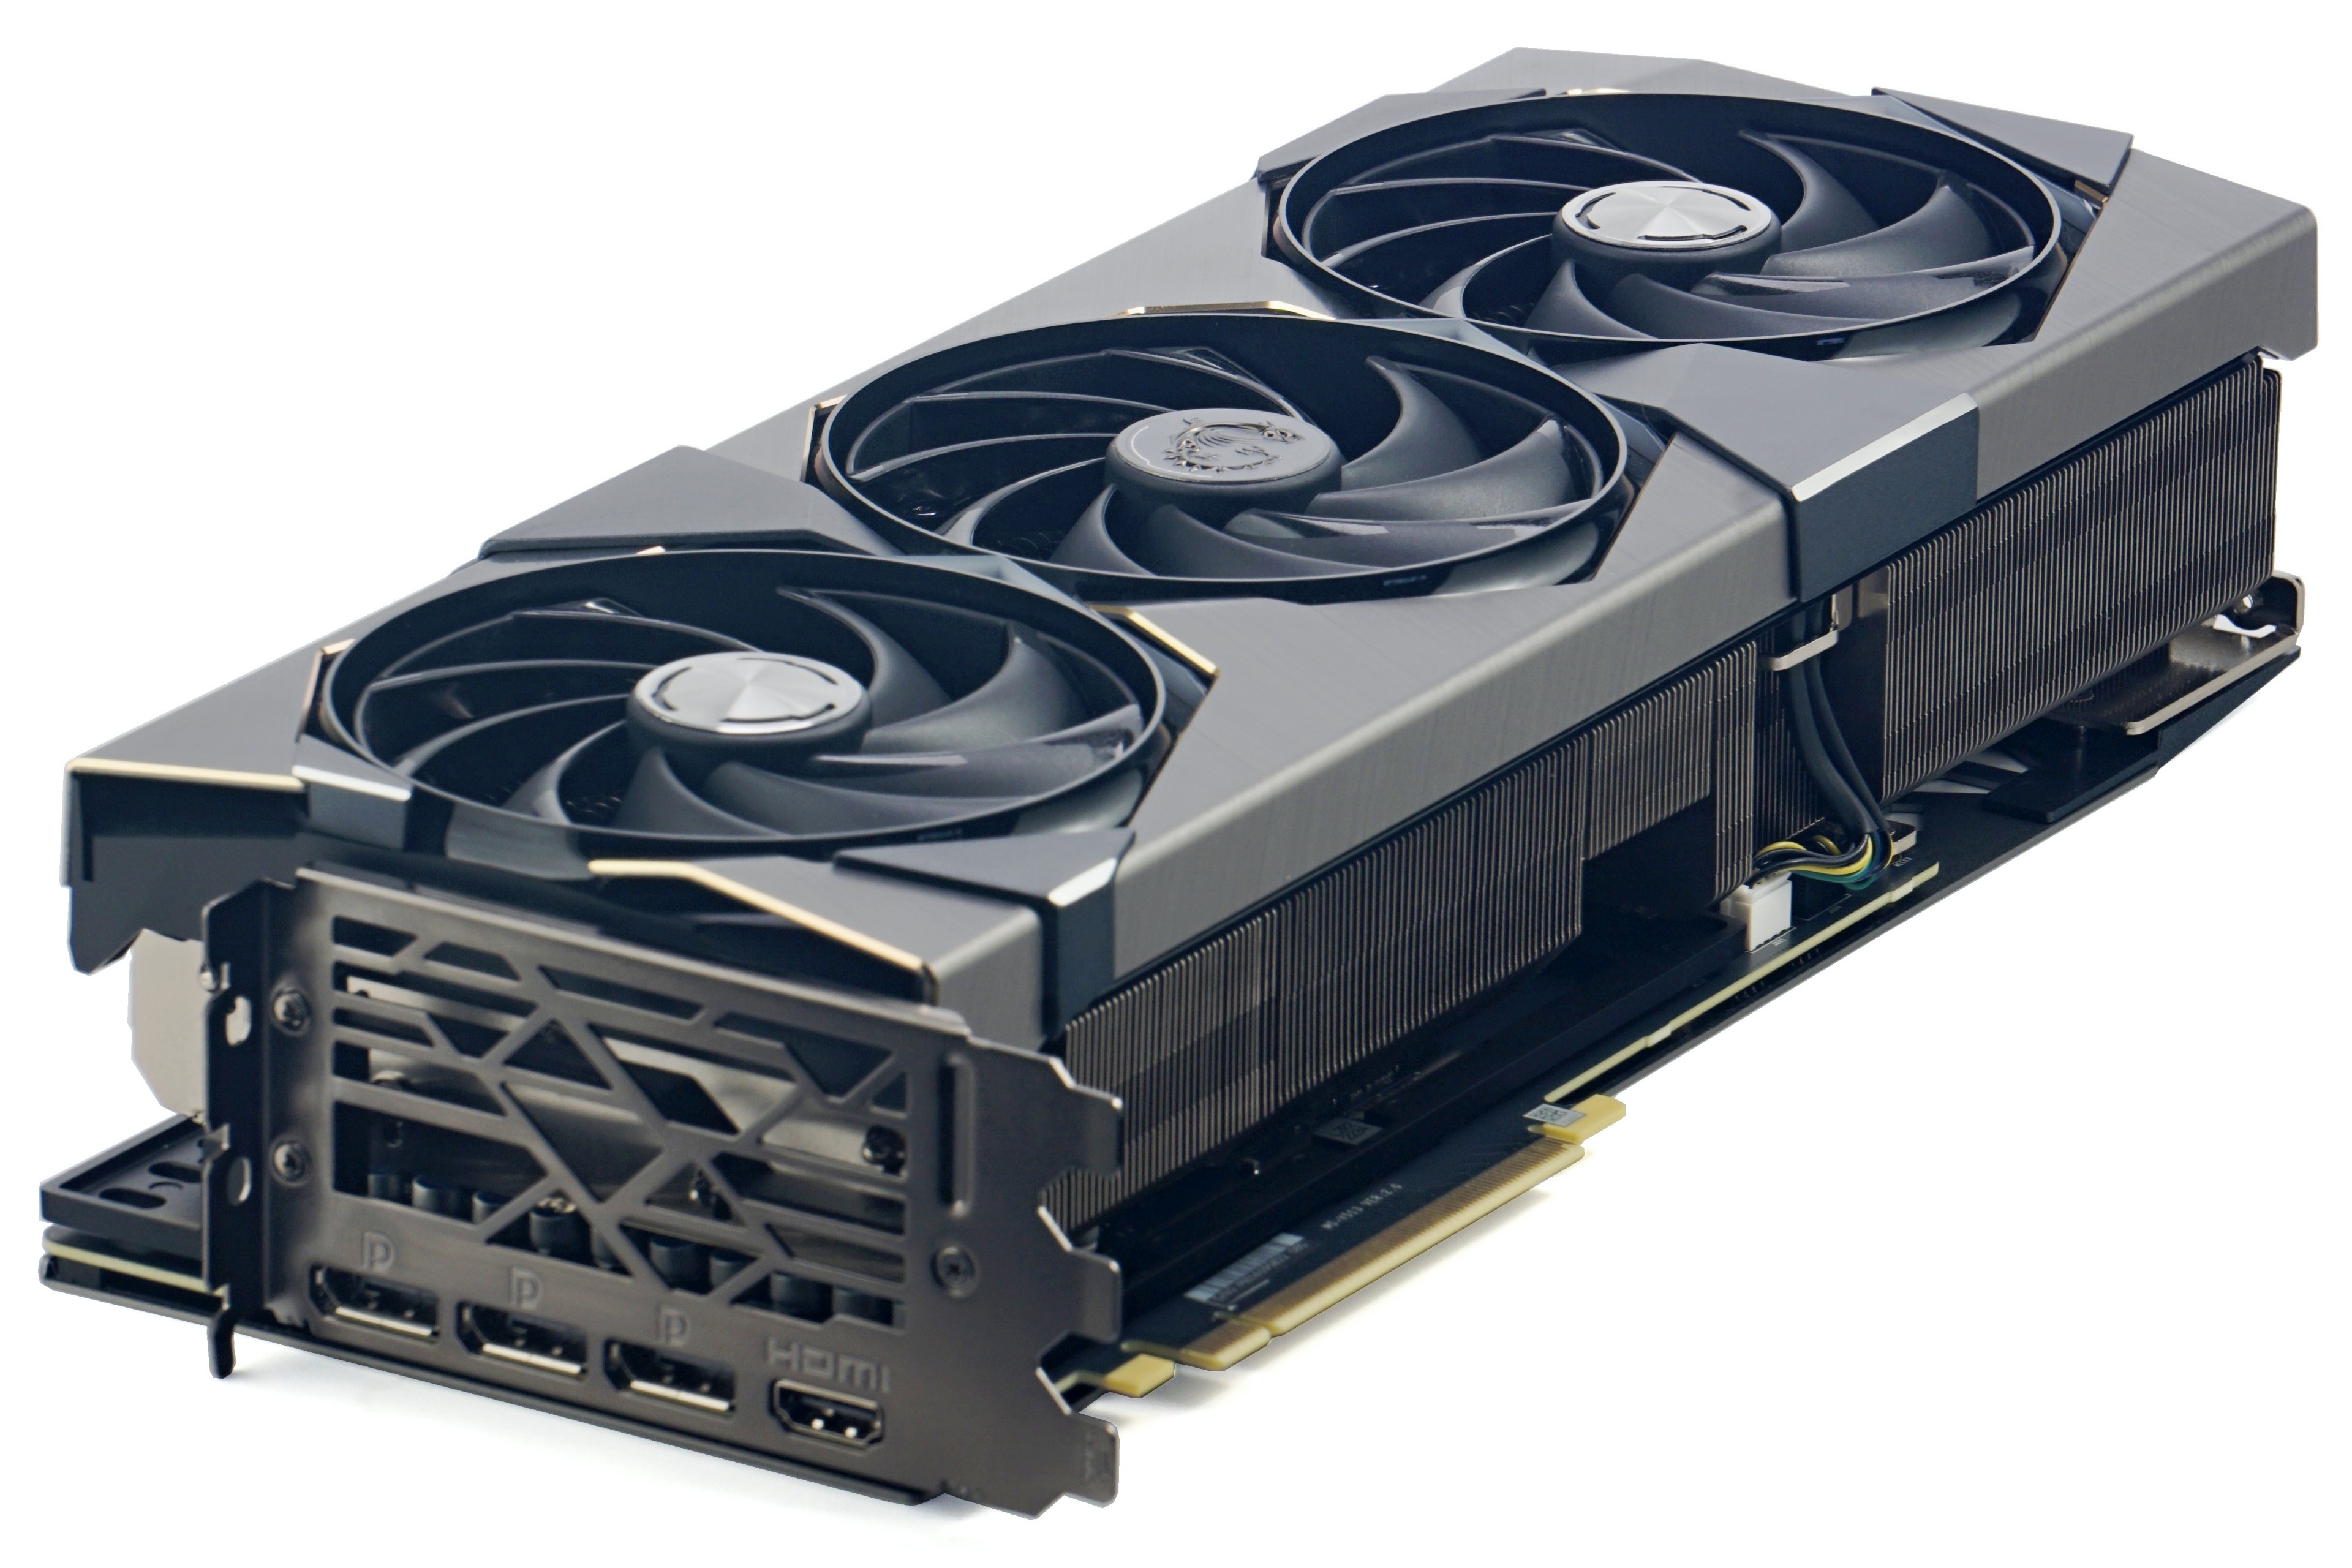
Finally, there is one more dimension on which compatibility with the case depends – the width. This is 142 mm for the RTX 4070 Ti Suprim (X). For most cases, this is not a measure that exceeds the supported value, but for models with a vertically split interior into two parts, be cautious. In these cases, the graphics card may already be colliding with the side panel of the case.
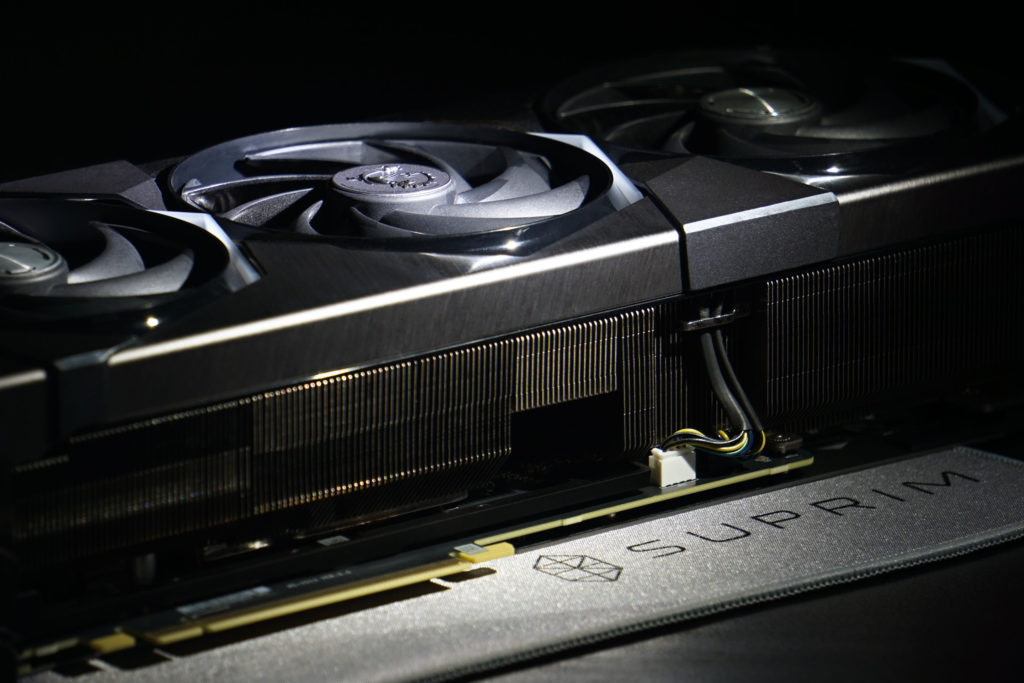
The Tri Frozr 3S cooler includes three 95 mm fans. What is remarkable about them is that the tips of the blades are connected in threes by a sort of frame. This has mainly a reinforcing role and eliminates undulations at the ends of the blades. This not only reduces vibrations, but also suppresses resonant sound frequencies that make the user experience unpleasant.
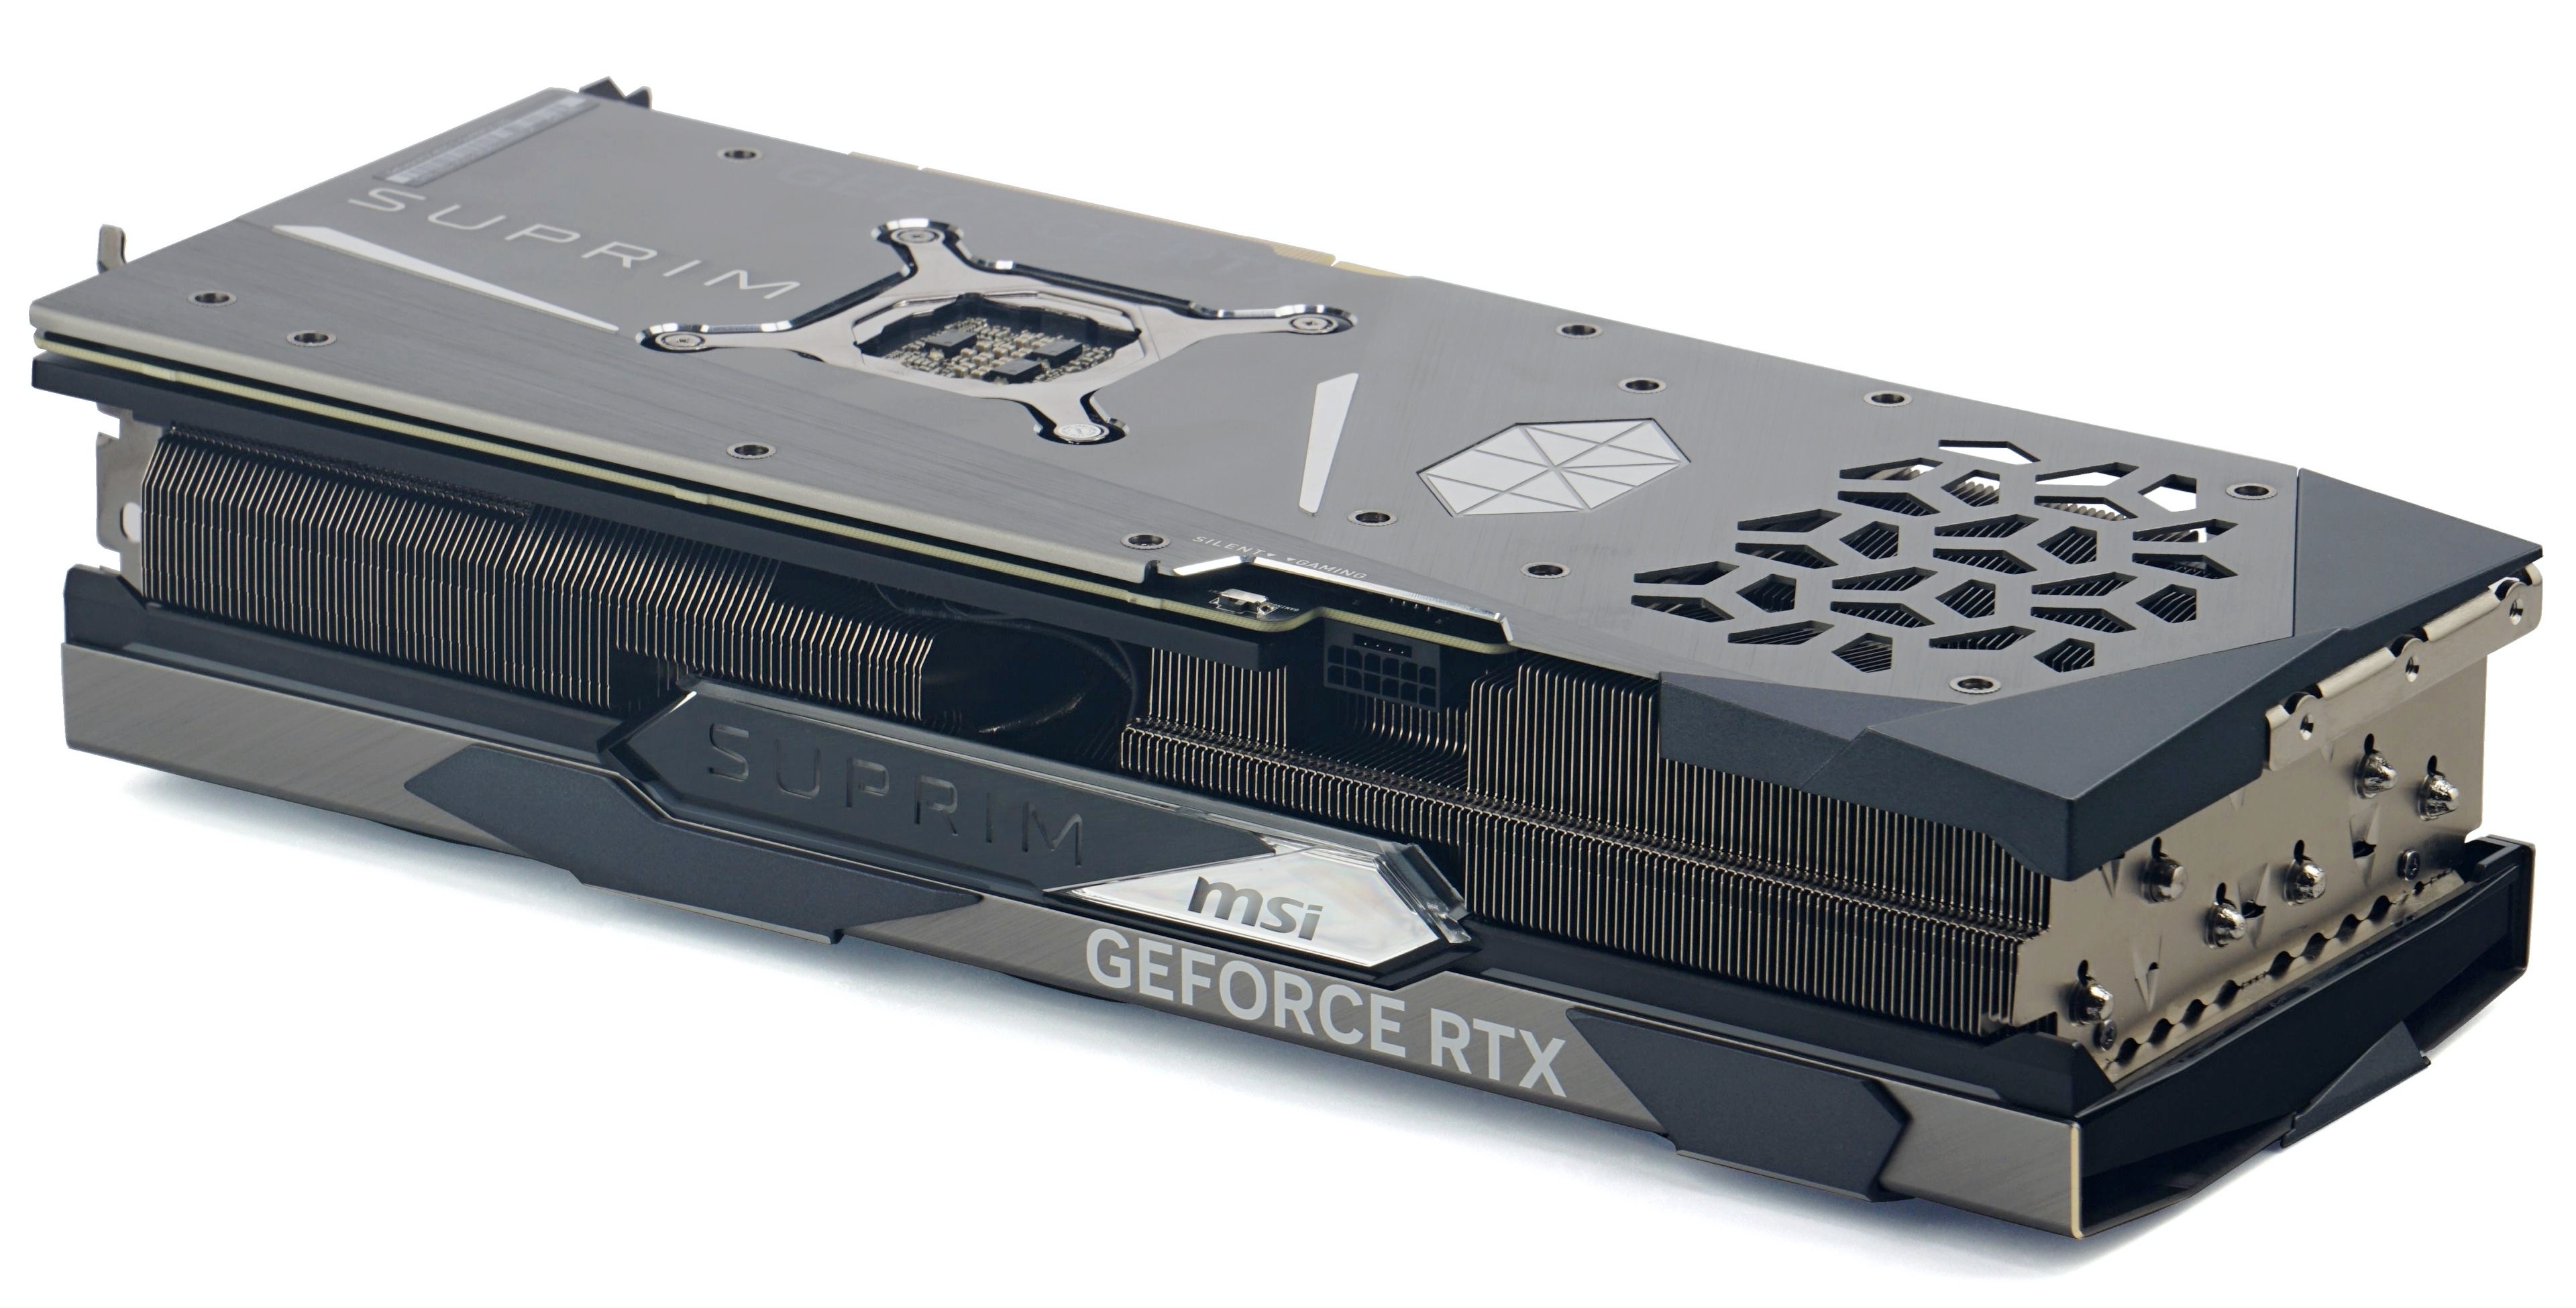
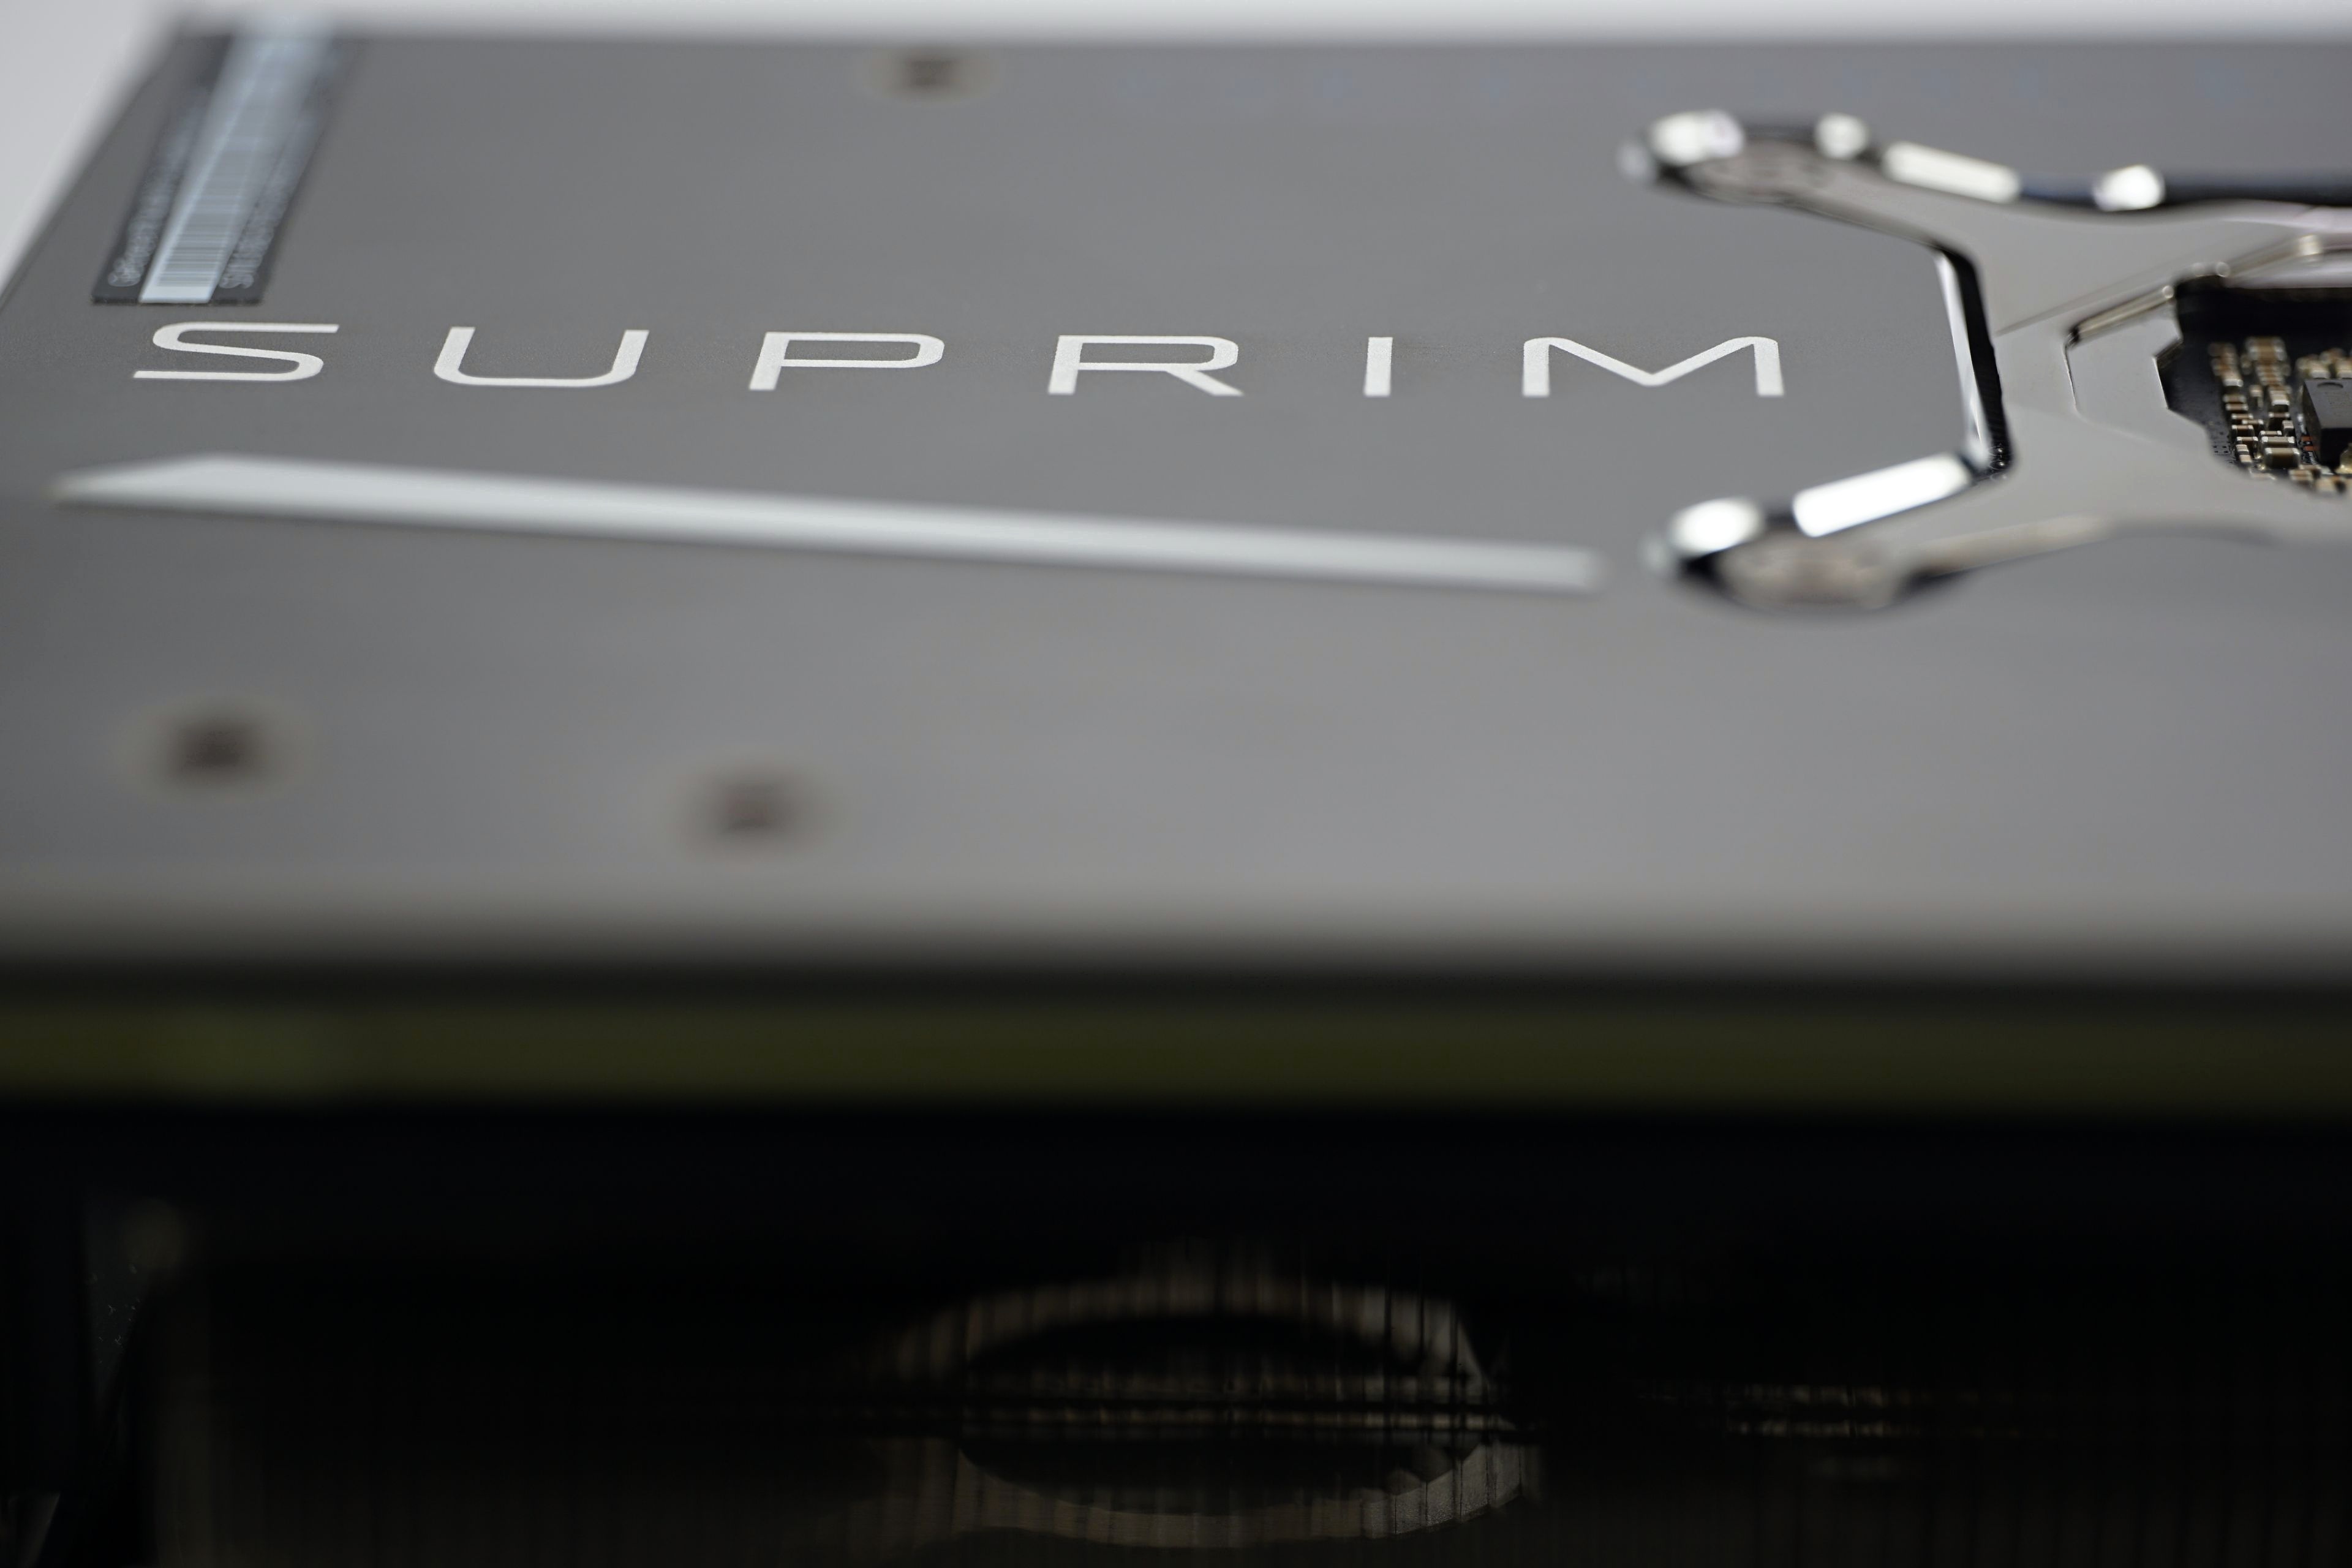
Most of the card shell is metal, made of aluminum. Backplate and front part between the fans. The plastic elements (parts with darker color) are in the minority and are always characterized by high strength (it is a properly hardened material). All parts fit well together and the overall impression of the build is very good, the Suprim X defends its place in the class of the most expensive designs quite easily.
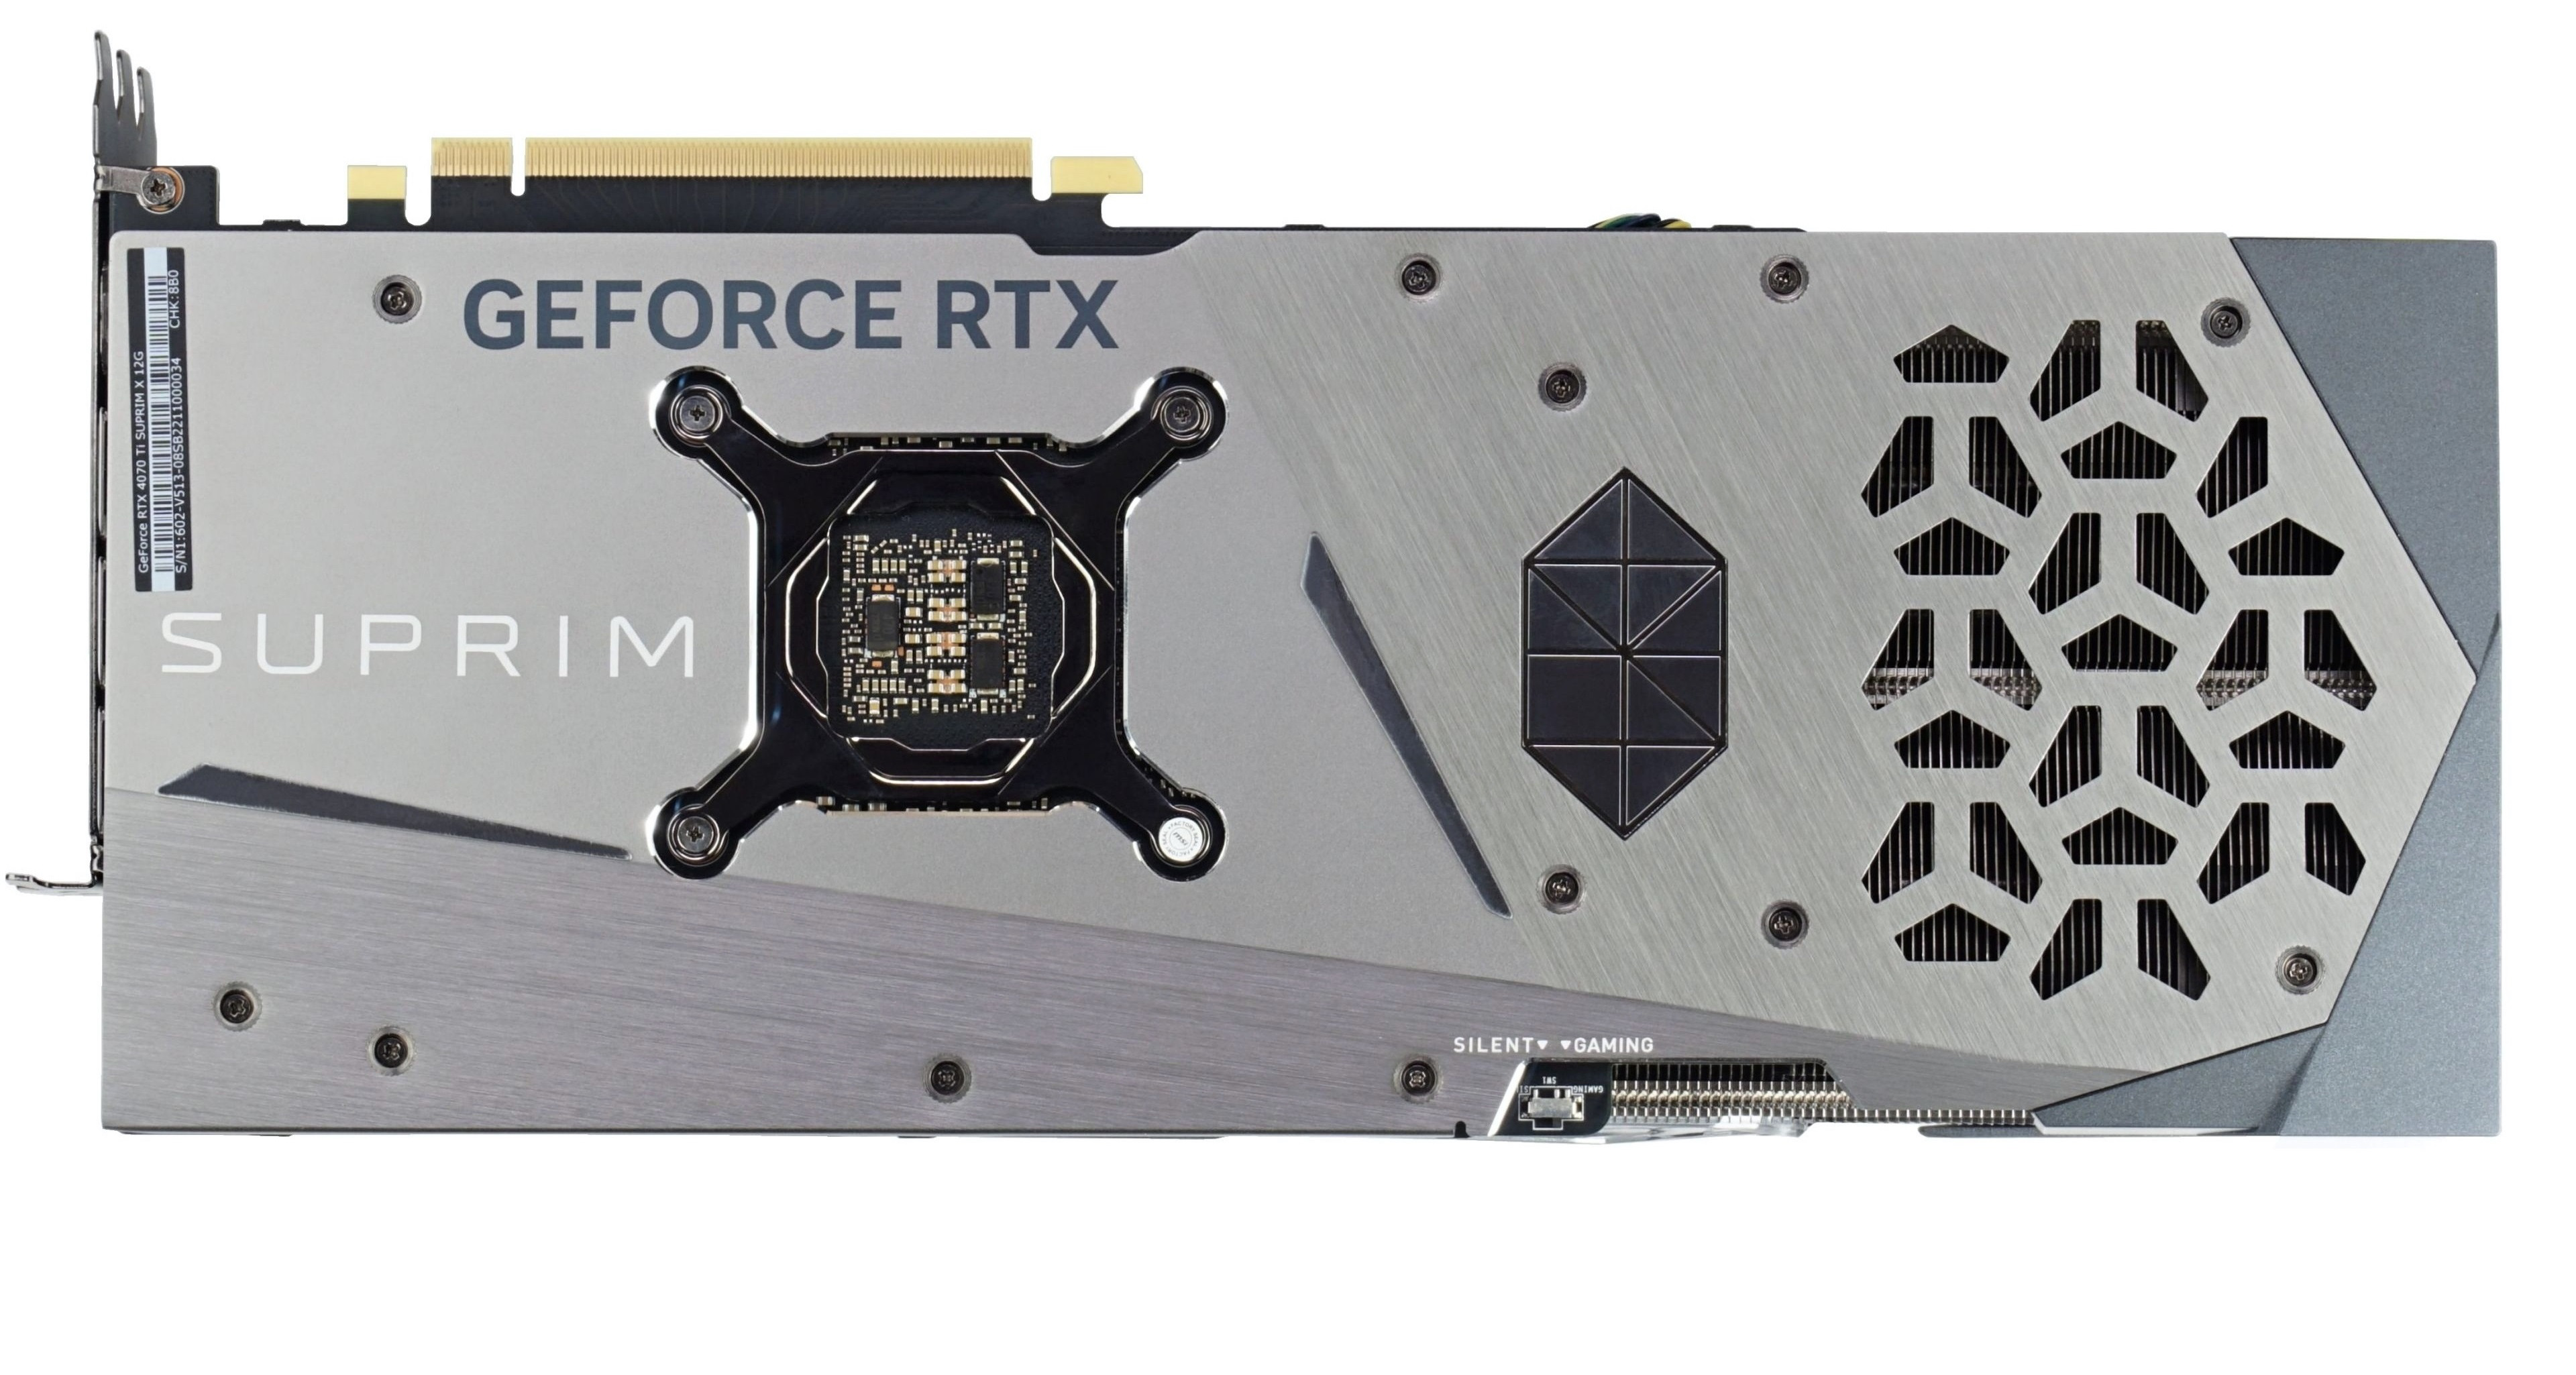
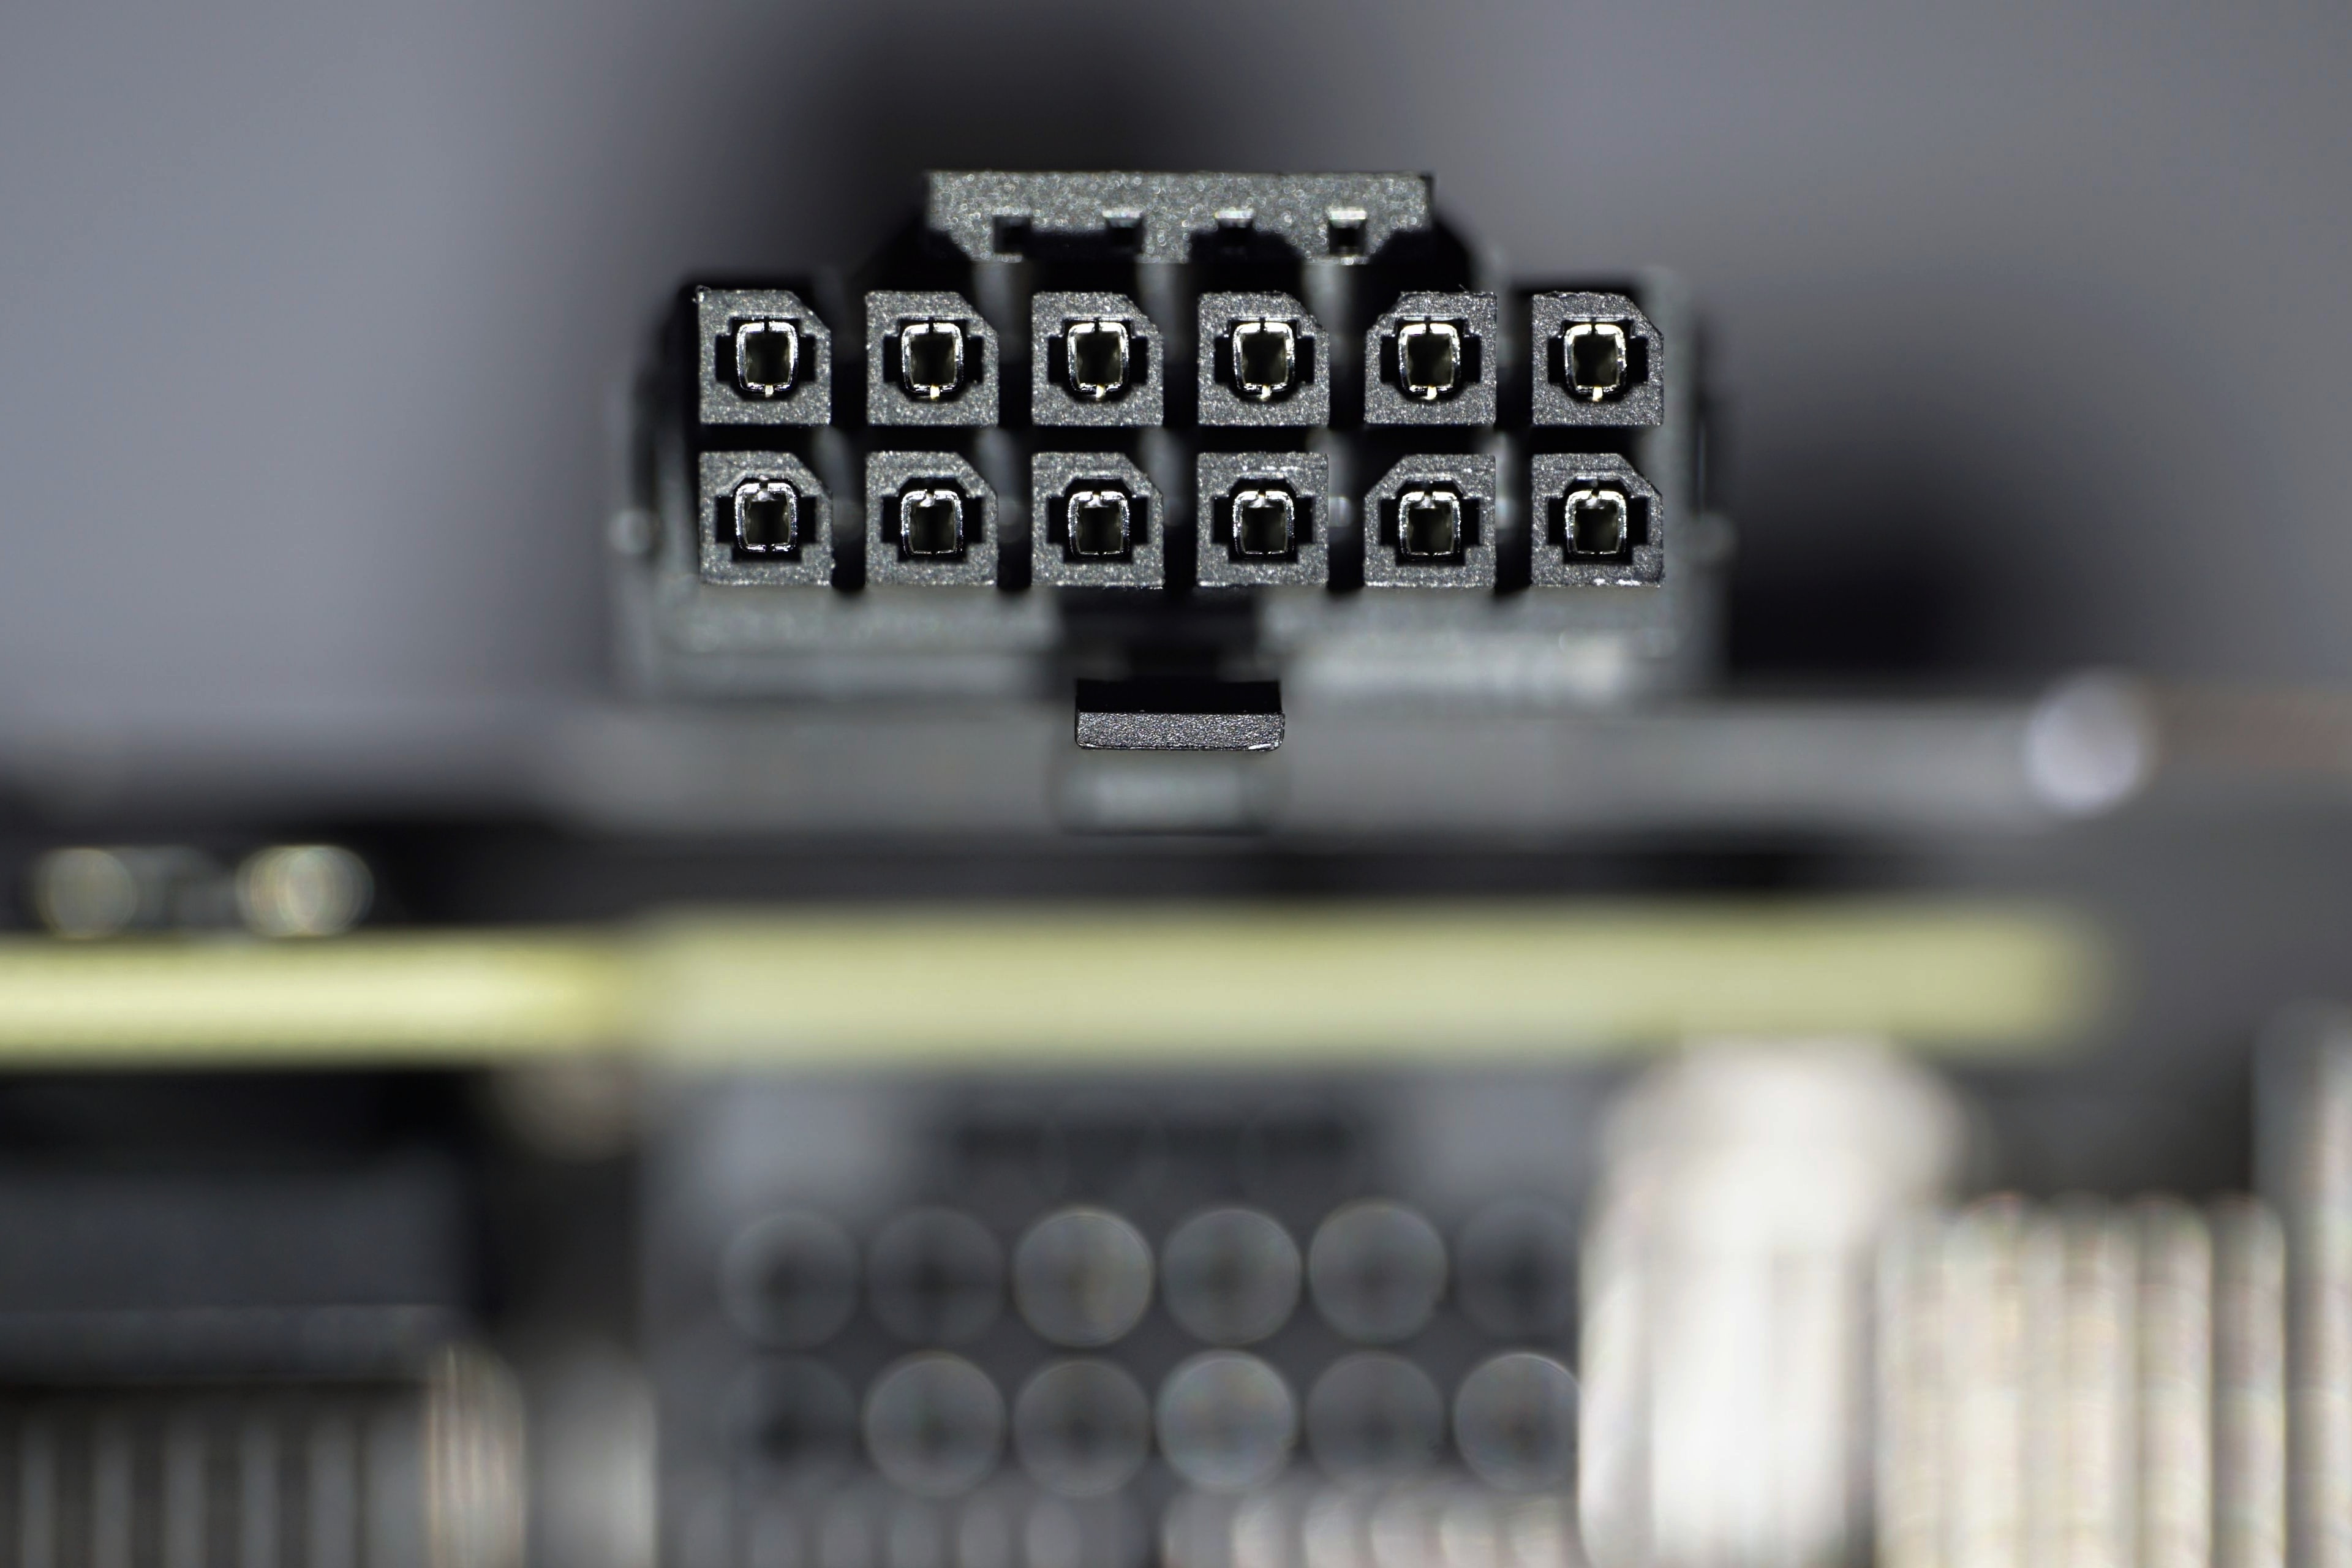
External power is provided by a single 16-pin (12VHPWR) connector with Astron hollows. Although these are the ones with smaller contact area (with pins) with higher transient resistance, the adapter is suitable due to lower power draw. This is evidenced by the thermal imaging tests we did with the more powerful RTX 4080 Suprim X with the same adapter in the box.
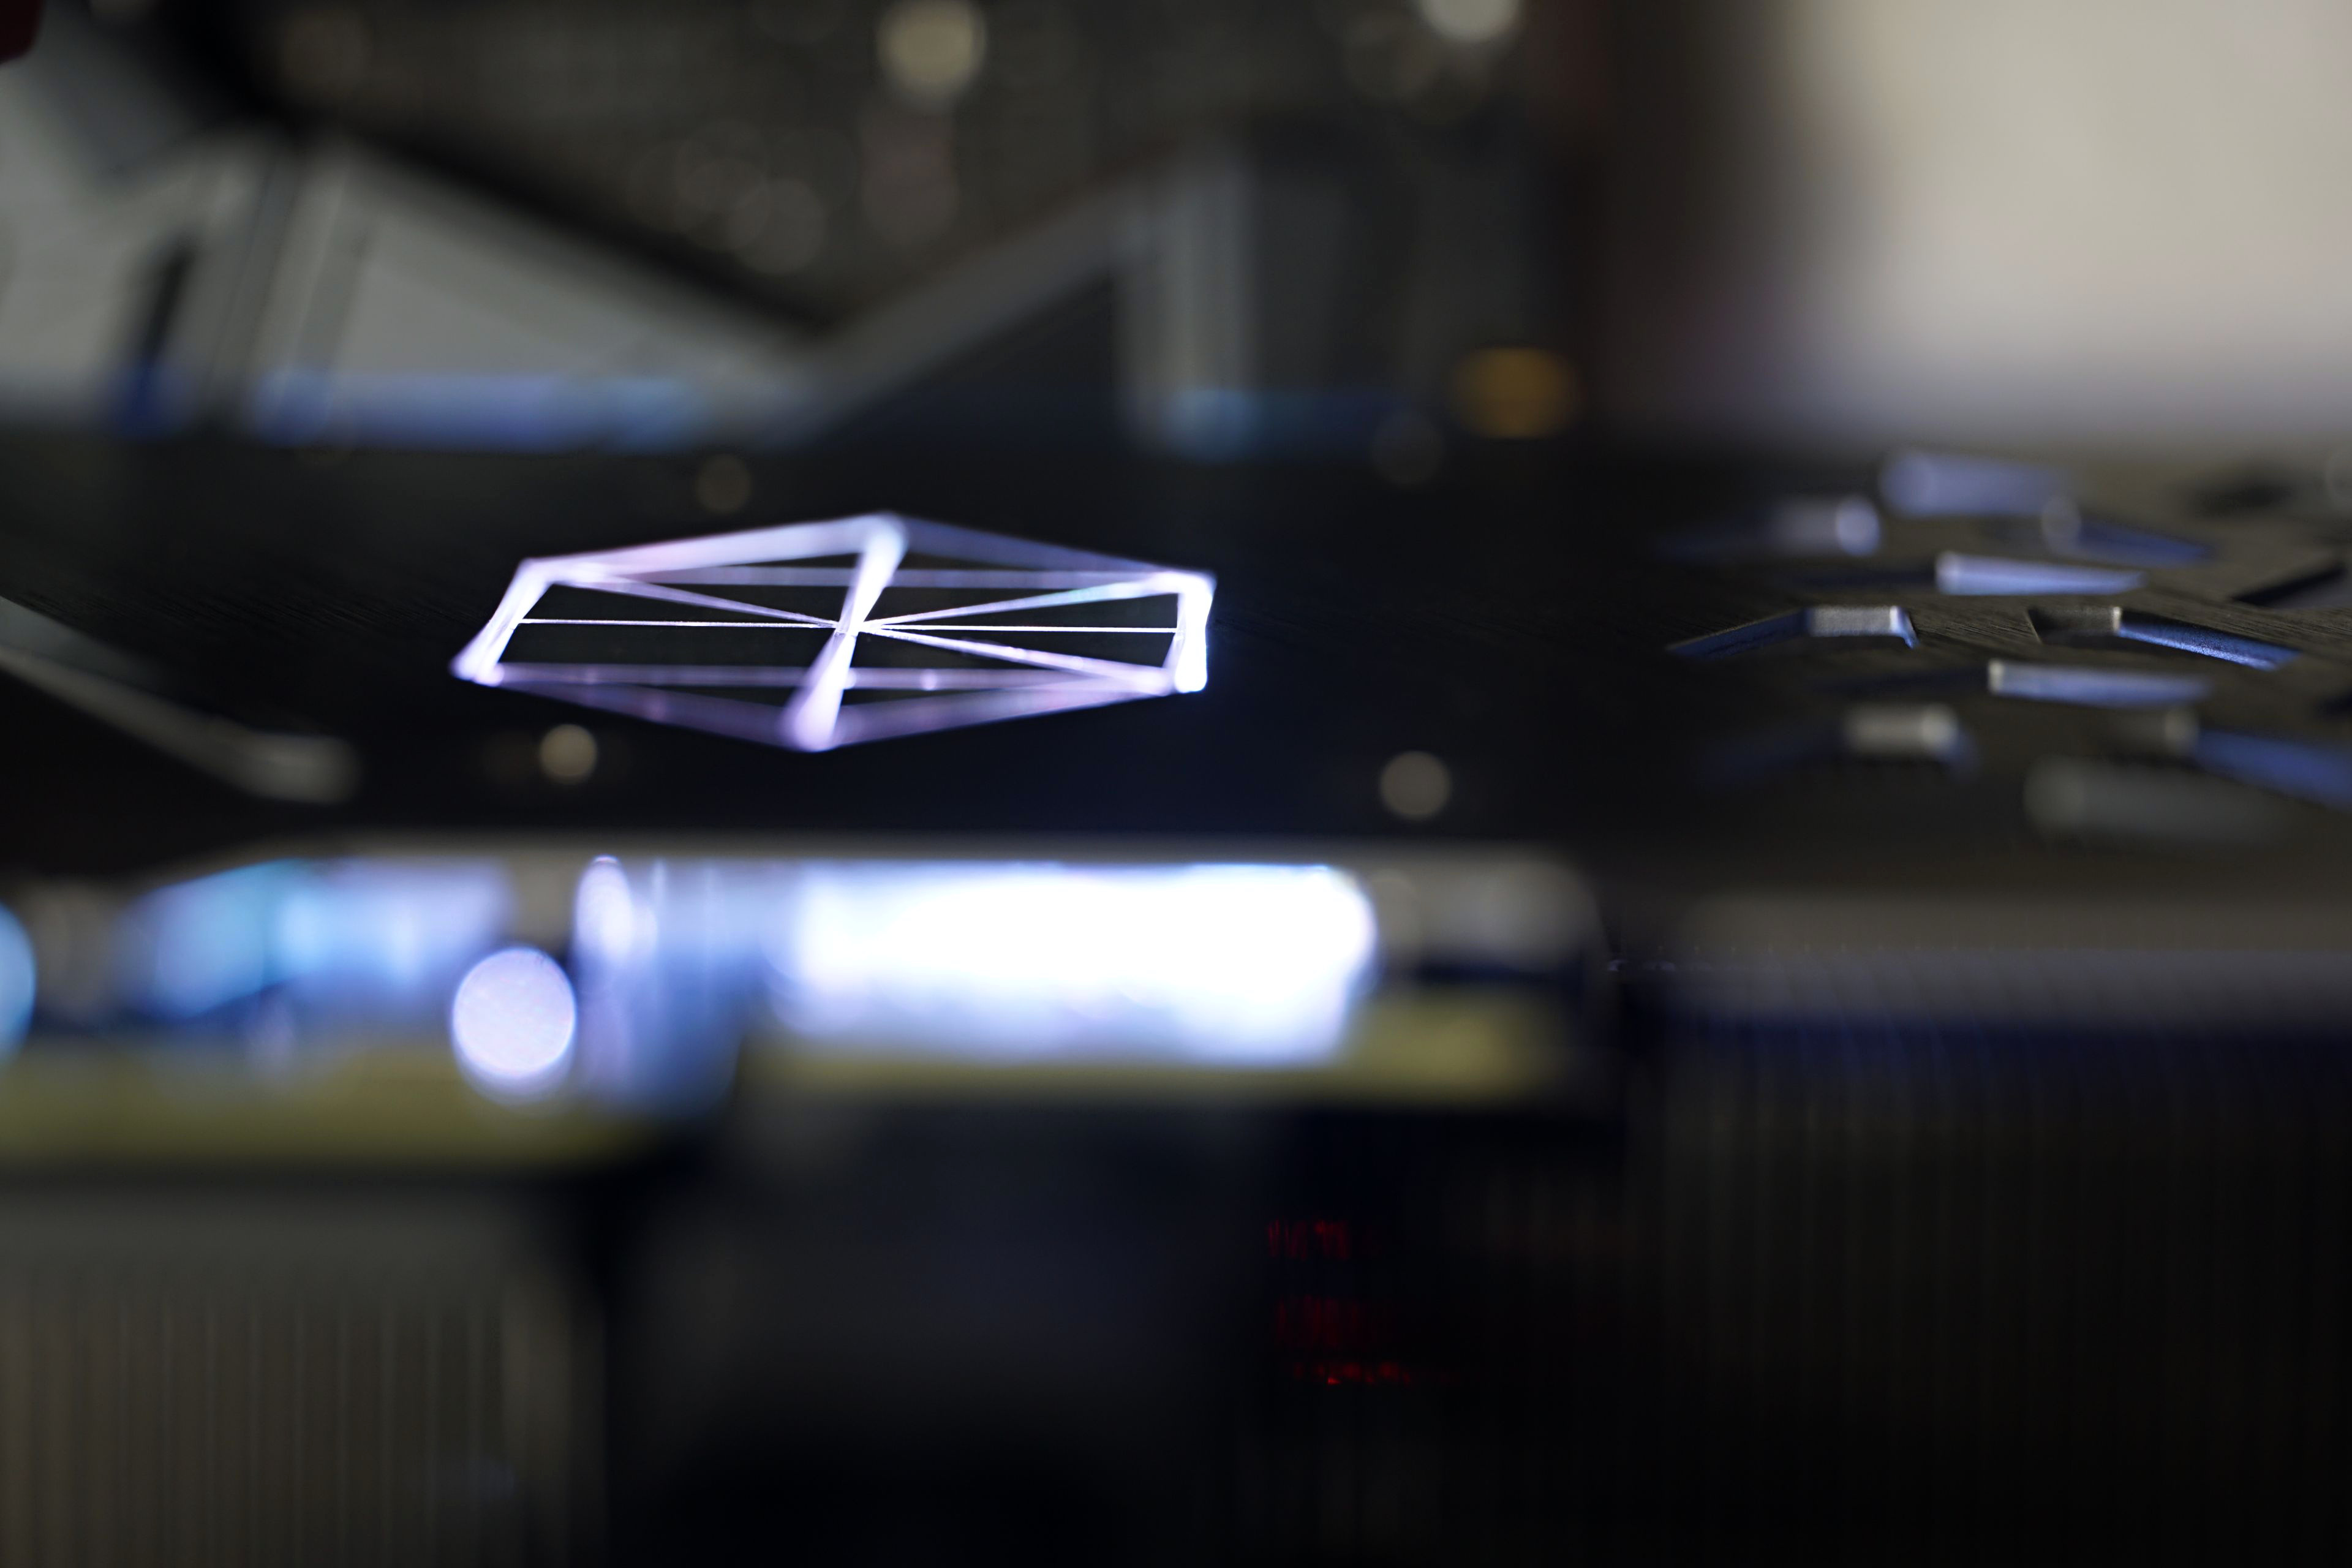
The ARGB LED backlight is on three sides. The light-guiding strips are between the fans, on the side (with the Suprim lettering and MSI logo backlit), and finally on the back where the Suprim logo is illuminated, a formation made up of triangular tiles that symbolizes a diamond as a sign of premiumness.
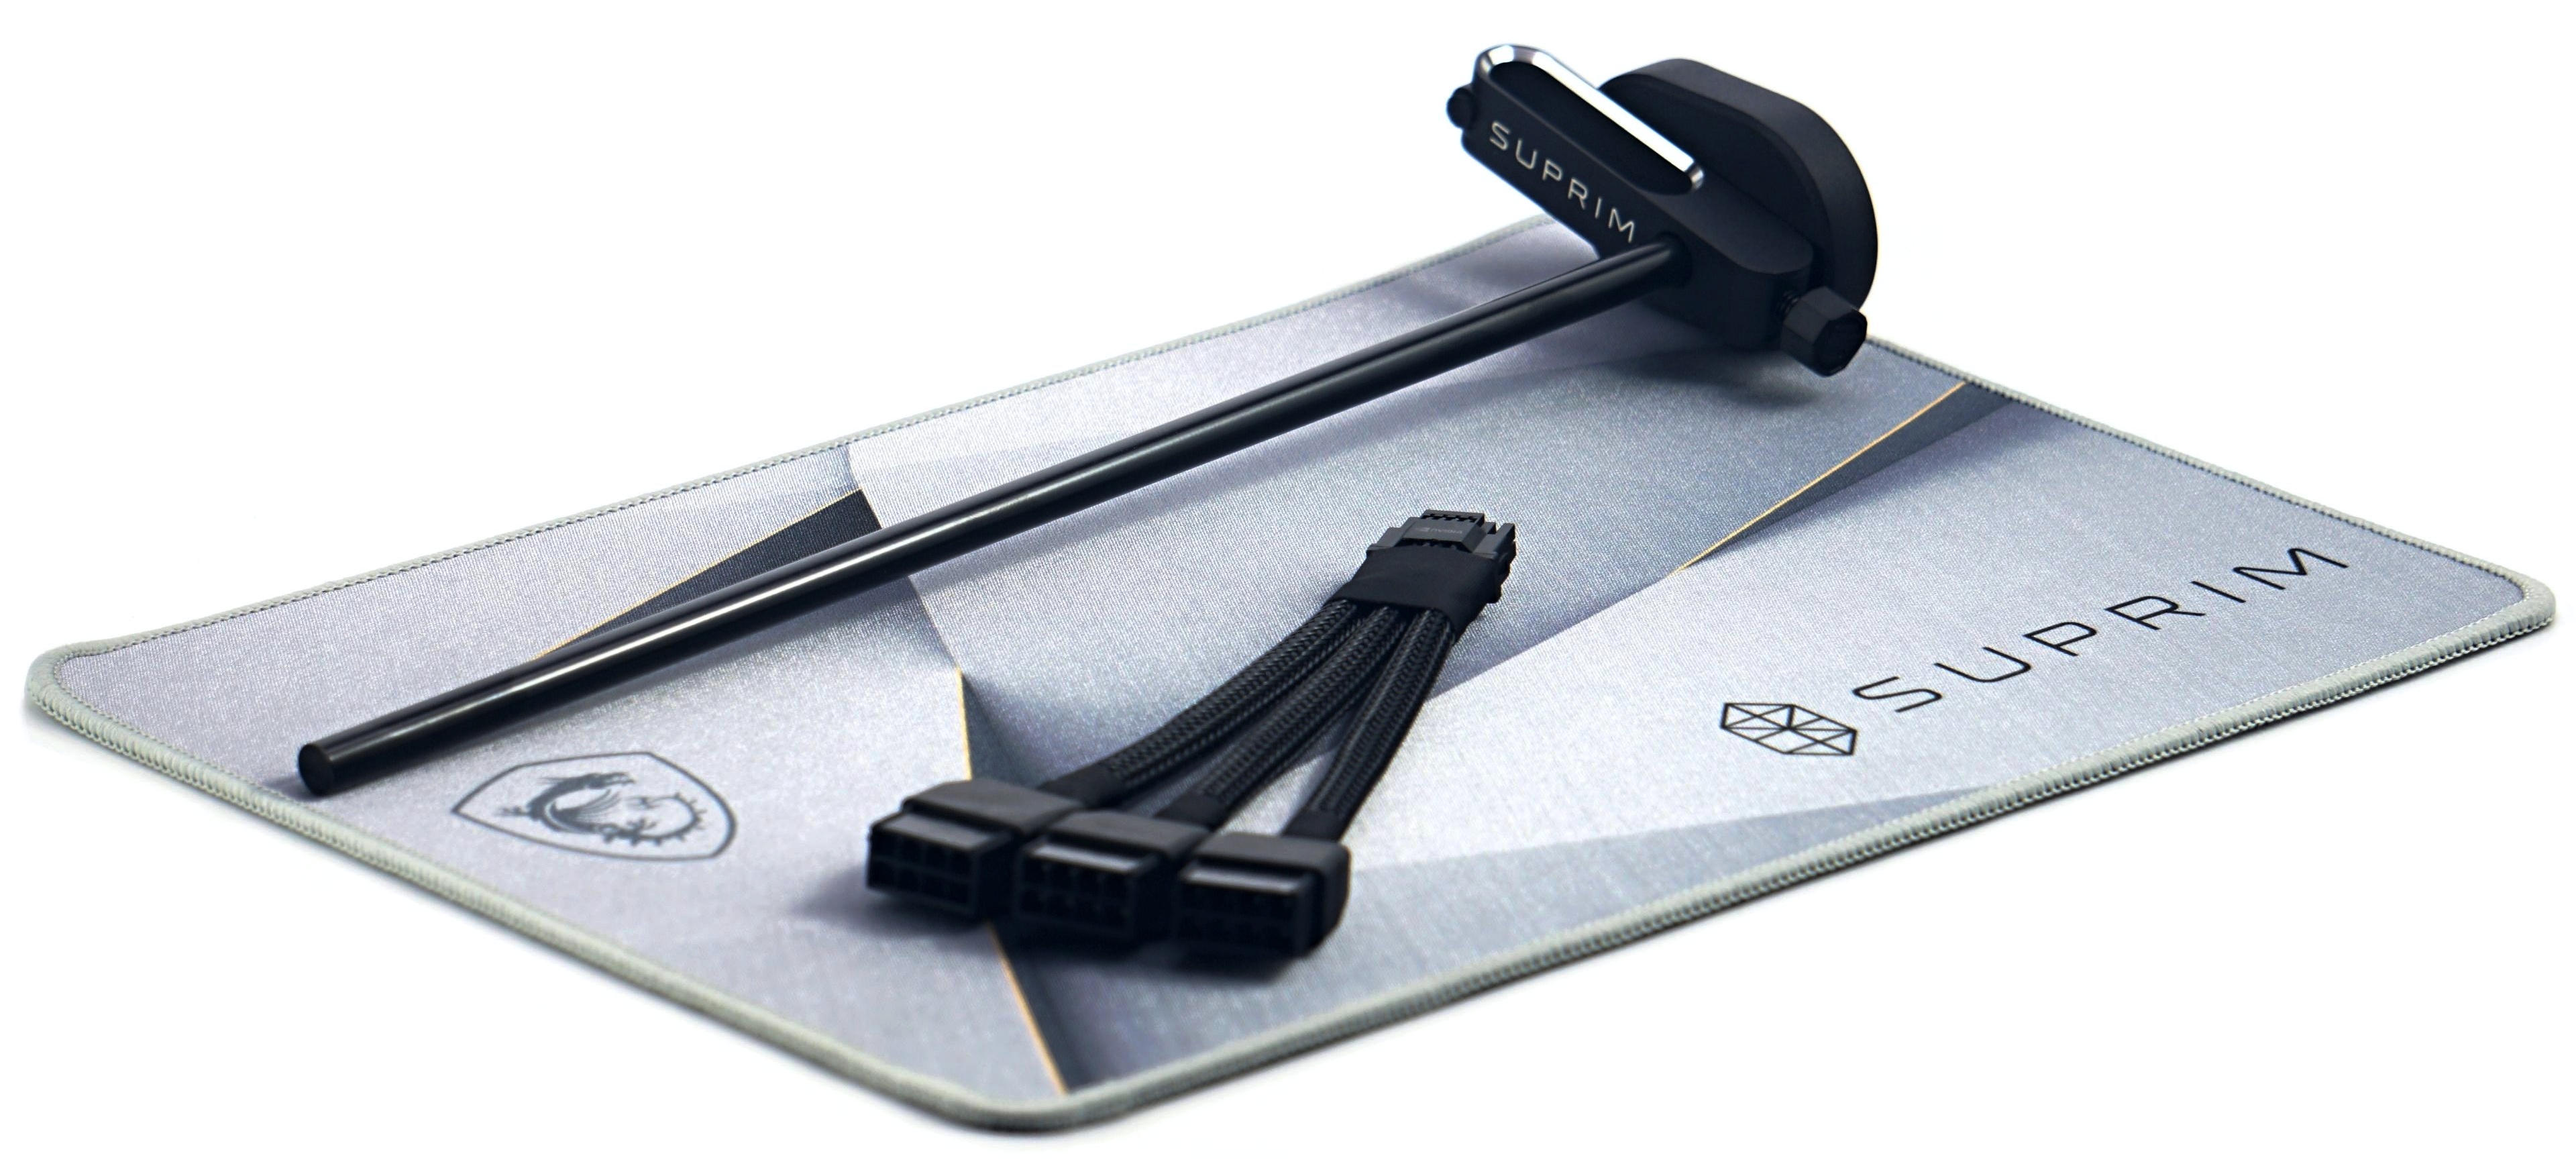
The accessories include, in addition to the power adapter, a Suprim-themed mouse pad, but most importantly, a height-adjustable support bracket. This supports the graphics card from behind to keep it level and not overly burden the PCI Express slot. MSI’s “holder” is sturdy and, thanks to the rubber base, stable even when handling the whole computer.
Please note: The article continues with following chapters.
After the GeForce RTX 4080 graphics cards, which wasn’t to many people’s taste due to the higher price, Nvidia has released a significantly cheaper GPU for the GeForce RTX 4070 Ti. The performance versus the RTX 4080 is admittedly noticeably weaker, but percentage-wise not by as much as the roughly two-thirds lower price of the RTX 4070 Ti. In our tests, we analyze MSI’s non-reference design from the top-of-the-line Suprim X series.
| Parameters | MSI RTX 4070 Ti Suprim X 12G | |
| MSI RTX 4070 Ti Suprim X 12G | ||
| Architecture | Ada Lovelace | |
| Die | AD104-400-A1 | |
| Manufacturing node | 4 nm TSMC | |
| Die size | 295 mm² | |
| Transistor count | 35,8 bn. | |
| Compute units | 60 | |
| Shaders/CUDA cores | 7680 | |
| Base Clock | 2310 MHz | |
| Game Clock (AMD) | – | |
| Boost Clock | 2775 MHz | |
| RT units | 60 | |
| AI/tensor cores | 240 | |
| ROPs | 80 | |
| TMUs | 240 | |
| L2 Cache | 48 MB | |
| Infinity Cache | – | |
| Interface | PCIe 4.0 ×16 | |
| Multi-GPU interconnect | – | |
| Memory | 12 GB GDDR6X | |
| Memory clock (effective) | 21.0 GHz | |
| Memory bus | 192 bit | |
| Memory bandwidth | 504.2 GB/s | |
| Pixel fillrate | 222.0 Gpx/s | |
| Texture fillrate | 666.0 Gtx/s | |
| FLOPS (FP32) | 42.62 TFLOPS | |
| FLOPS (FP64) | 666.0 GFLOPS | |
| FLOPS (FP16) | 42.62 TFLOPS | |
| AI/tensor TOPS (INT8) | 170.5 | |
| AI/tensor FLOPS (FP16) | 341.0 | |
| TDP | 285 W | |
| Power connectors | 1× 16-pin | |
| Card lenght | 338 mm | |
| Card slots used | 73 mm | |
| Shader Model | 6.6 | |
| DirectX/Feature Level | DX 12 Ultimate (12_2) | |
| OpenGL | 4.6 | |
| Vulkan | 1.3 | |
| OpenCL | 3.0 | |
| CUDA | 8.9 | |
| Video encoder engine | NVEnc 8 | |
| Encoding formats | HEVC, H.264, AV1 | |
| Encoding resolution | 8K | |
| Video decoder engine | NVDec 5 | |
| Decoding formats | HEVC, H.264,VP9, AV1 | |
| Decoding resolution | 8K | |
| Max. Monitor resolution | 7680 × 4320 px | |
| HDMI | 1× (2.1) | |
| DisplayPort | 3× (1.4a) | |
| USB-C | – | |
| MSRP | 1055 EUR |
After the GeForce RTX 4080 graphics cards, which wasn’t to many people’s taste due to the higher price, Nvidia has released a significantly cheaper GPU for the GeForce RTX 4070 Ti. The performance versus the RTX 4080 is admittedly noticeably weaker, but percentage-wise not by as much as the roughly two-thirds lower price of the RTX 4070 Ti. In our tests, we analyze MSI’s non-reference design from the top-of-the-line Suprim X series.
Gaming tests
The largest sample of tests is from games. This is quite natural given that GeForce and Radeons, i.e. cards primarily intended for gaming use, will mostly be tested.
We chose the test games primarily to ensure the balance between the titles better optimized for the GPU of one manufacturer (AMD) or the other one (Nvidia). But we also took into account the popularity of the titles so that you could find your own results in the charts. Emphasis was also placed on genre diversity. Games such as RTS, FPS, TPS, car racing as well as a flight simulator, traditional RPG and sports games are represented by the most played football game. You can find a list of test games in the library of chapters (9–32), with each game having its own chapter, sometimes even two (chapters) for the best possible clarity, but this has its good reason, which we will share with you in the following text.
Before we start the gaming tests, each graphics card will pass the tests in 3D Mark to warm up to operating temperature. That’s good synthetics to start with.
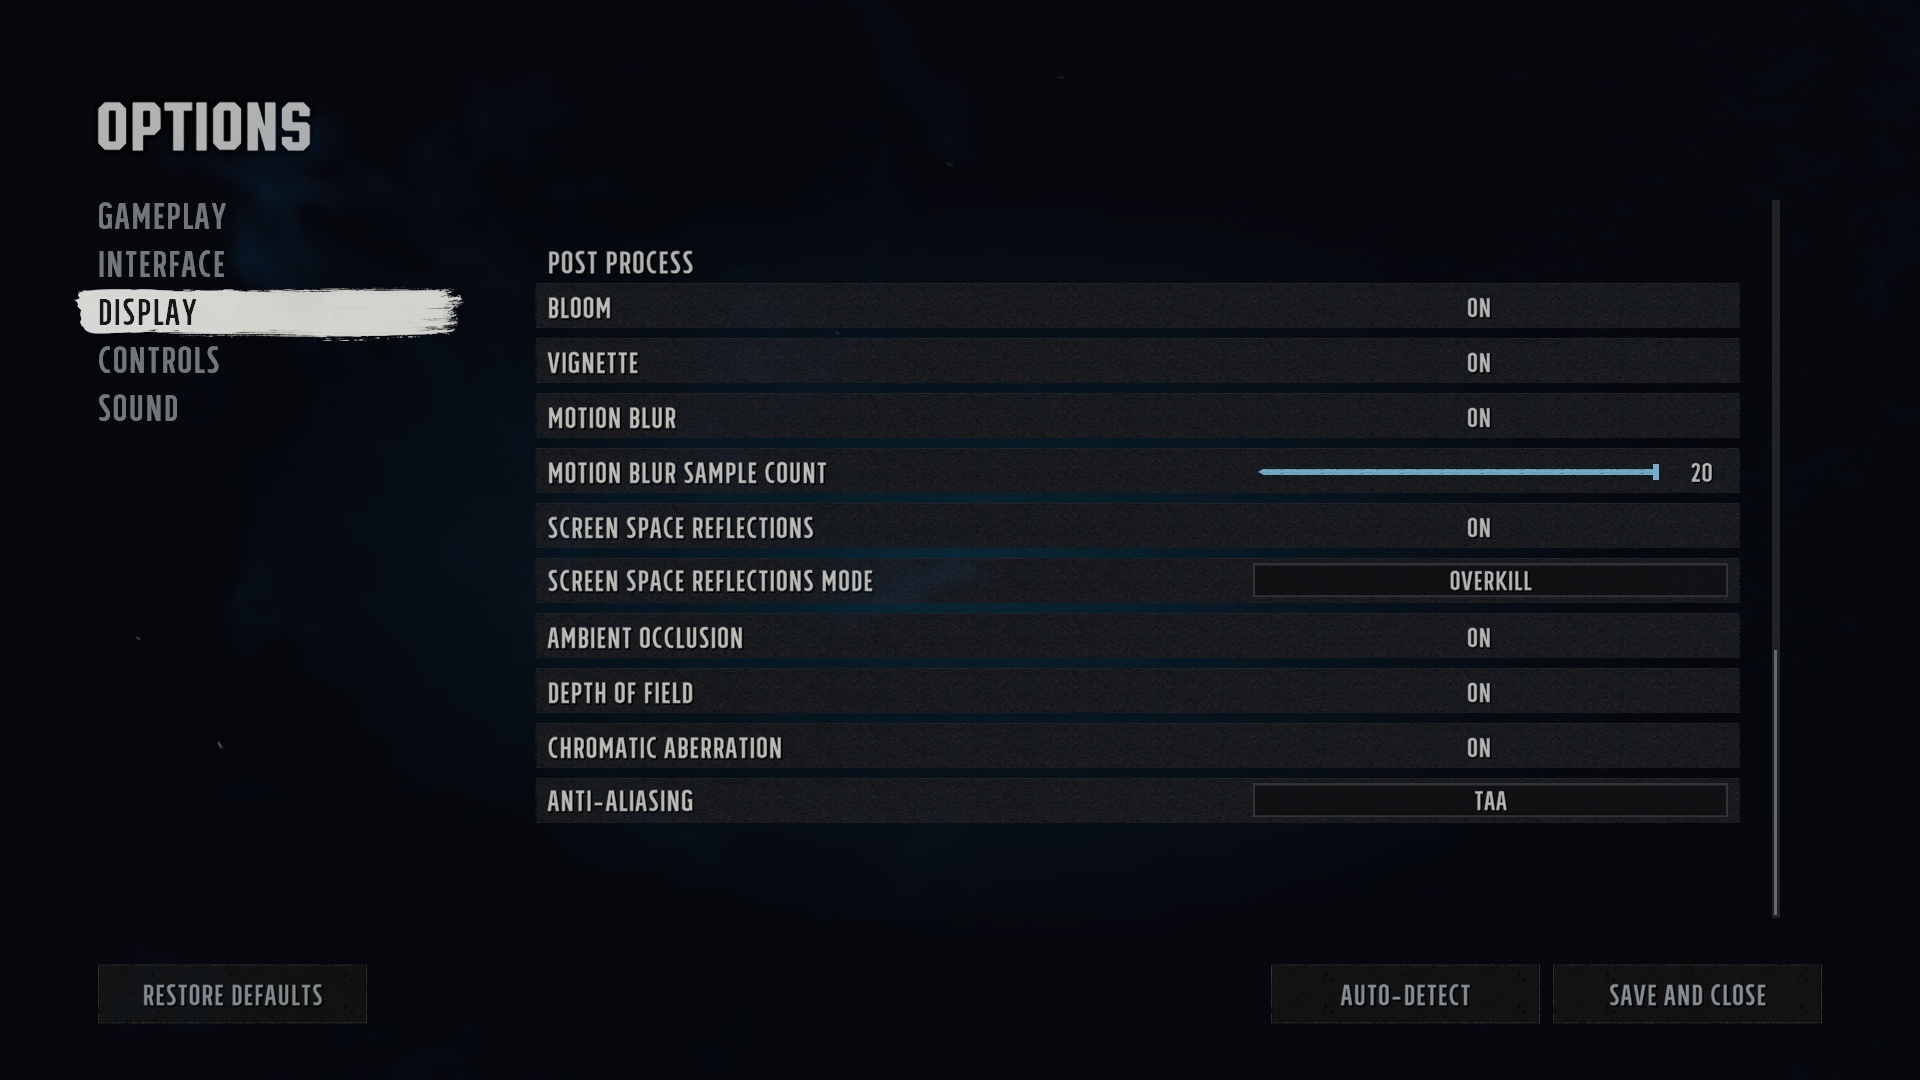
We’re testing performance in games across three resolutions with an aspect ratio of 16:9 – FHD (1920 × 1080 px), QHD (2560 × 1440 px) and UHD (3840 × 2160 px) and always with the highest graphic settings, which can be set the same on all current GeForce and Radeon graphics cards. We turned off proprietary settings for the objectivity of the conclusions, and the settings with ray-tracing graphics are tested separately, as lower class GPUs do not support them. You will find their results in the complementary chapters. In addition to native ray-tracing, also after deploying Nvidia DLSS (2.0) and AMD FidelityFX CAS.
If the game has a built-in benchmark, we use that one (the only exception is Forza Horizon 4, where due to its instability – it used to crash here and there – we drive on our track), in other cases the measurements take place on the games’ own scenes. From those we capture the times of consecutive frames in tables (CSV) via OCAT, which FLAT interprets into intelligible fps speech. Both of these applications are from the workshop of colleagues from the gpureport.cz magazine. In addition to the average frame rate, we also write the minimum in the graphs. That contributes significantly to the overall gaming experience. For the highest possible accuracy, all measurements are repeated three times and the final results form their average value.
Computational tests
Testing the graphics card comprehensively, even in terms of computing power, is more difficult than drawing conclusions from the gaming environment. Just because such tests are usually associated with expensive software that you don’t just buy for the editorial office. On the other hand, we’ve found ways to bring the available computing performance to you. On the one hand, thanks to well-built benchmarks, there are also some freely available and at the same time relevant applications, and thirdly, we have invested something in the paid ones.
The tests begin with ComputeBench, which computes various simulations (including game graphics). Then we move on to the popular SPECviewperf benchmark (2020), which integrates partial operations from popular 2D and 3D applications, including 3Ds max and SolidWorks. Details on this test package can be found at spec.org. From the same team also comes SPECworkstation 3, where GPU acceleration is in the Caffe and Folding@Home tests. You can also find the results of the LuxMark 3.1 3D render in the graphs, and the remarkable GPGPU theoretical test also includes AIDA64 with FLOPS, IOPS and memory speed measurements.
For obvious reasons, 3D rendering makes the largest portion of the tests. This is also the case, for example, in the Blender practical tests (2.91). In addition to Cycles, we will also test the cards in Eevee and radeon ProRender renderers (let AMD have a related test, as most are optimized for Nvidia cards with proprietary CUDA and OptiX frameworks). Of course, an add-on for V-ray would also be interesting, but at the moment the editorial office can’t afford it, we may manage to get a “press” license in time, though, we’ll see. We want to expand application tests in the future. Definitely with some advanced AI testing (we haven’t come up with a reasonable way yet), including noise reduction (there would be some ideas already, but we haven’t incorporated those due to time constraints).

Graphics cards can also be tested well in photo editing. To get an idea of the performance in the popular Photoshop, we’re using a script in PugetBench, which simulates real work with various filters. Among them are those that use GPU acceleration. A comprehensive benchmark suggesting the performance of raster and vector graphics is then also used in alternative Affinity Photo. In Lightroom, there are remarkable color corrections (Enhance Details) of raw uncompressed photos. We apply these in batches to a 1 GB archive. All of these tasks can be accelerated by both GeForce and Radeon.
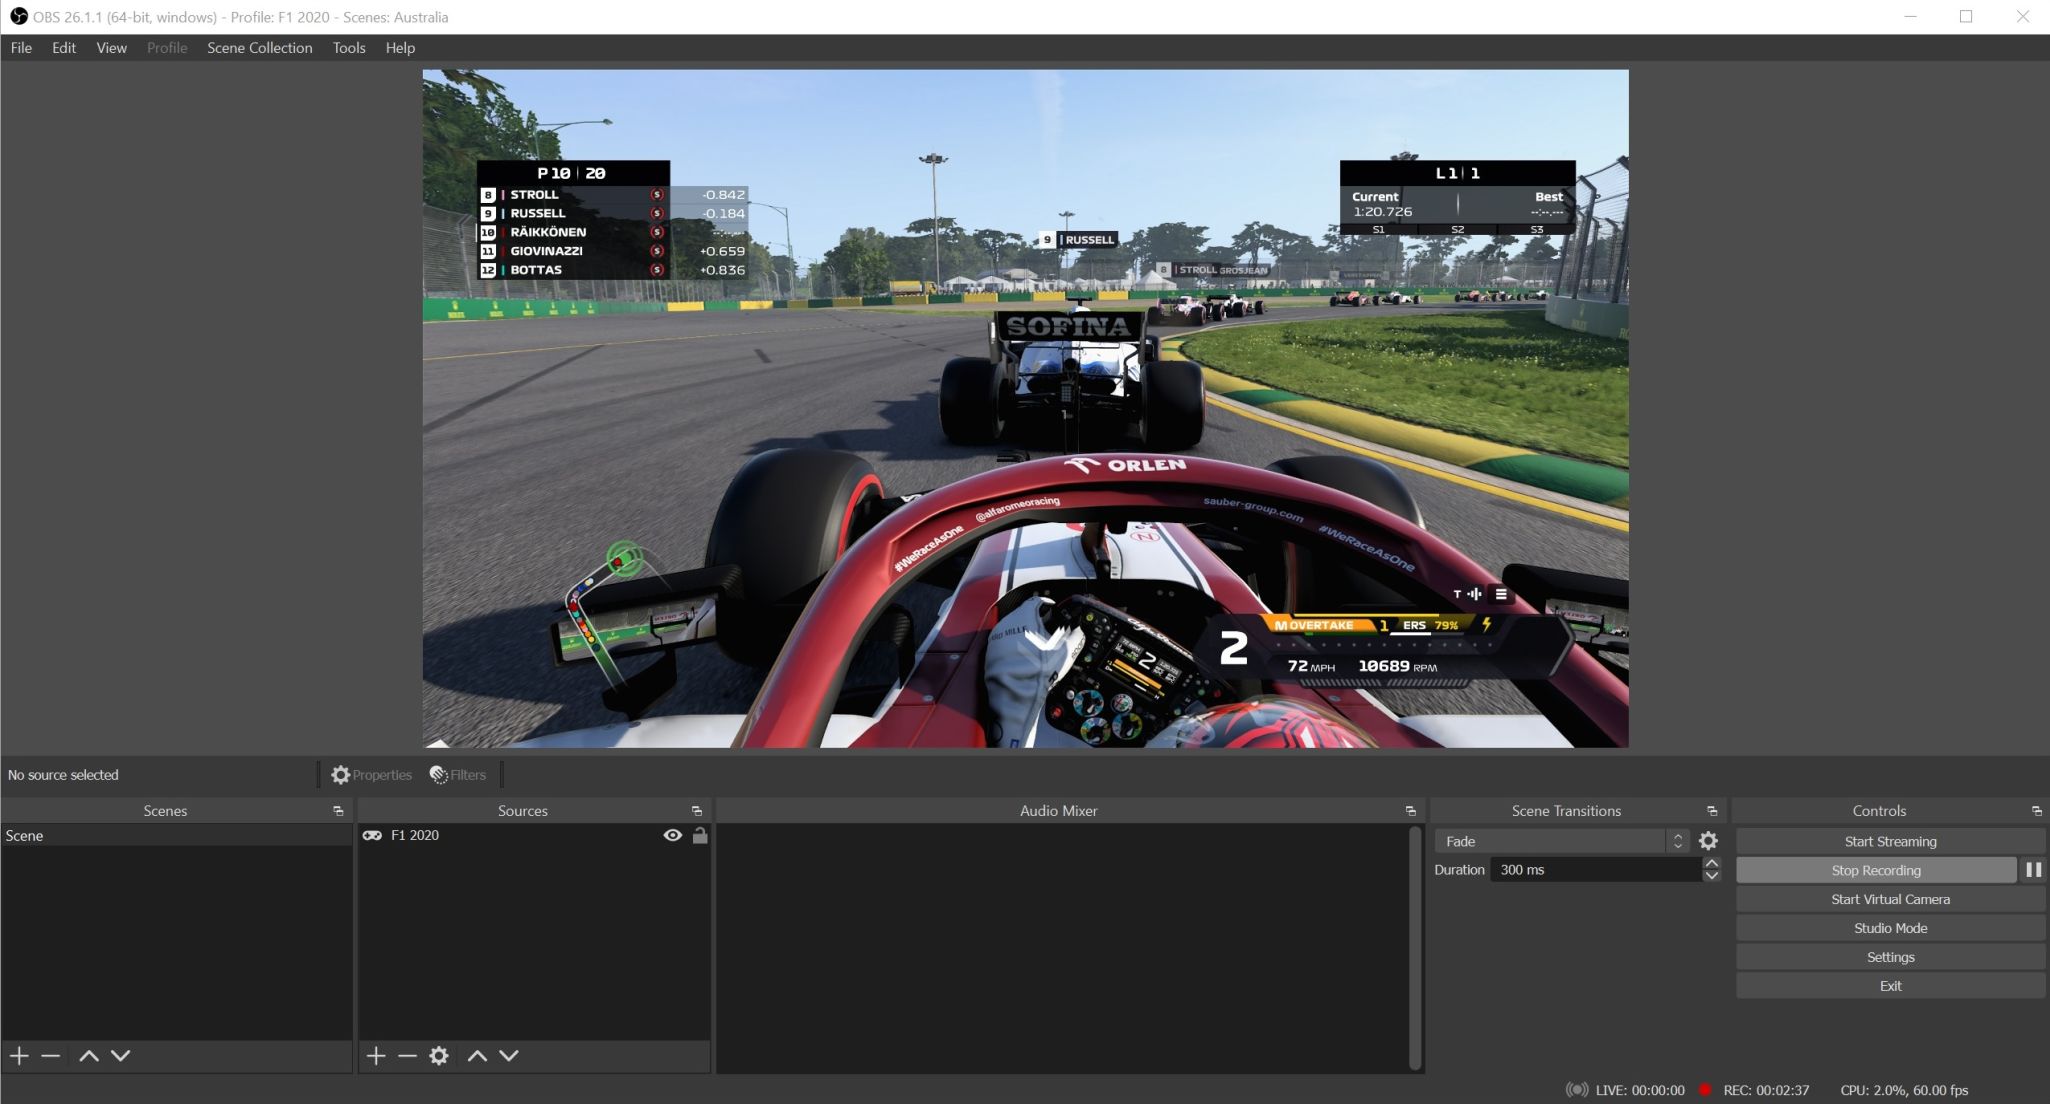
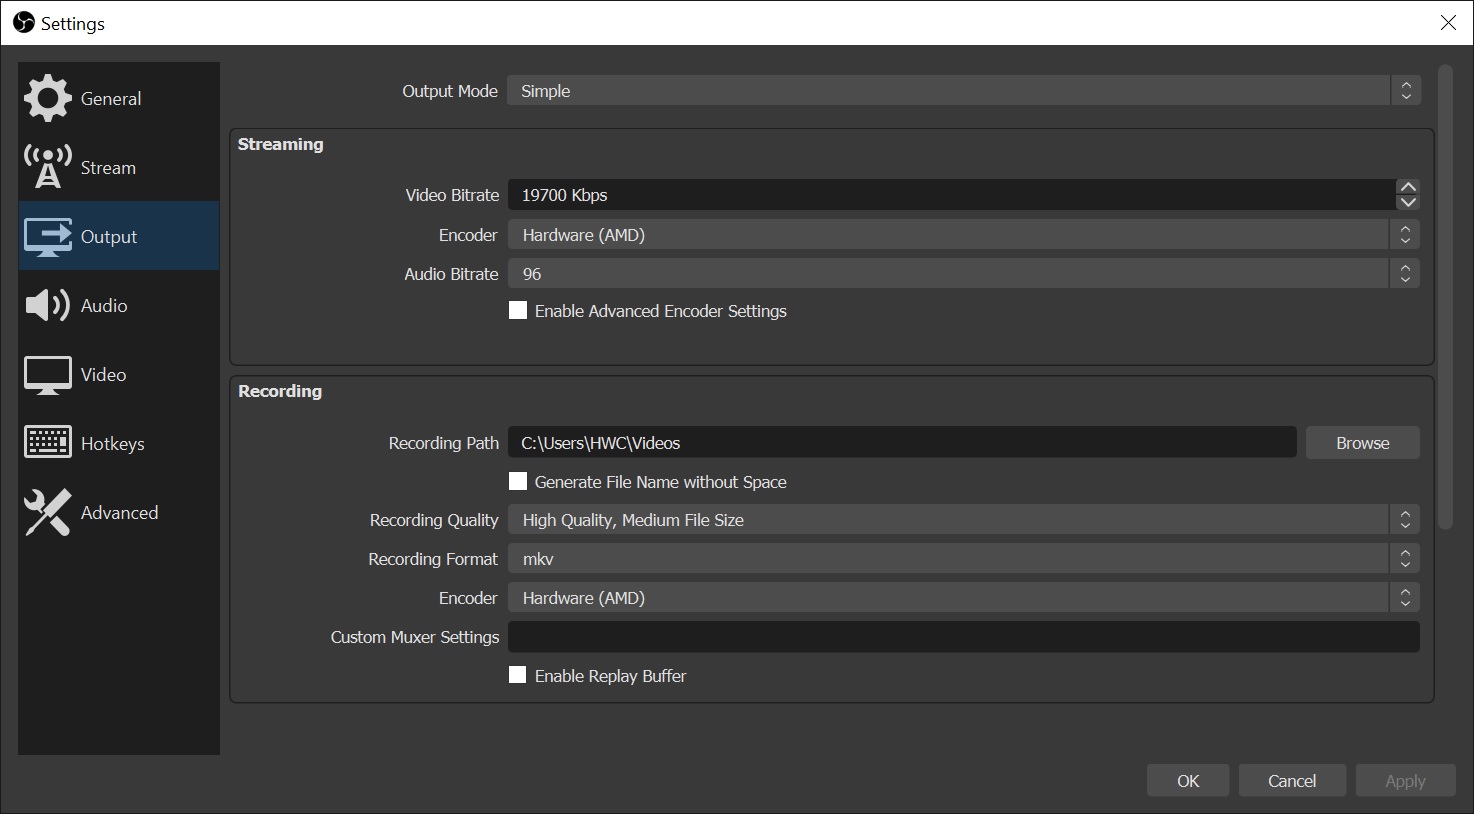
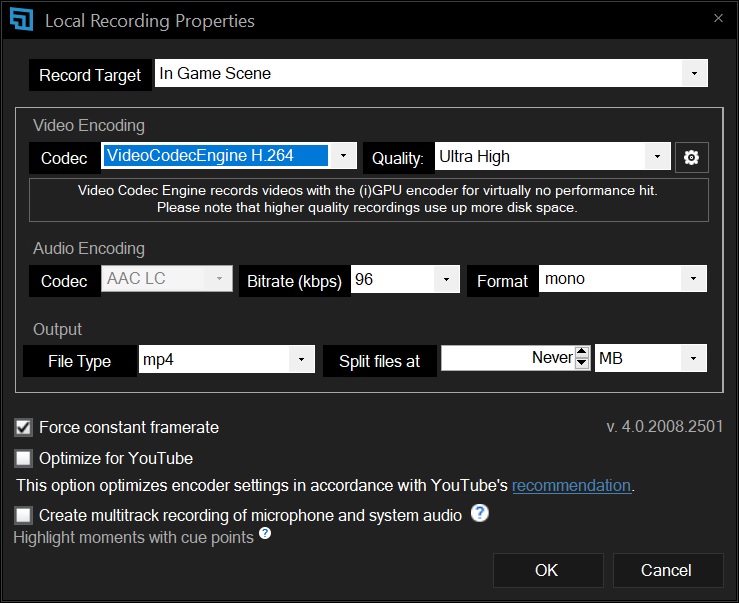
From another perspective, there are decryption tests in Hashcat with a selection of AES, MD5, NTLMv2, SHA1, SHA2-256/512 and WPA-EAPOL-PBKDF2 ciphers. Finally, in the OBS and XSplit broadcast applications, we measure how much the game performance will be reduced while recording. It is no longer provided by shaders, but by coders (AMD VCE and Nvidia Nvenc). These tests show how much spare performance each card has for typical online streaming.
There are, of course, more hardware acceleration options, typically for video editing and conversion. However, this is purely in the hands of encoders, which are always the same within one generation of cards from one manufacturer, so there is no point in testing them on every graphics card. It is different across generations and tests of this type will sooner or later appear. Just fine-tuning the metric is left, where the output will always have the same bitrate and pixel match. This is important for objective comparisons, because the encoder of one company/card may be faster in a particular profile with the same settings, but at the expense of the lower quality that another encoder has (but may not have, it’s just an example).
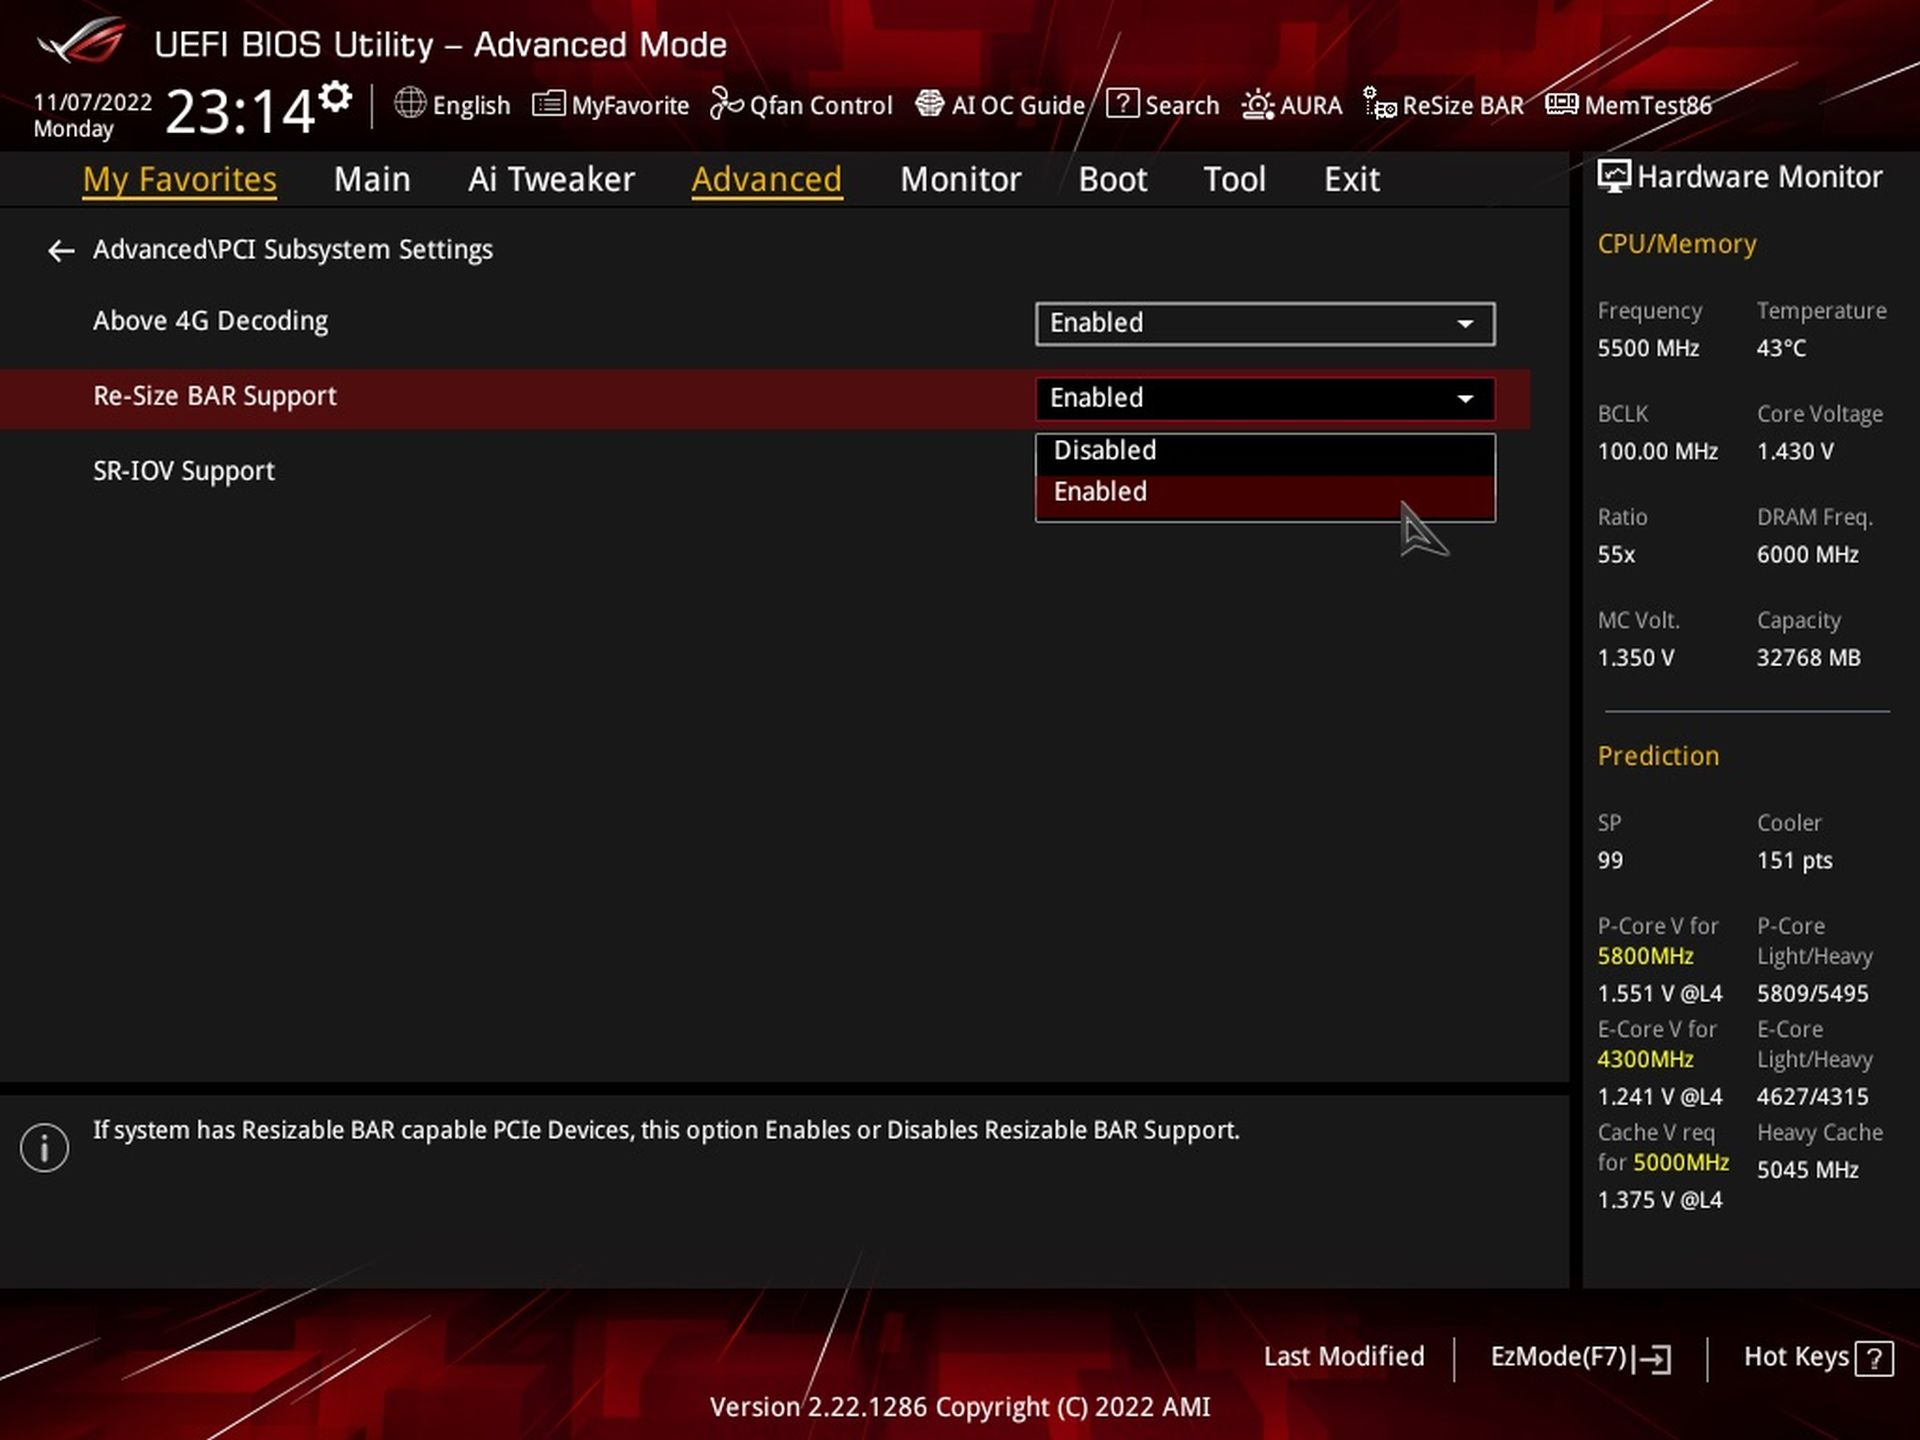
New: As of November 18, 2022, we are testing all graphics cards only in Resizable BAR active mode. There are three reasons why we will not continue with measurements without ReBAR.
The main reason is that new motherboards starting with Intel Z790 and AMD X670(E) chipset models already have it enabled, which wasn’t the case before, and the PCIe settings required ReBAR to be enabled manually. So those who don’t turn it off will be running with ReBAR active, which is a good thing from a gaming perspective where it adds performance. This is perhaps to some extent because Intel graphics cards without ReBAR don’t seem to behave correctly, and there will probably be more and more graphics cards that count on it in the future. You already know the number two reason for ReBAR-only tests.
Finally, it is also true that testing all tests twice (with and without ReBAR) with triple repeatability is extremely time consuming. However, it is still true what we have argued many times – a platform with ReBAR is less stable when it comes to measurement results. Over time, some things may change in the debugging process (from driver to driver) and may not “make sense” when compared to each other. So when you see somewhere that in other tests a slower card outperforms a more powerful one in some particular case, remember these words.
The disadvantage of measurements with active ReBAR is, in short, that all comparison tests may not always be perfectly consistent. And it is possible that there will continue to be cases where ReBAR reduces performance rather than adding to it. These are things to be reckoned with when studying results. This applies not only to our tests, but to the tests of all the others who do not retest all the older models in comparison with every new graphics card tested.
After the GeForce RTX 4080 graphics cards, which wasn’t to many people’s taste due to the higher price, Nvidia has released a significantly cheaper GPU for the GeForce RTX 4070 Ti. The performance versus the RTX 4080 is admittedly noticeably weaker, but percentage-wise not by as much as the roughly two-thirds lower price of the RTX 4070 Ti. In our tests, we analyze MSI’s non-reference design from the top-of-the-line Suprim X series.
Methodology: how we measure power draw
We have been tuning the method of measuring power draw for quite a long time and we will also be tuning it for some time. But we already have gimmicks that we can work with happily.
To get the exact value of the total power draw of the graphics card, it is necessary to map the internal power draw on the PCI Express slot and the external one on the additional power supply. For the analysis of the PCIe slot, it was necessary to construct an in-between card on which the power draw measurement takes place. Its basis is resistors calibrated to the exact value (0.1 Ω) and according to the amount of their voltage drop we can calculate the current. We then substitute it into the formula for the corresponding value of the output voltage ~ 12 V and ~ 3.3 V. The voltage drop is so low that it doesn’t make the VRM of the graphics card unstable and the output is still more than 12/3.3 V.

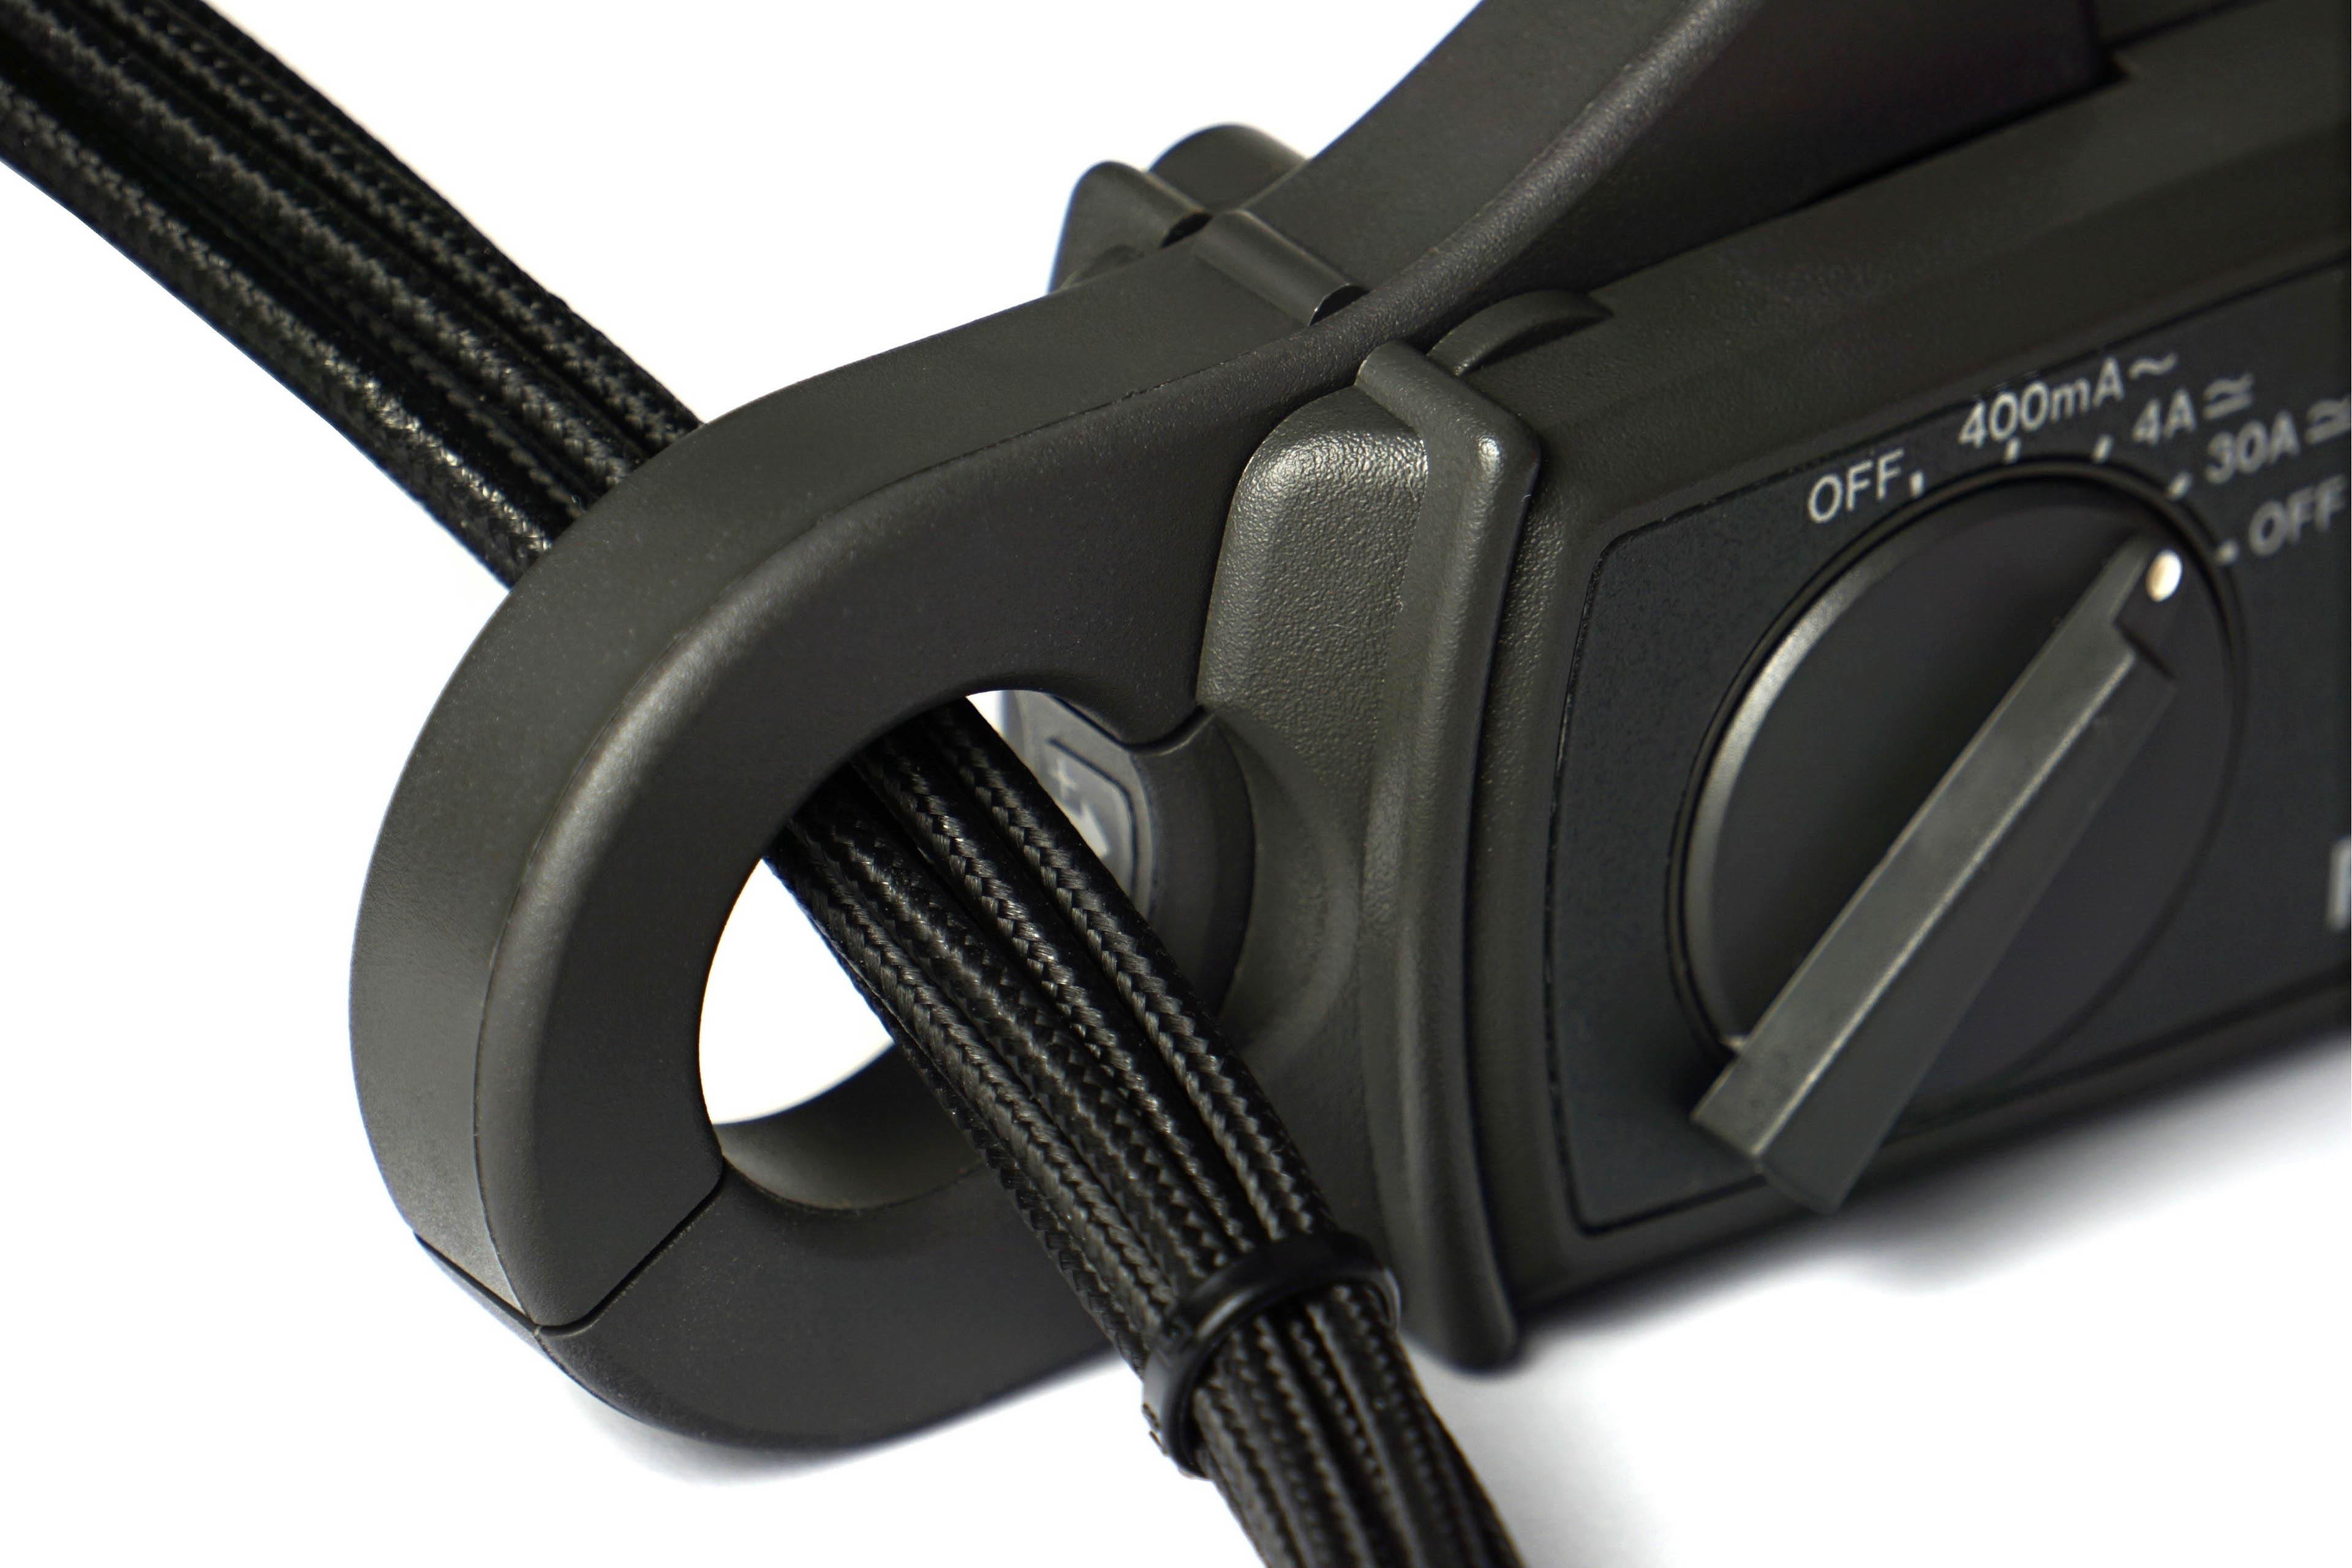
We are also working on a similar device for external power supply. However, significantly higher currents are achieved there, longer cabling and more passages between connectors are necessary, which means that the voltage drop will have to be read on an even smaller resistance of 0.01 Ω, the current state (with 0.1 Ω) is unstable for now. Until we fine-tune it, we will use Prova 15 current clamp for cable measurements, which also measures with good accuracy, they just have a range of up to 30 A. But that is also enough for the OC version of the RTX 3090 Gaming X Trio. If a card is over the range, it is always possible to split the consumption measurement (first into one half and then into the other half of the 12 V conductors).
And why bother with such devices at all when Nvidia has a PCAT power draw analyzer? For complete control over the measurements. While our devices are transparent, the Nvidia’s tool uses the processor that can (but of course does not have to) affect the measurements. After testing the AMD graphics card on the Nvidia’s tool, we probably wouldn’t sleep well.
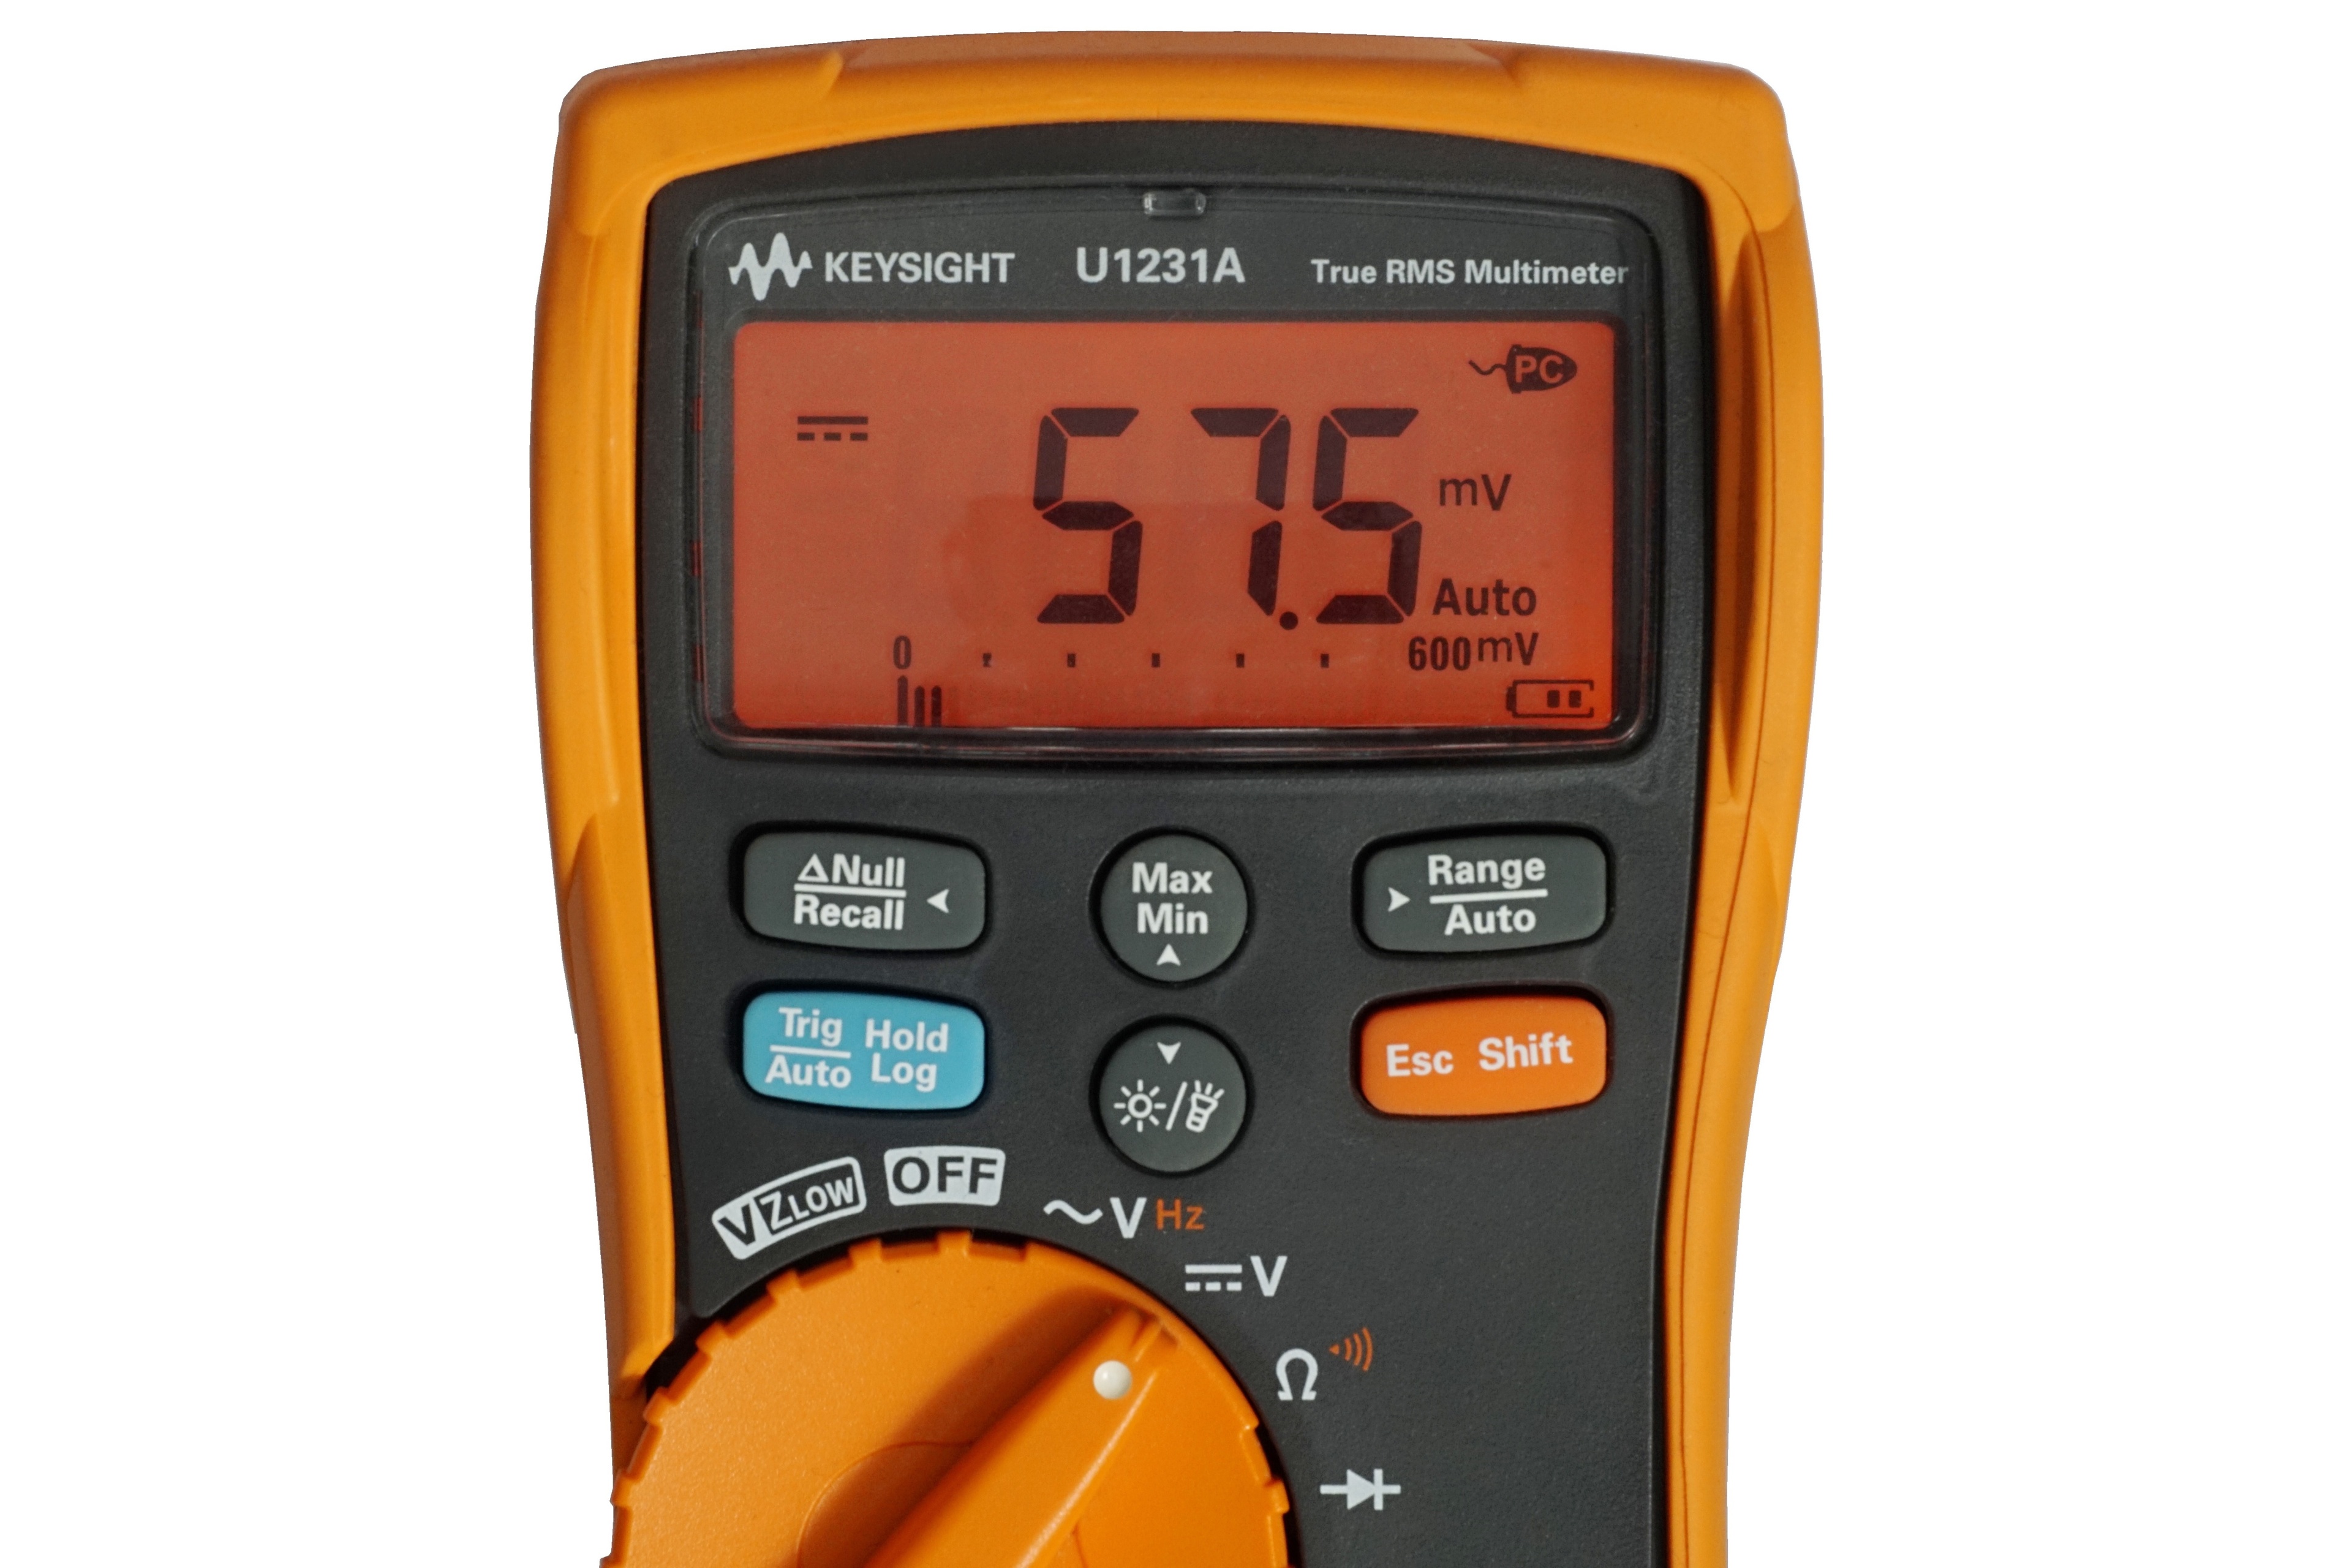
To read and record measurements, we use a properly calibrated multimeter Keysight U1231A, which exports samples to XLS. From it we obtain the average value and by substituting into the formula with the exact value of the subcircuit output voltages we obtain the data for the graphs.


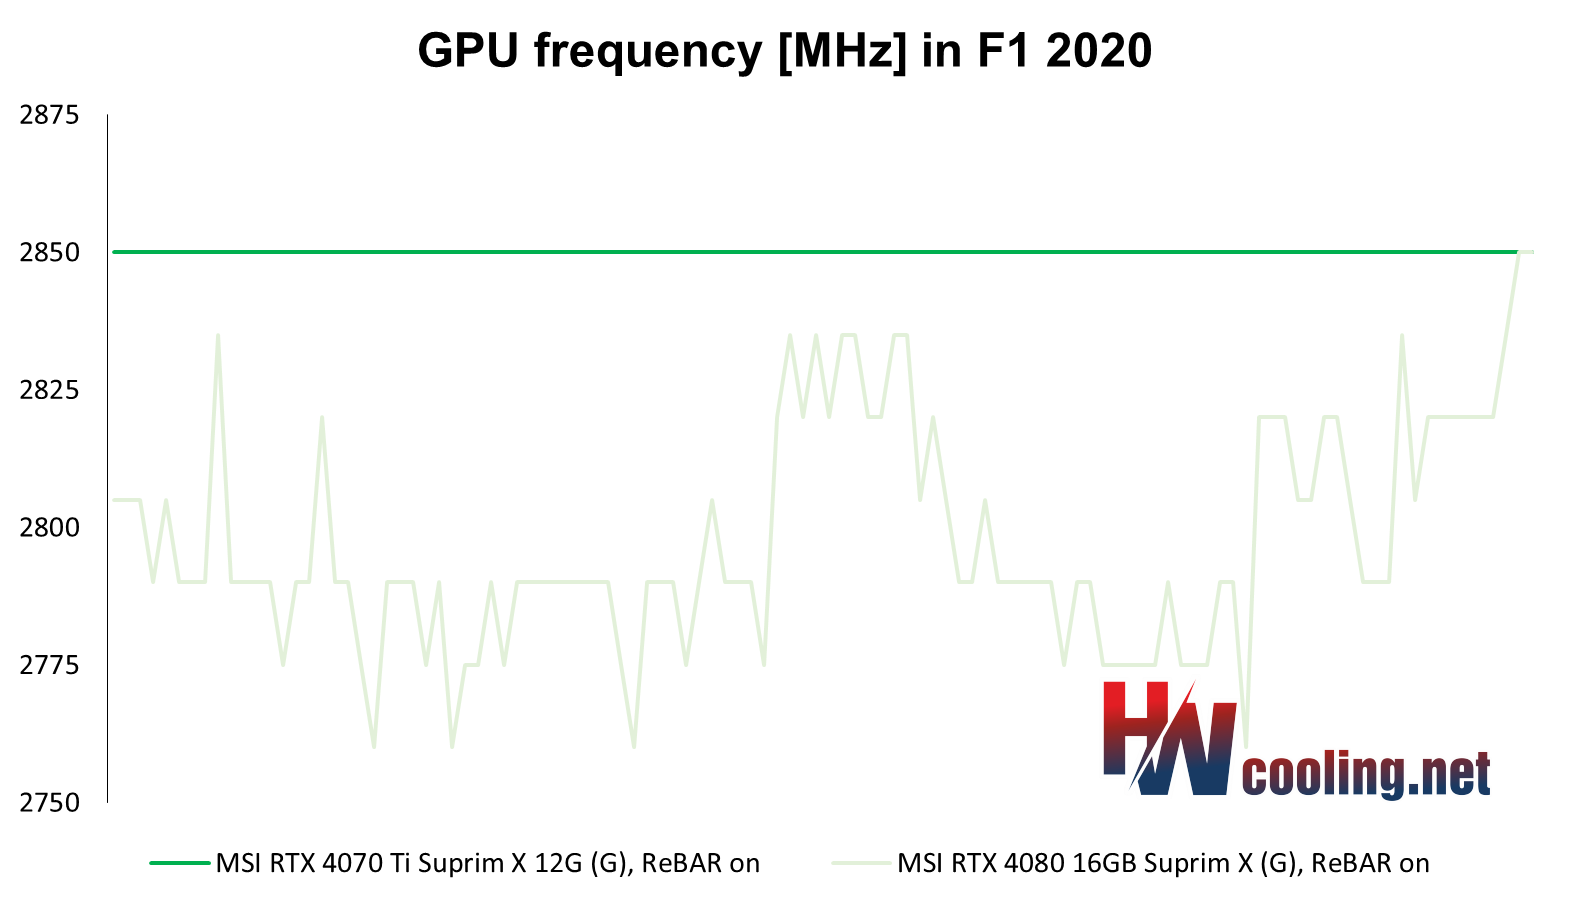
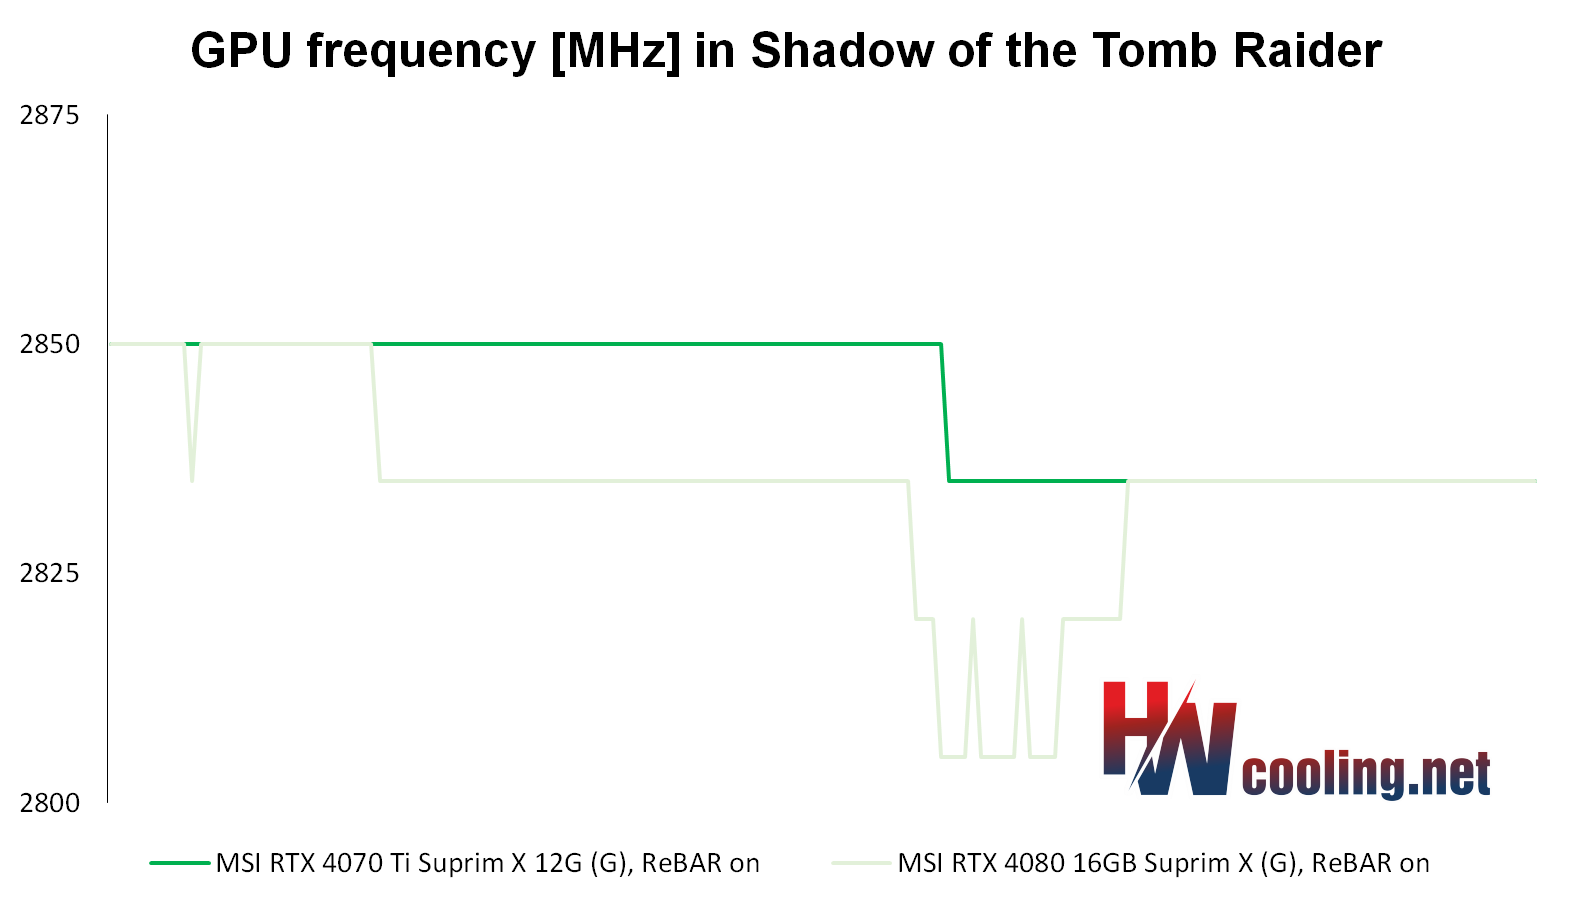
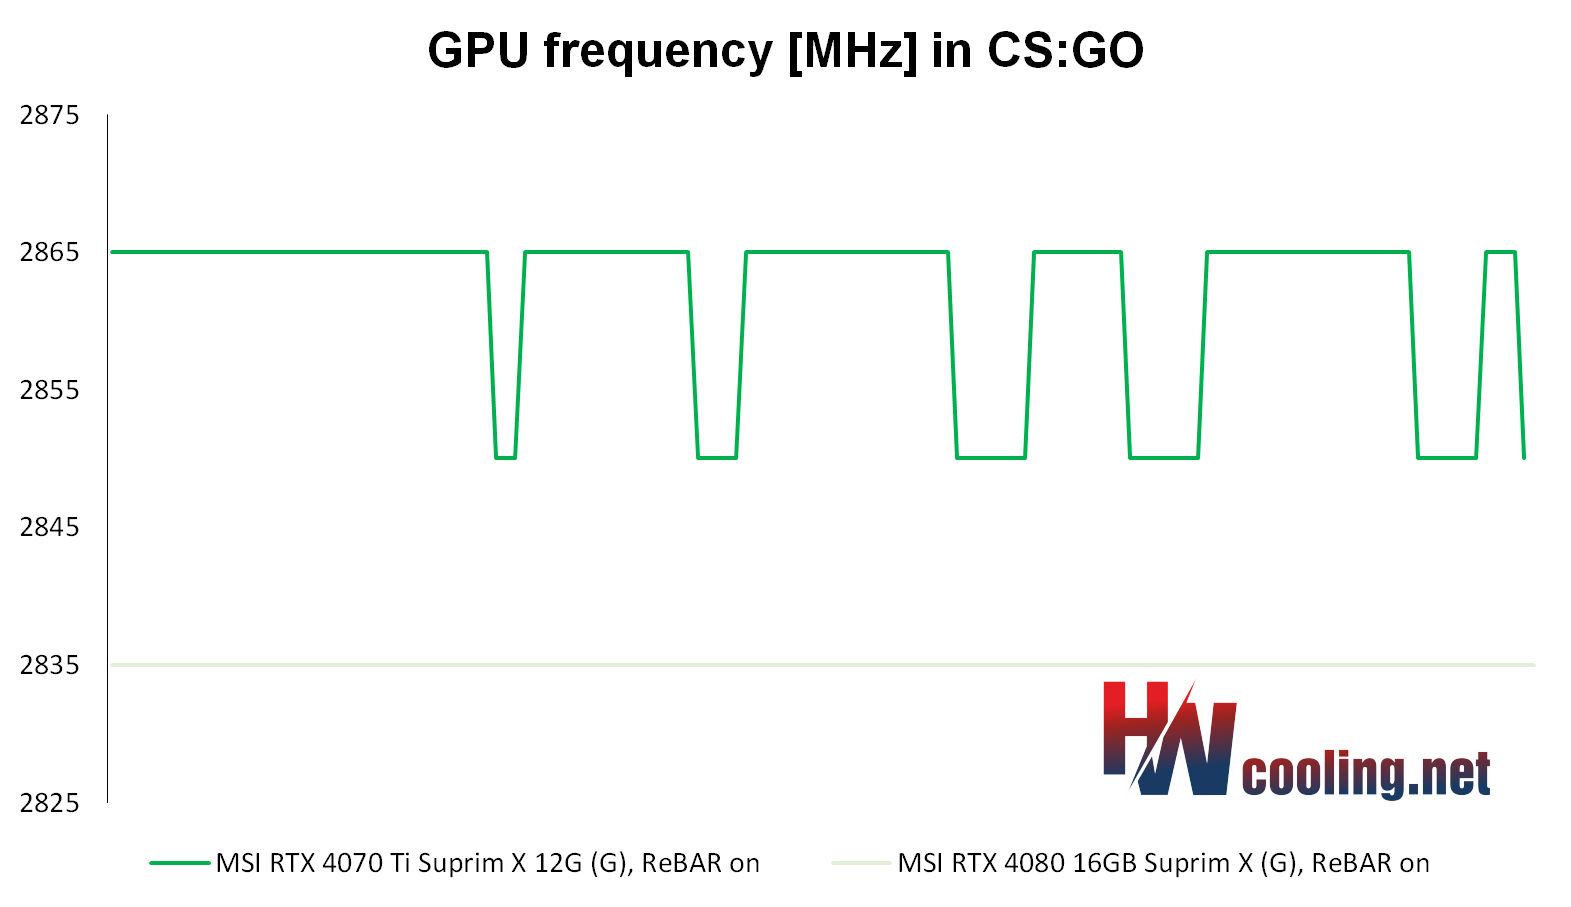
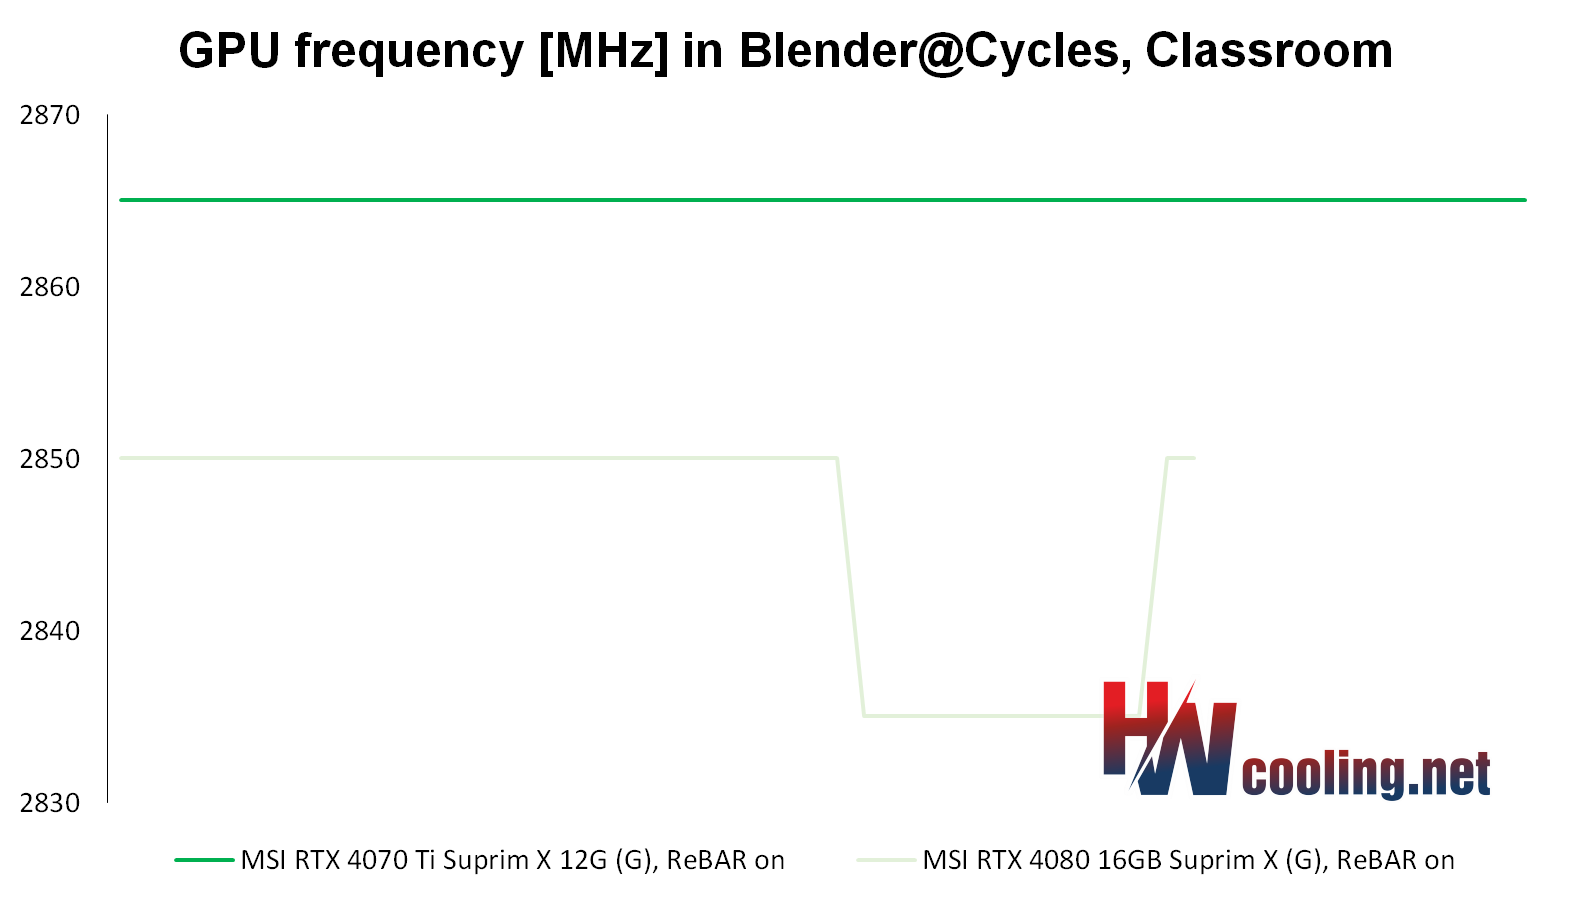
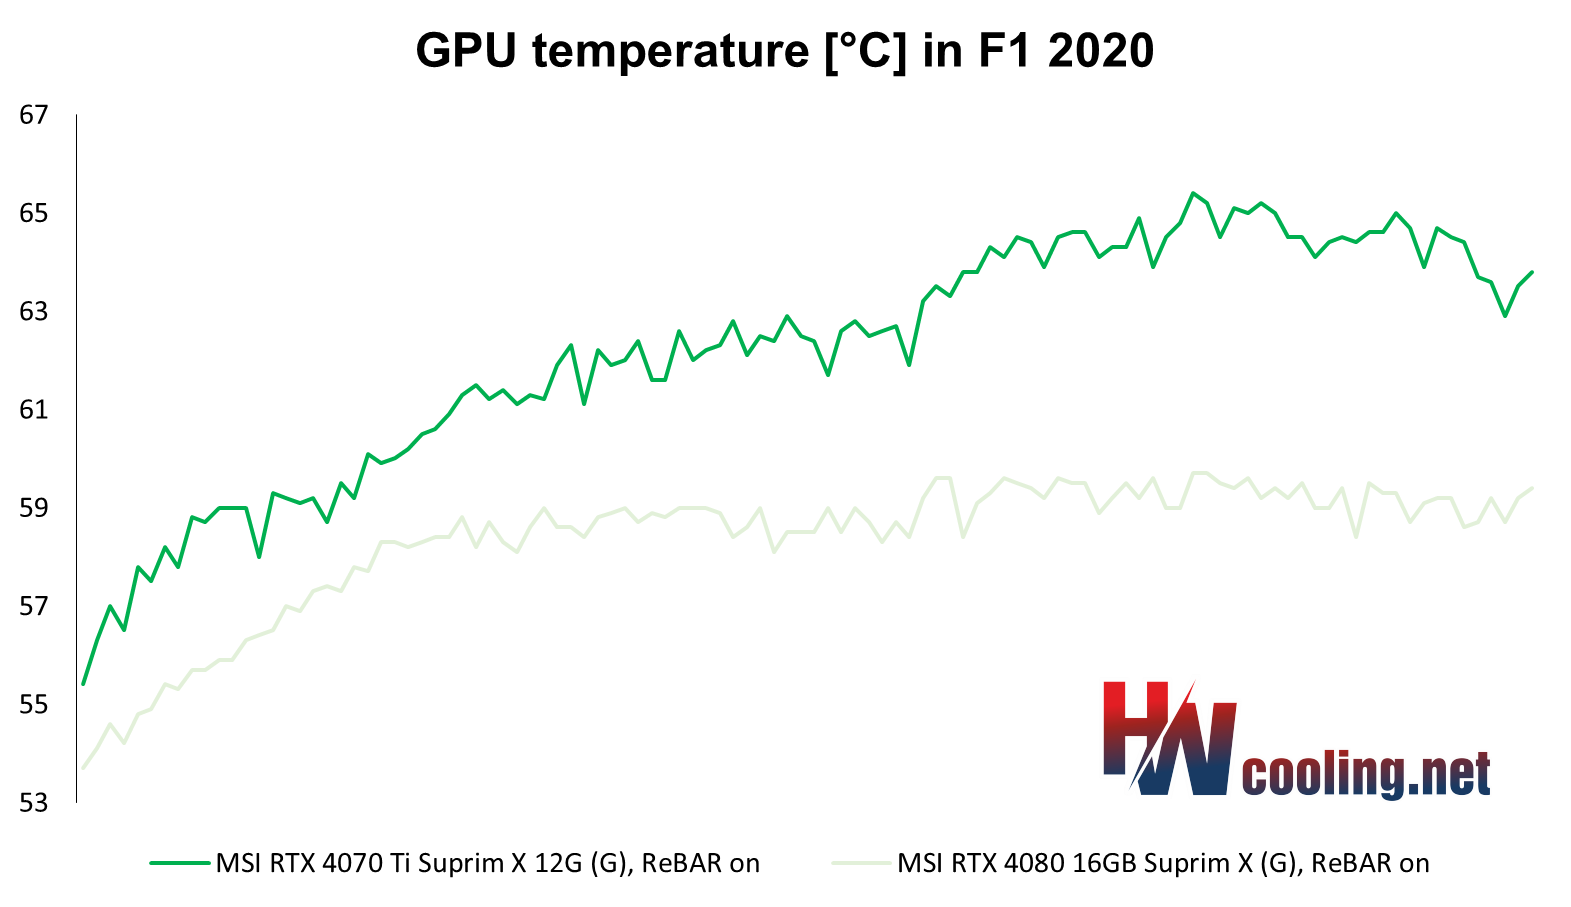
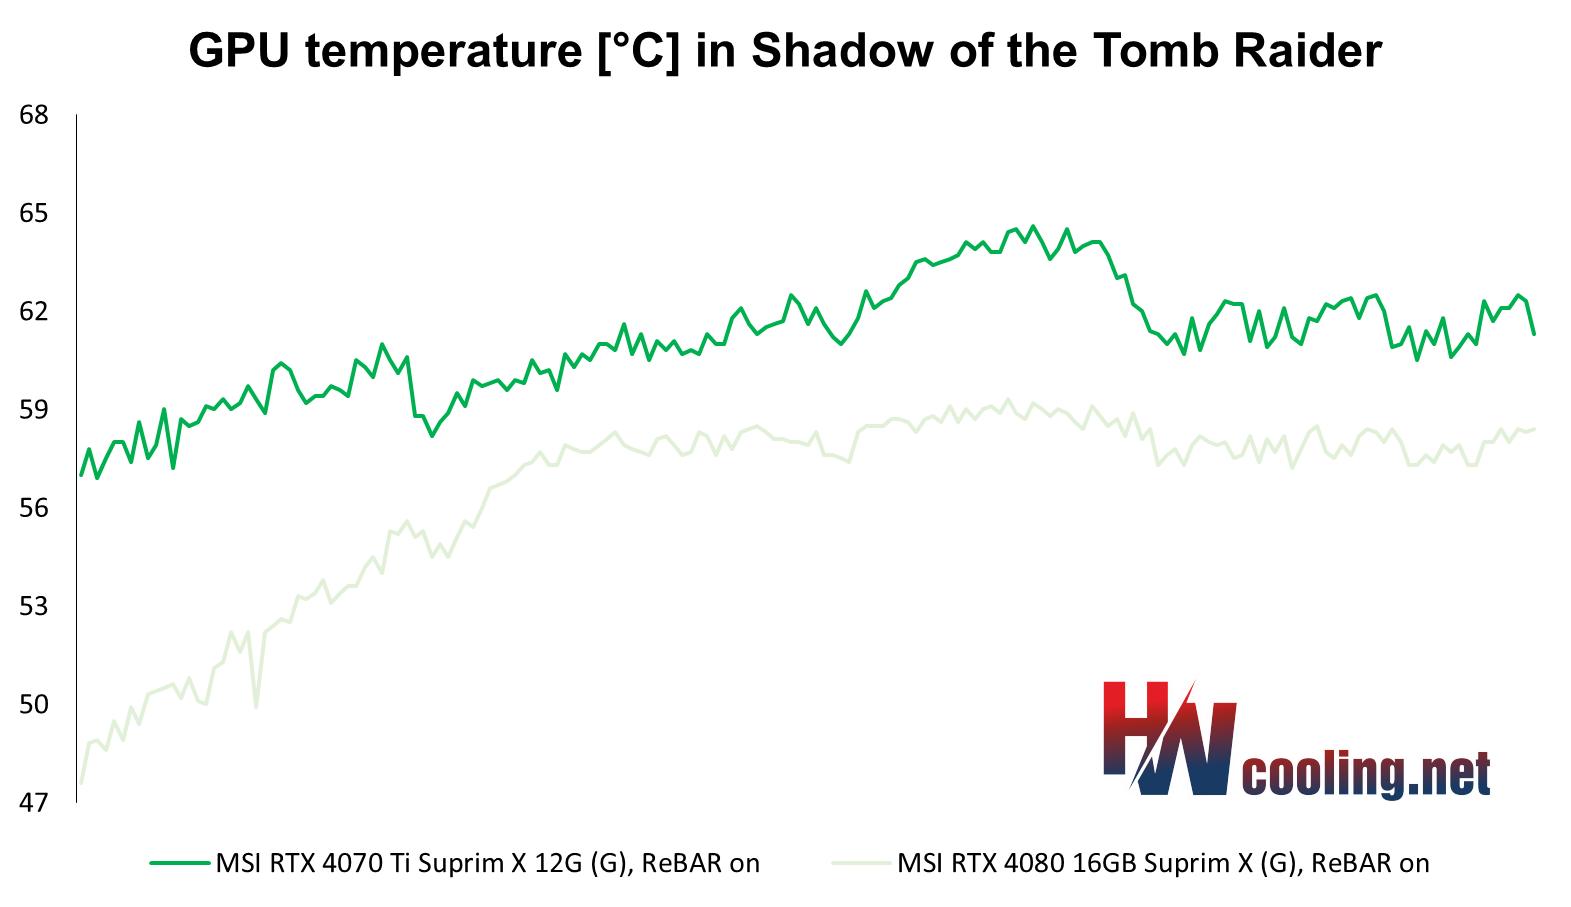
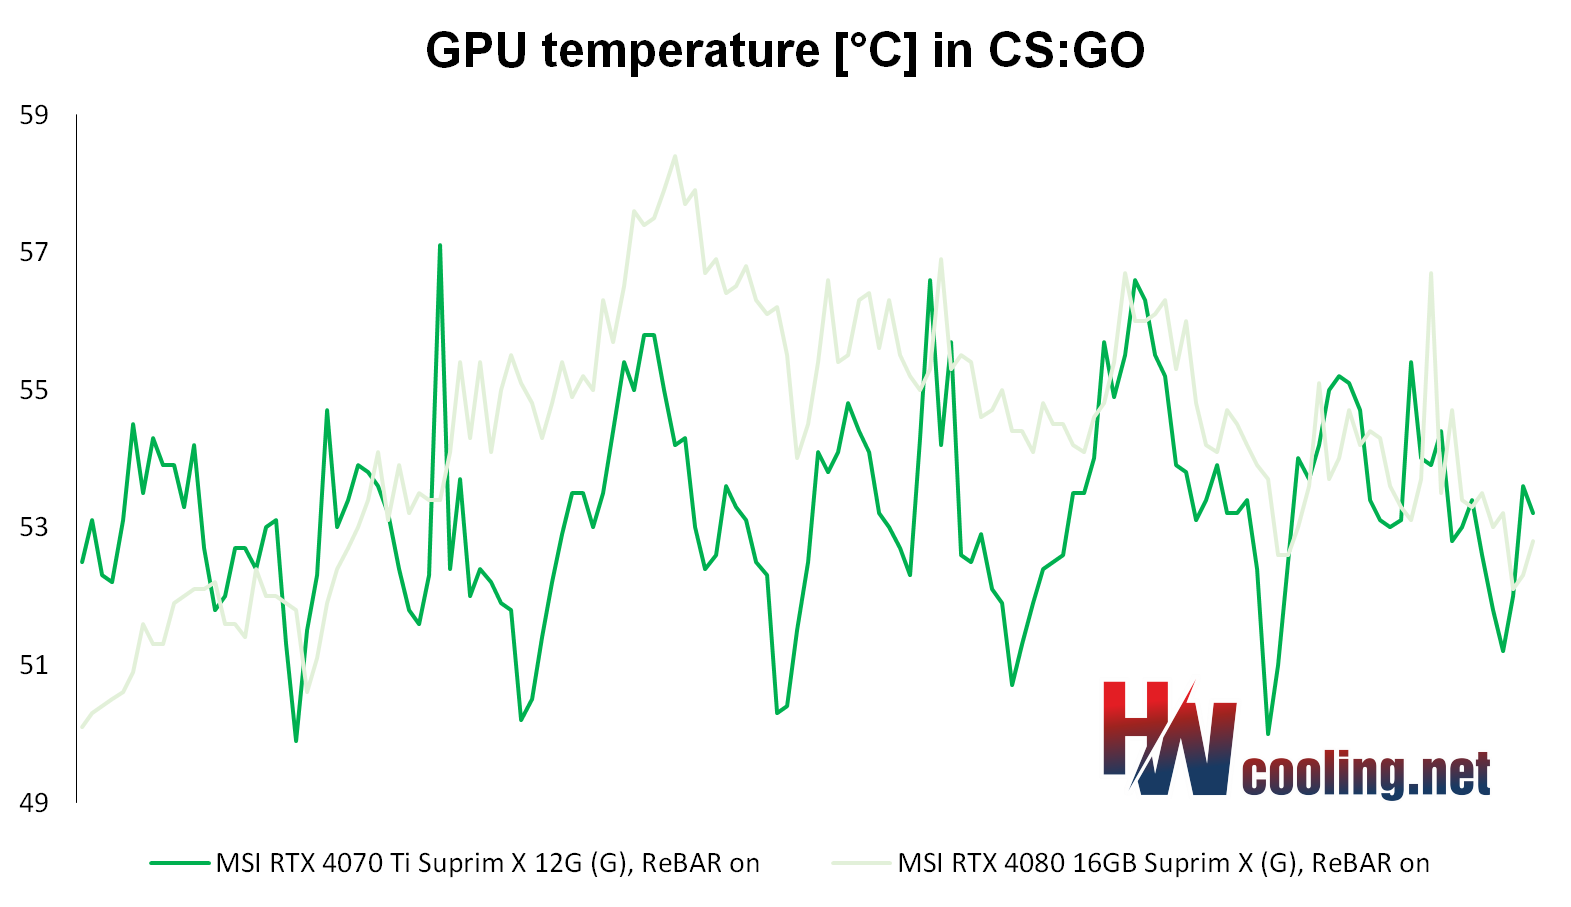
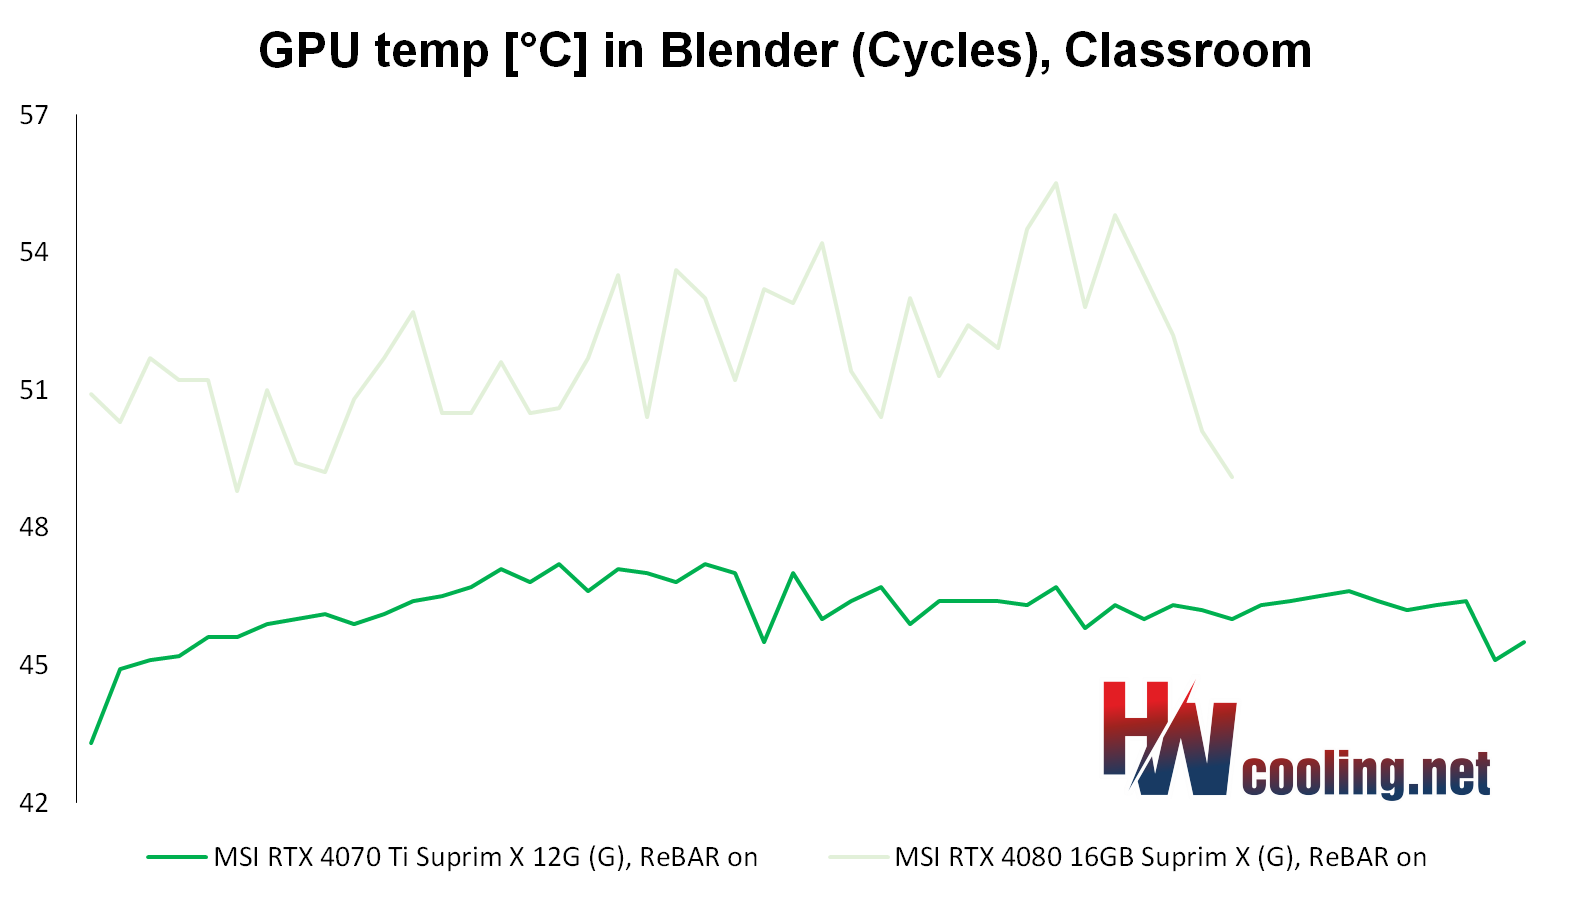
We will analyze the line graphs with the waveforms for each part of the power supply separately. Although the 3.3 V value is usually negligible, it needs to be monitored. It is difficult to say what exactly this subcircuit powers, but usually the consumption on it is constant and when it changes only with regard to whether a static or dynamic image is rendered. We measure consumption in two sort of demanding games (F1 2020 and Shadow of the Tomb Raider) and one less demanding one (CS:GO) with the highest graphic details preset and UHD resolution (3840 × 2560 px). Then in 3D rendering in Blender using the Cycles renderer on the famous Classroom scene. However, in addition to high-load tests, it’s important to know your web browser consumption (which, in our case, is accelerated Google Chrome), where we also spend a lot of time watching videos or browsing the web. The usual average load of this type is represented by the FishIE Tank (HTML5) website with 20 fish and the web video in our power draw tests is represented by a sample with the VP9 codec, data rate of 17.4 mb/s and 60 fps. In contrast, we also test offline video consumption, in VLC player on a 45 HEVC sample (45.7 mb/s, 50 fps). Finally, we also record the power consumption of the graphics card on the desktop of idle Windows 10 with one or two active UHD@60 Hz monitors.
After the GeForce RTX 4080 graphics cards, which wasn’t to many people’s taste due to the higher price, Nvidia has released a significantly cheaper GPU for the GeForce RTX 4070 Ti. The performance versus the RTX 4080 is admittedly noticeably weaker, but percentage-wise not by as much as the roughly two-thirds lower price of the RTX 4070 Ti. In our tests, we analyze MSI’s non-reference design from the top-of-the-line Suprim X series.
Noise measurement…
Noise, as well as other operating characteristics, which we will focus on, we’re measuring in the same modes as consumption, so that the individual values overlap nicely. In addition to the level of noise produced, we also record the frequency response of the sound, the course of the GPU clock speed and its temperature.
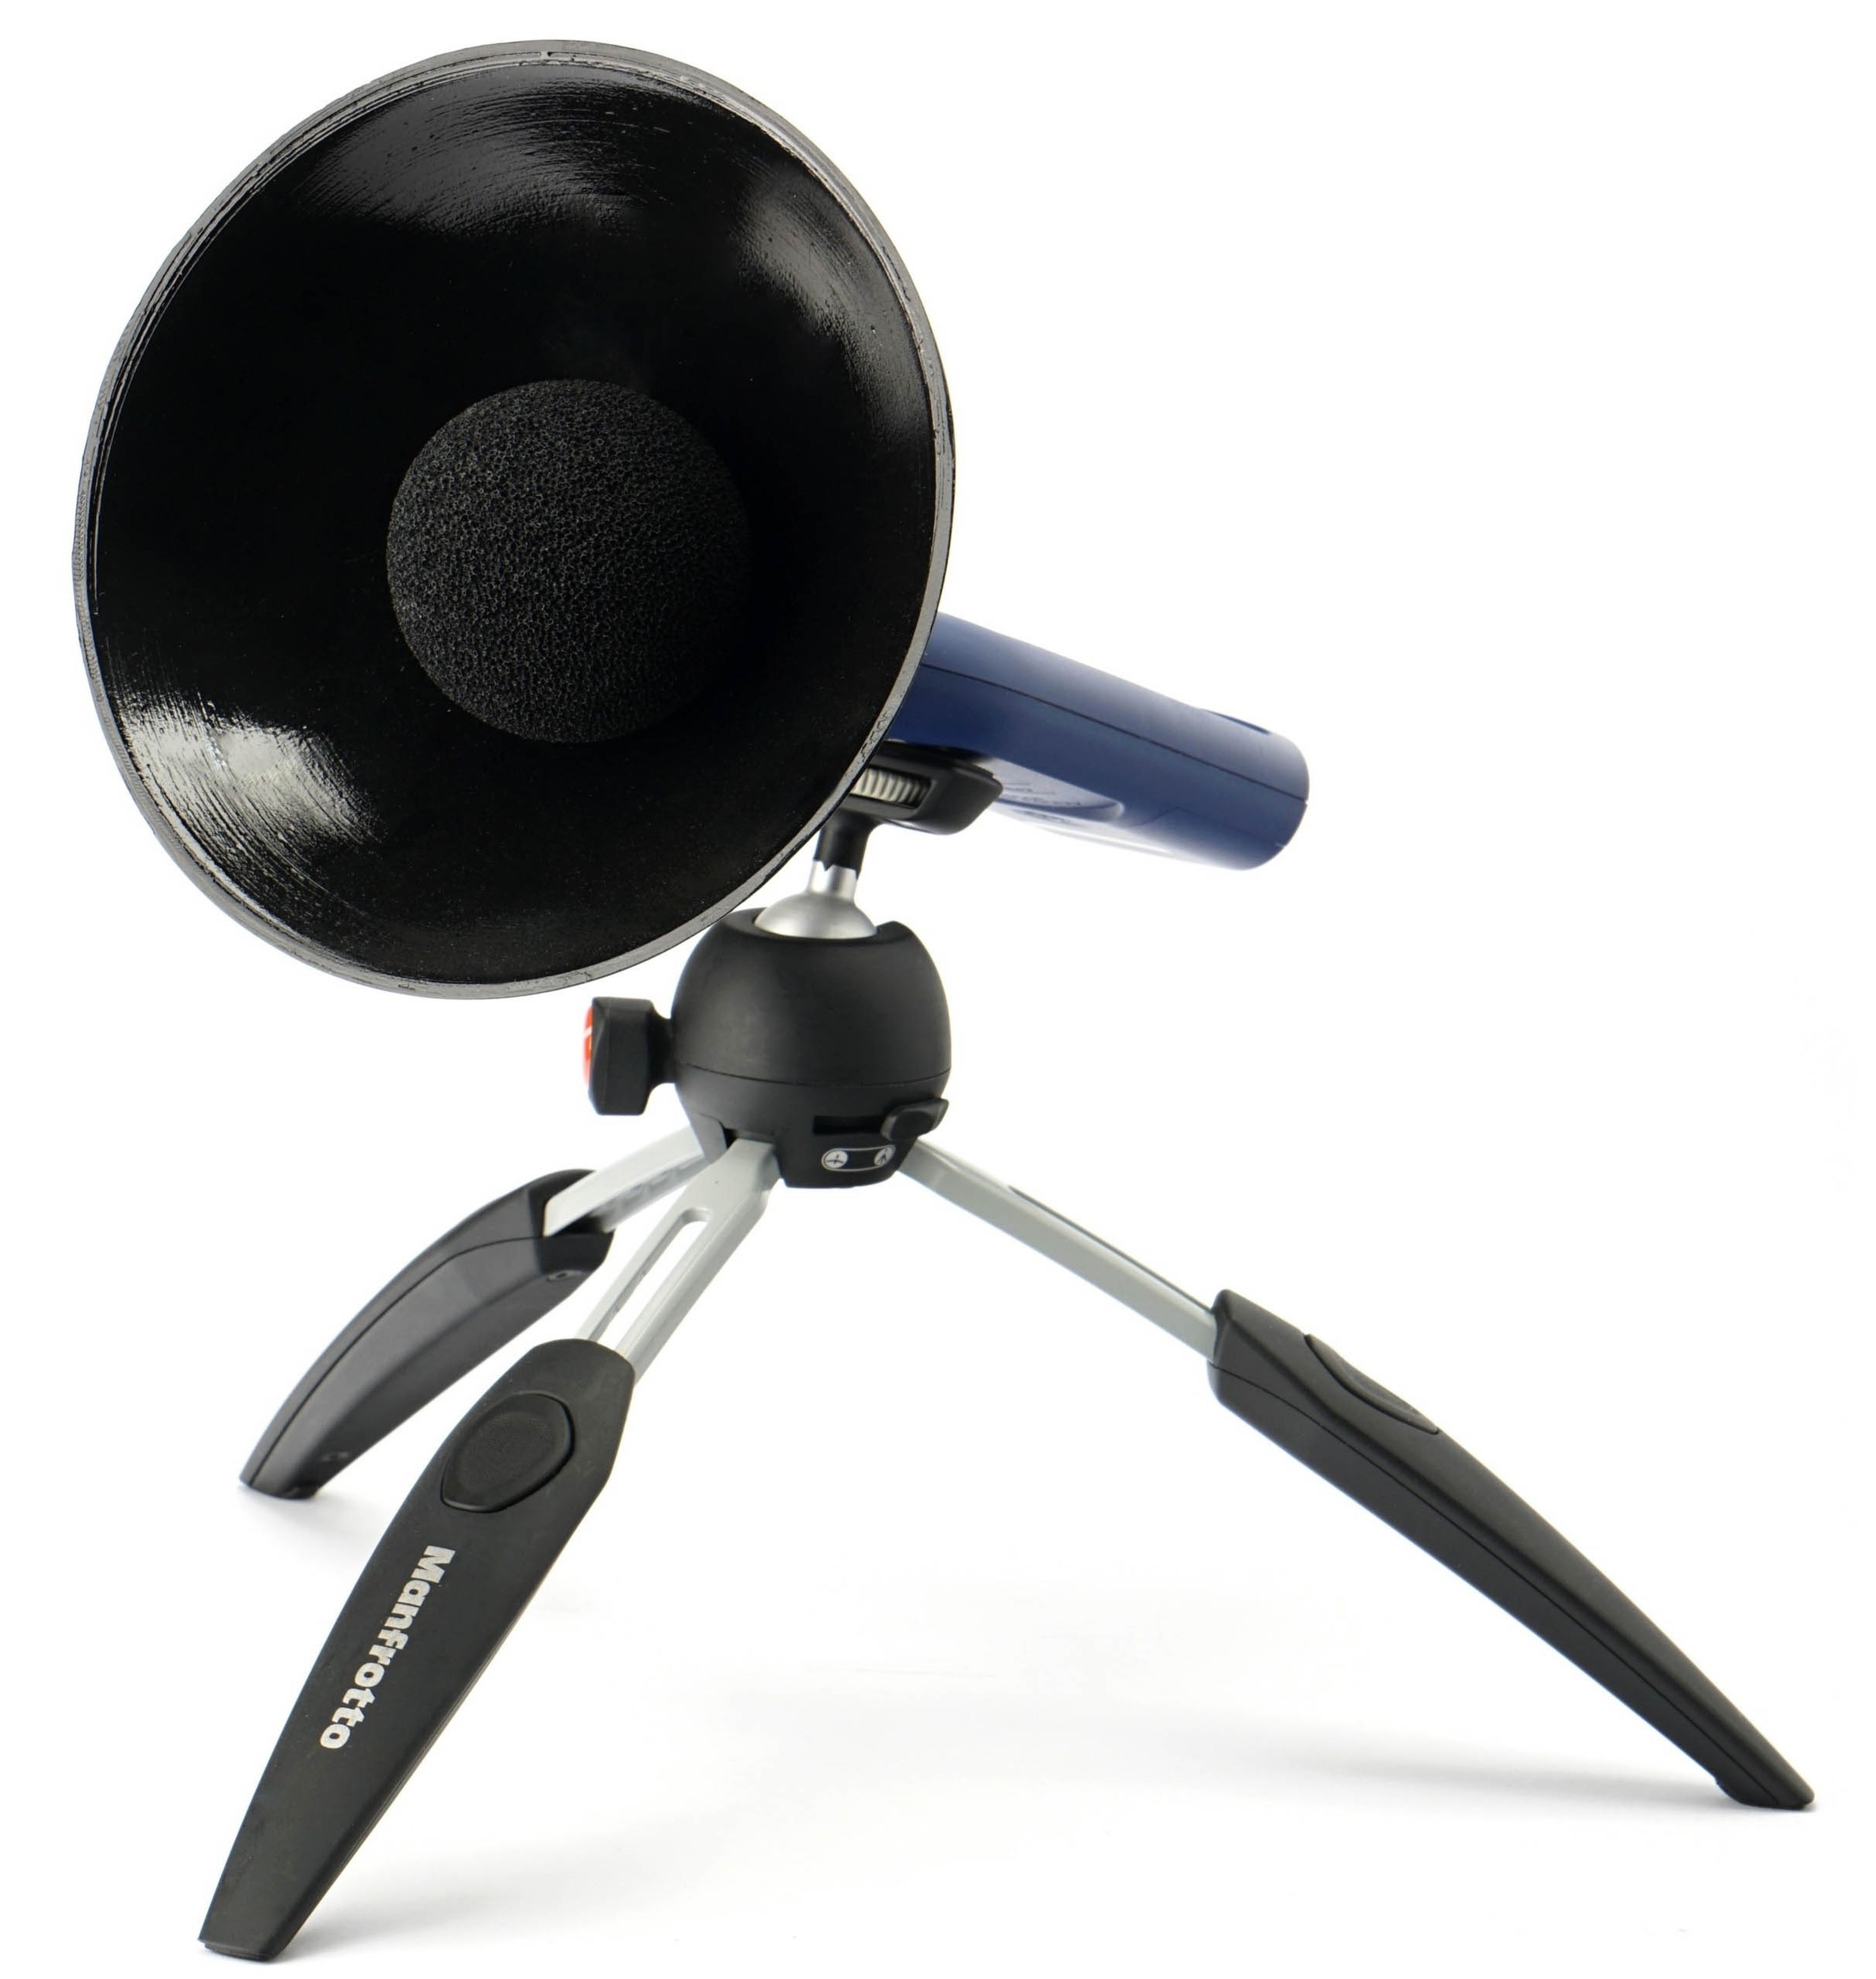
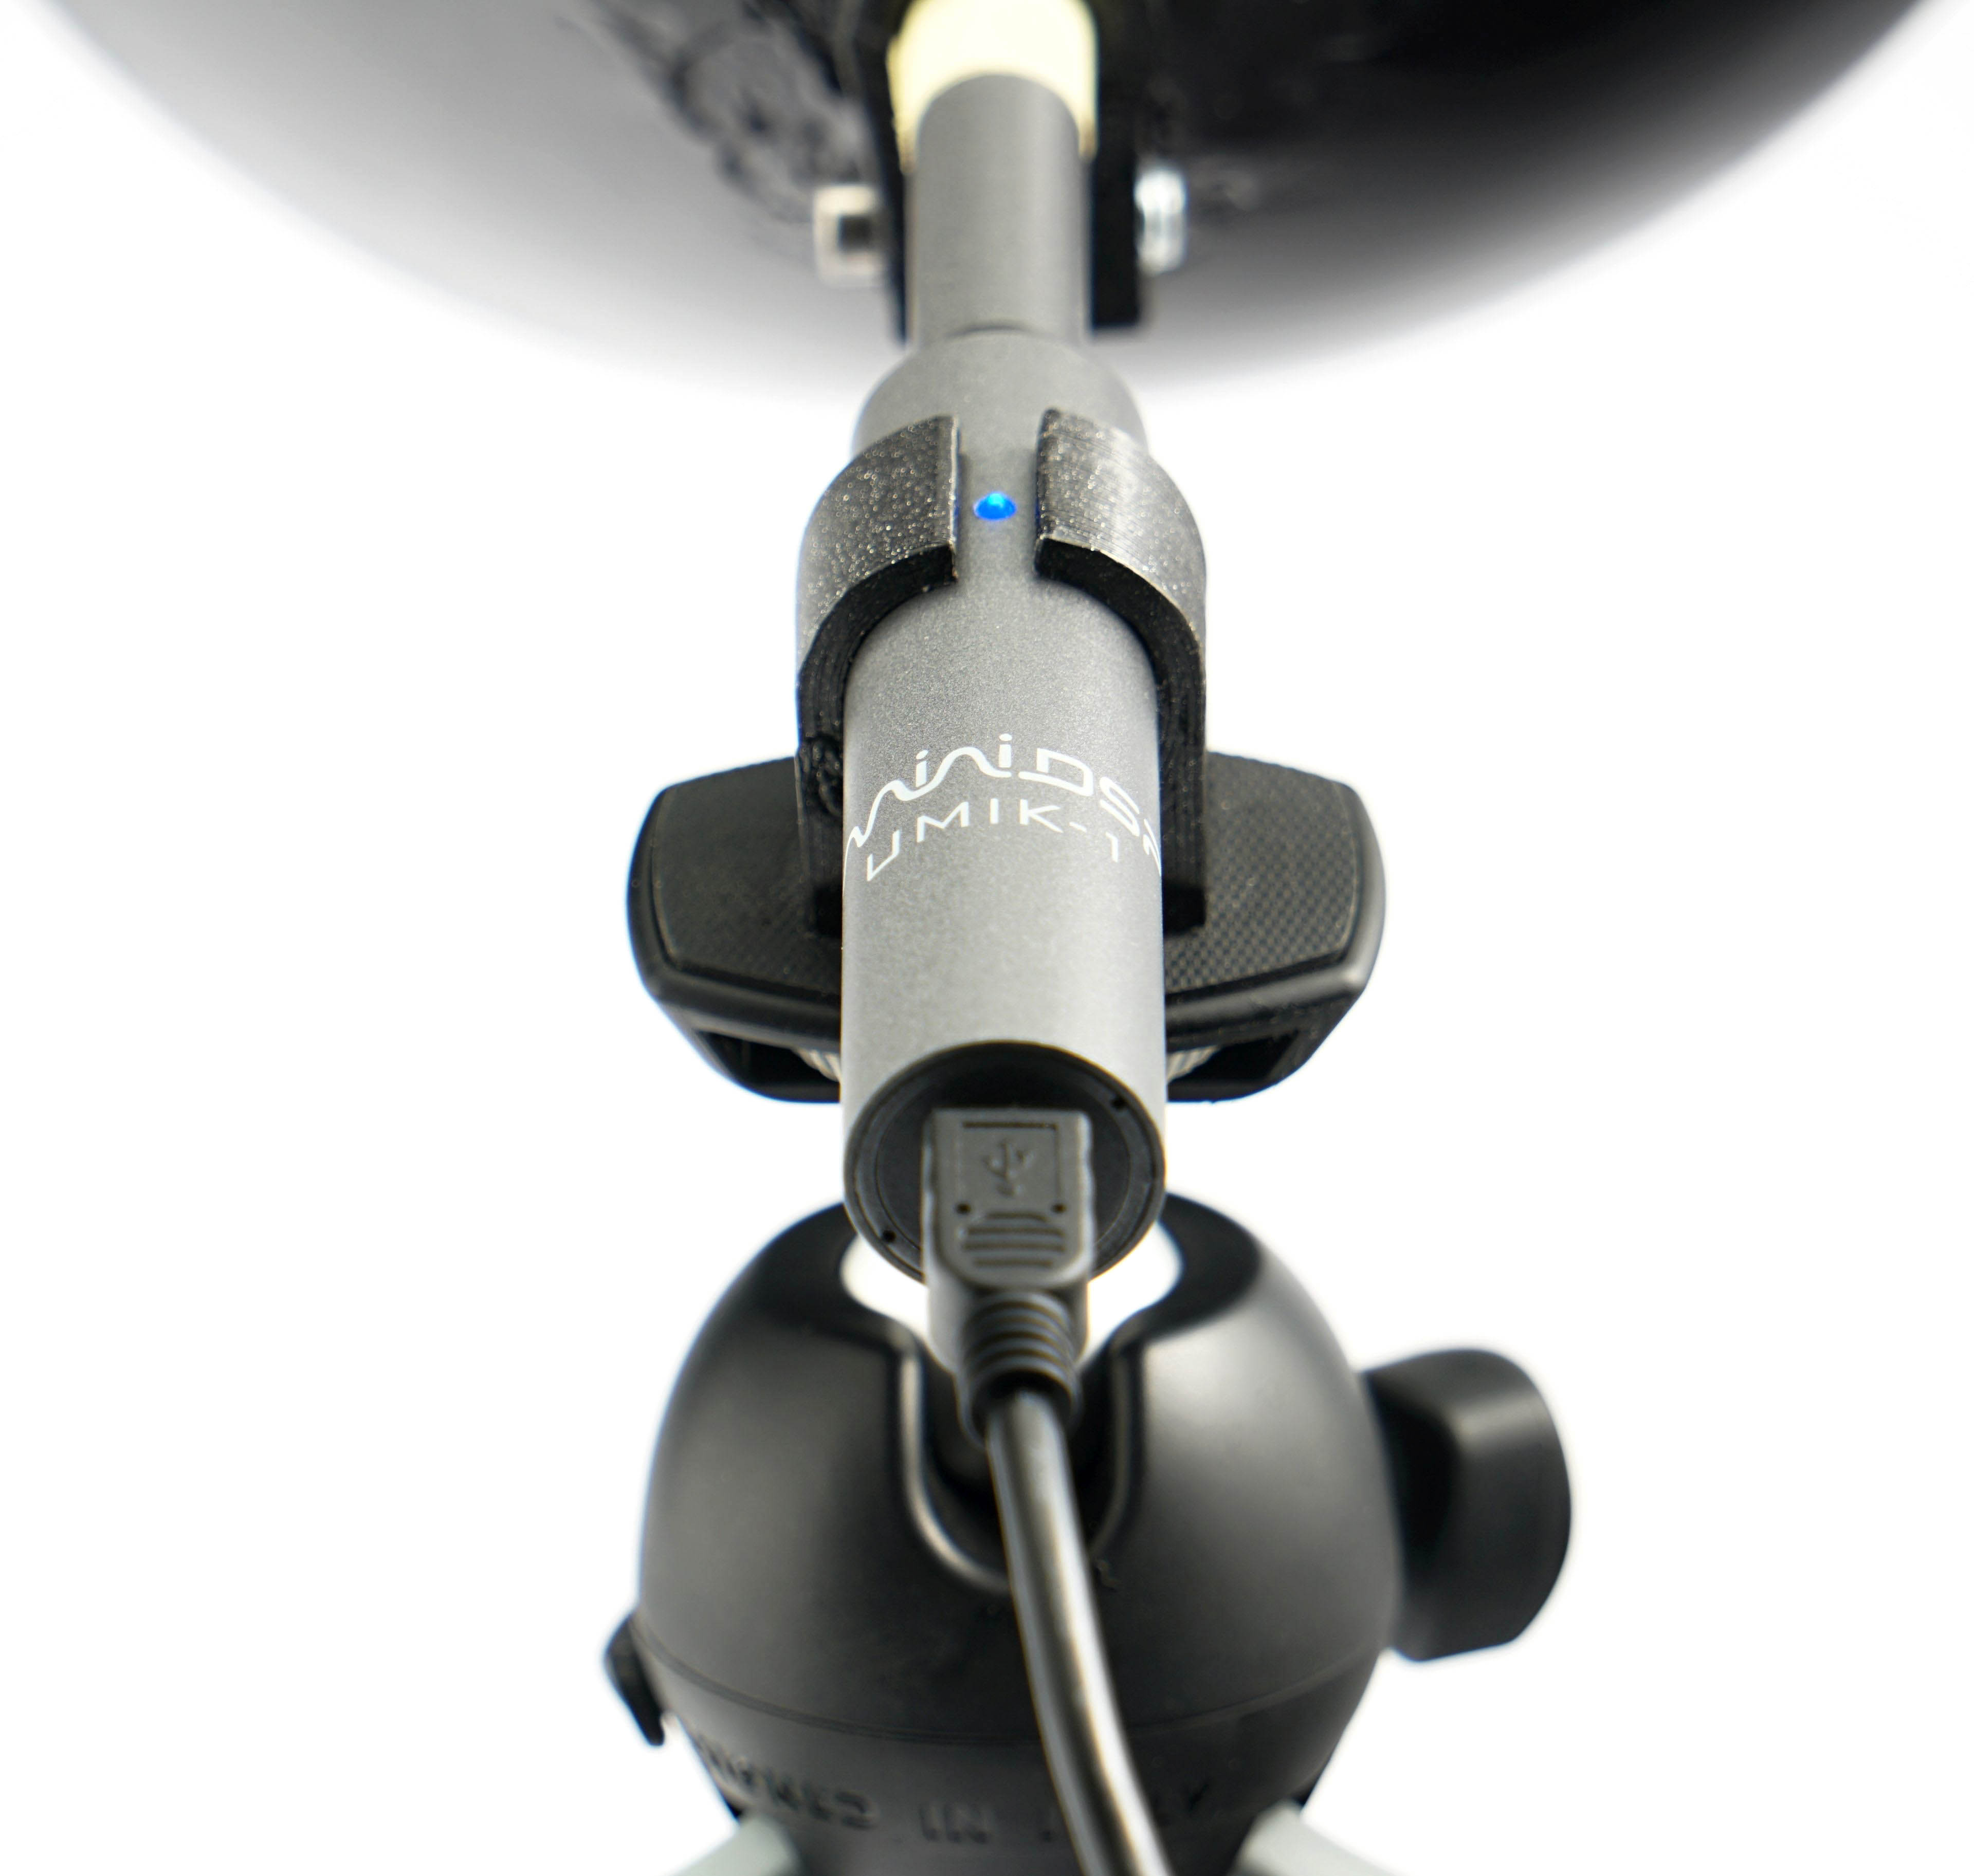
In this part of the methodology description, we will present something about the method of noise measurement. We use a Reed R8080 sound level meter, which we continuously calibrate with a calibrated Voltcraft SLC-100 digital sound level meter. A small addition to the sound level meter is a parabola-shaped collar, which has two functions. Increases the sensitivity to distinguish the sound produced even at very low speeds. It is thus possible to better compare even very quiet cards with the largest possible ratio difference. Otherwise (without this adjustment) it could simply happen that we measured the same noise level across several graphics cards, even though it would actually be a little different. This parabolic shield also makes sense because, from the outer convex side (from the back), it reflects all the parasitic sounds that everyone who really aims for accuracy of the measurements struggles with during the test. These are various cracks of the body or objects in the room during normal human activity.
To ensure the same conditions when measuring the noise level (and later also the sound), we use acoustic panels with a foam surface around the bench-wall. This is so that the sound is always reflected to the sound level meter sensor in the same way, regardless of the current situation of the objects in the test room. These panels are from three sides (top, right and left) and their purpose is to soundproof the space in which we measure the noise of graphics cards. Soundproofing means preventing different reflections of sound and oscillations of waves between flat walls. Don’t confuse it with sound-absorbing, we’ve had that solved well in the test lab for a long time.
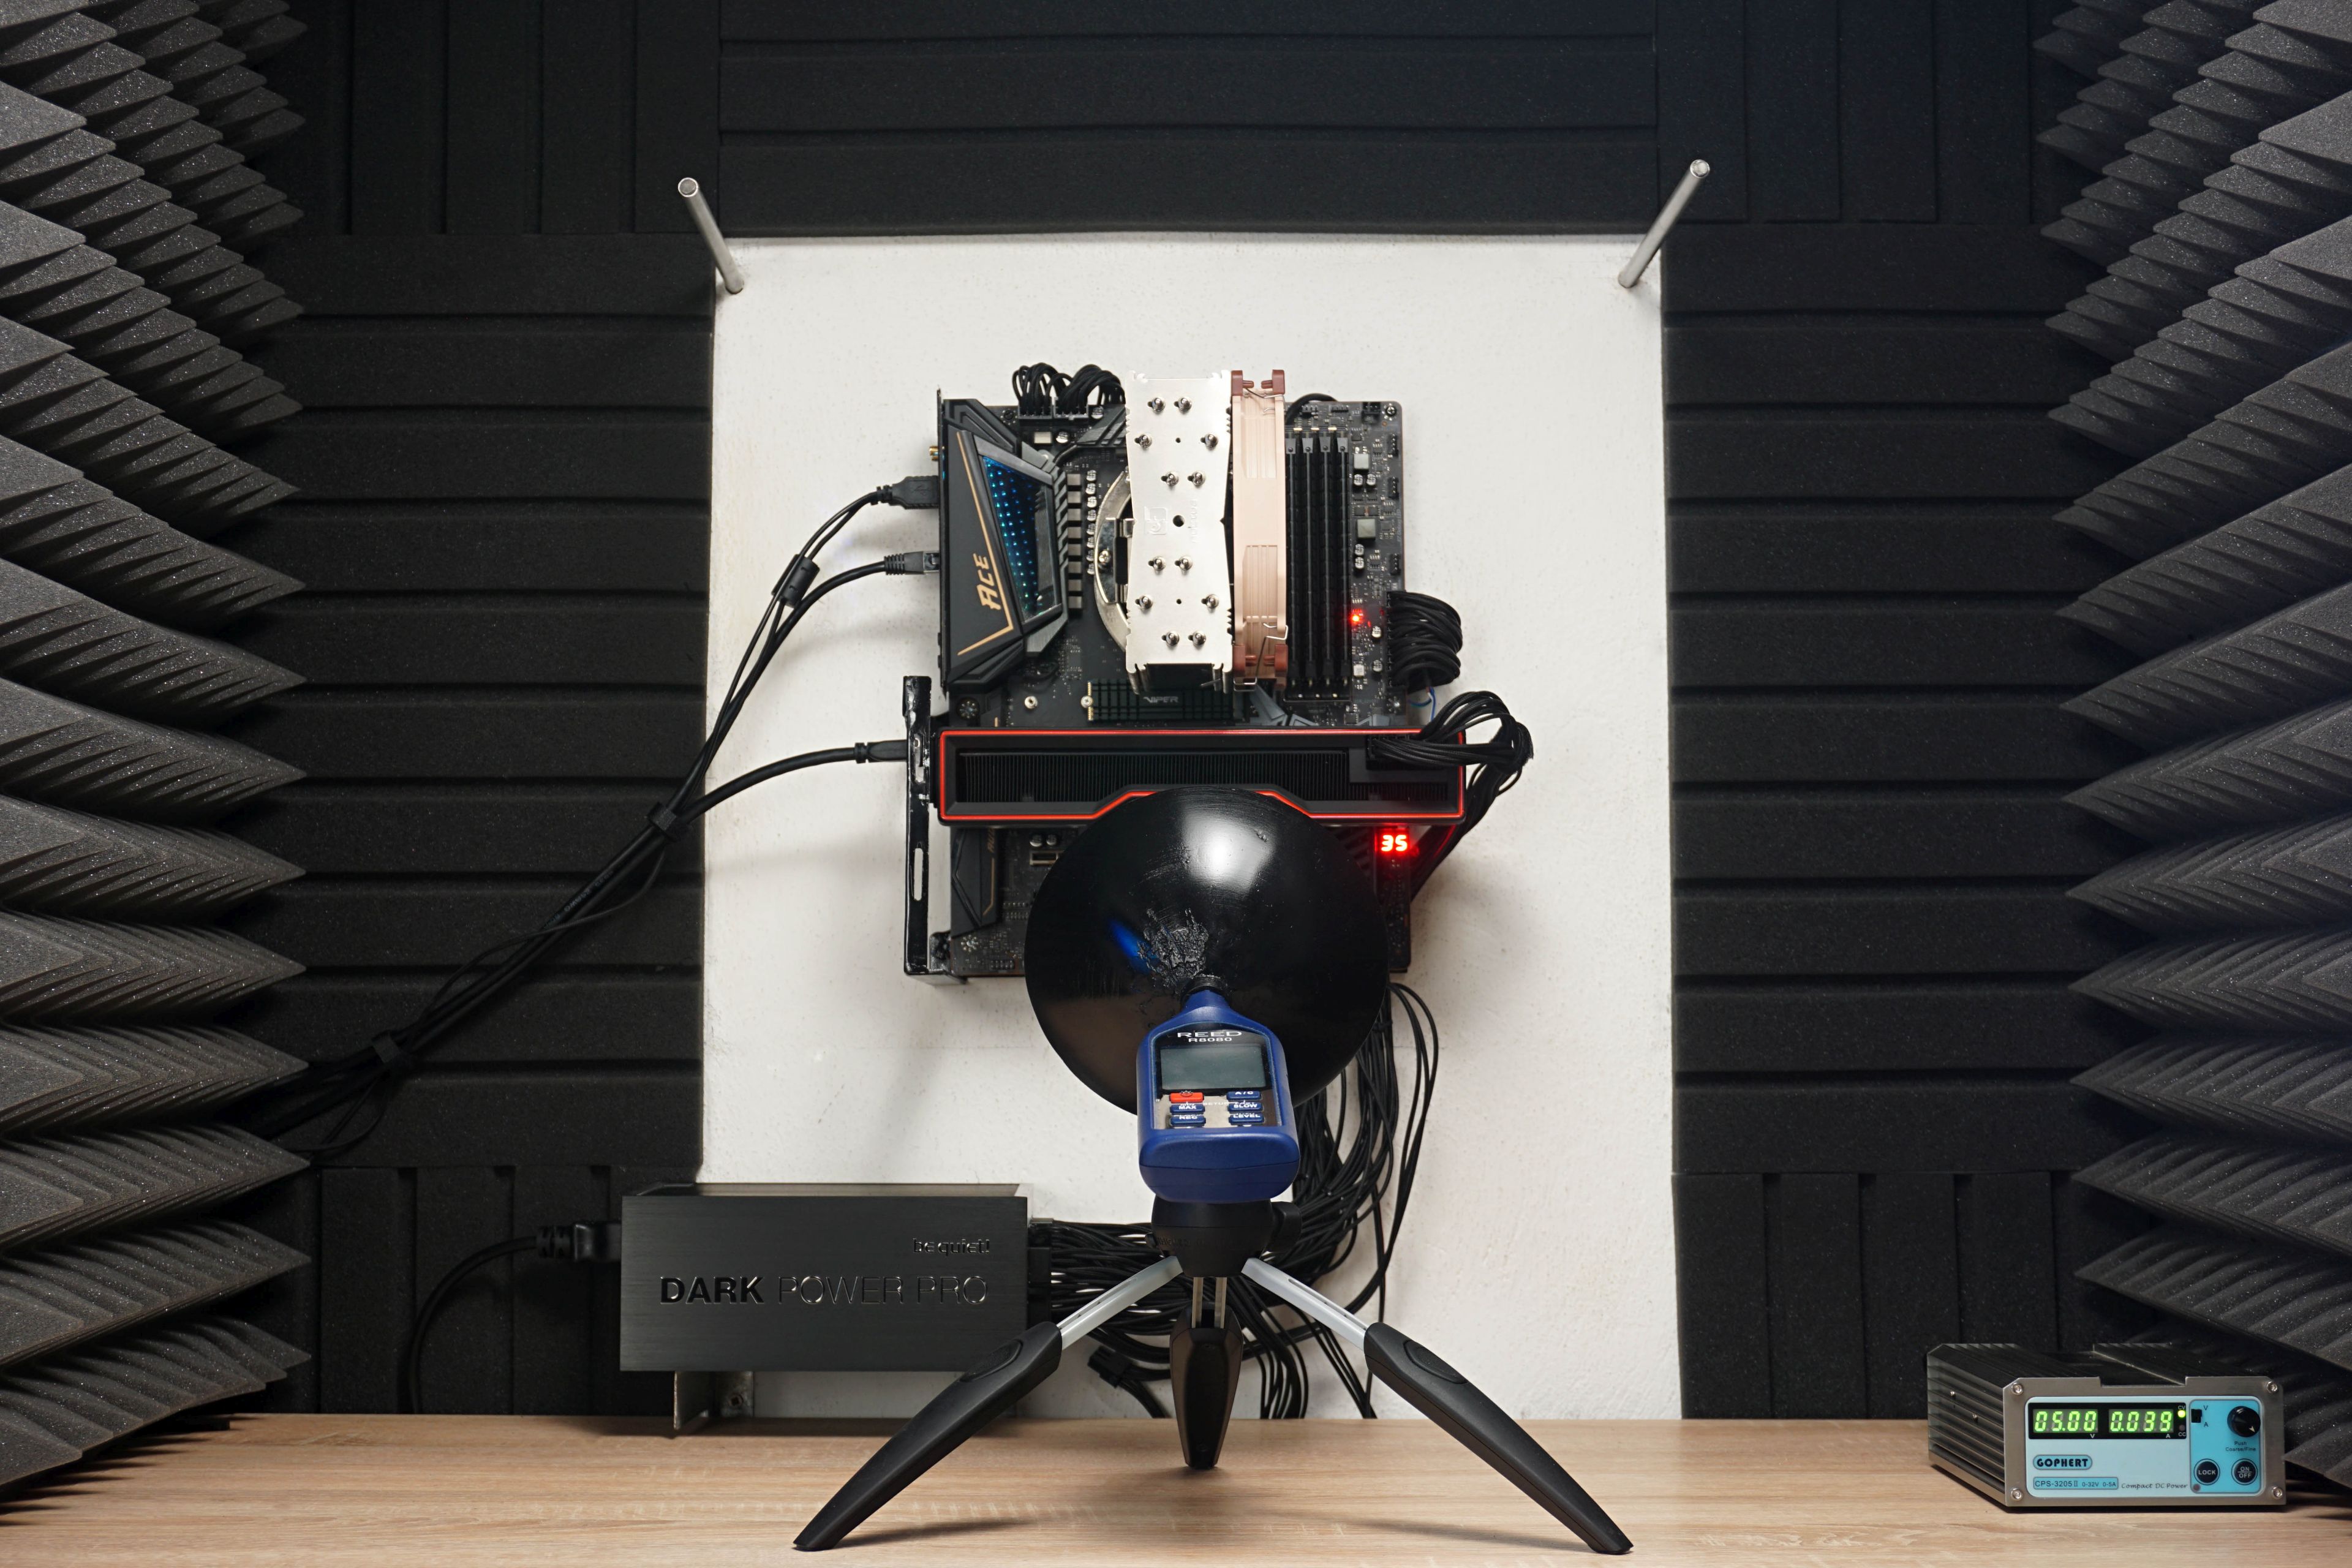
During the measurements, the sound level meter sensor is always placed on a tripod at the same angle and at the same distance (35 cm) from the PCI Express slot in which the graphics card is installed. Of course, it’s always closer to the card itself, depending on its depth. The indicated reference point and the sensor angles are fixed. In addition to the “aerodynamic noise” of the coolers, we also measure the noise level of whining coils. Then we stop the fans for a moment. And for the sake of completeness, it should be added that during sound measurements, we also switch off the power supply fan as well as the CPU cooler fan. Thus, purely the graphics card is always measured without any distortion by other components.
… and the sound frequency response
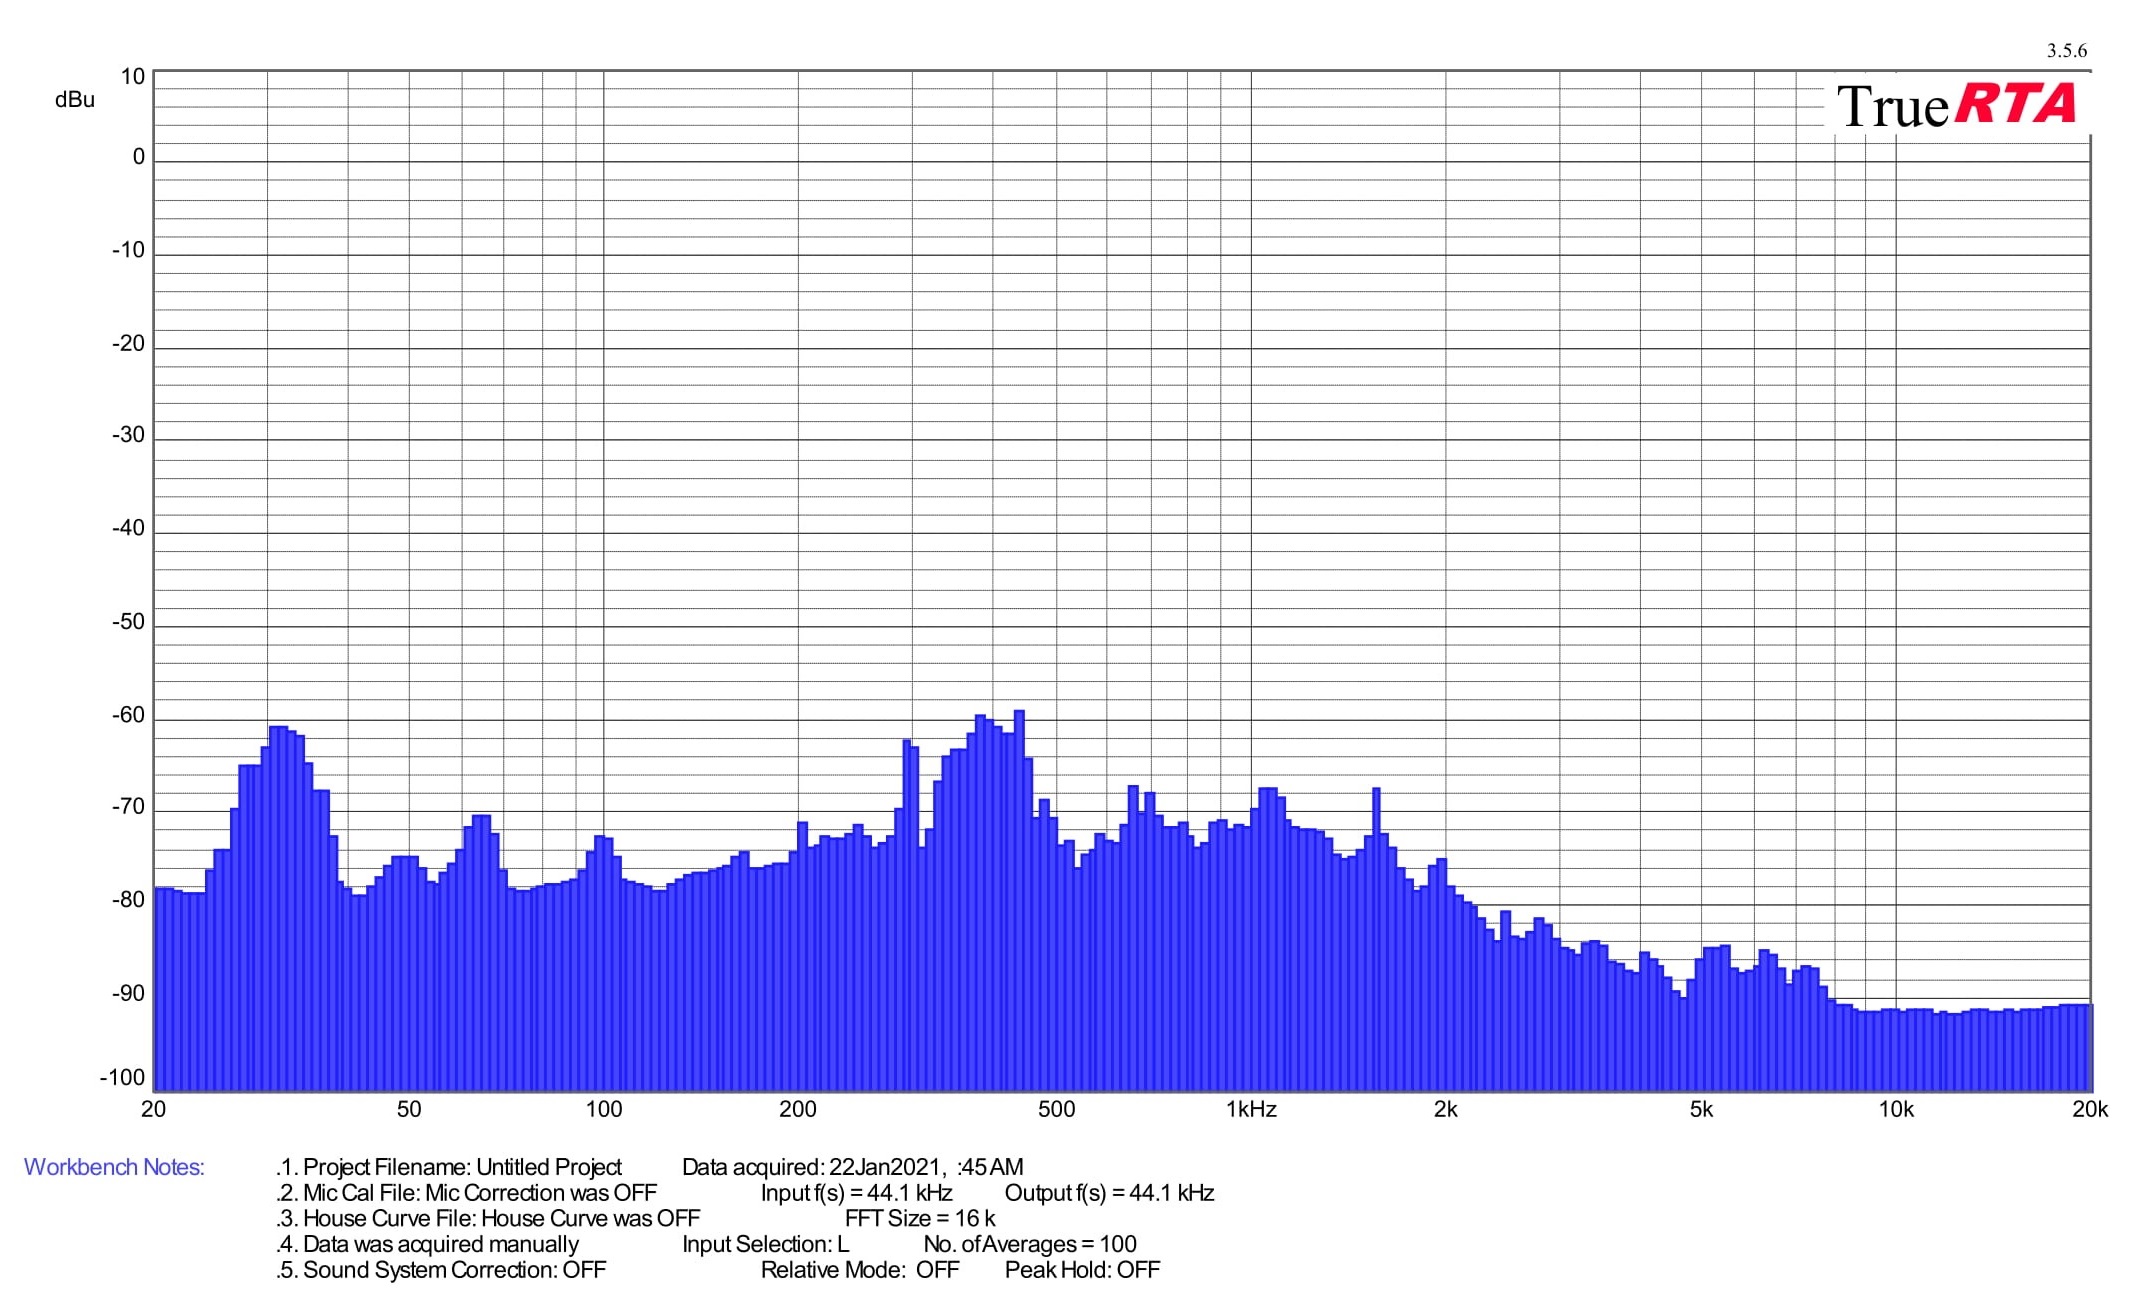
From the same place, we also measure the frequency of the sound produced. One thing is the noise level (or sound pressure level in decibels) and the other thing is its frequency response.
According to the data on the noise level, you can quickly find out whether the graphics card is quieter or noisier, or where it is on the scale, but it is still a mix of different frequencies. Thus, it does not say whether the sound produced is more booming (with a lower frequency) or squeaking (with a high frequency). The same 35 dBA can be pleasant but also unpleasant for you under certain circumstances – it depends on each individual how they perceive different frequencies. For this reason, we will also measure the frequency response of the sound graphics card in addition to the noise level, via the TrueRTA application. The results will be interpreted in the form of a spectrograph with a resolution of 1/24 octave and for better comparison with other graphics cards we will include the dominant frequency of lower (20–200 Hz), medium (201–2,000 Hz) and higher (2,001–20,000 Hz) sound spectrum into standard bar graphs. For measurements, we’re using a calibrated miniDSP UMIK-1 microphone, which accurately copies the position of the sound level meter, but also has a collar, even with the same focal length.
At the end of this chapter, it should be noted that measurements of noise and frequency response of sound will be performed on most cards only in load tests, as out of load and at lower load (including video decoding) operation is usually passive with fans turned off. On the other hand, we must also be prepared for exceptions with active operation in idle or graphics cards with dual BIOS setup, from which the more powerful one never turns off the fans and they run at least at minimum speed. Finally, as with measuring the noise level in one of the tests, we also record the frequency response of whining coils. But don’t expect any dramatic differences here. It will usually be one frequency, and the goal is rather to detect any potential anomalies. The sound of the whining coils is of course variable, depending on the scene, but we always measure in the same scene (in CS:GO@1080p).
After the GeForce RTX 4080 graphics cards, which wasn’t to many people’s taste due to the higher price, Nvidia has released a significantly cheaper GPU for the GeForce RTX 4070 Ti. The performance versus the RTX 4080 is admittedly noticeably weaker, but percentage-wise not by as much as the roughly two-thirds lower price of the RTX 4070 Ti. In our tests, we analyze MSI’s non-reference design from the top-of-the-line Suprim X series.
Methodology: temperature tests
We’re also bringing you temperature tests. You are at HWCooling after all. However, in order to make it sensible at all to monitor temperatures on critical components not only of the graphics card, but anything in the computer, it is important to simulate a real computer case environment with healthy air circulation. The overall behavior of the graphics card as such then follows from this. In many cases, an open bench-table is inappropriate and results can be distorted. Therefore, during all, not only heat tests, but also measurement of consumption or course of graphics core frequencies, we use a wind tunnel with equilibrium flow.
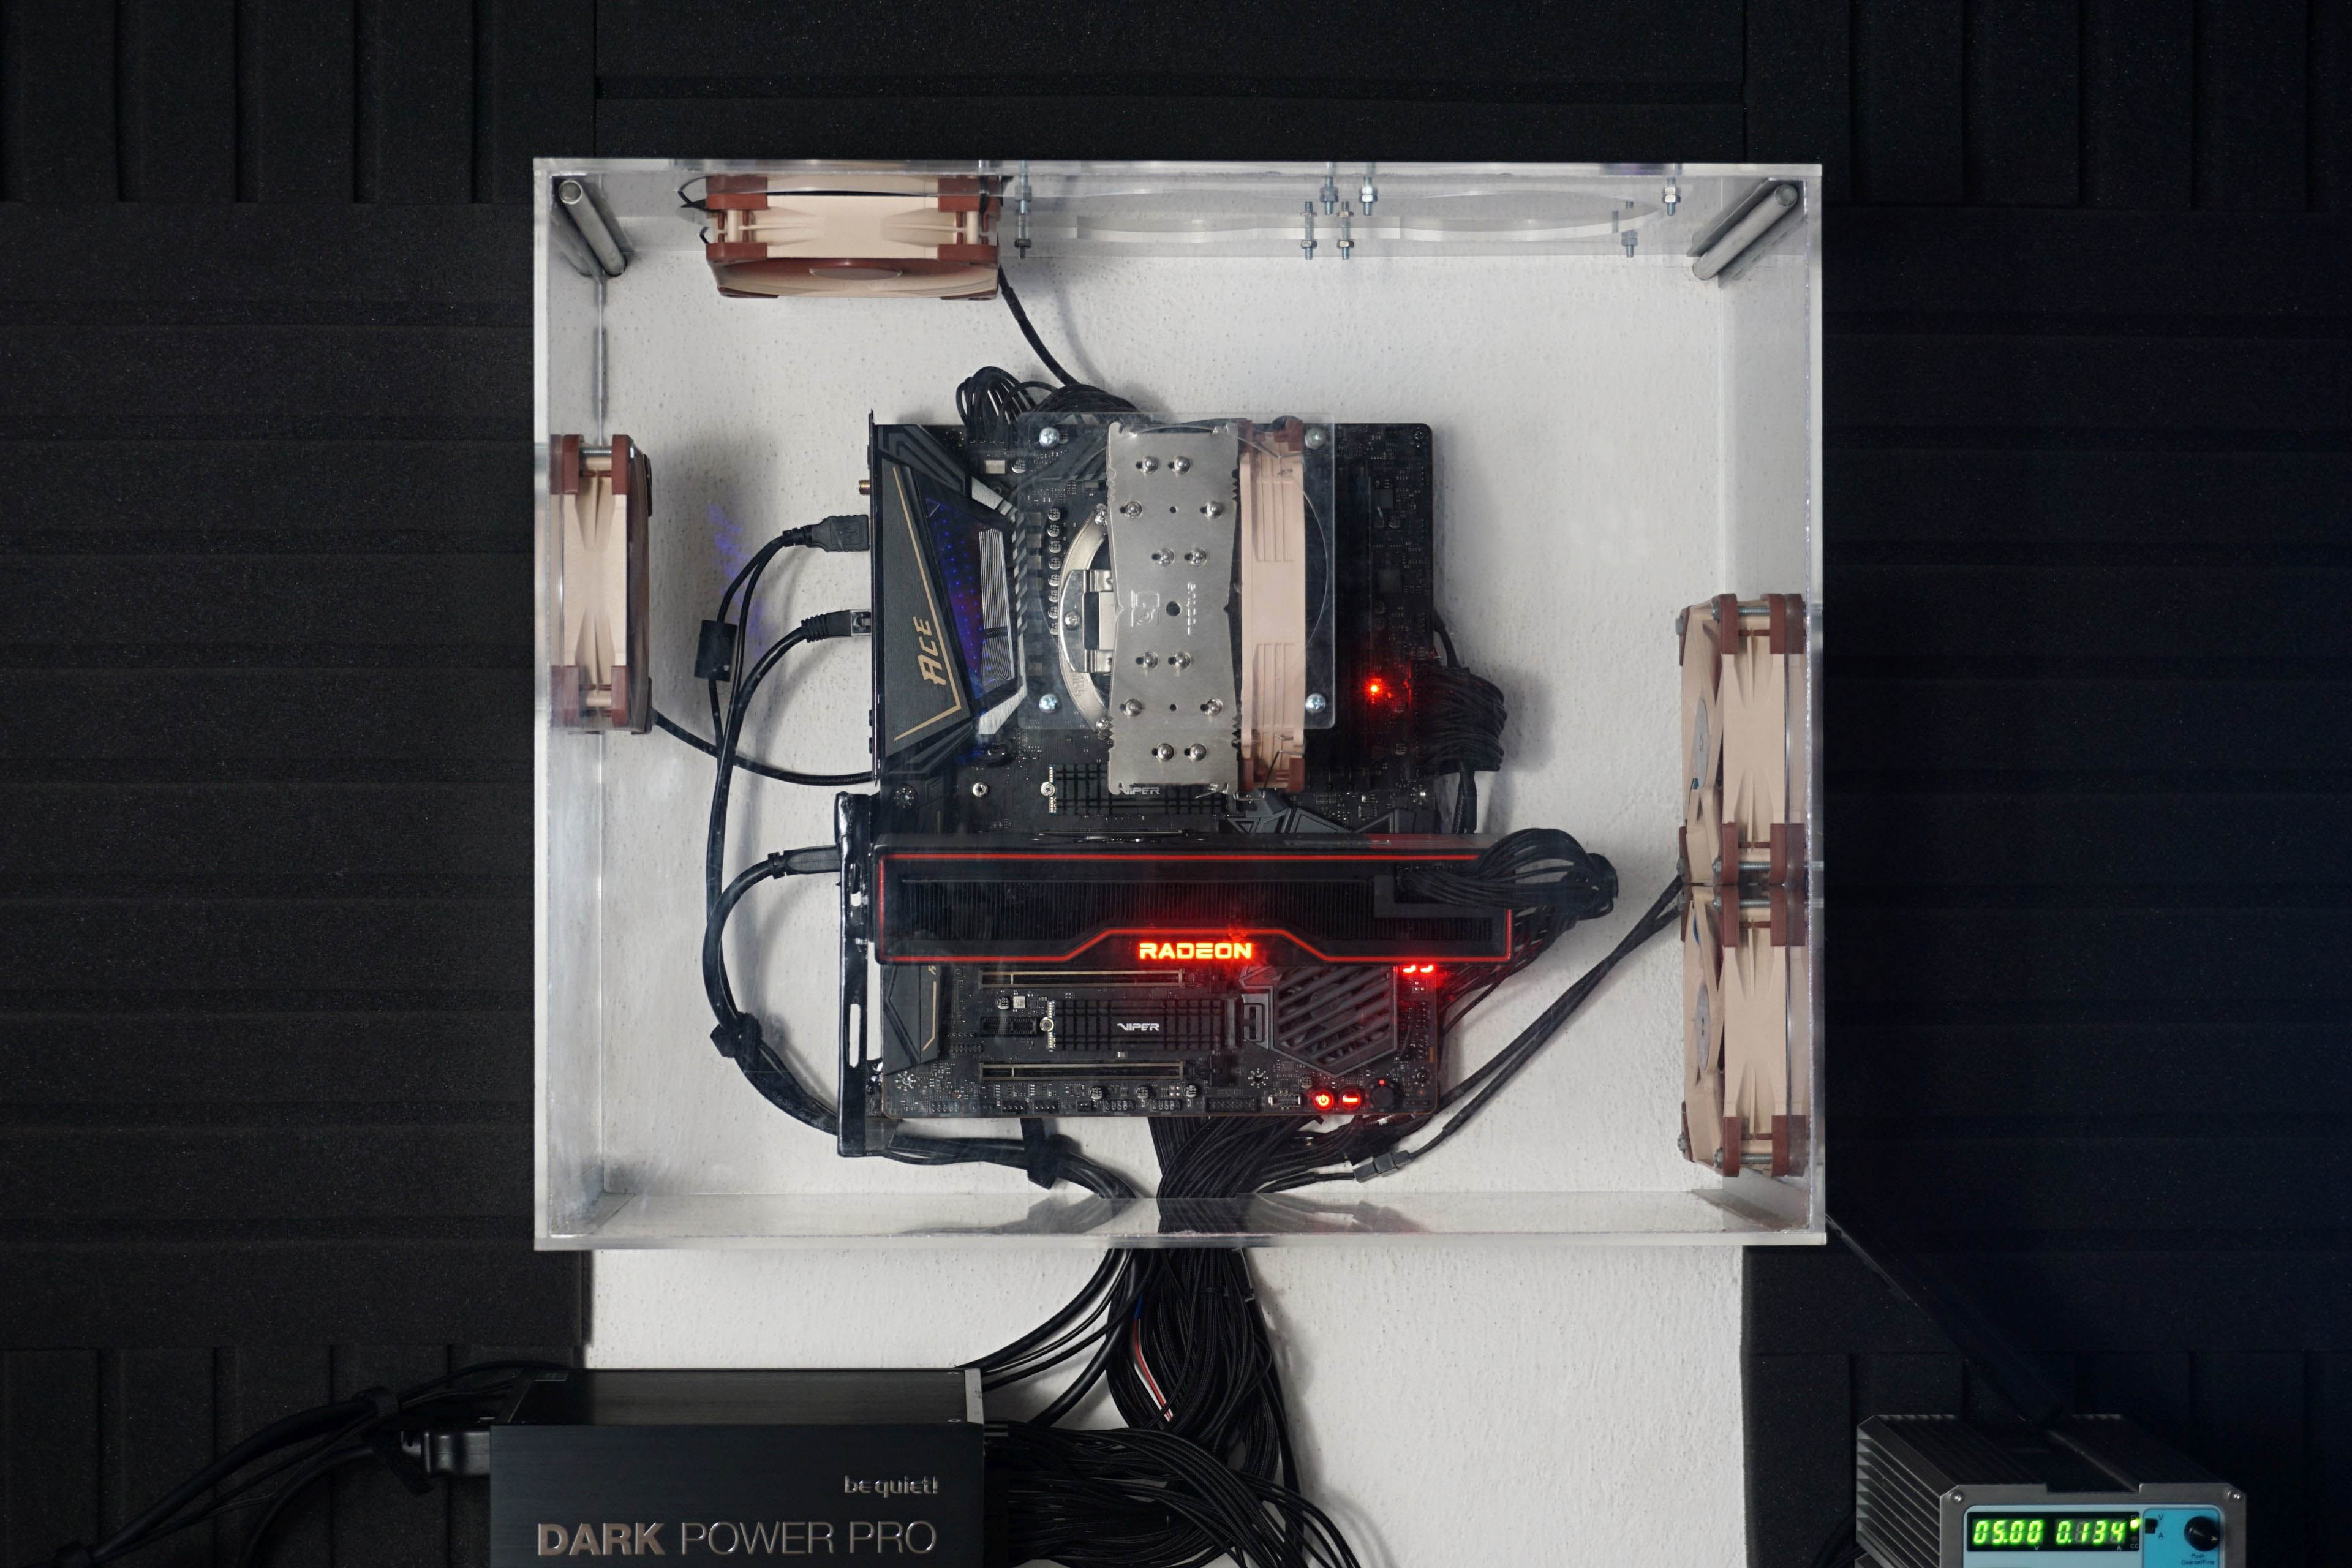
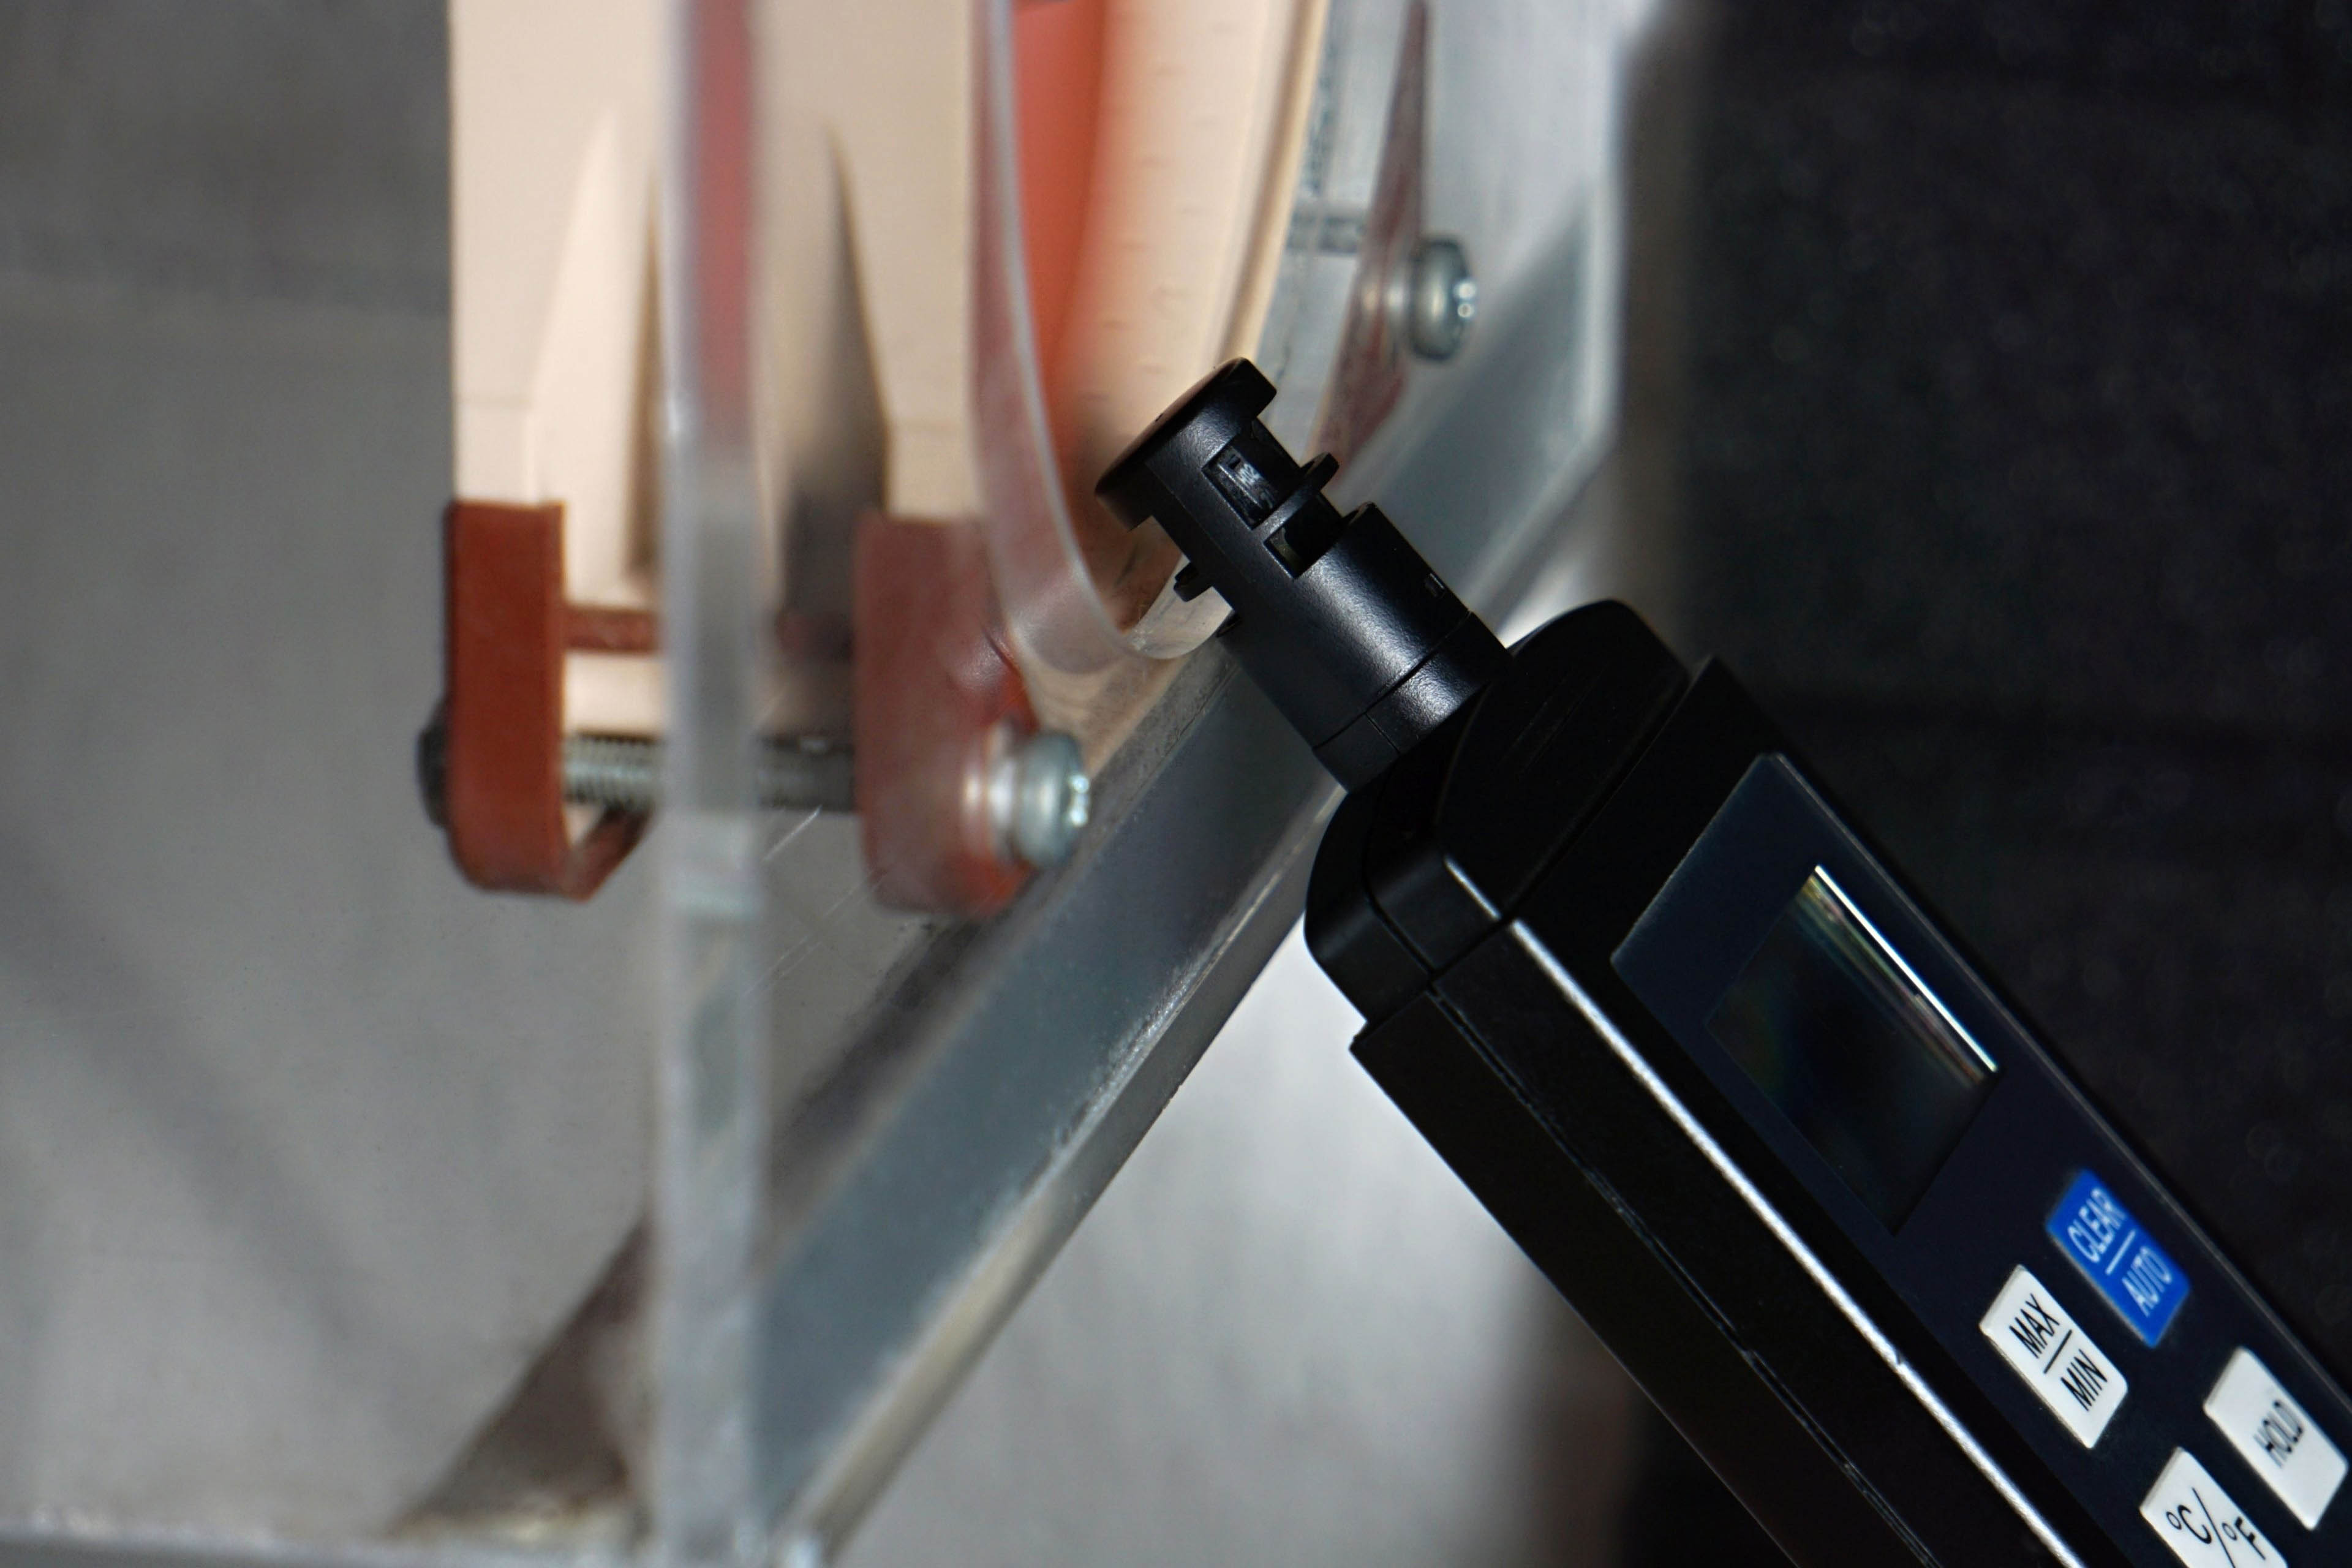
Two Noctua NF-S12A fans are at the inlet and the same number is on the exhaust. When testing various system cooling configurations, this proved to be the most effective solution. The fans are always set to 5 V and the speed corresponds to approx. 550 rpm. The stability of the inlet air is properly controlled during the tests, the temperature being between 21 and 21.3 °C at a humidity of ±40 %.
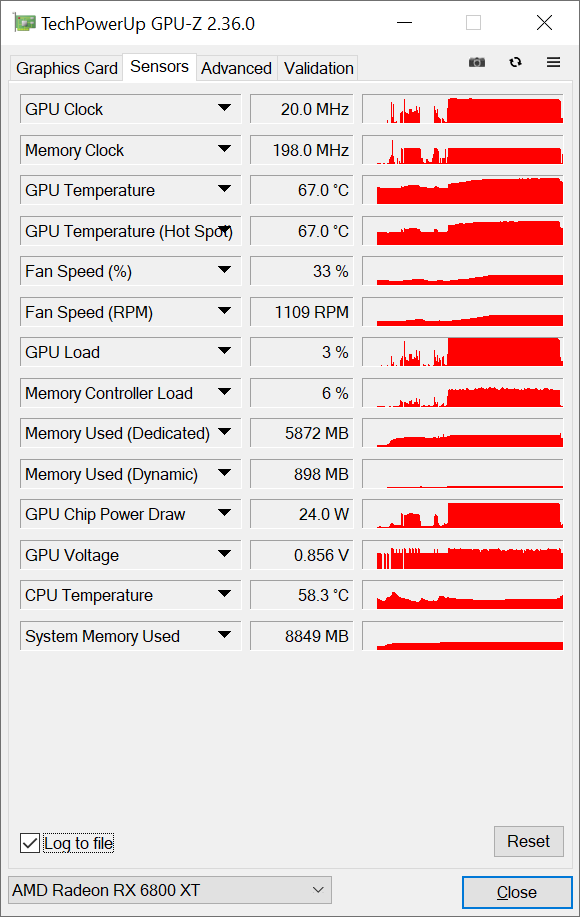
We read the temperature from the internal sensors via GPU-Z. This small, single-purpose application also allows you to record samples from sensors in a table. From the table, it is then easy to create line graphs with waveforms or the average value into bar graphs. We will not use the thermal camera very much here, as most graphics cards have a backplate, which makes it impossible to measure the PCB heating. The key for the heating graphs will be the temperature reading by internal sensors, according to which, after all, the GPU frequency control also takes place. It will always be the heating of the graphics core, and if the sensors are also on VRAM and VRM, we will extract these values into the article as well.
After the GeForce RTX 4080 graphics cards, which wasn’t to many people’s taste due to the higher price, Nvidia has released a significantly cheaper GPU for the GeForce RTX 4070 Ti. The performance versus the RTX 4080 is admittedly noticeably weaker, but percentage-wise not by as much as the roughly two-thirds lower price of the RTX 4070 Ti. In our tests, we analyze MSI’s non-reference design from the top-of-the-line Suprim X series.
Test setup
| Test configuration | |
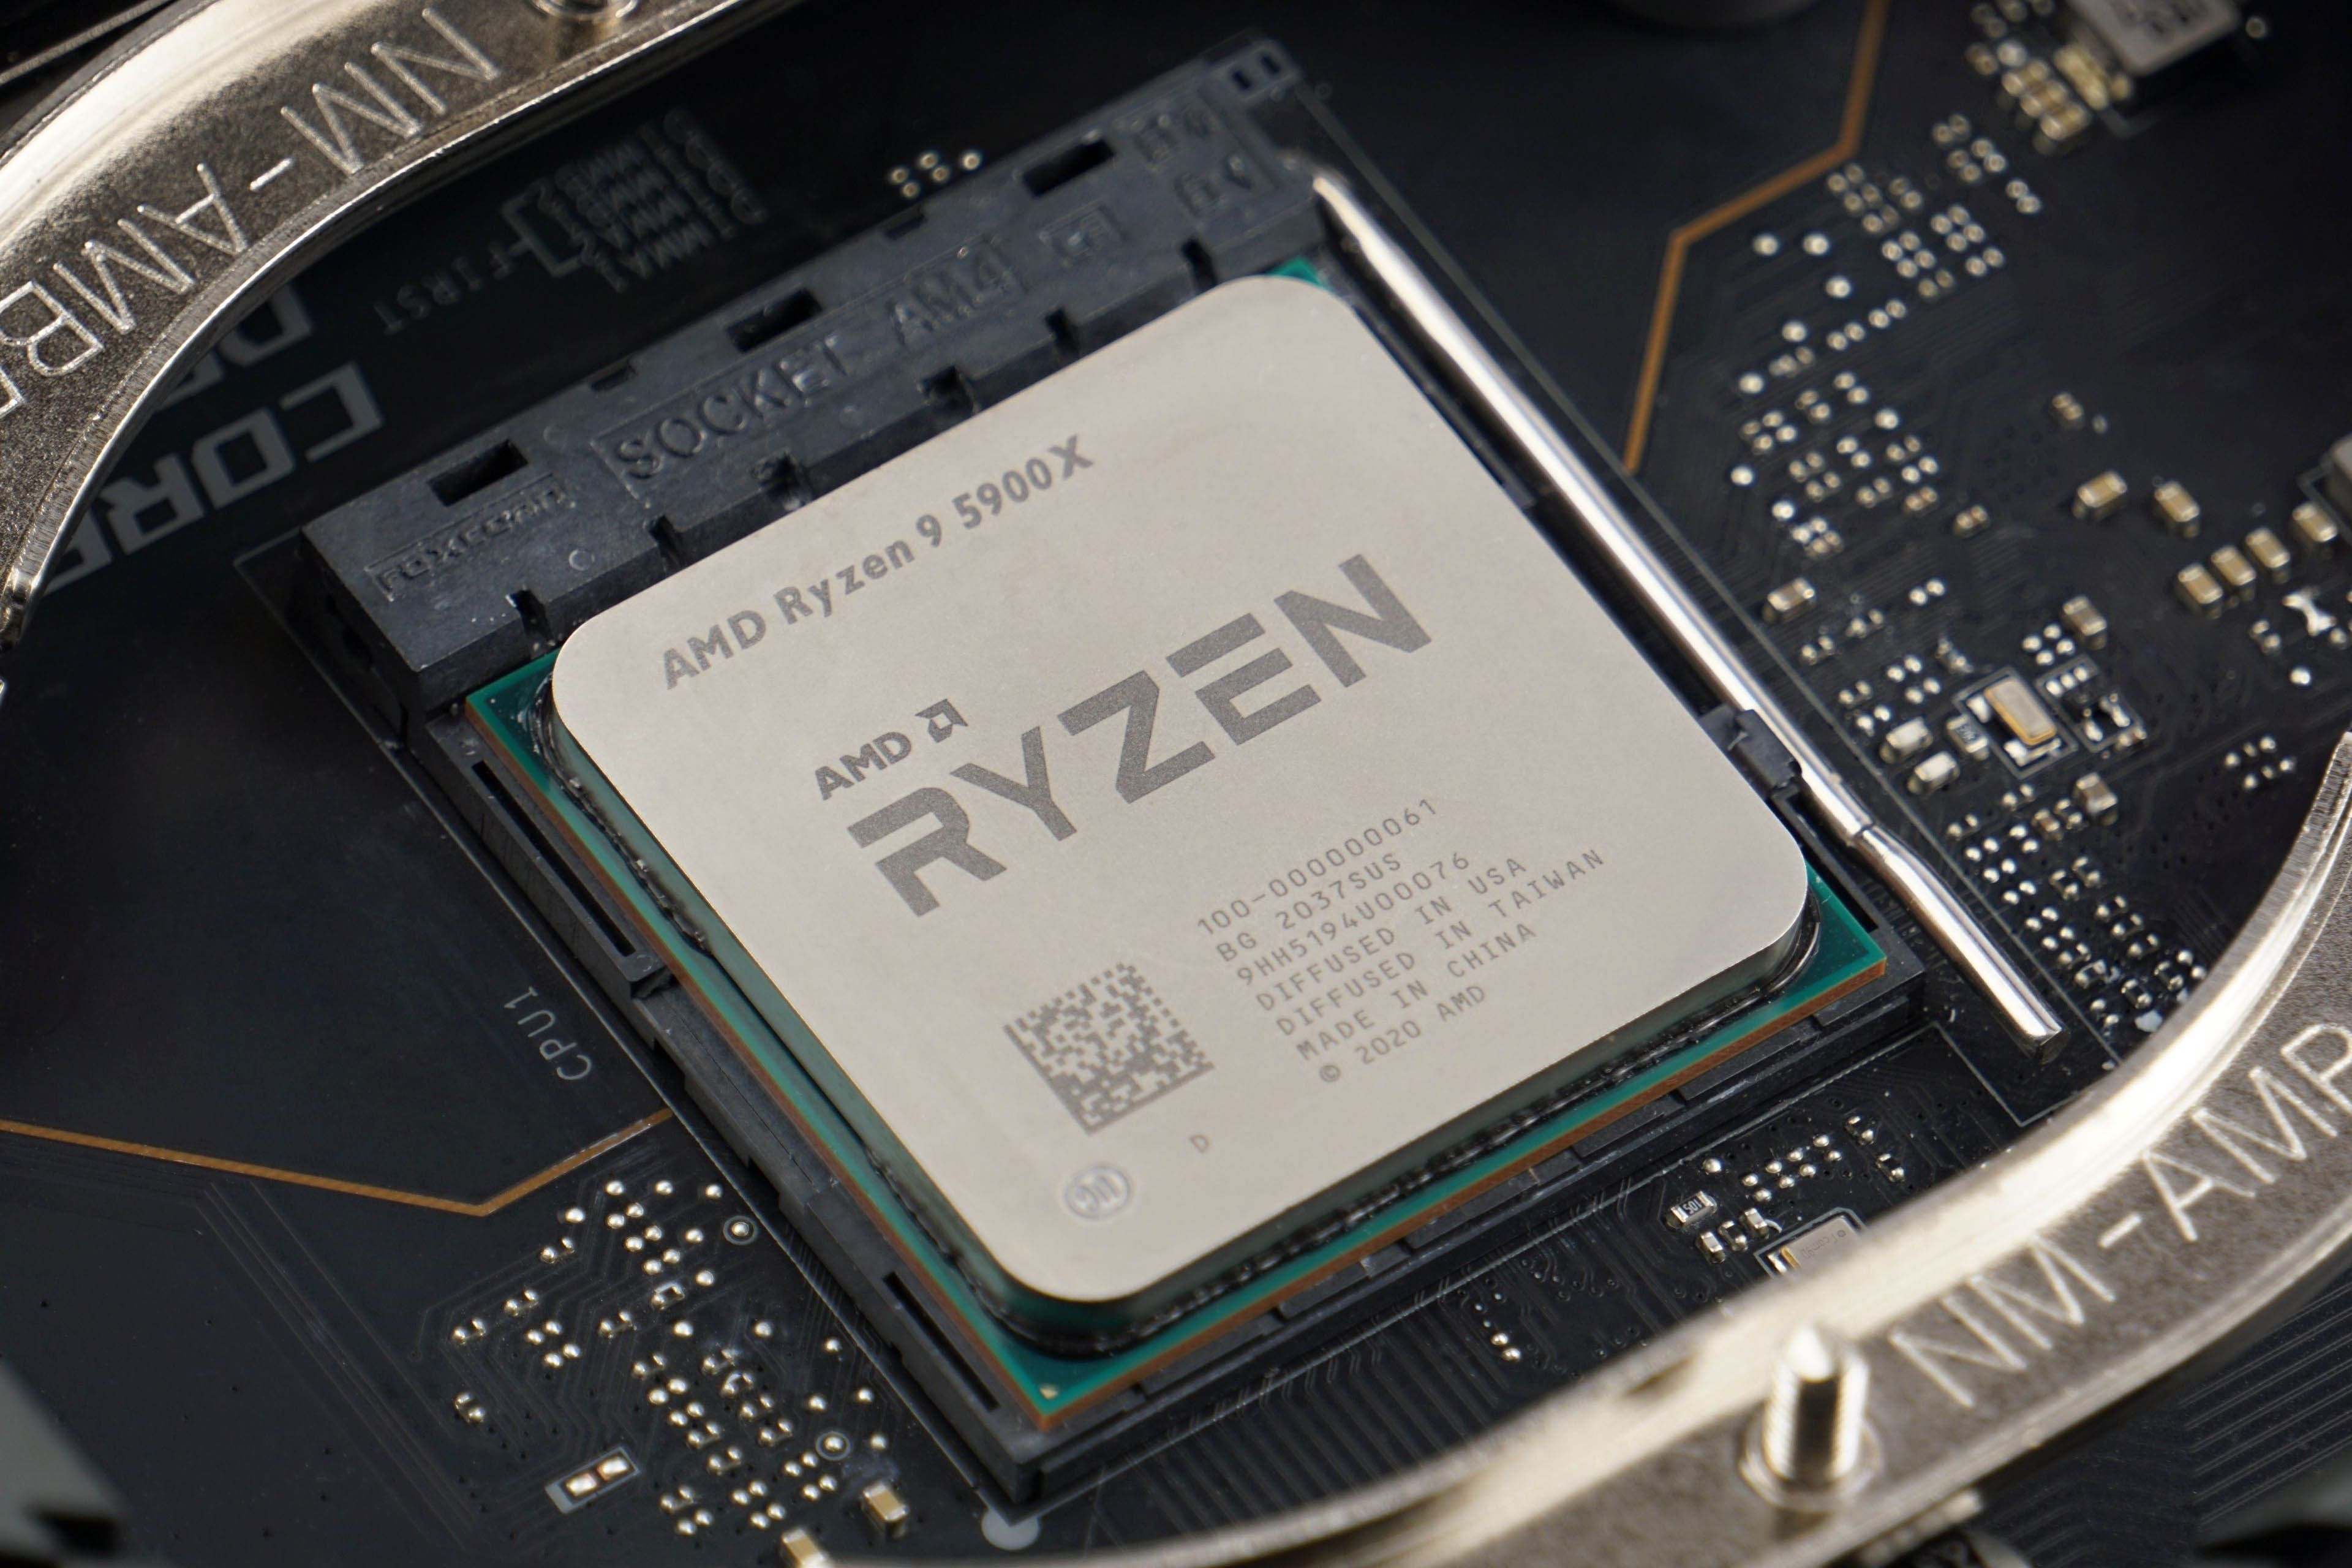
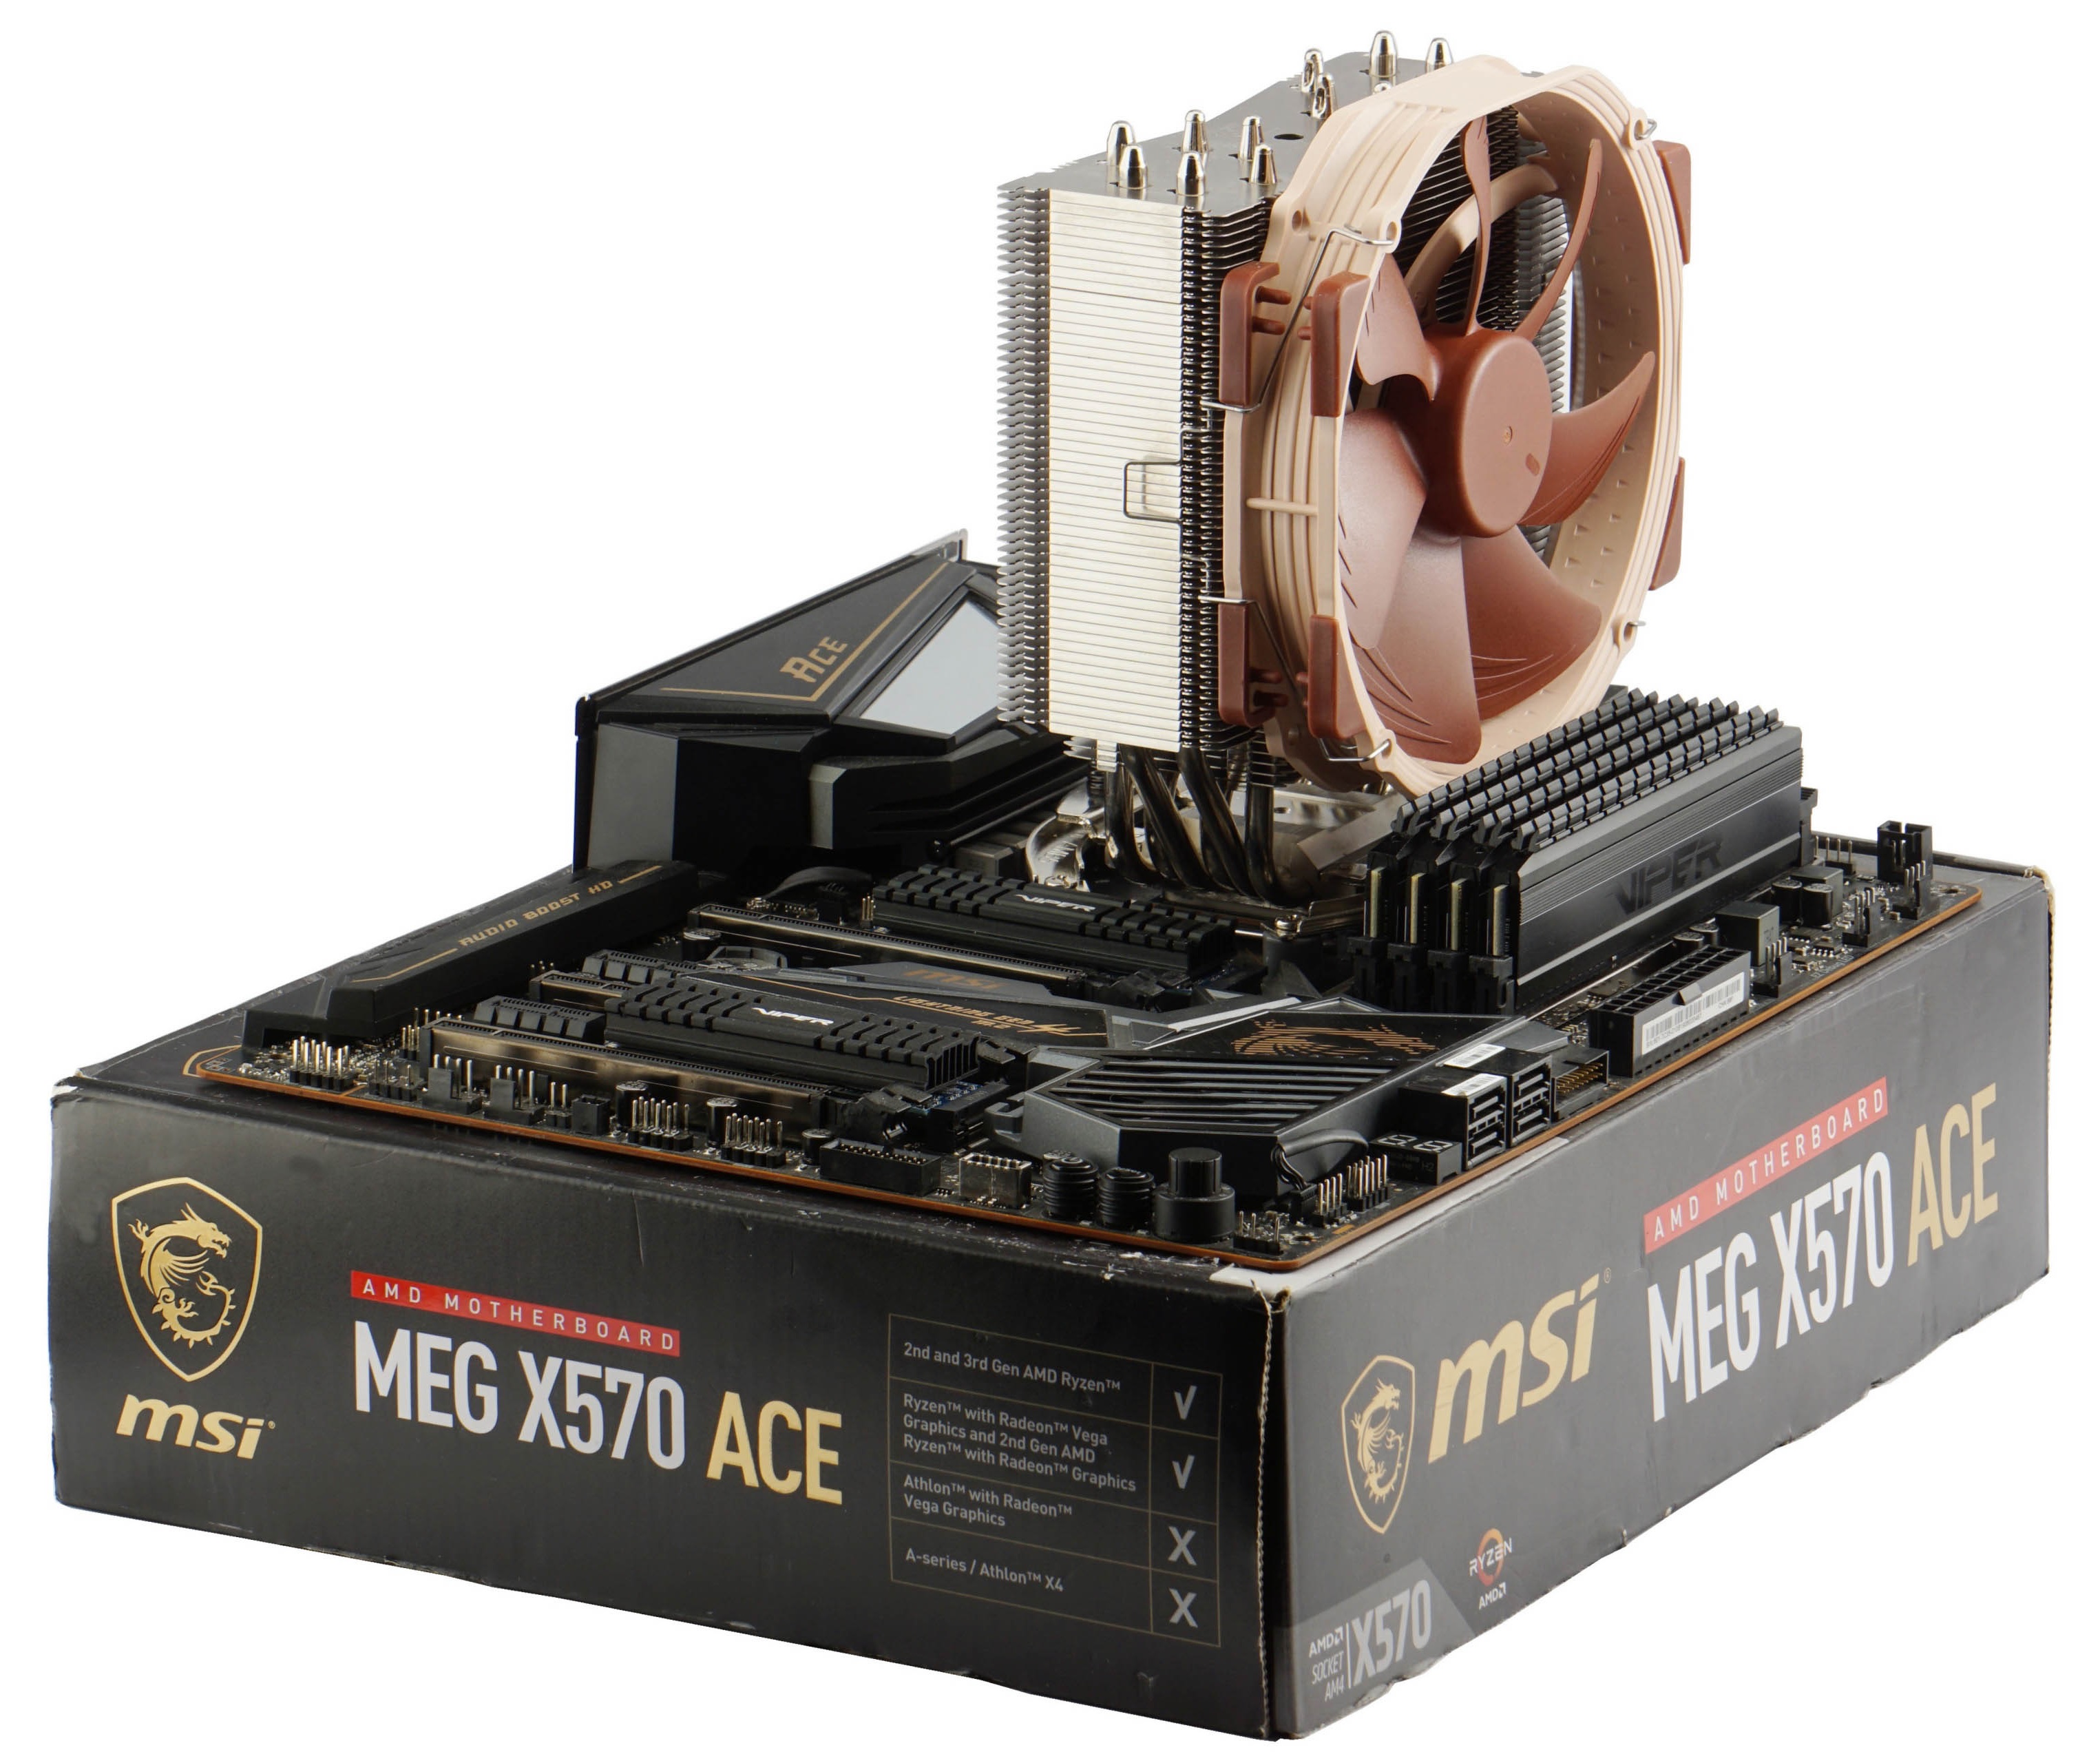
| Processor | AMD Ryzen 9 5900X |
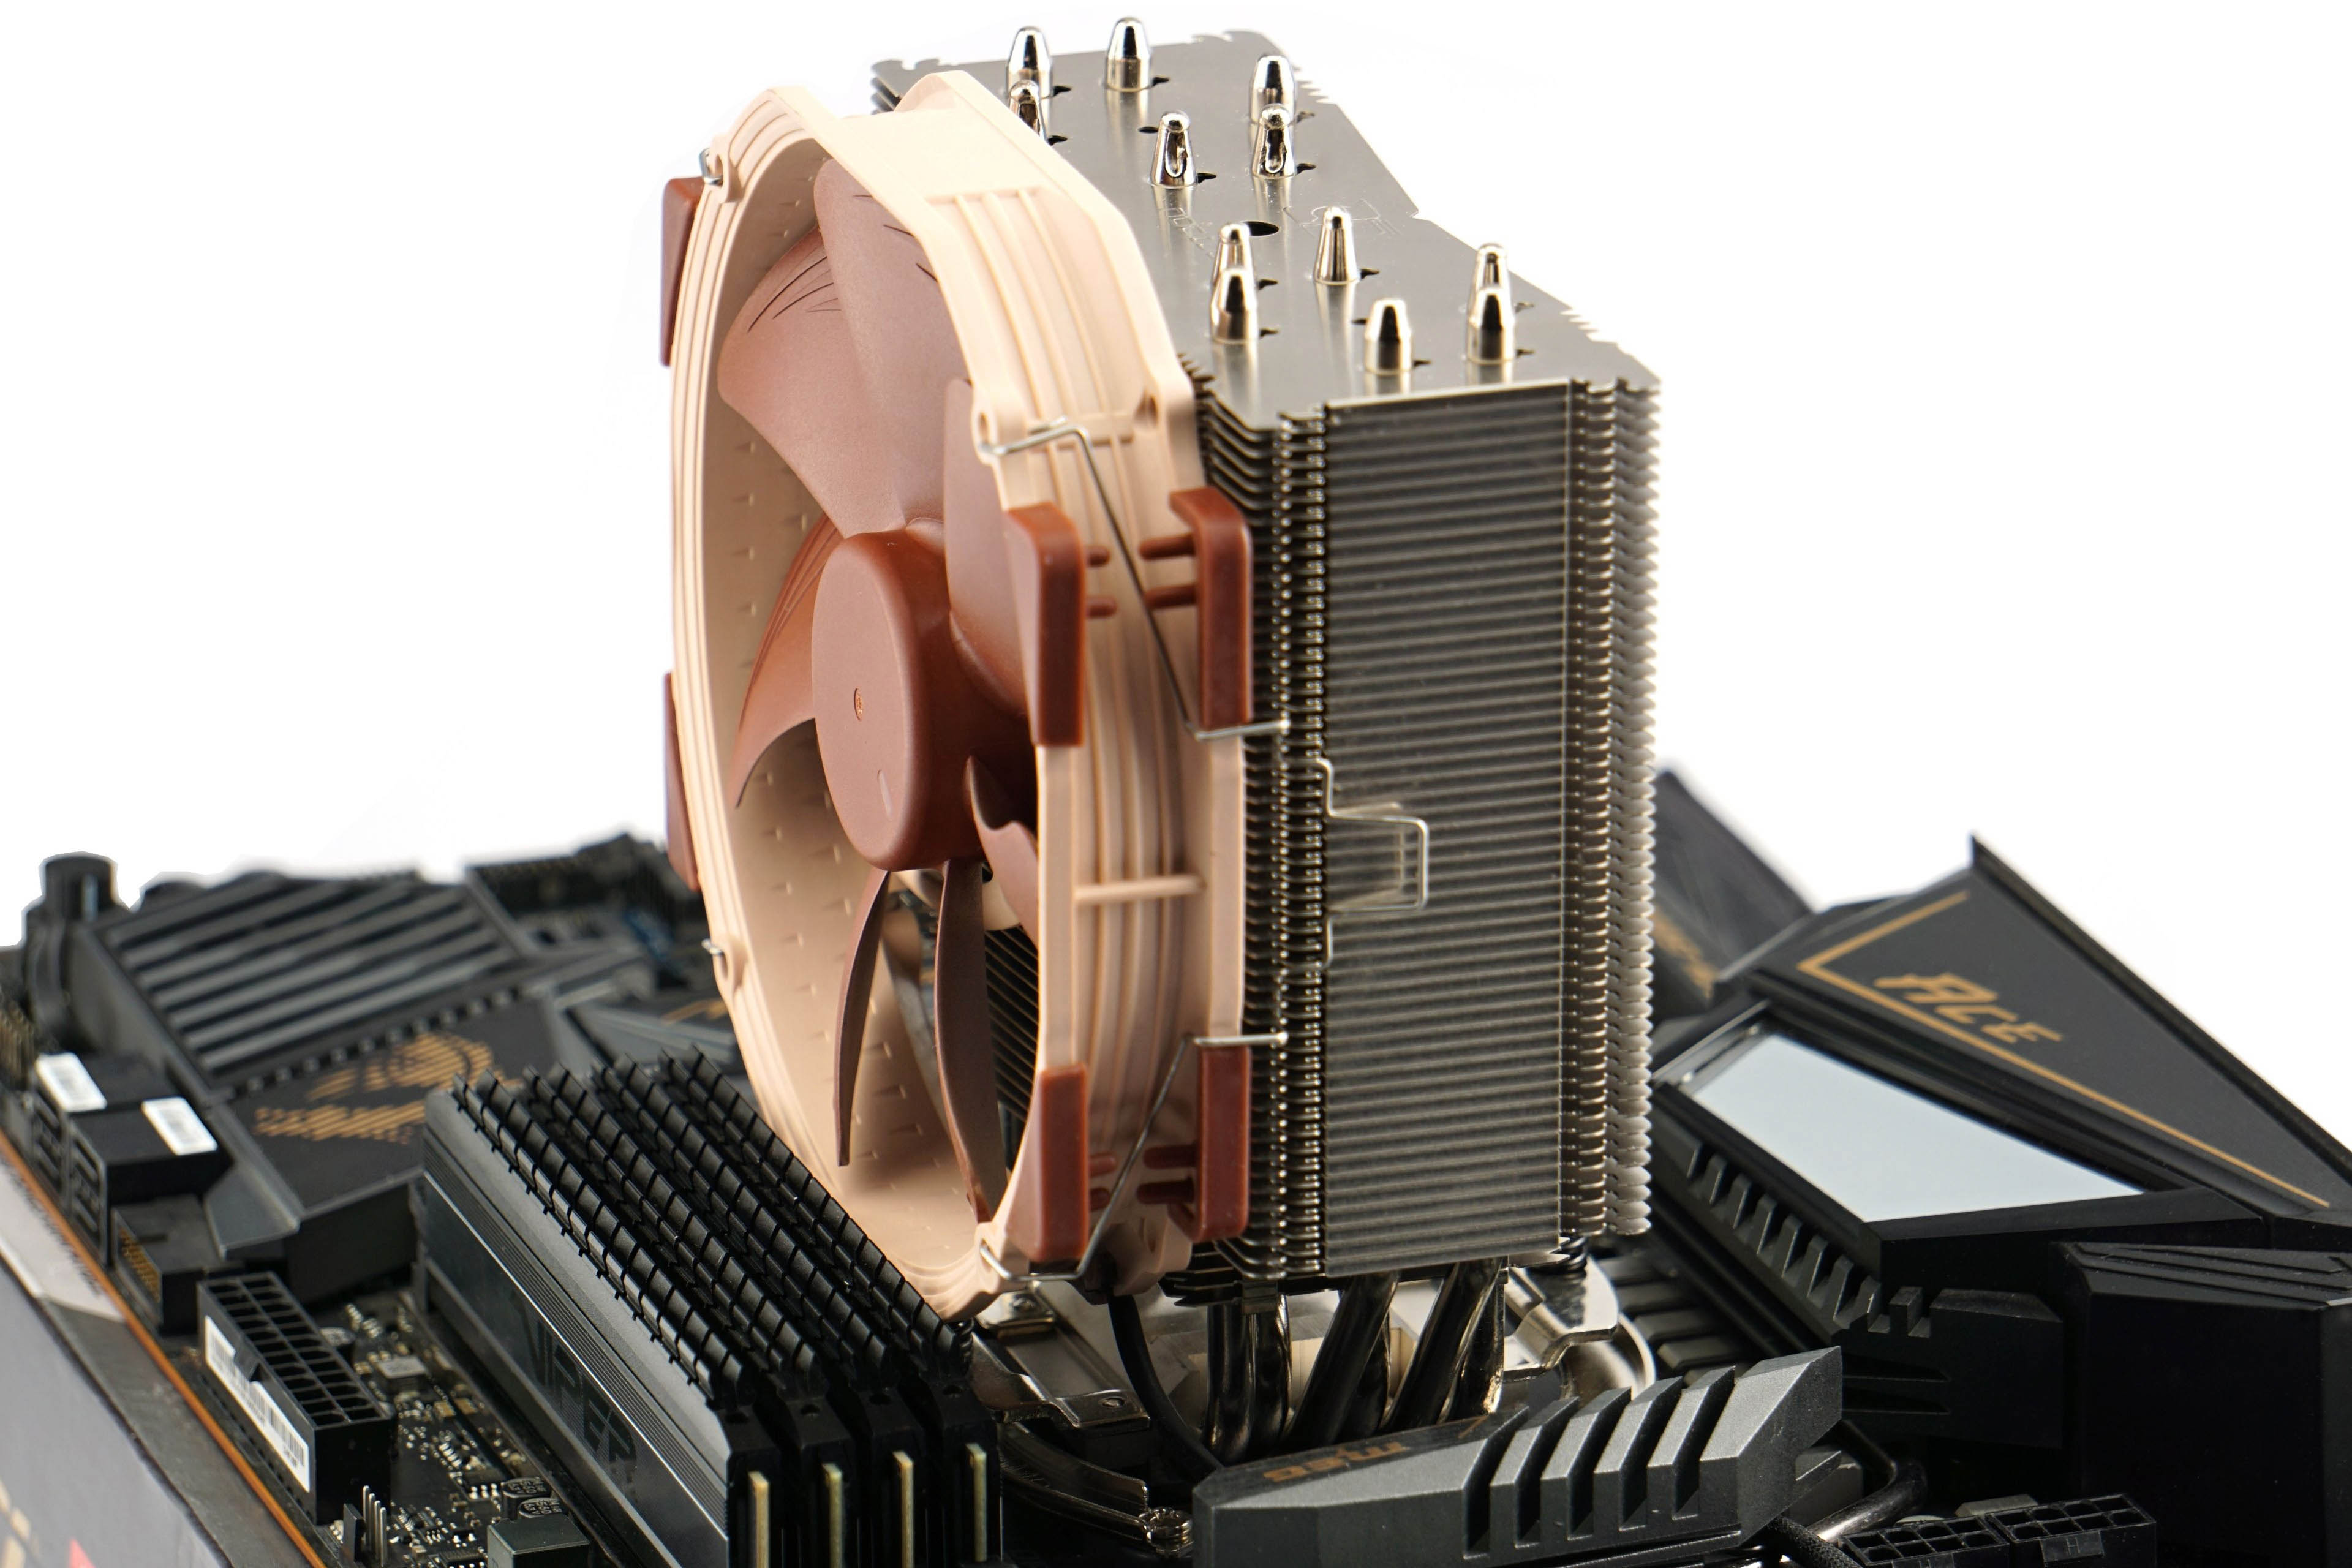
| CPU Cooler | Noctua NH-U14S@12 V s NT-H2 |
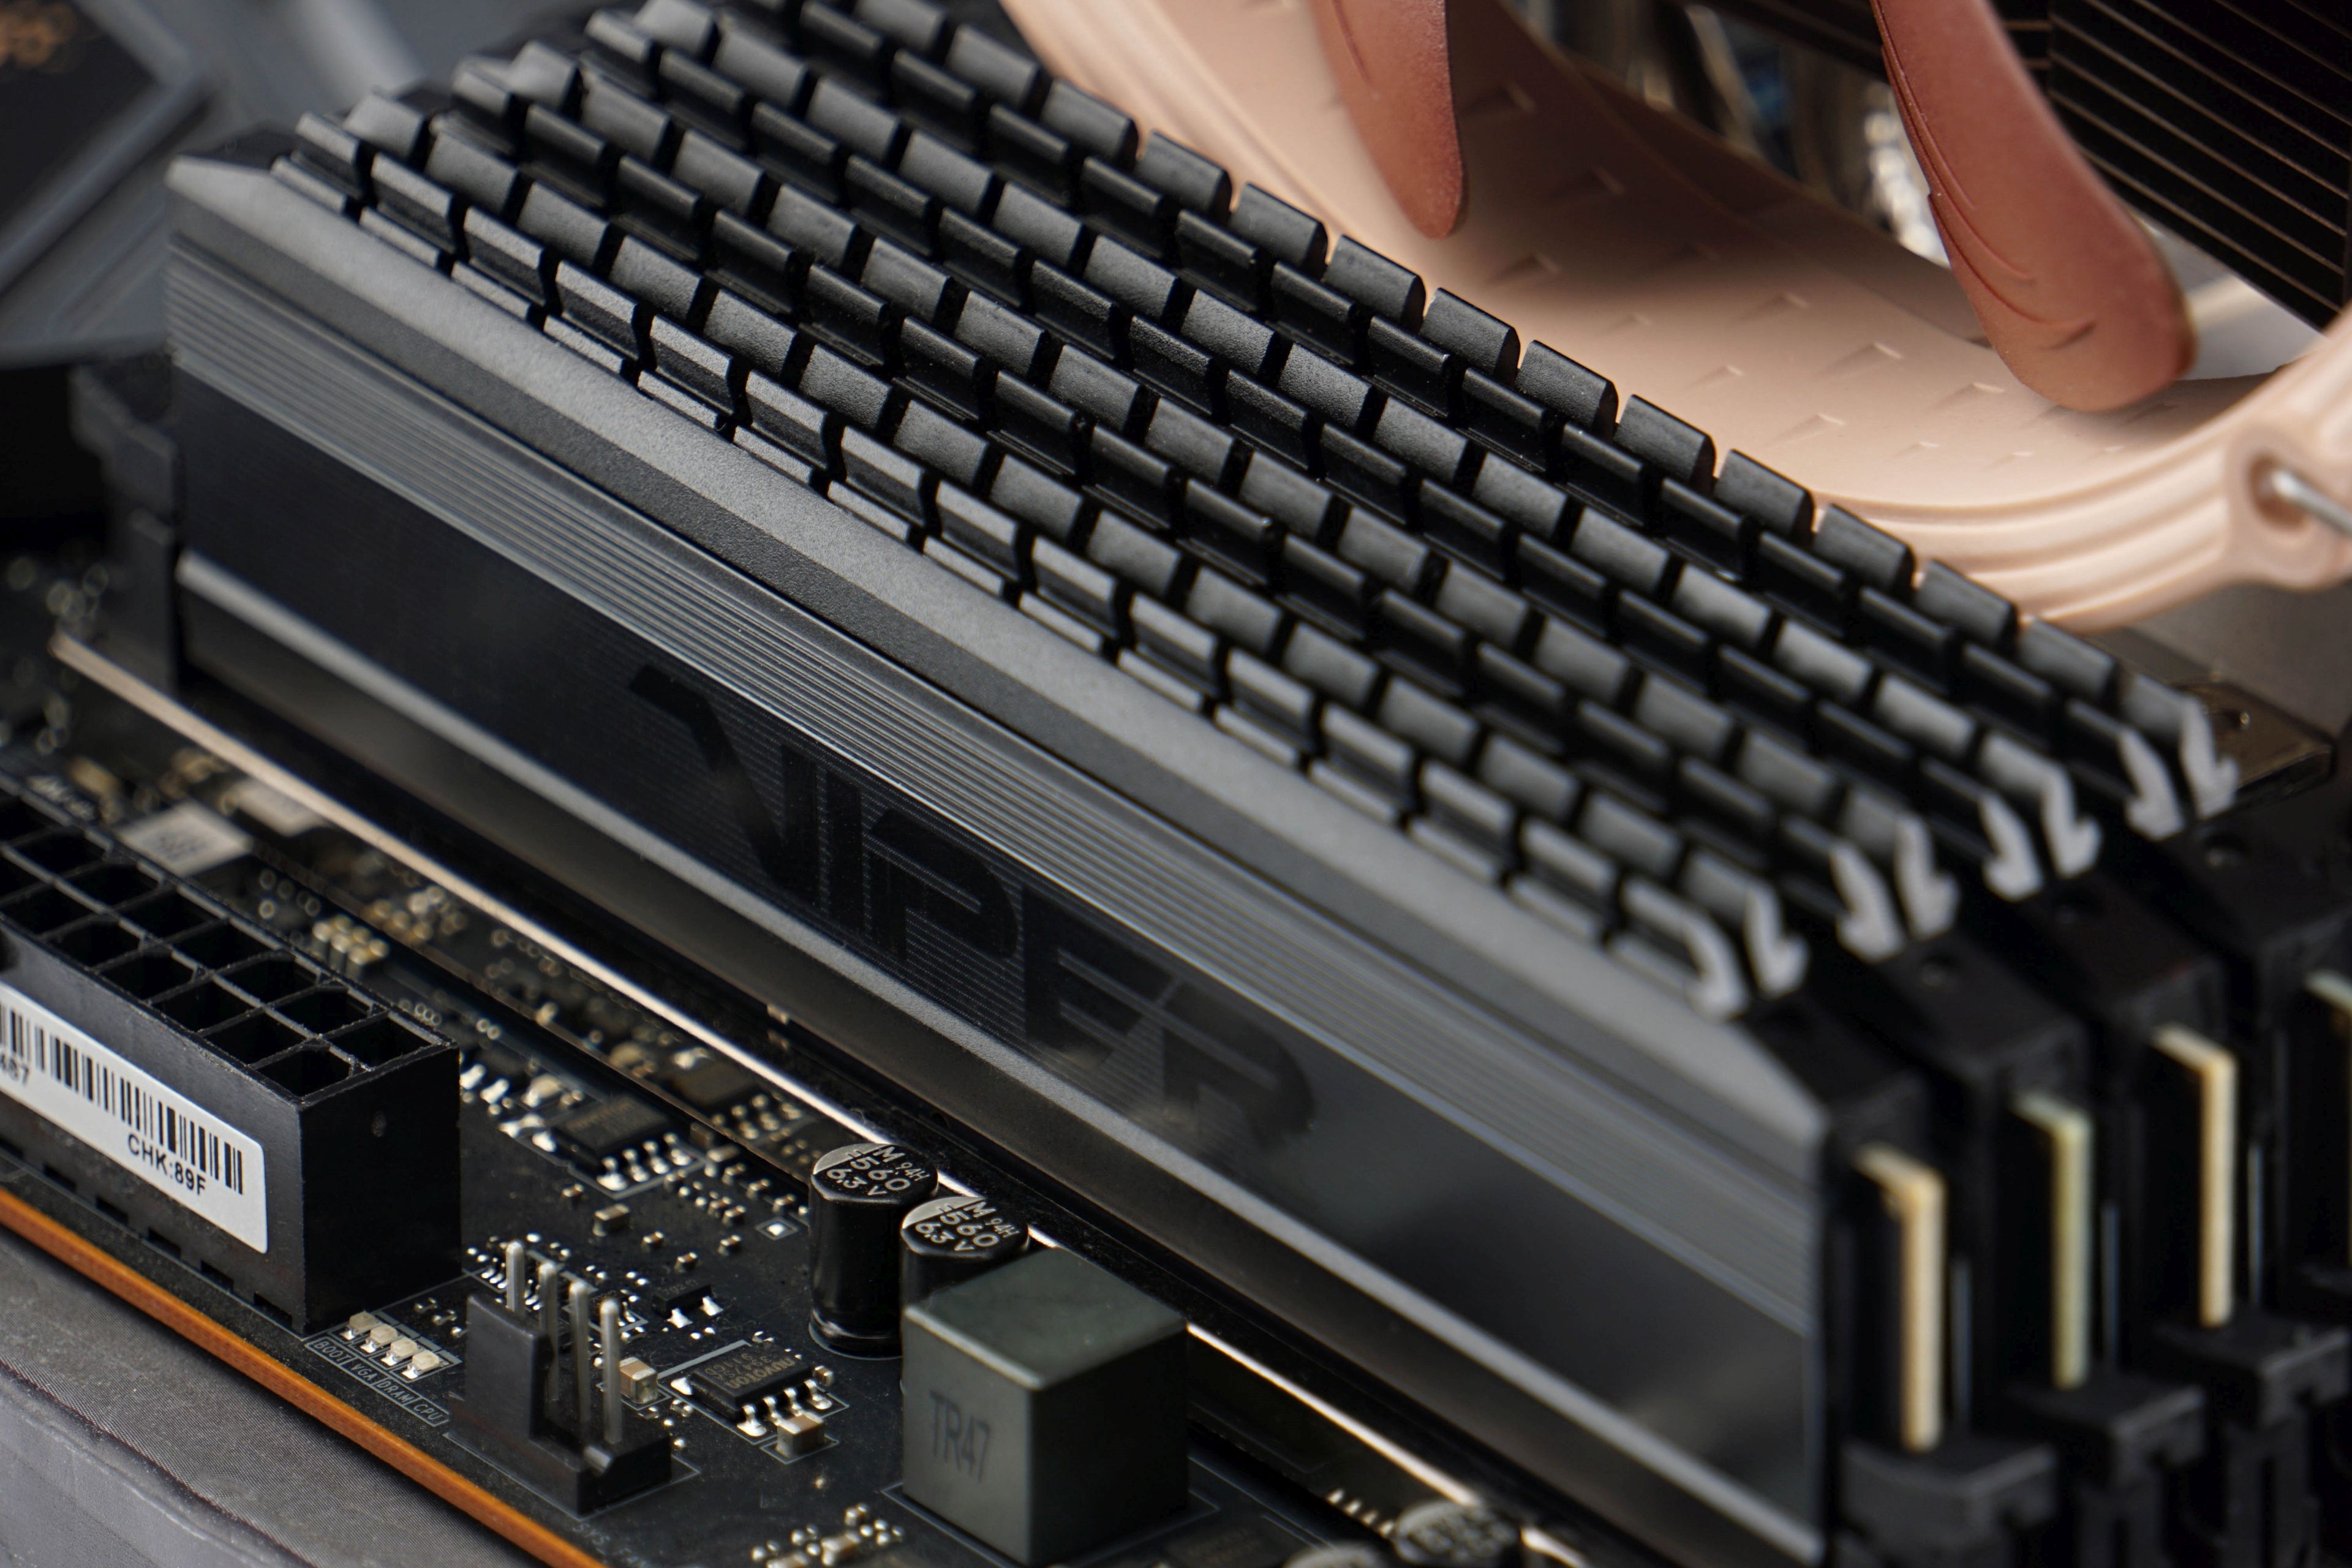
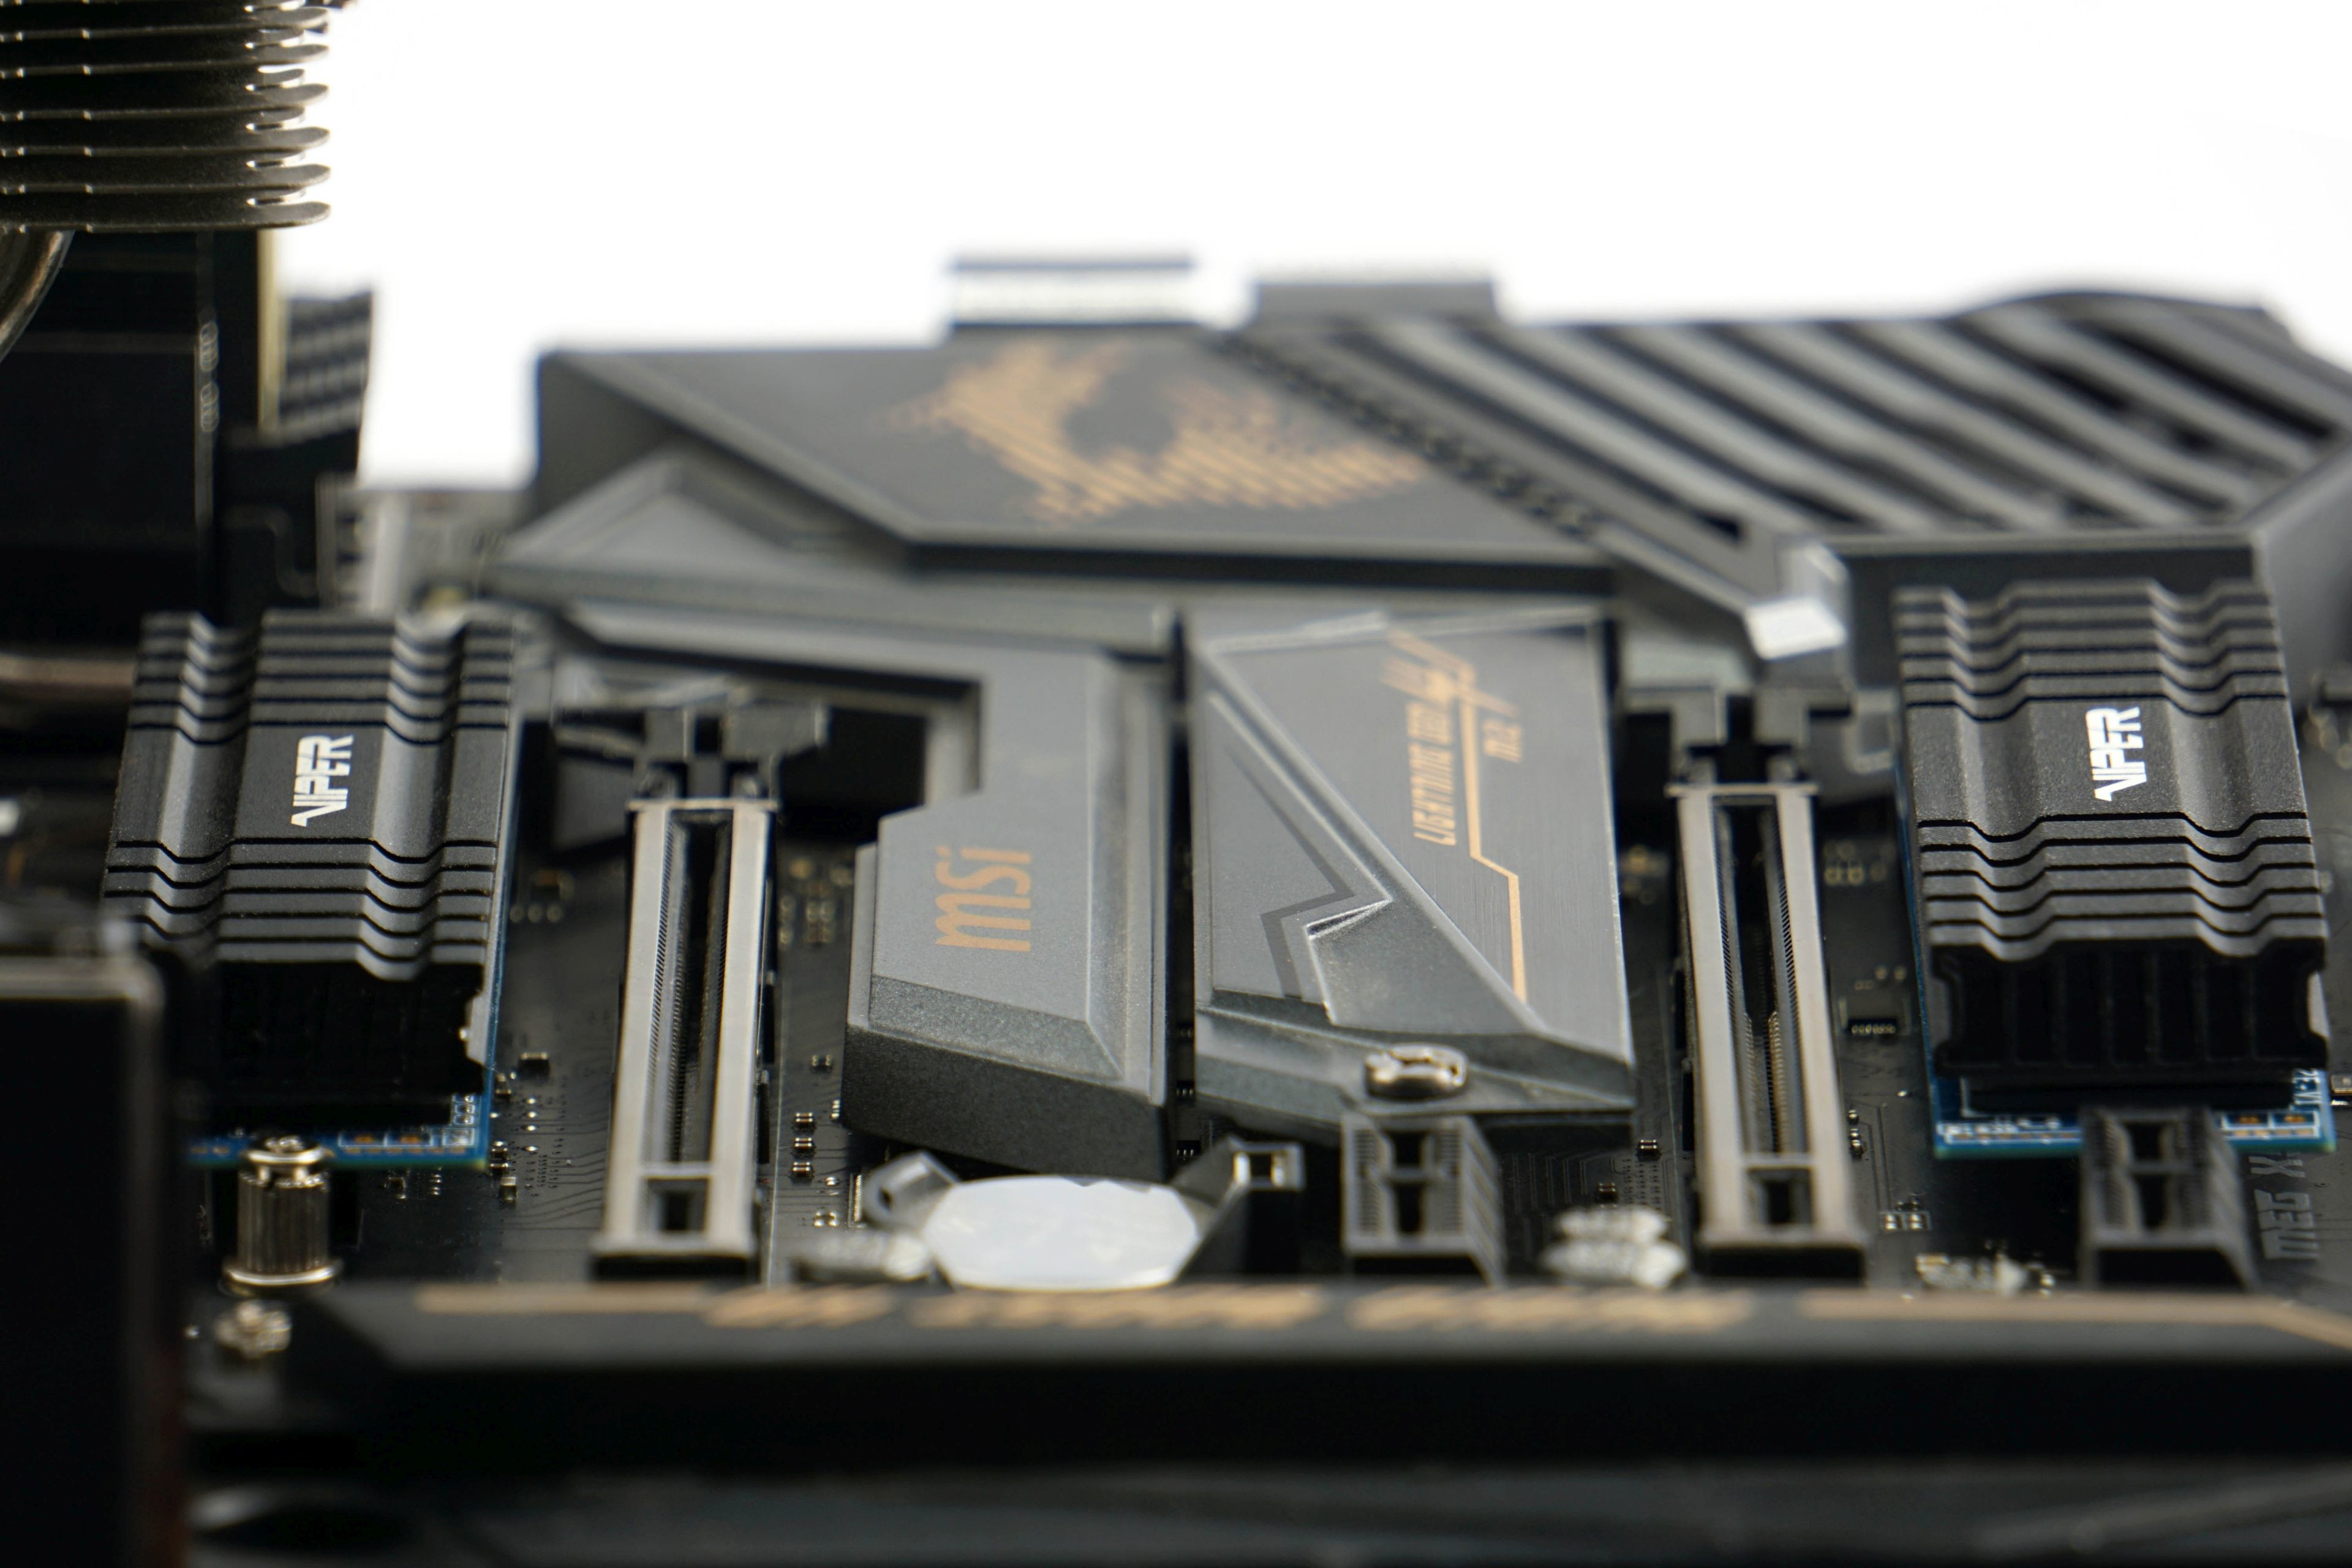
| Motherboard | MSI MEG X570 Ace |
| Memory (RAM) | Patriot Blackout, 4× 8 GB, 3600 MHz/CL18 |
| SSD | 2× Patriot Viper VPN100 (512 GB + 2 TB) |
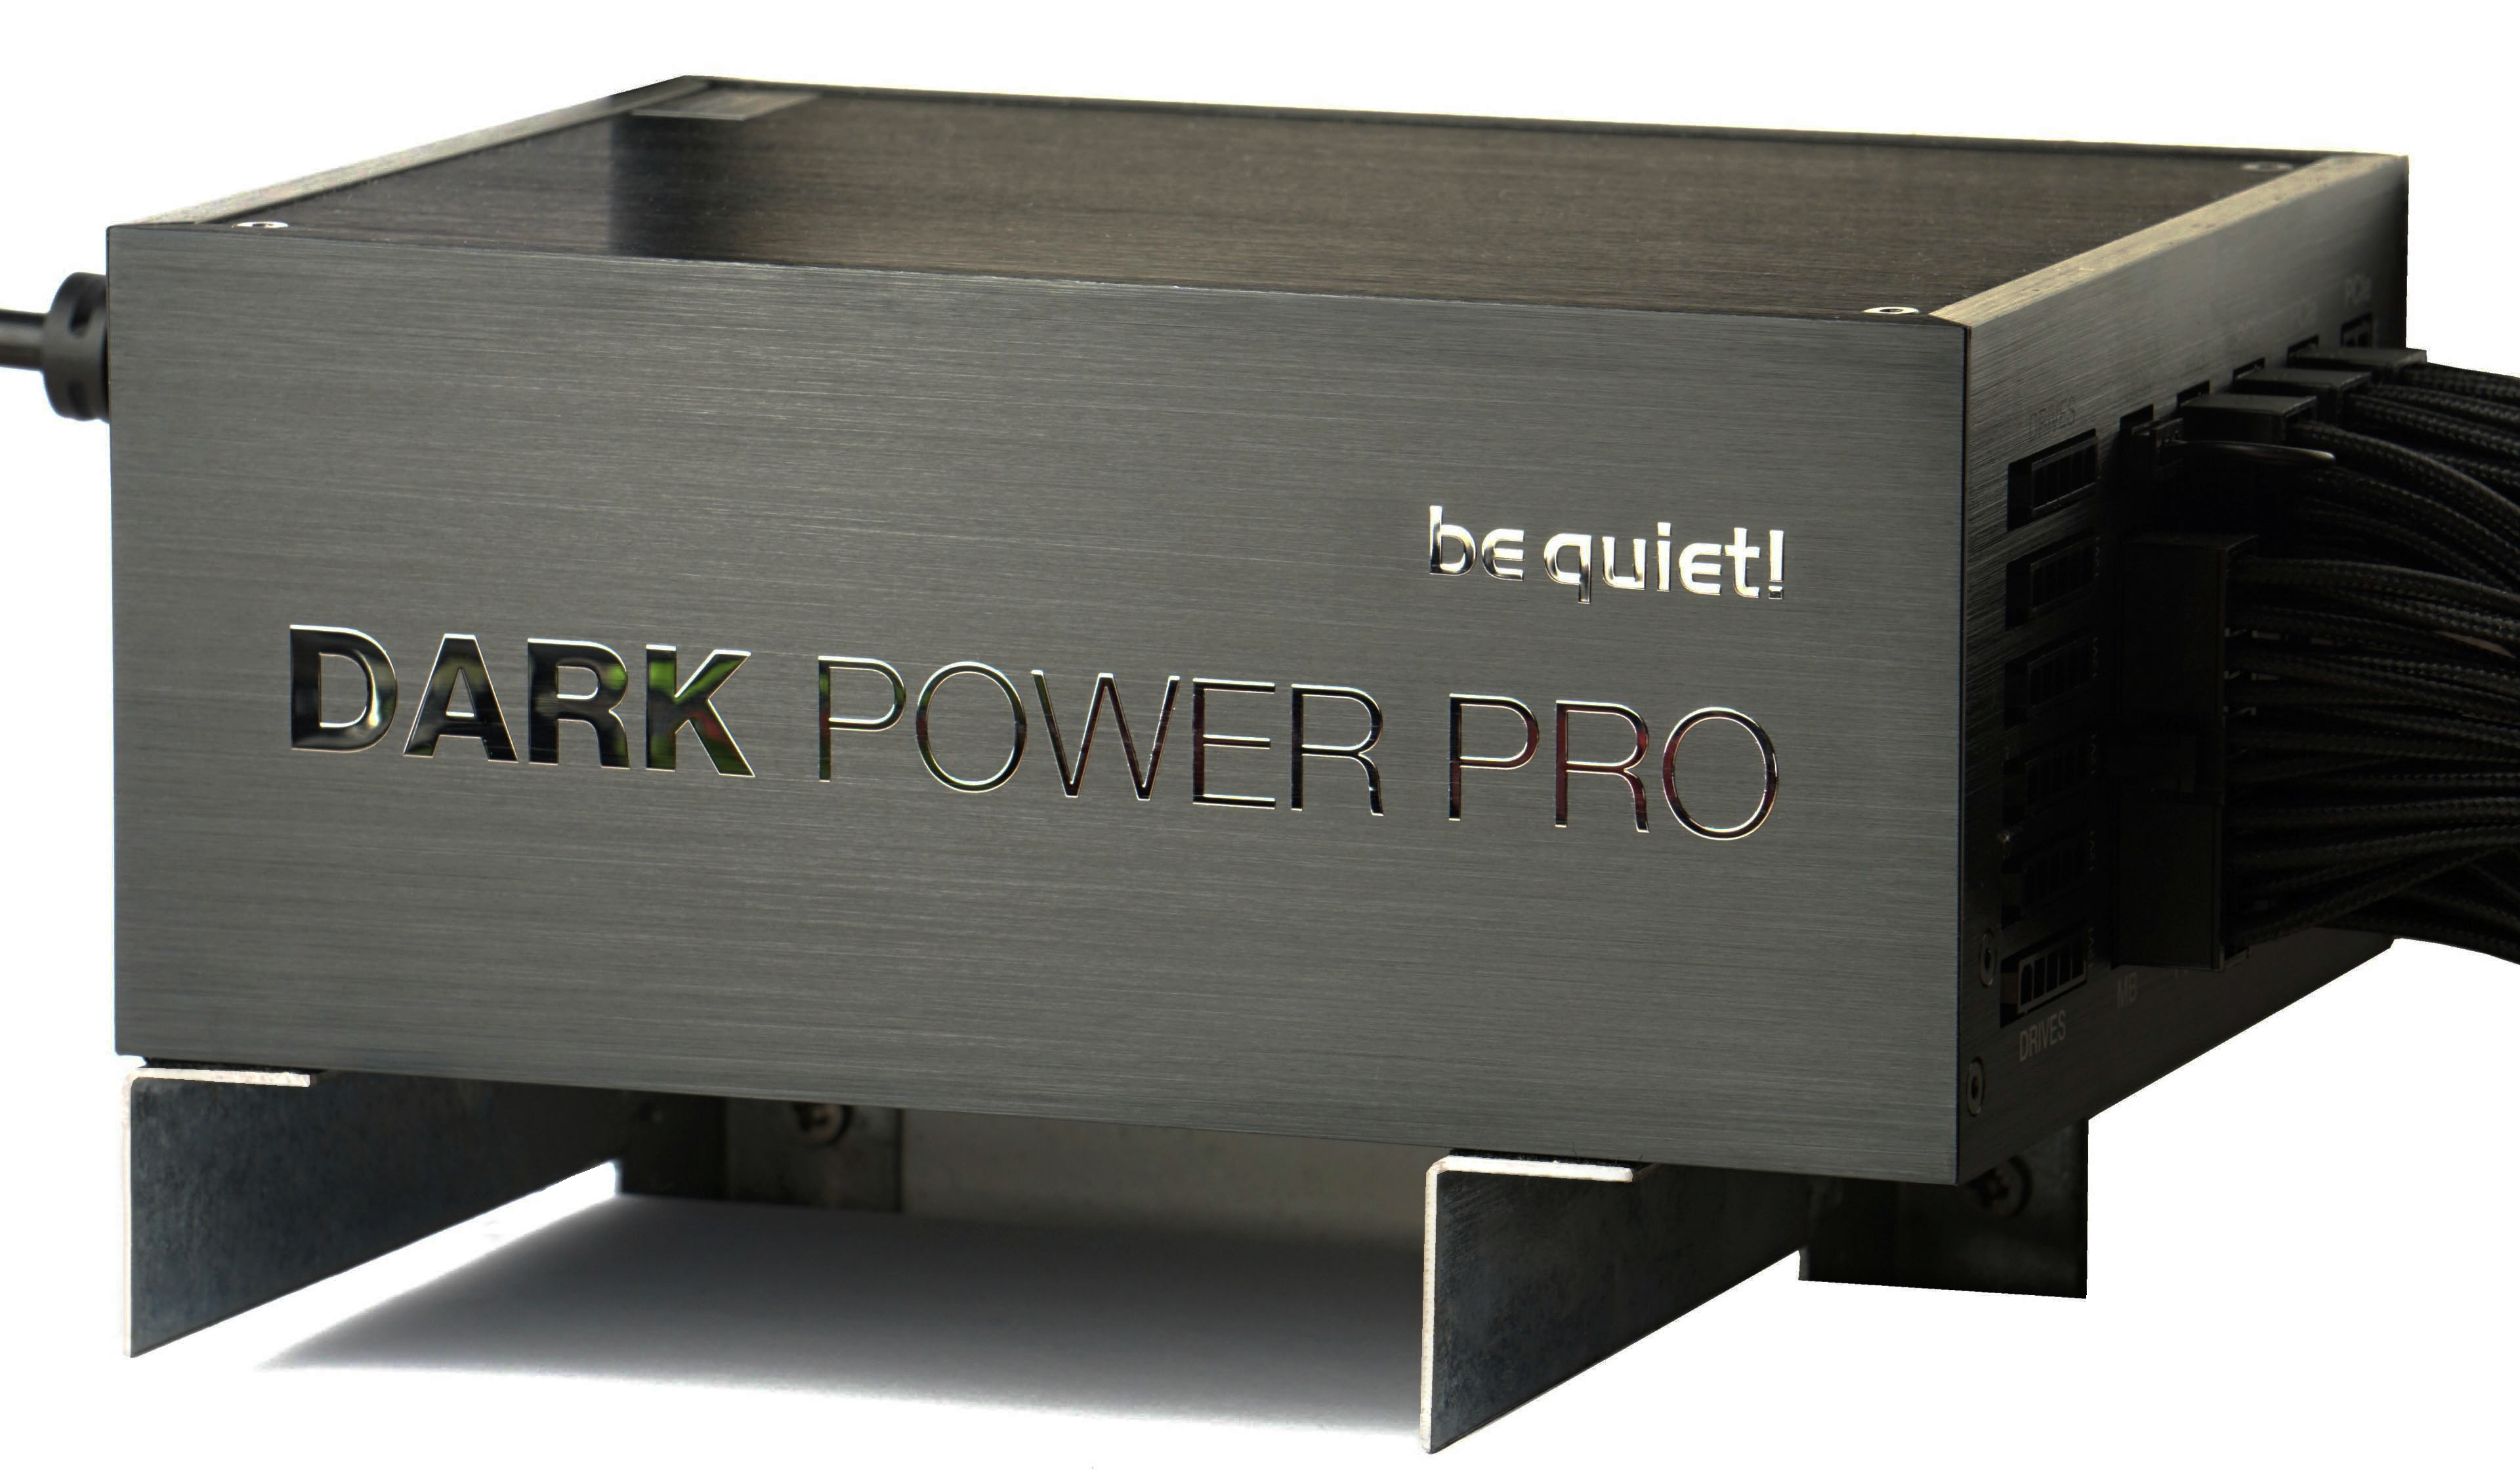
| PSU | BeQuiet! Dark Power Pro 12 (1200 W) |
Note: Nvidia GeForce 528.49 Game Ready and 528.49 Studio graphics drivers are used at the time of testing, Windows 10 Enterprise OS build is 19043.
After the GeForce RTX 4080 graphics cards, which wasn’t to many people’s taste due to the higher price, Nvidia has released a significantly cheaper GPU for the GeForce RTX 4070 Ti. The performance versus the RTX 4080 is admittedly noticeably weaker, but percentage-wise not by as much as the roughly two-thirds lower price of the RTX 4070 Ti. In our tests, we analyze MSI’s non-reference design from the top-of-the-line Suprim X series.
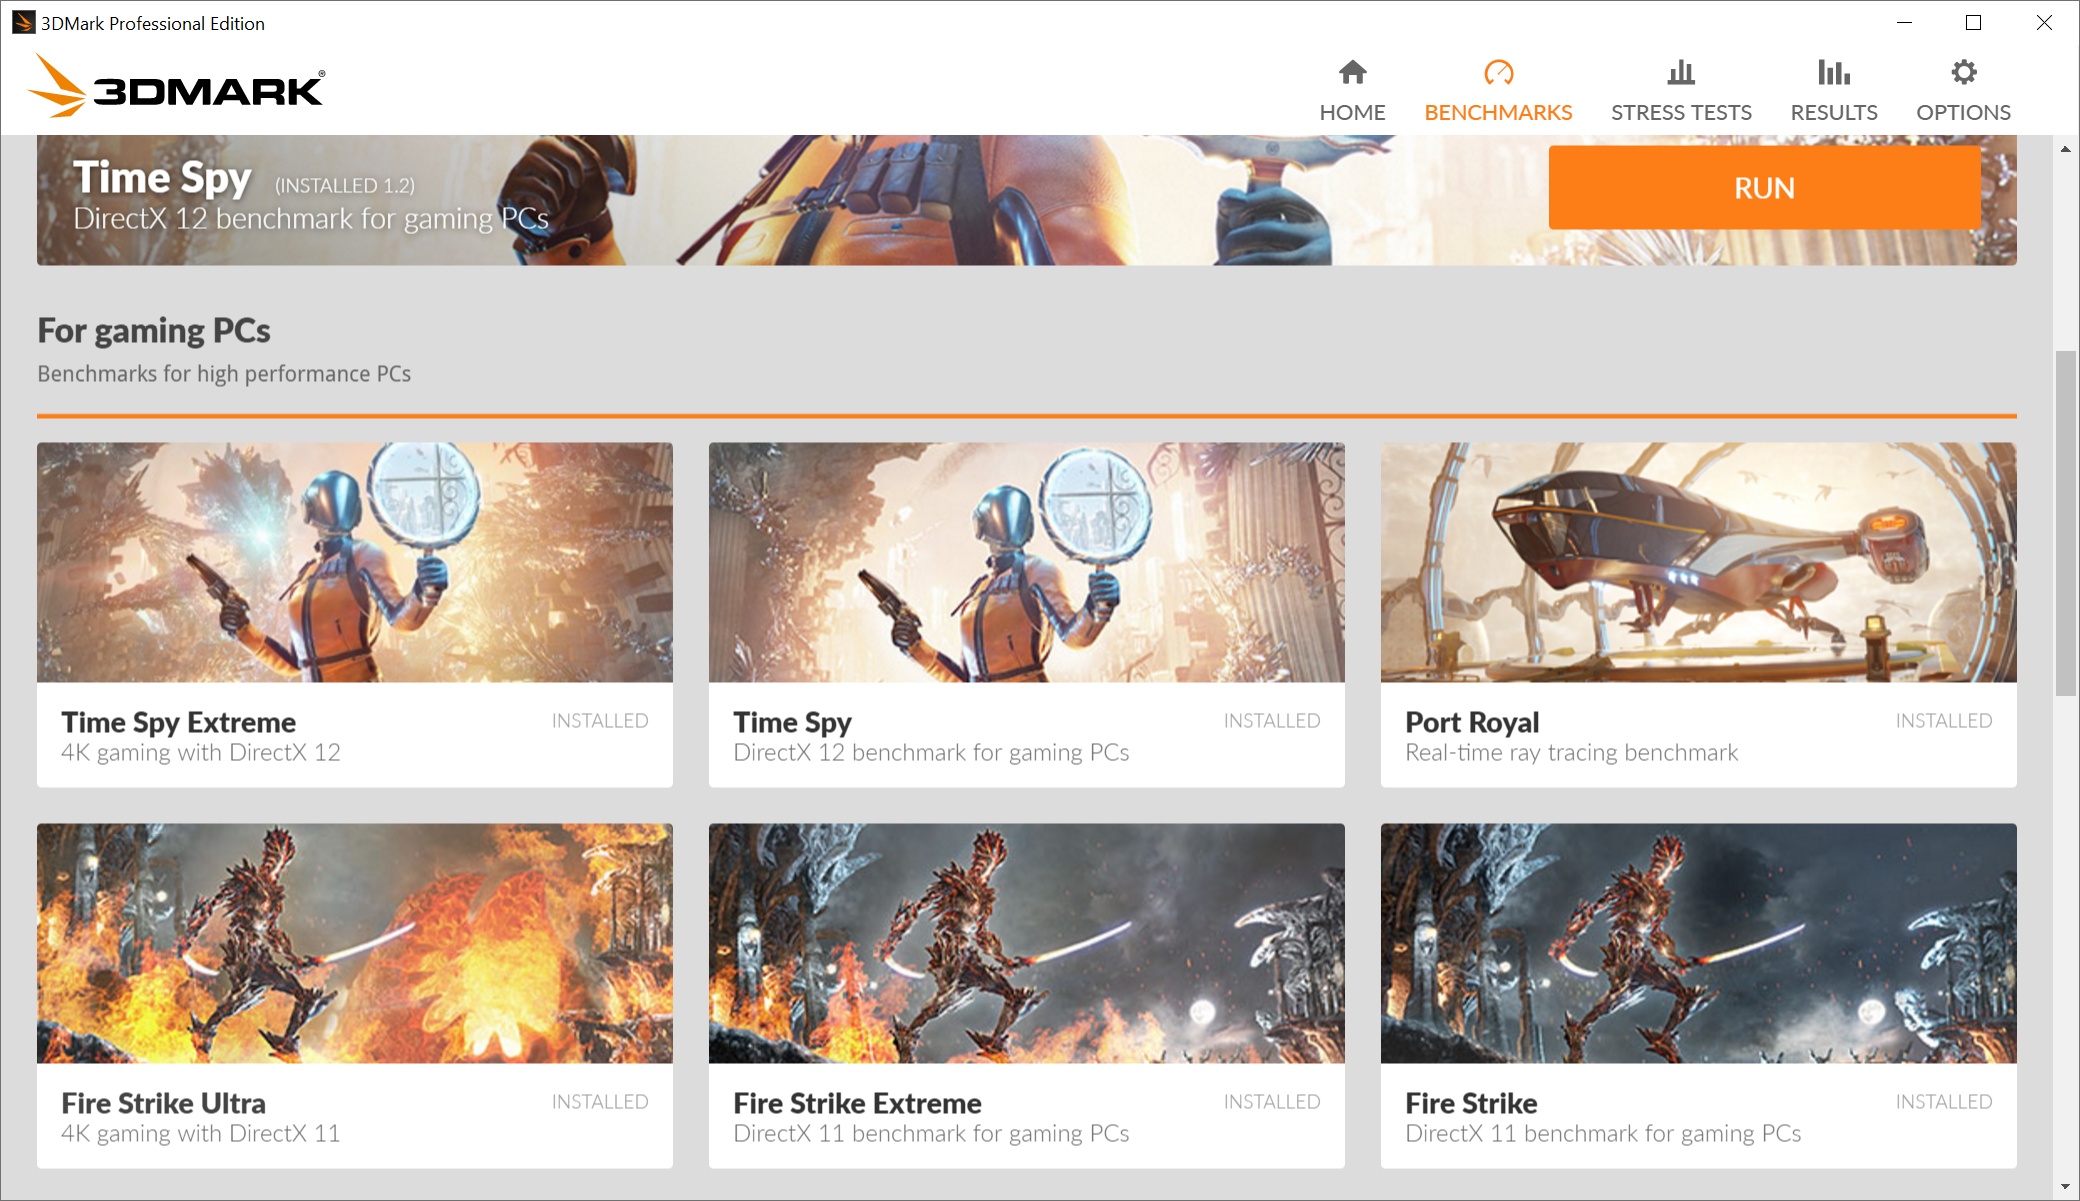
3DMark
For the tests we’re using 3DMark Professional and the Night Raid (DirectX12) is suitable for comparing weaker GPUs, for more powerful ones there is Fire Strike (DirectX11) and Time Spy (DirectX12).

After the GeForce RTX 4080 graphics cards, which wasn’t to many people’s taste due to the higher price, Nvidia has released a significantly cheaper GPU for the GeForce RTX 4070 Ti. The performance versus the RTX 4080 is admittedly noticeably weaker, but percentage-wise not by as much as the roughly two-thirds lower price of the RTX 4070 Ti. In our tests, we analyze MSI’s non-reference design from the top-of-the-line Suprim X series.
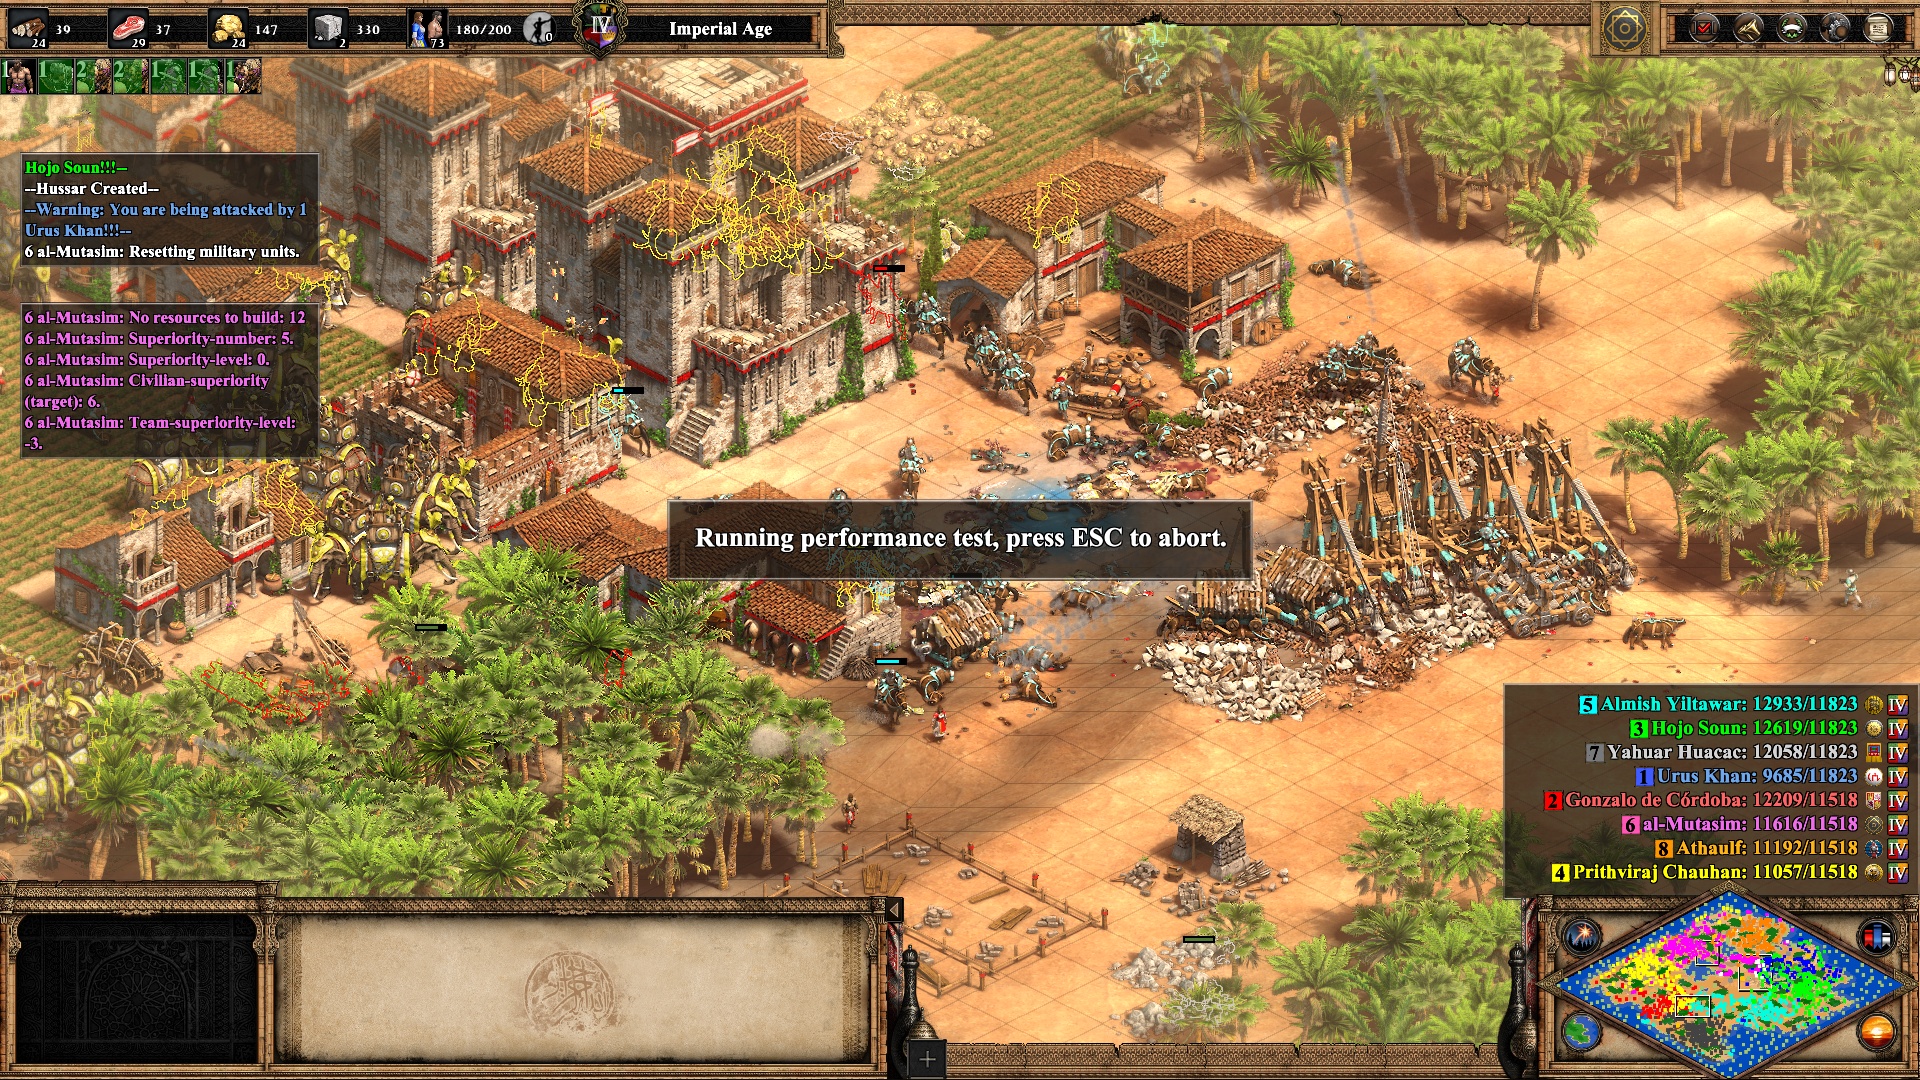
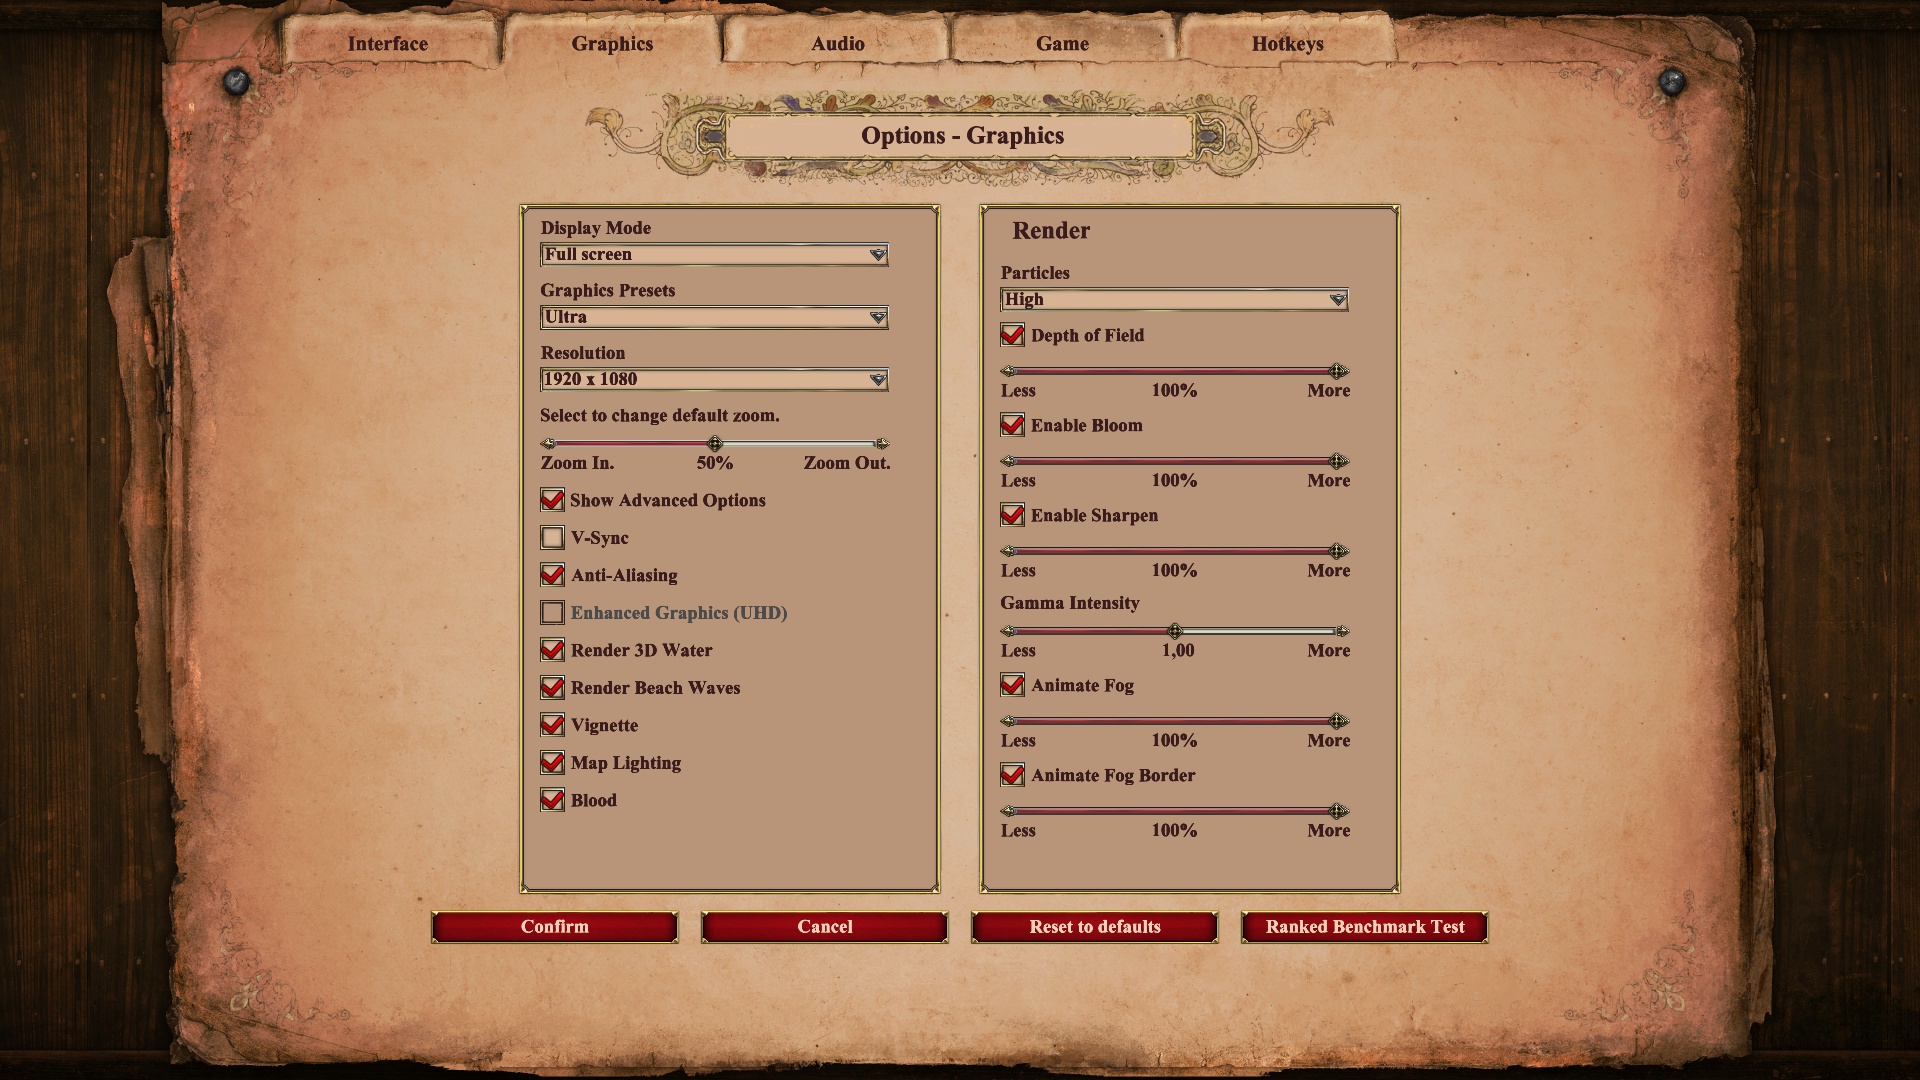
Age of Empires II: DE
Test platform benchmark, API DirectX 11; graphics settings preset Ultra; no extra settings.

After the GeForce RTX 4080 graphics cards, which wasn’t to many people’s taste due to the higher price, Nvidia has released a significantly cheaper GPU for the GeForce RTX 4070 Ti. The performance versus the RTX 4080 is admittedly noticeably weaker, but percentage-wise not by as much as the roughly two-thirds lower price of the RTX 4070 Ti. In our tests, we analyze MSI’s non-reference design from the top-of-the-line Suprim X series.
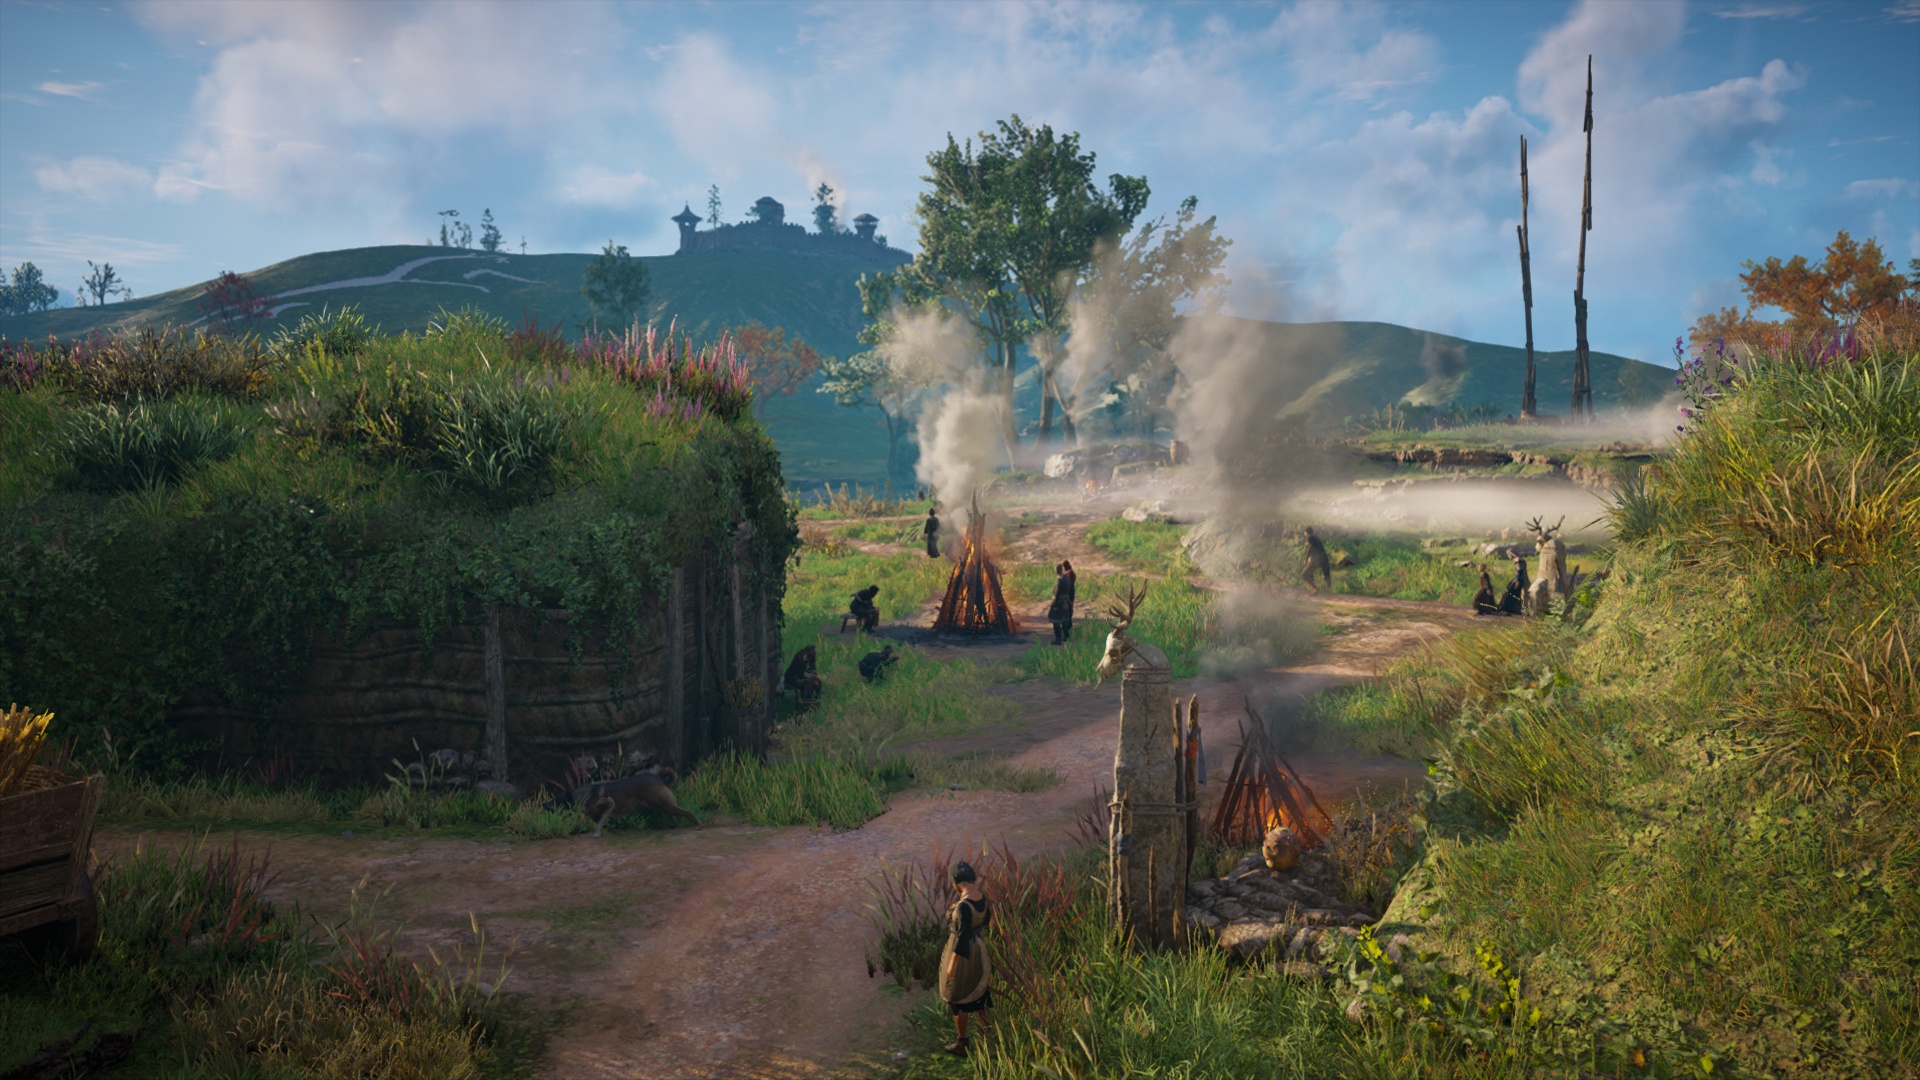
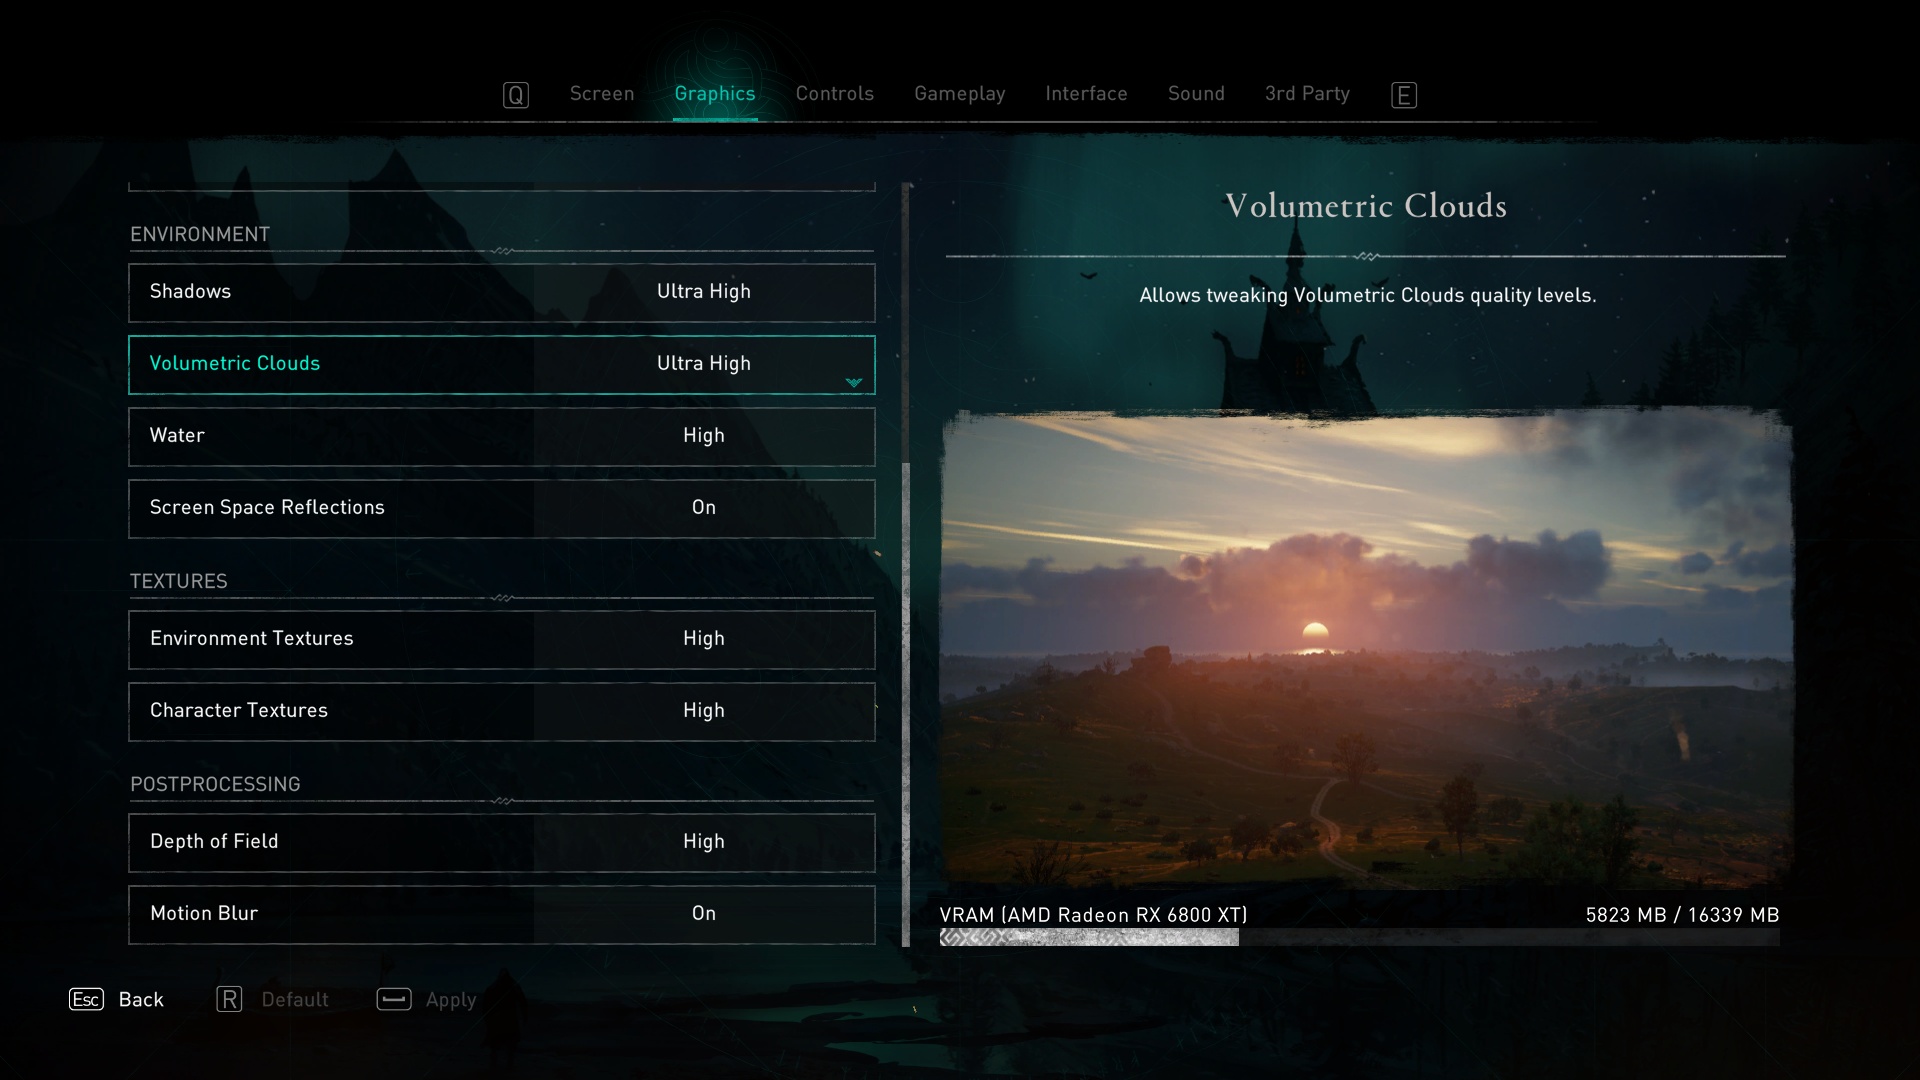
Assassin’s Creed: Valhalla
Test platform benchmark; API DirectX 12; graphics settings preset Ultra High; no extra settings.

After the GeForce RTX 4080 graphics cards, which wasn’t to many people’s taste due to the higher price, Nvidia has released a significantly cheaper GPU for the GeForce RTX 4070 Ti. The performance versus the RTX 4080 is admittedly noticeably weaker, but percentage-wise not by as much as the roughly two-thirds lower price of the RTX 4070 Ti. In our tests, we analyze MSI’s non-reference design from the top-of-the-line Suprim X series.
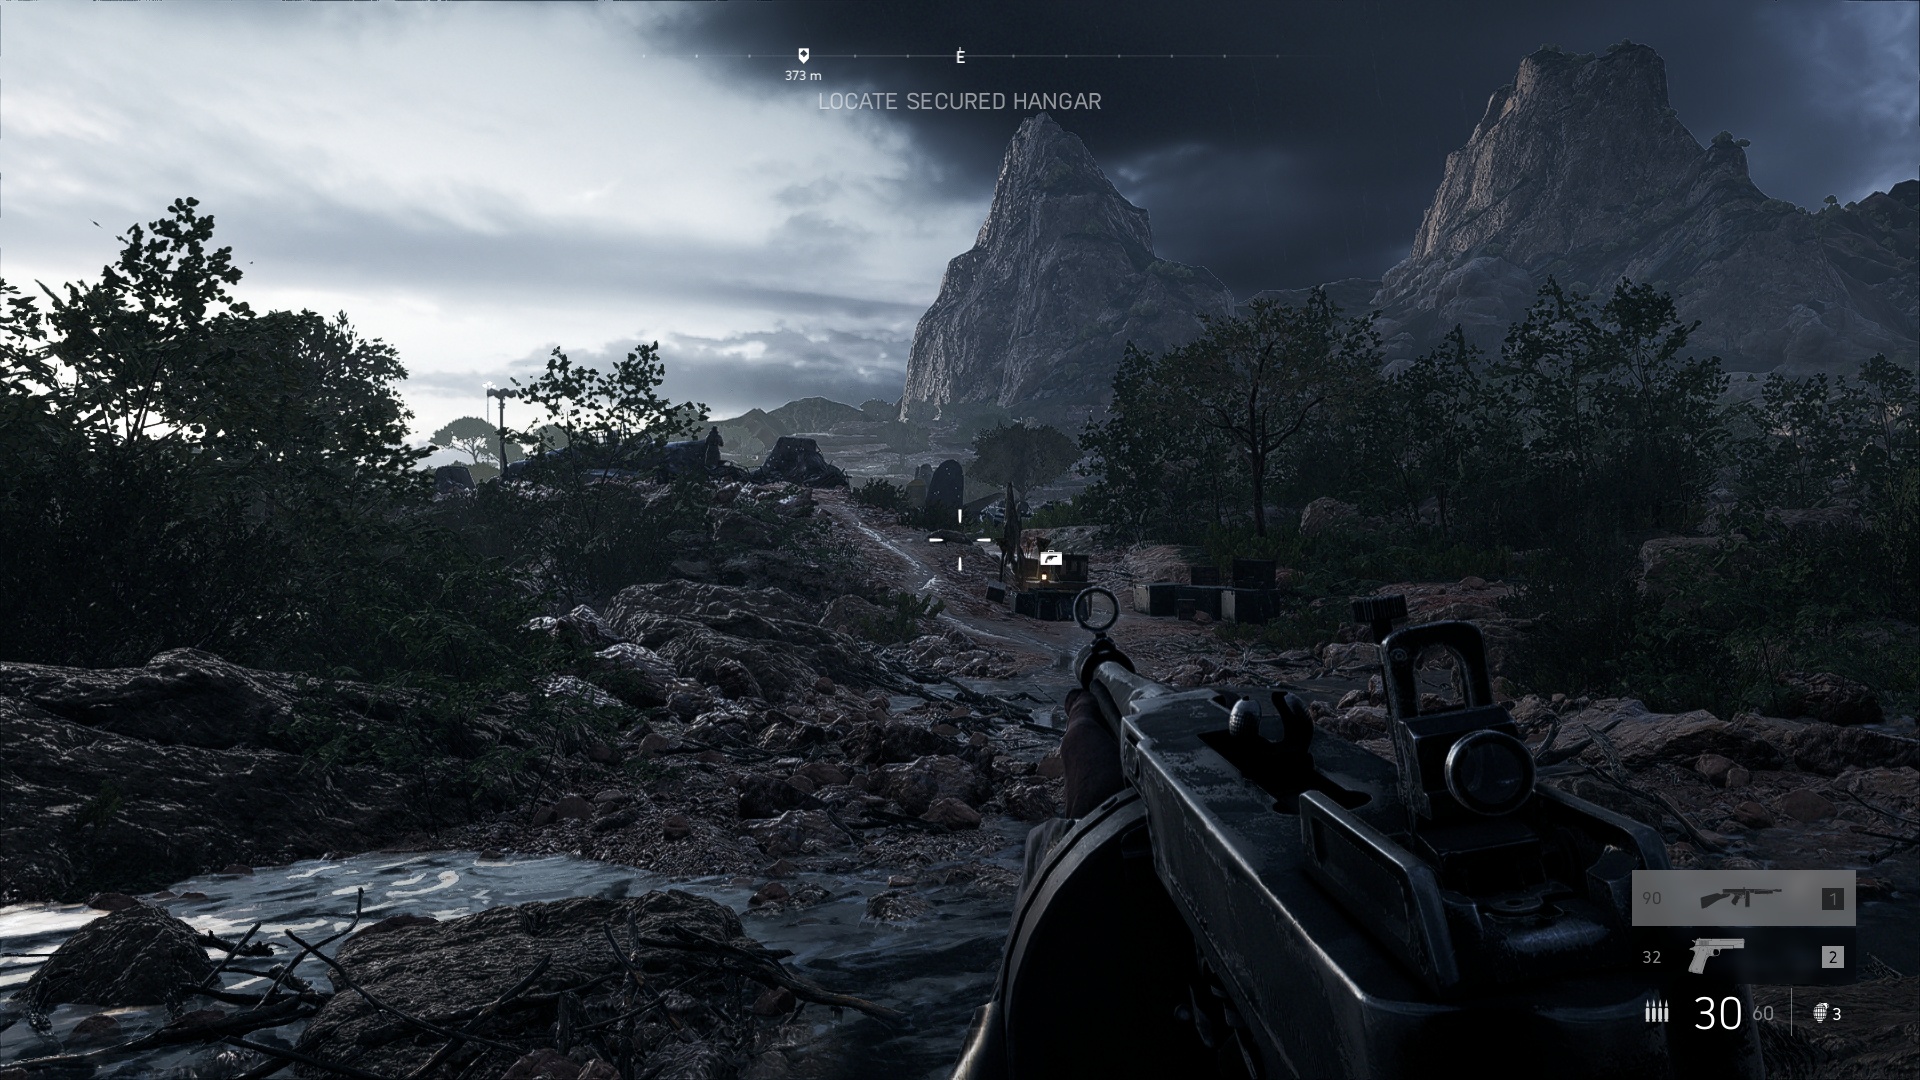
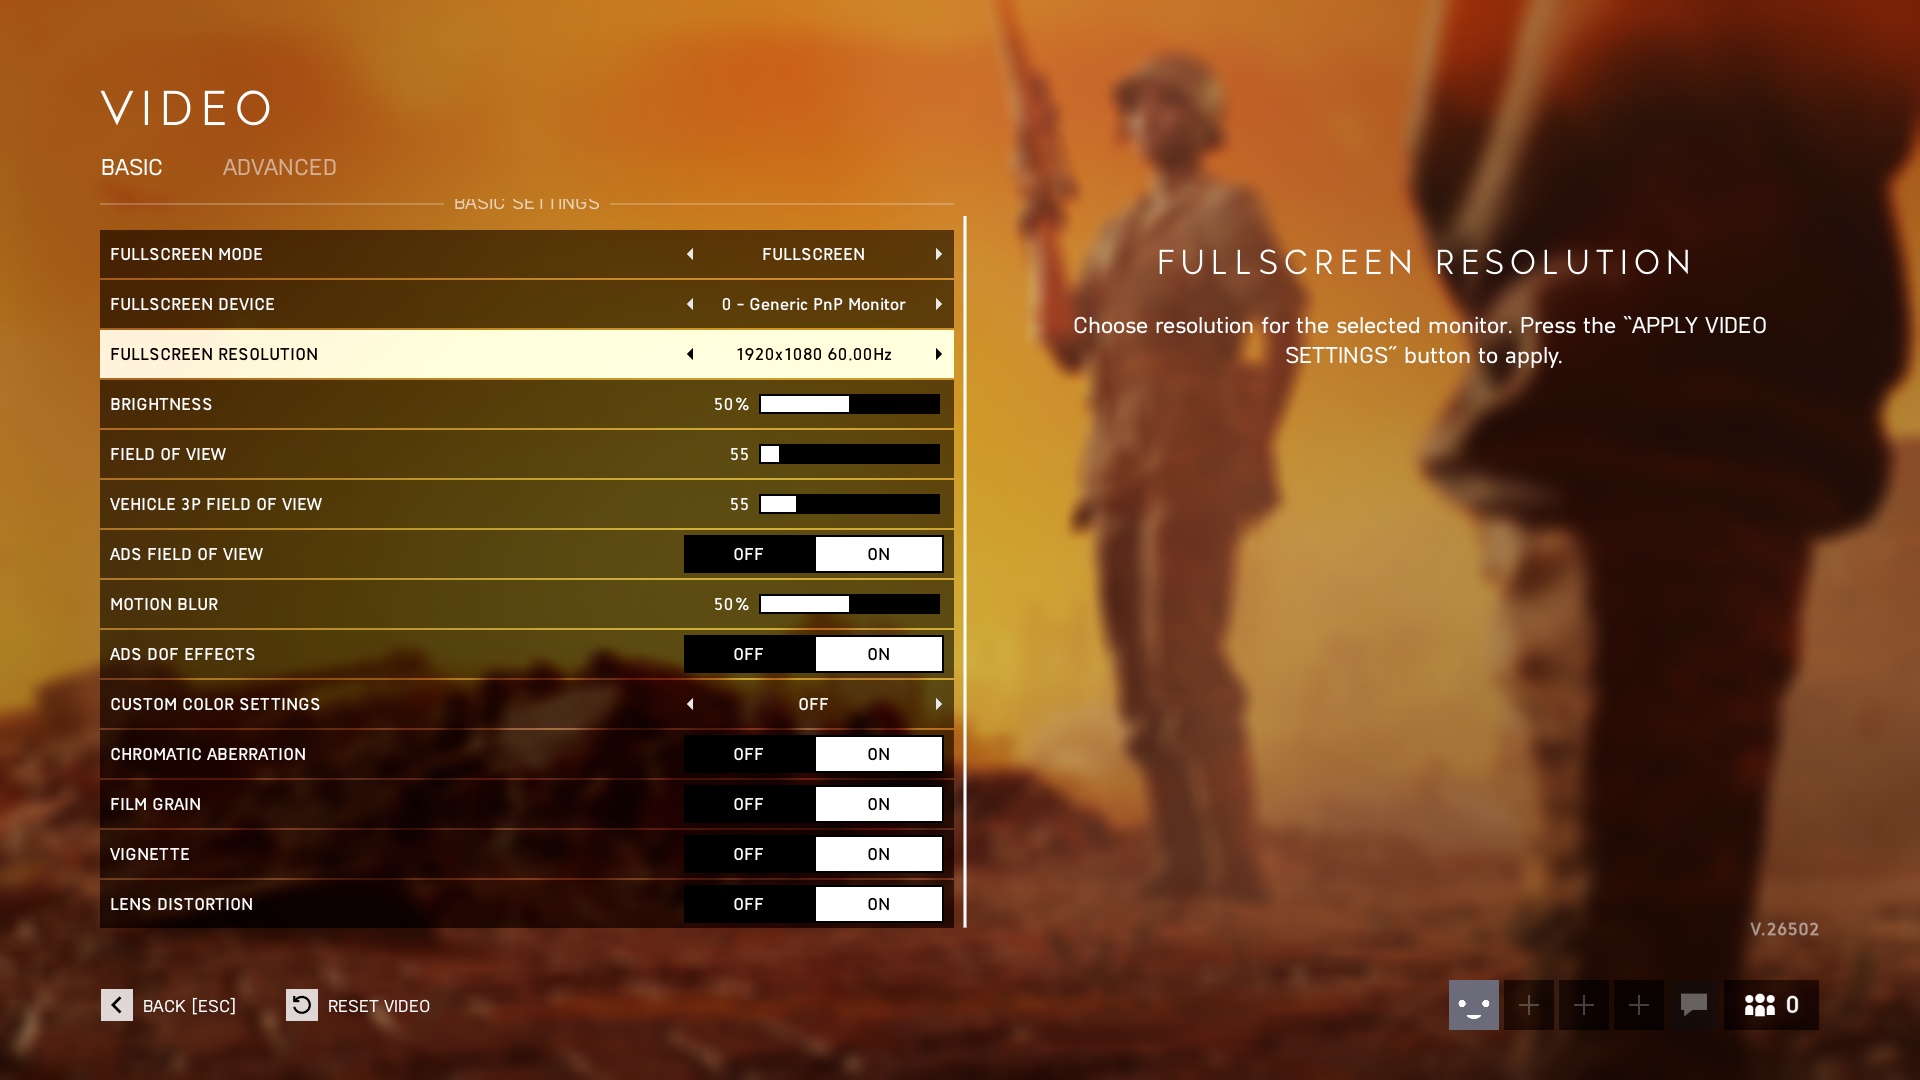
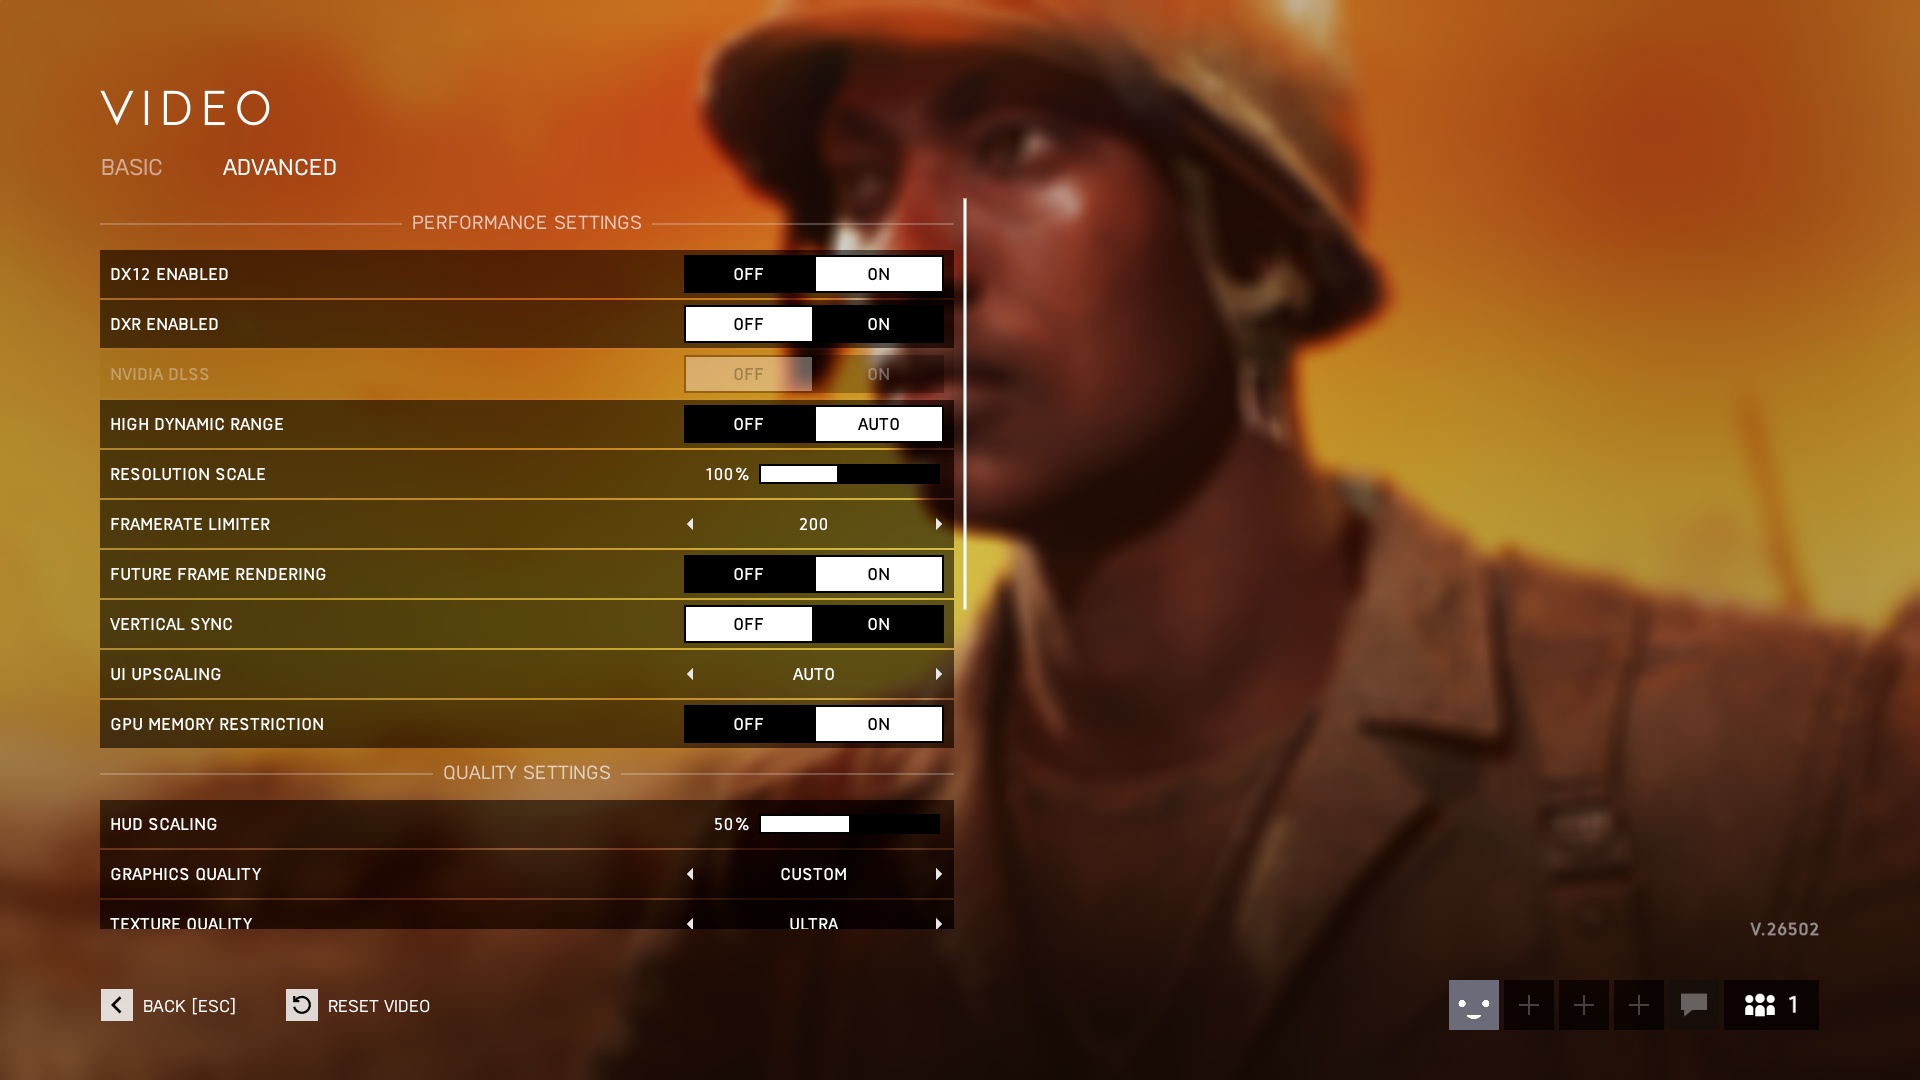
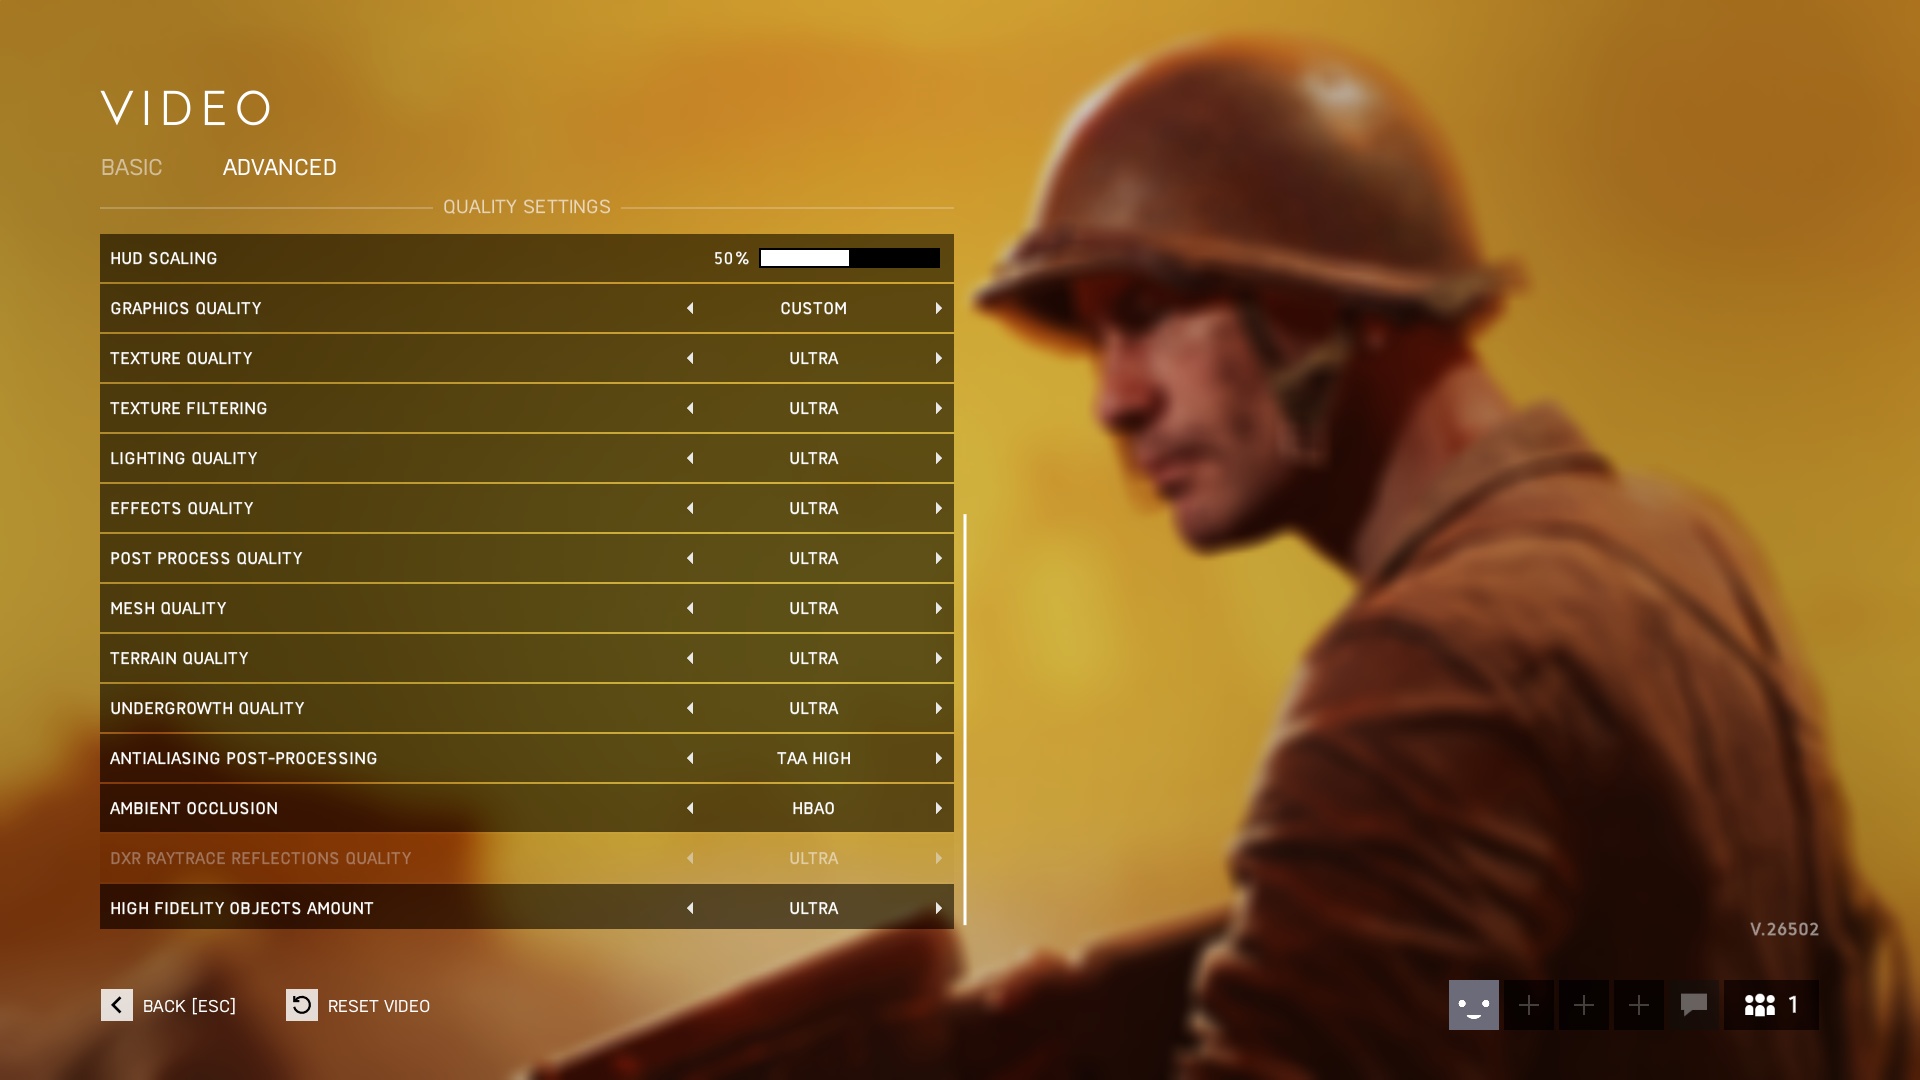
Battlefield V
Test platform custom scene (War stories/Under no flag); API DirectX 12, graphics settings preset Ultra; TAA high; no extra settings.
After the GeForce RTX 4080 graphics cards, which wasn’t to many people’s taste due to the higher price, Nvidia has released a significantly cheaper GPU for the GeForce RTX 4070 Ti. The performance versus the RTX 4080 is admittedly noticeably weaker, but percentage-wise not by as much as the roughly two-thirds lower price of the RTX 4070 Ti. In our tests, we analyze MSI’s non-reference design from the top-of-the-line Suprim X series.
Battlefield V with DXR
Test platform custom scene (War stories/Under no flag); API DirectX 12, graphics settings preset Ultra; TAA high; extra settings DXR.

The game also supports DLSS, but as it’s an older title and there are many tests, we will not address it in standard tests. However, measurements on request are possible if you ask for it.
After the GeForce RTX 4080 graphics cards, which wasn’t to many people’s taste due to the higher price, Nvidia has released a significantly cheaper GPU for the GeForce RTX 4070 Ti. The performance versus the RTX 4080 is admittedly noticeably weaker, but percentage-wise not by as much as the roughly two-thirds lower price of the RTX 4070 Ti. In our tests, we analyze MSI’s non-reference design from the top-of-the-line Suprim X series.
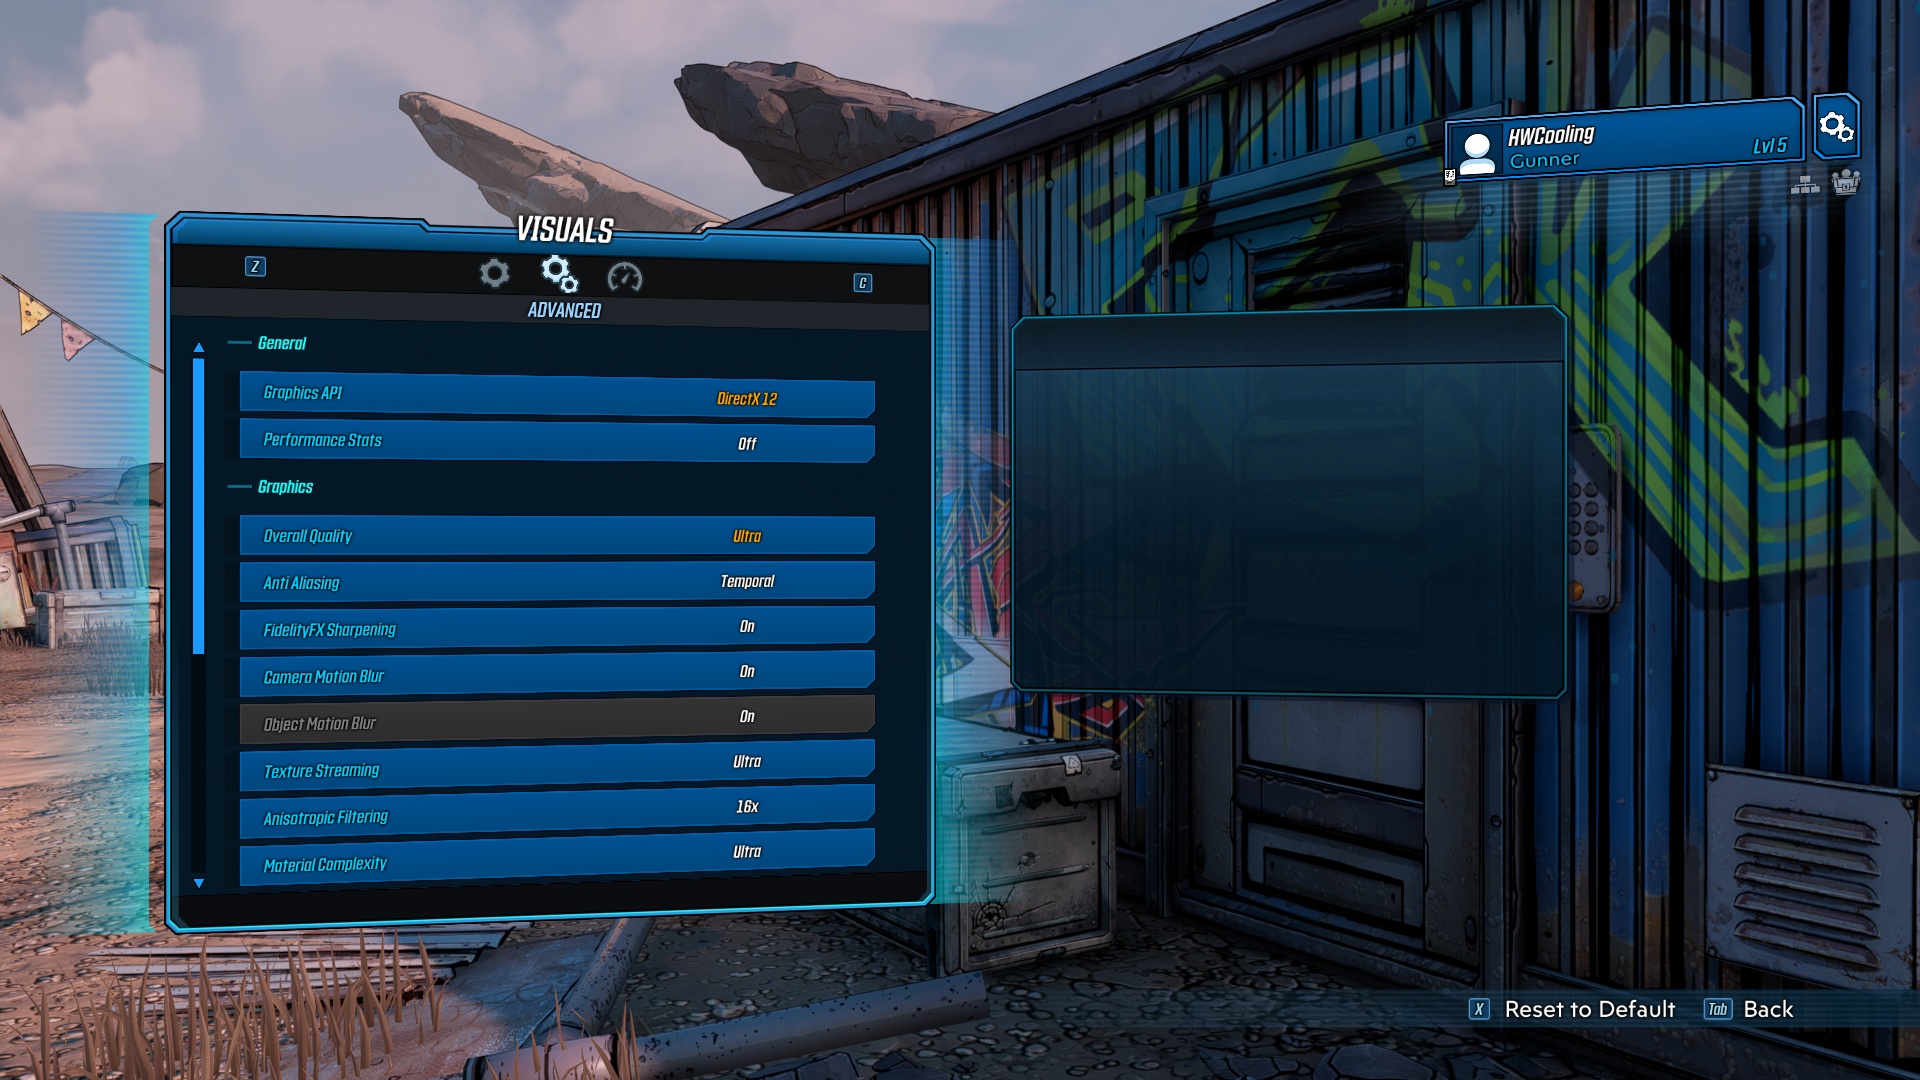
Borderlands 3
Test platform benchmark; API DirectX 12, graphics settings preset Ultra; TAA; no extra settings.


After the GeForce RTX 4080 graphics cards, which wasn’t to many people’s taste due to the higher price, Nvidia has released a significantly cheaper GPU for the GeForce RTX 4070 Ti. The performance versus the RTX 4080 is admittedly noticeably weaker, but percentage-wise not by as much as the roughly two-thirds lower price of the RTX 4070 Ti. In our tests, we analyze MSI’s non-reference design from the top-of-the-line Suprim X series.
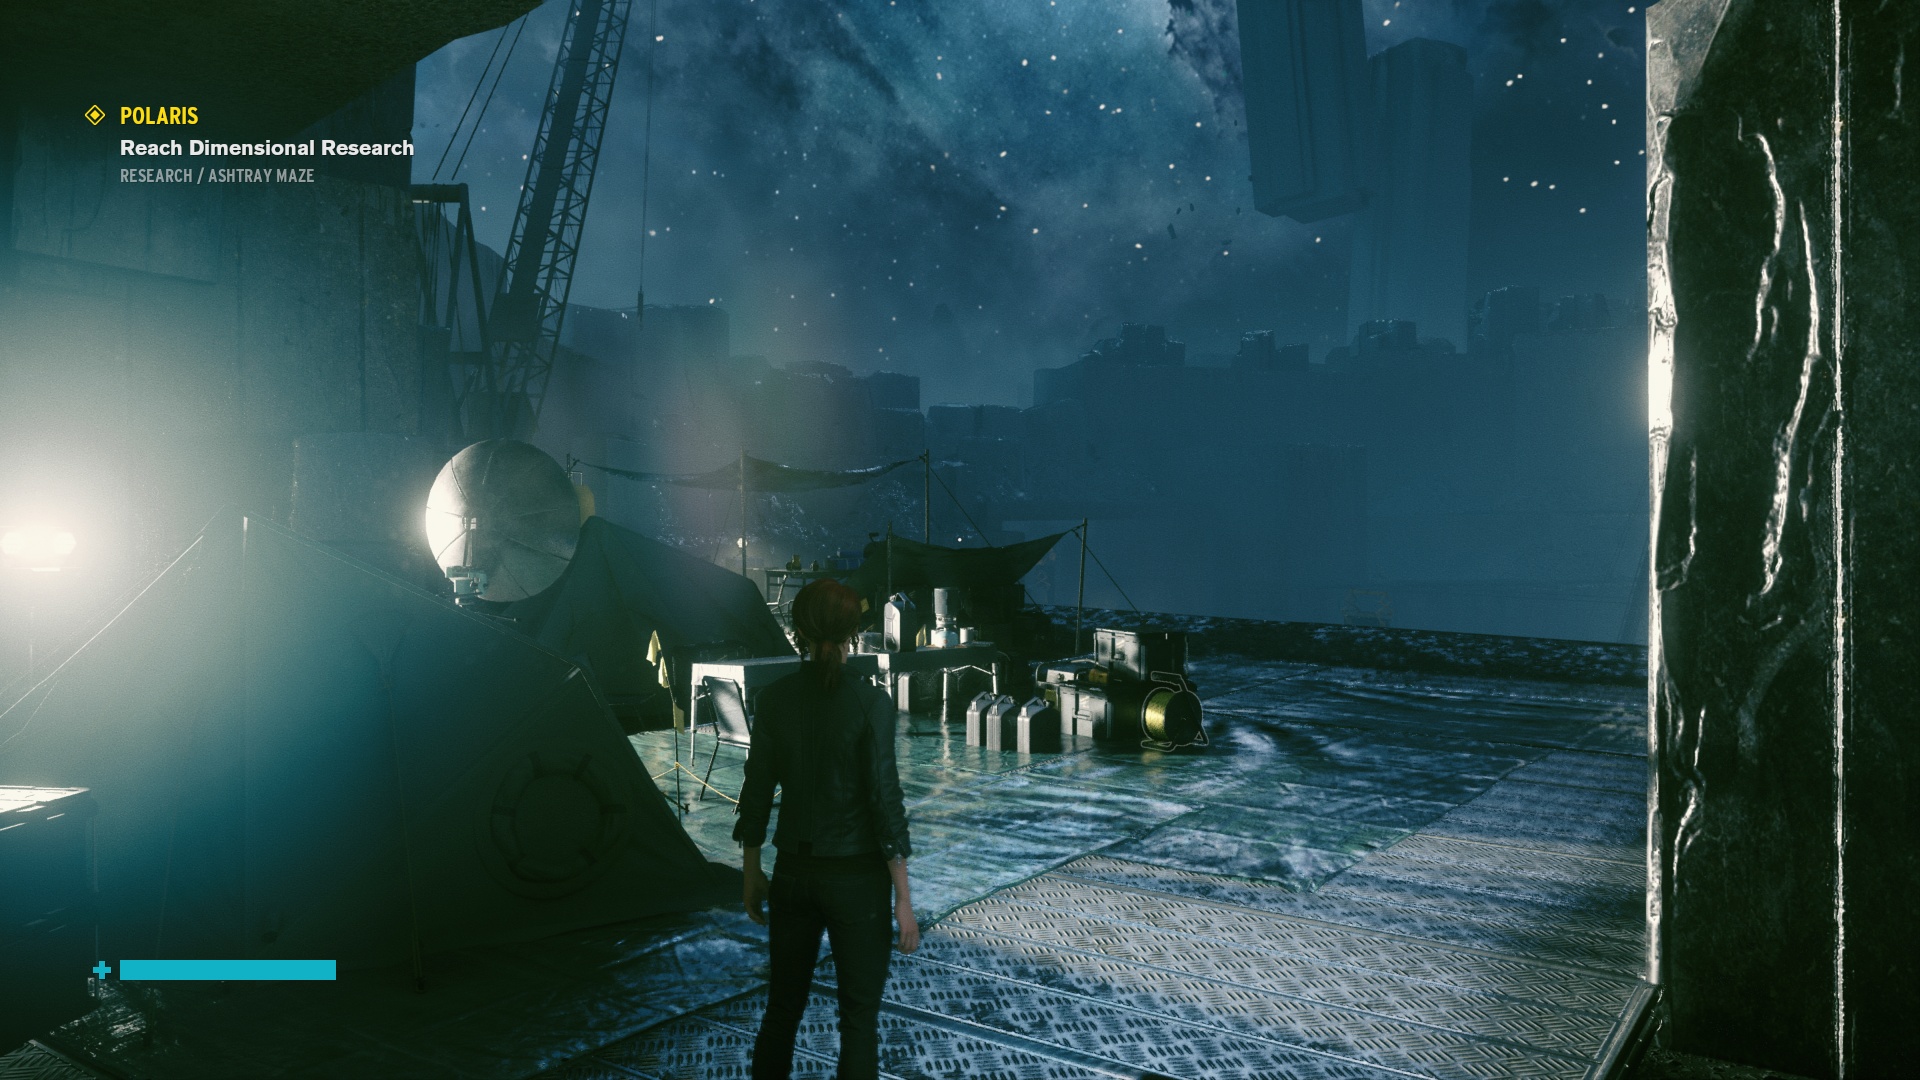
Control
Test platform custom scene (chapter Polaris); API DirectX 11, graphics settings preset High; no extra settings.
After the GeForce RTX 4080 graphics cards, which wasn’t to many people’s taste due to the higher price, Nvidia has released a significantly cheaper GPU for the GeForce RTX 4070 Ti. The performance versus the RTX 4080 is admittedly noticeably weaker, but percentage-wise not by as much as the roughly two-thirds lower price of the RTX 4070 Ti. In our tests, we analyze MSI’s non-reference design from the top-of-the-line Suprim X series.
Control with DXR and DLSS
Test platform custom scene (chapter Polaris); API DirectX 12, graphics settings preset High; extra settings DXR.

DXR (native)
DXR with DLSS (performance)

After the GeForce RTX 4080 graphics cards, which wasn’t to many people’s taste due to the higher price, Nvidia has released a significantly cheaper GPU for the GeForce RTX 4070 Ti. The performance versus the RTX 4080 is admittedly noticeably weaker, but percentage-wise not by as much as the roughly two-thirds lower price of the RTX 4070 Ti. In our tests, we analyze MSI’s non-reference design from the top-of-the-line Suprim X series.
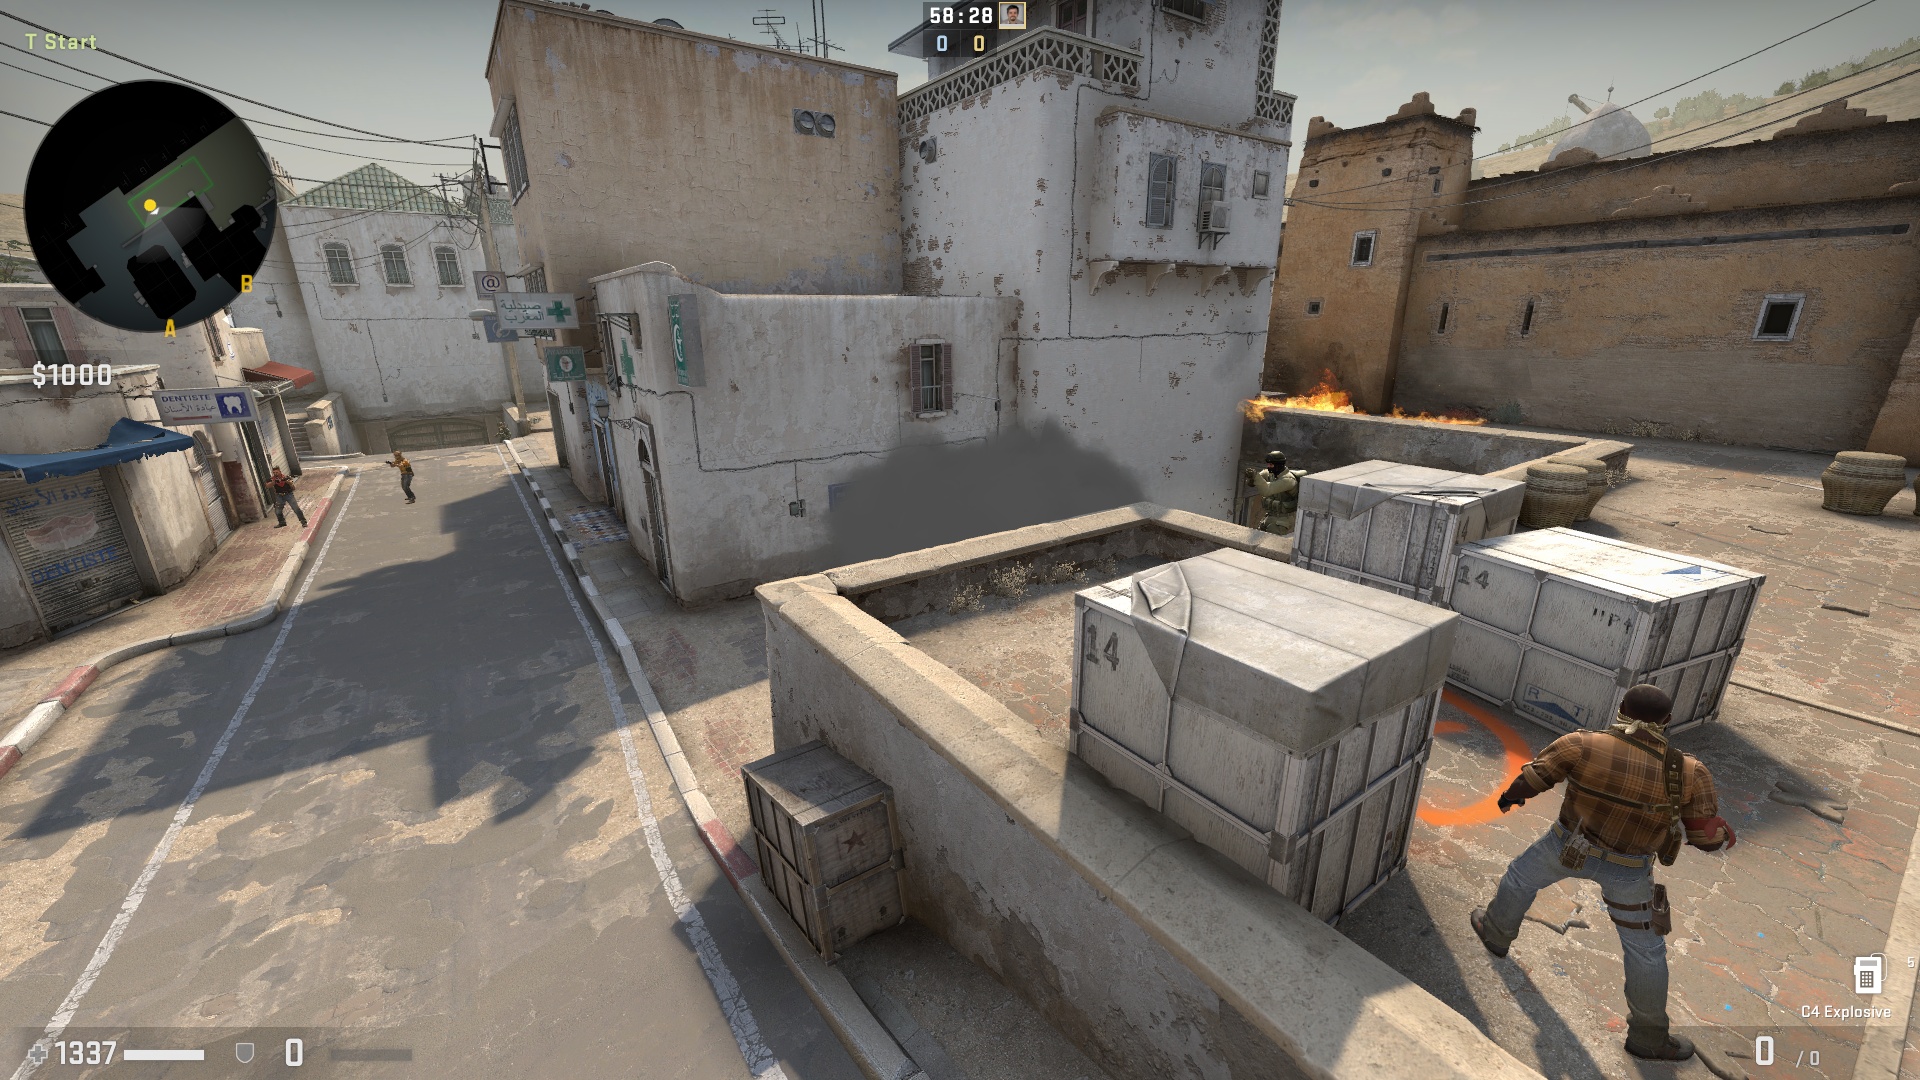
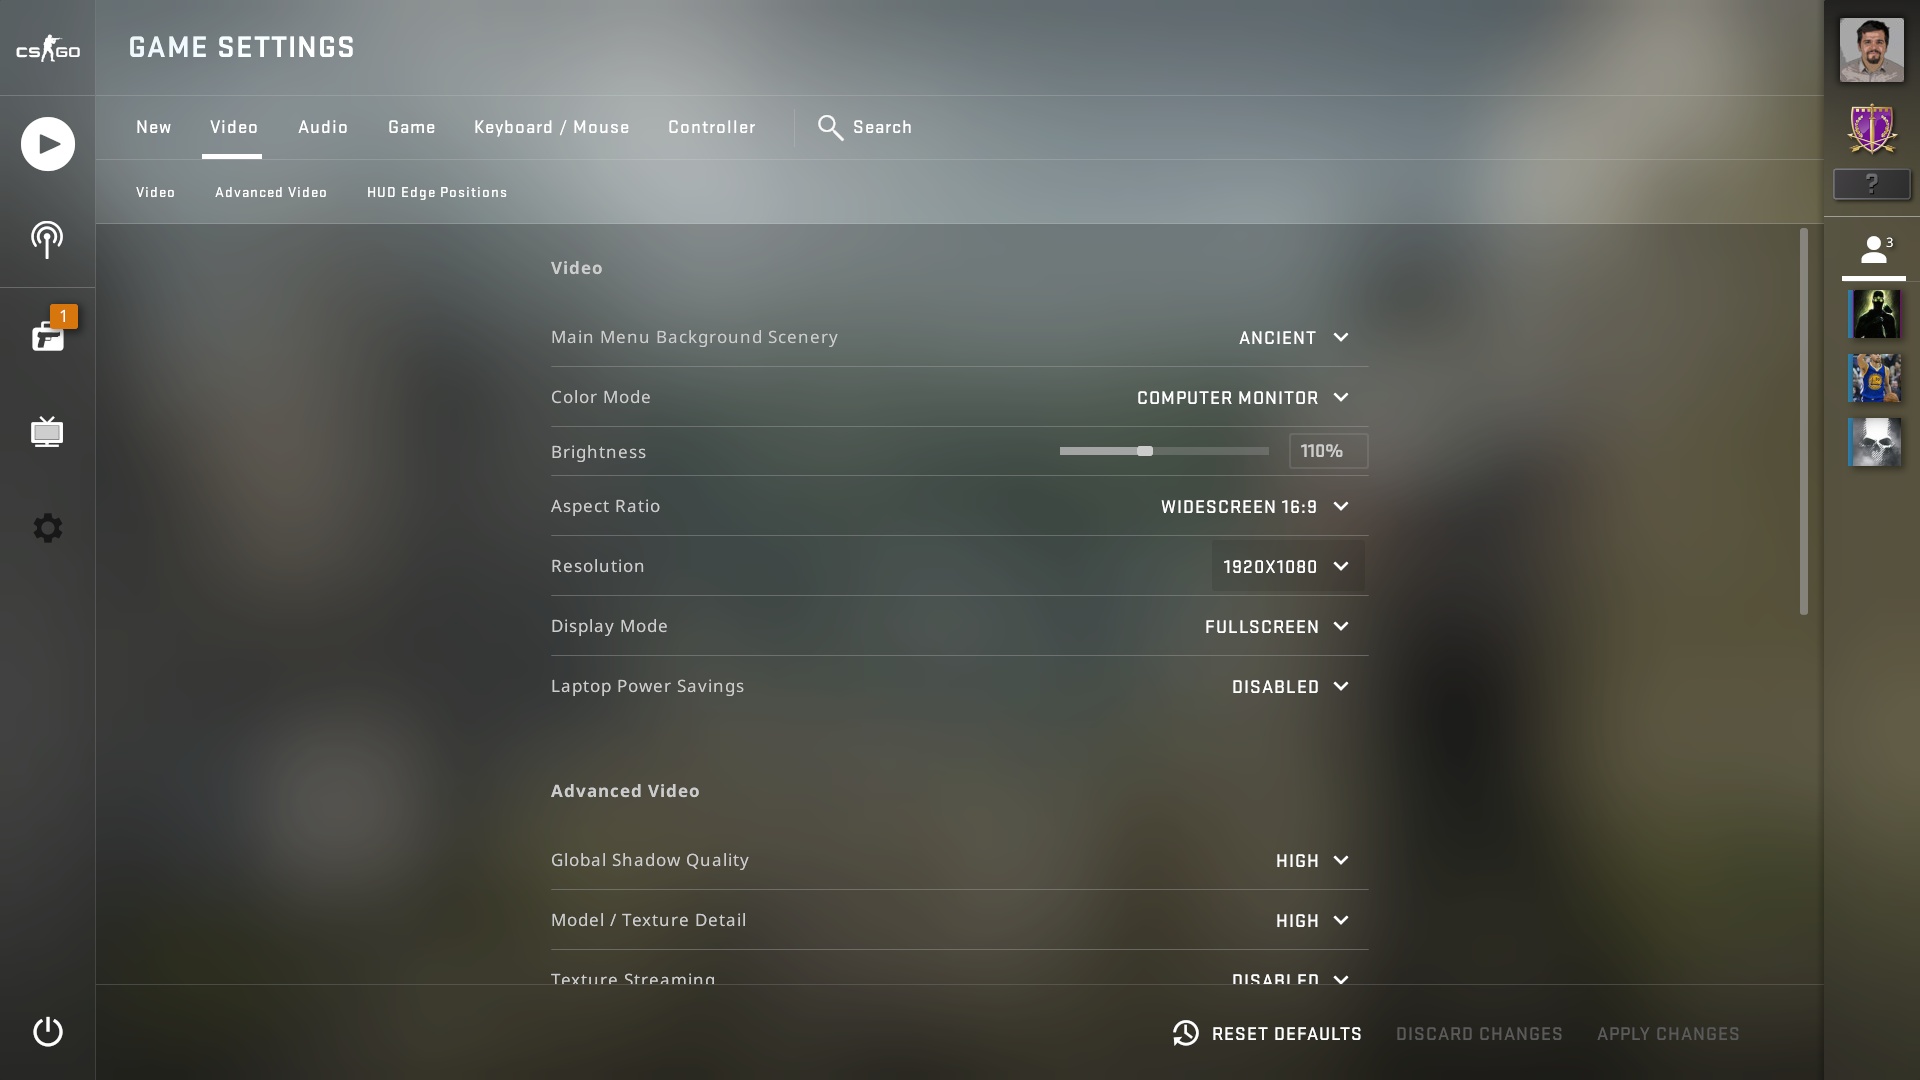
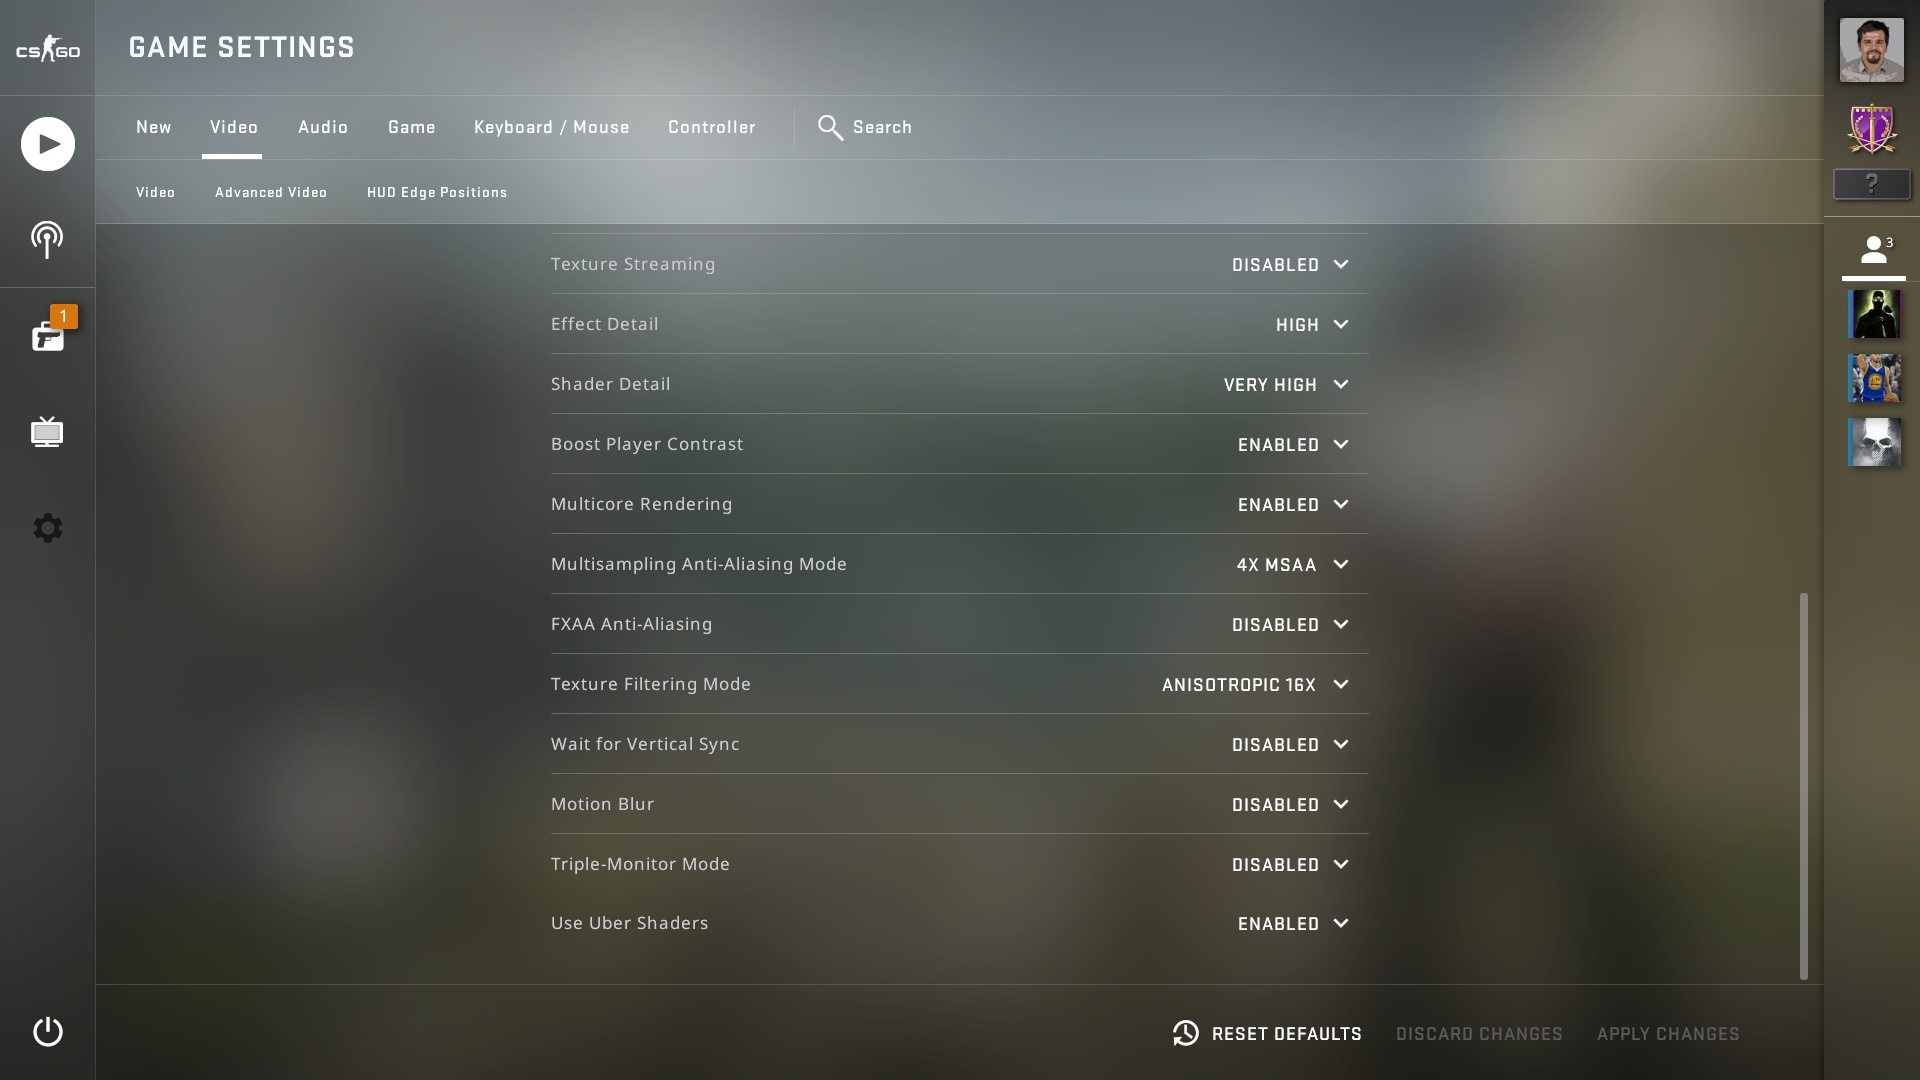
Counter-Strike: GO
Test platform benchmark (Dust 2 map tour); API DirectX 9, graphics settings preset High; 4× MSAA; no extra settings.
After the GeForce RTX 4080 graphics cards, which wasn’t to many people’s taste due to the higher price, Nvidia has released a significantly cheaper GPU for the GeForce RTX 4070 Ti. The performance versus the RTX 4080 is admittedly noticeably weaker, but percentage-wise not by as much as the roughly two-thirds lower price of the RTX 4070 Ti. In our tests, we analyze MSI’s non-reference design from the top-of-the-line Suprim X series.
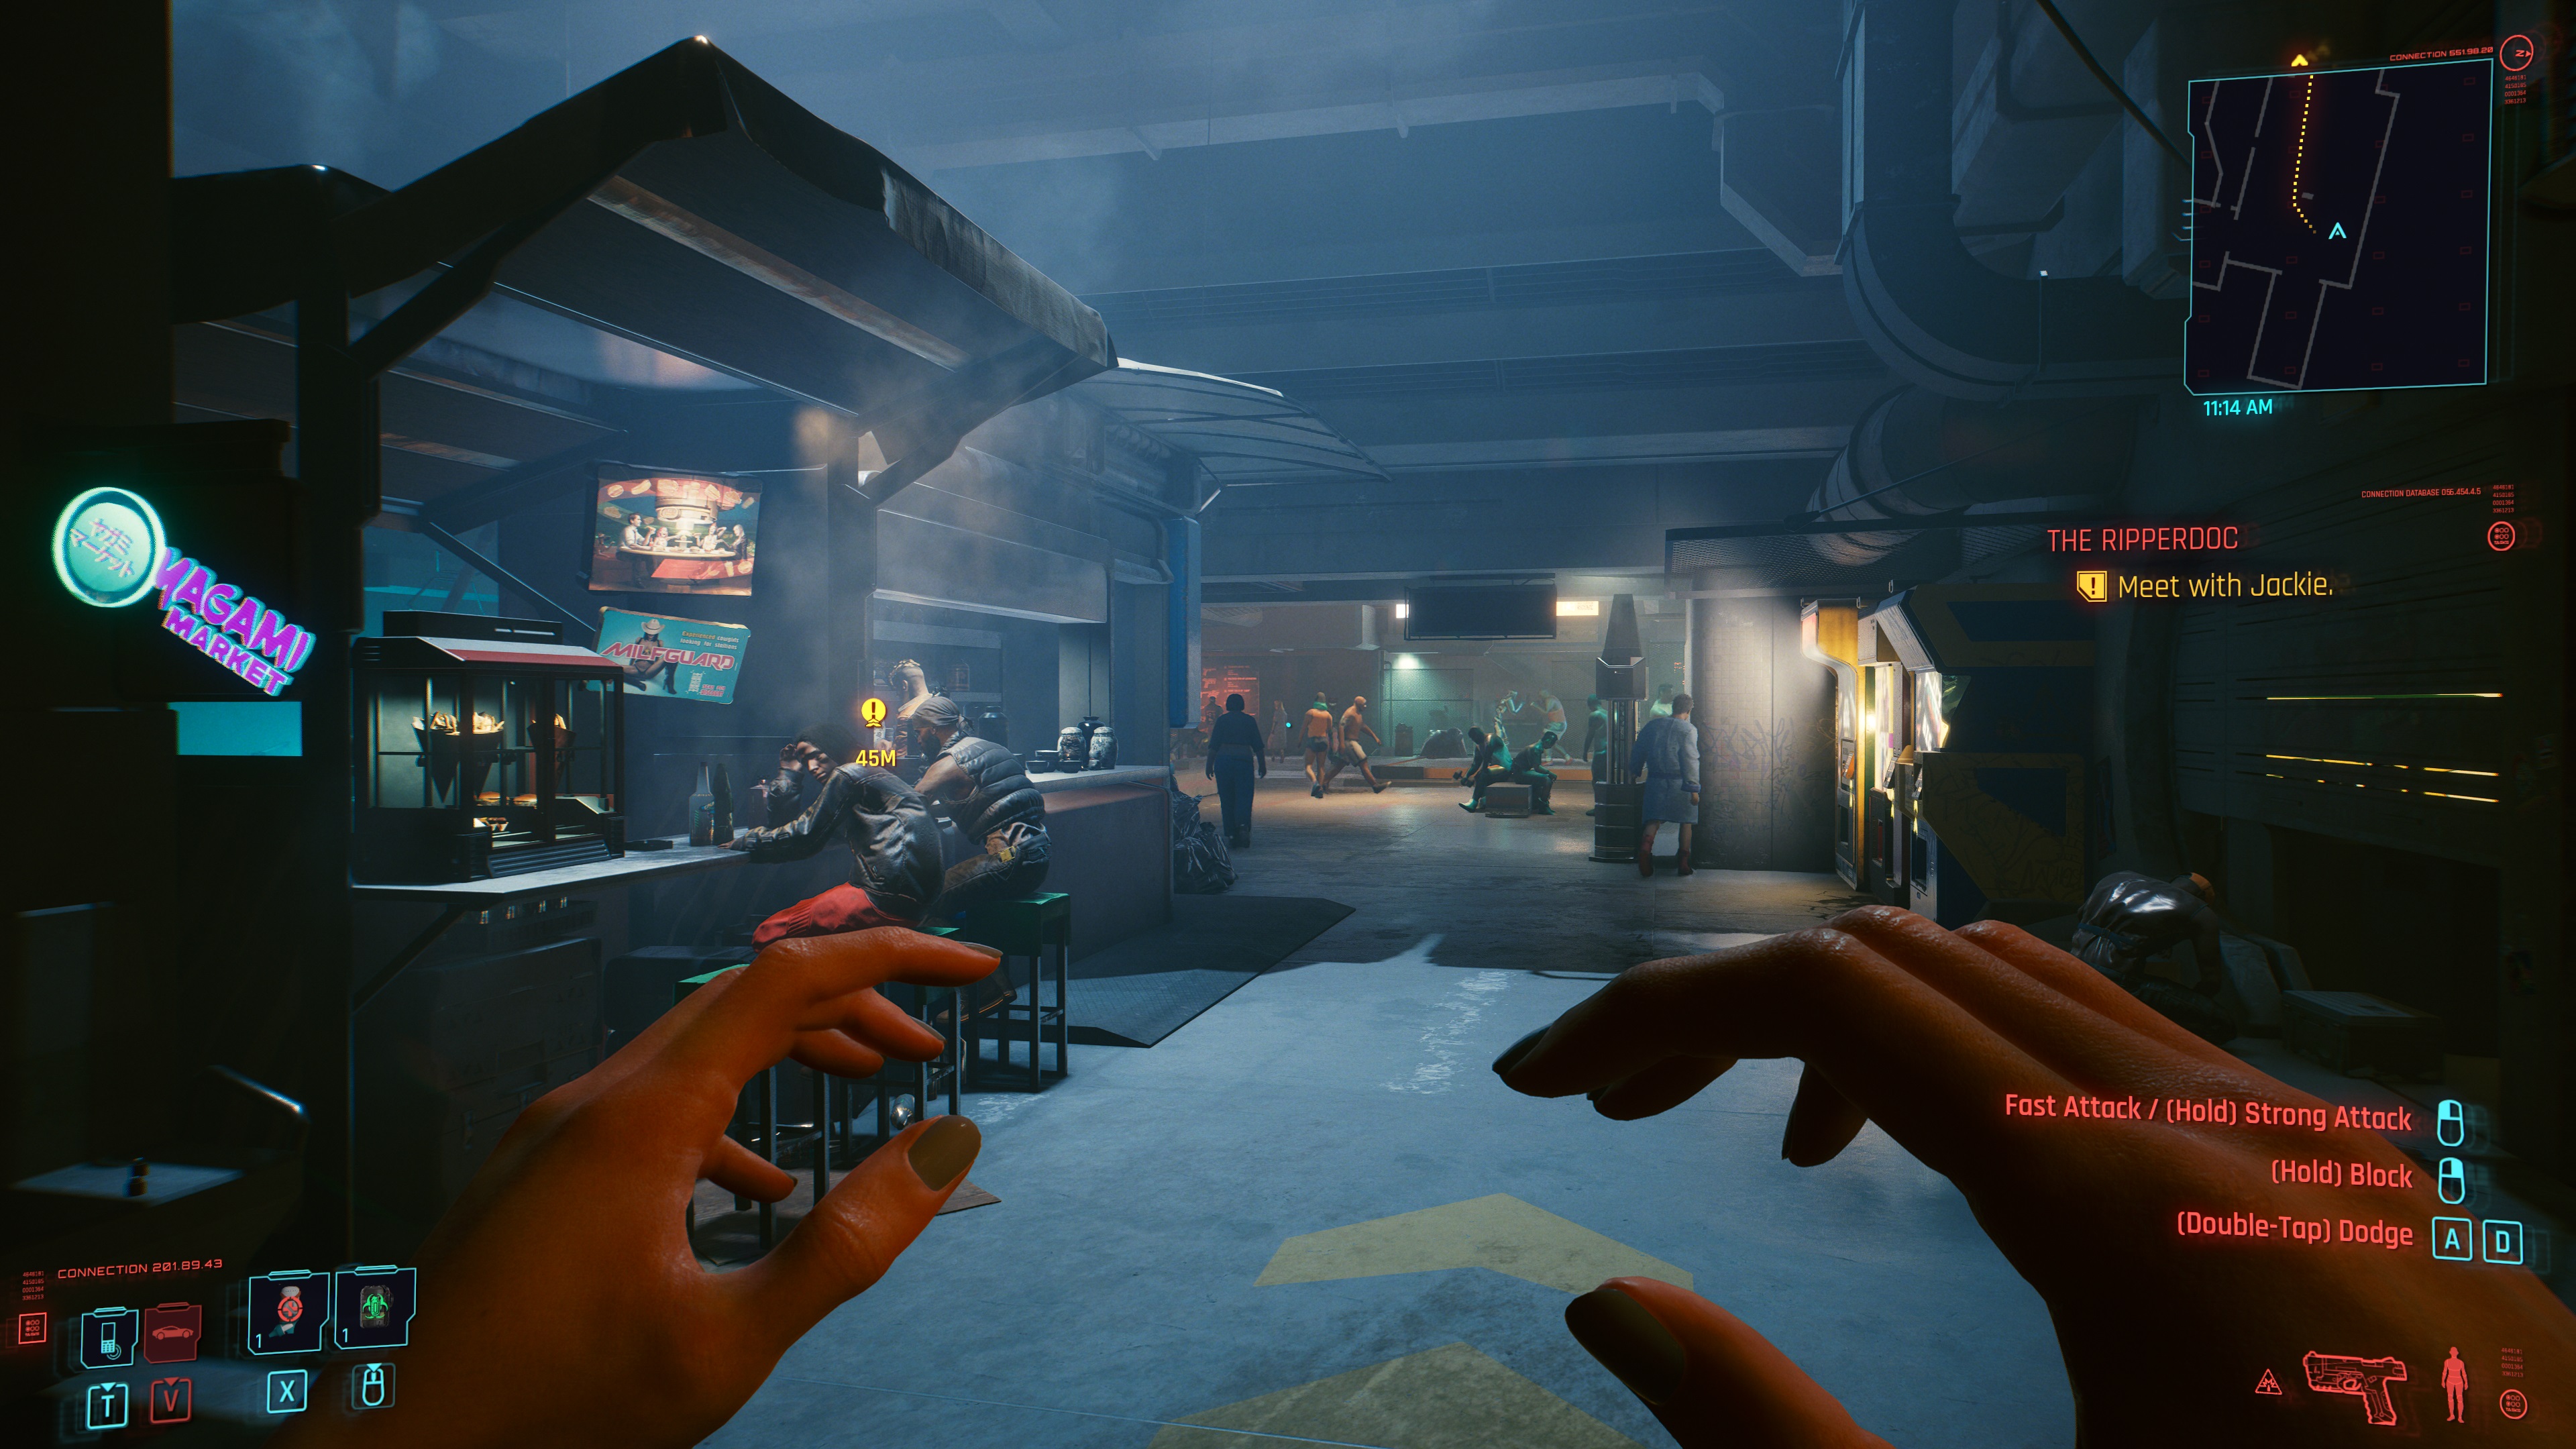
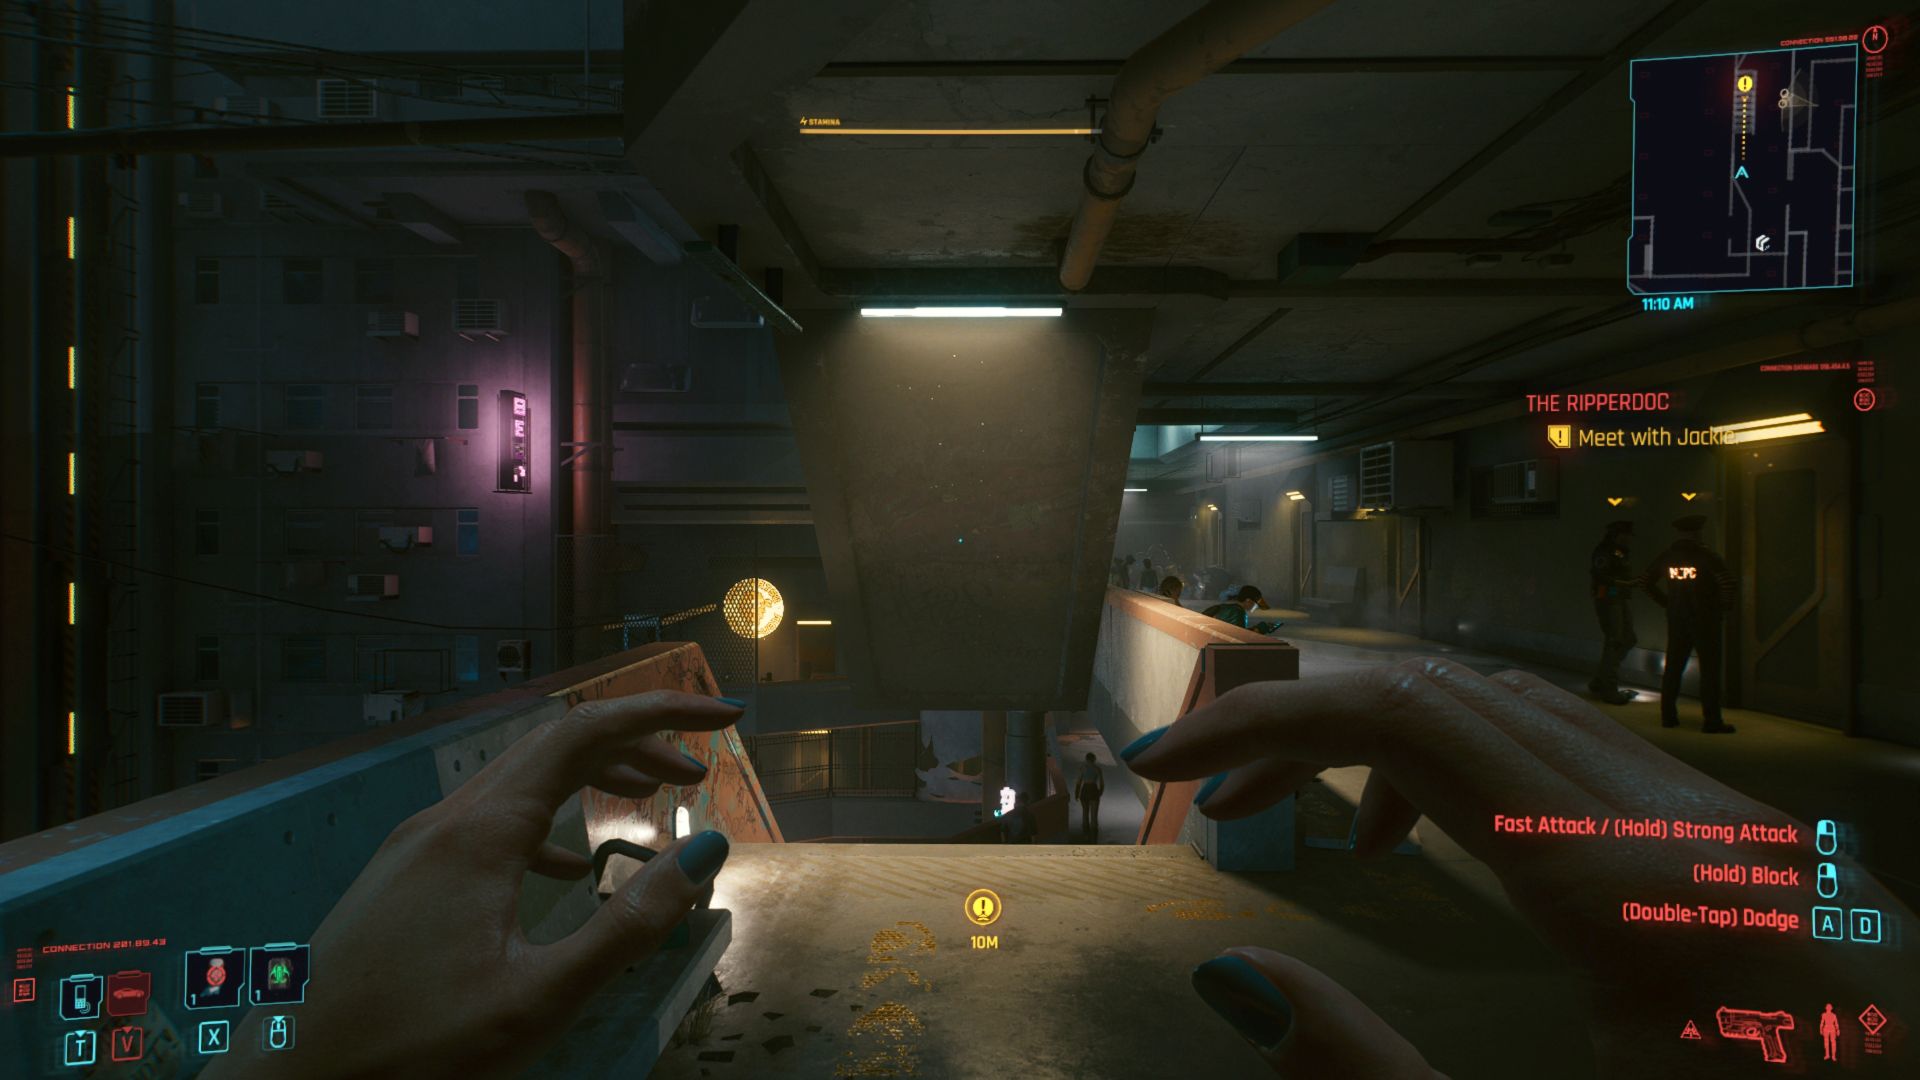
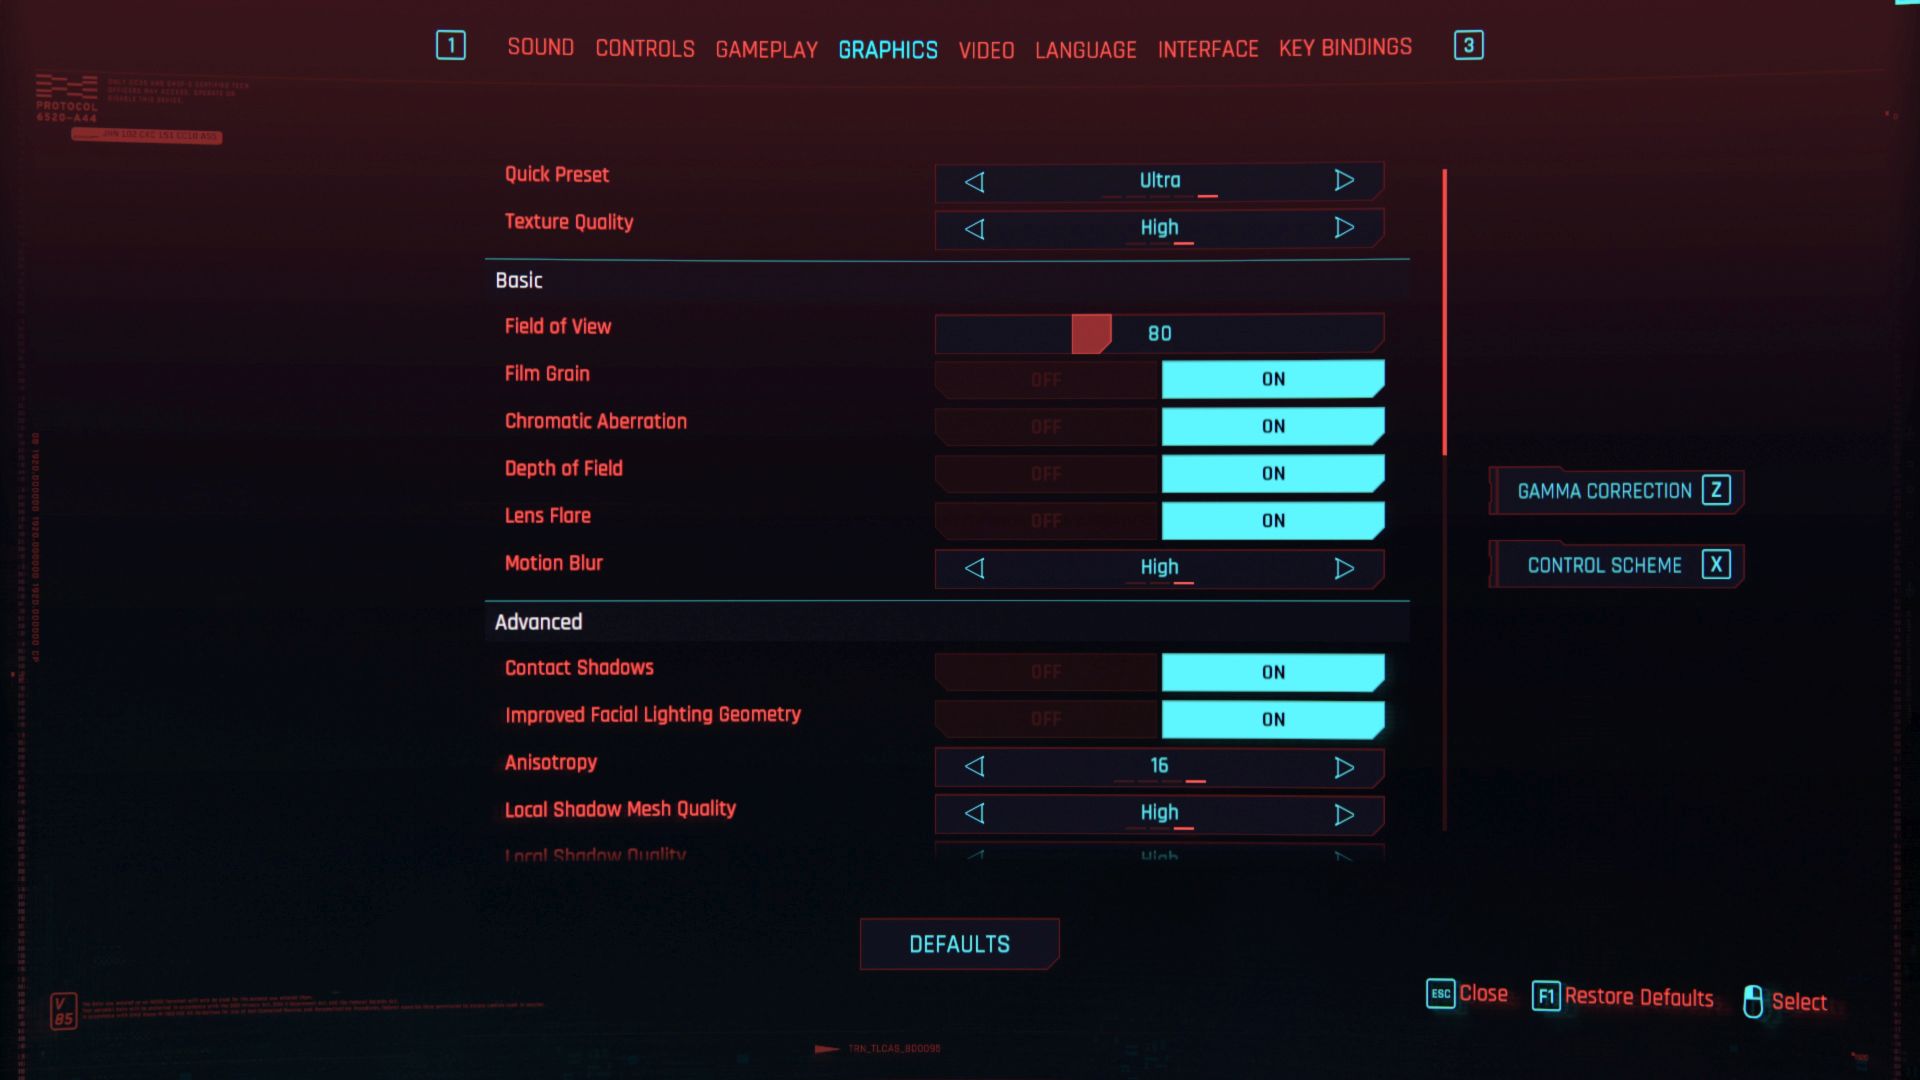
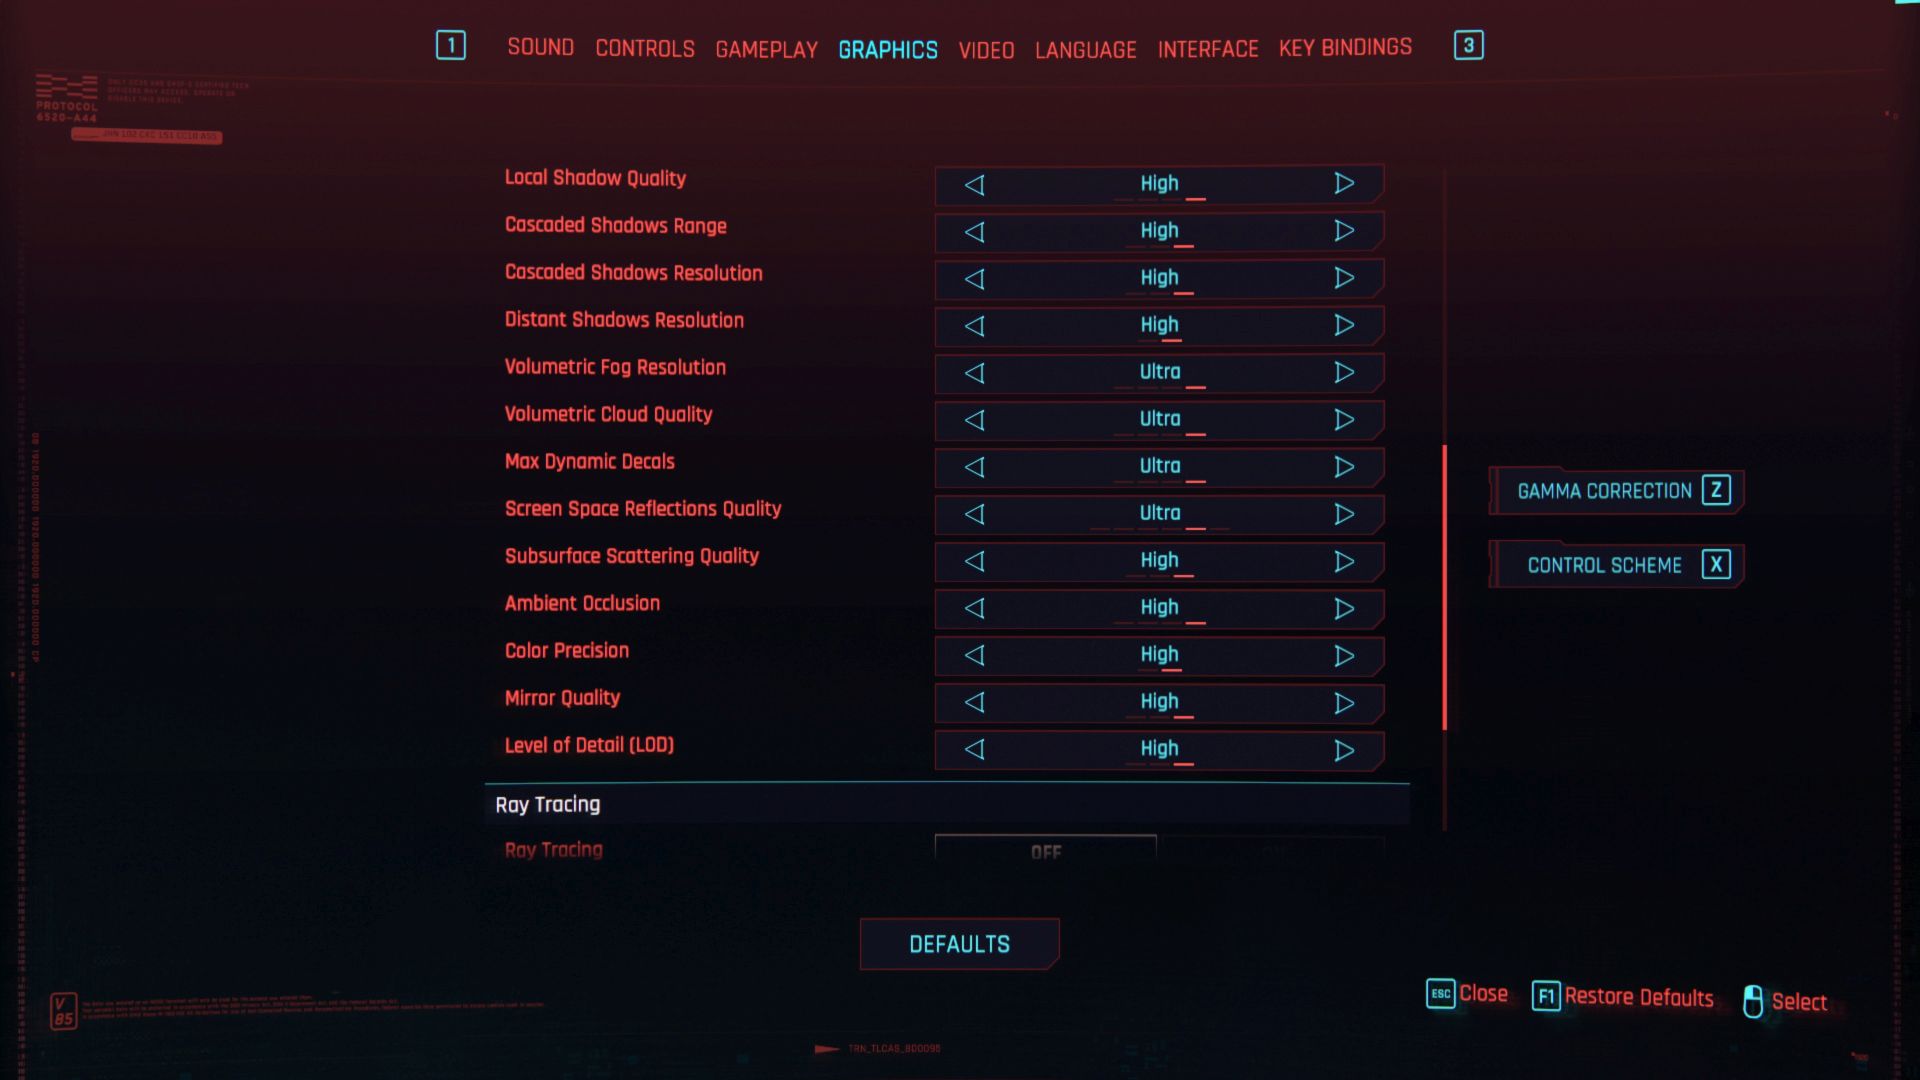
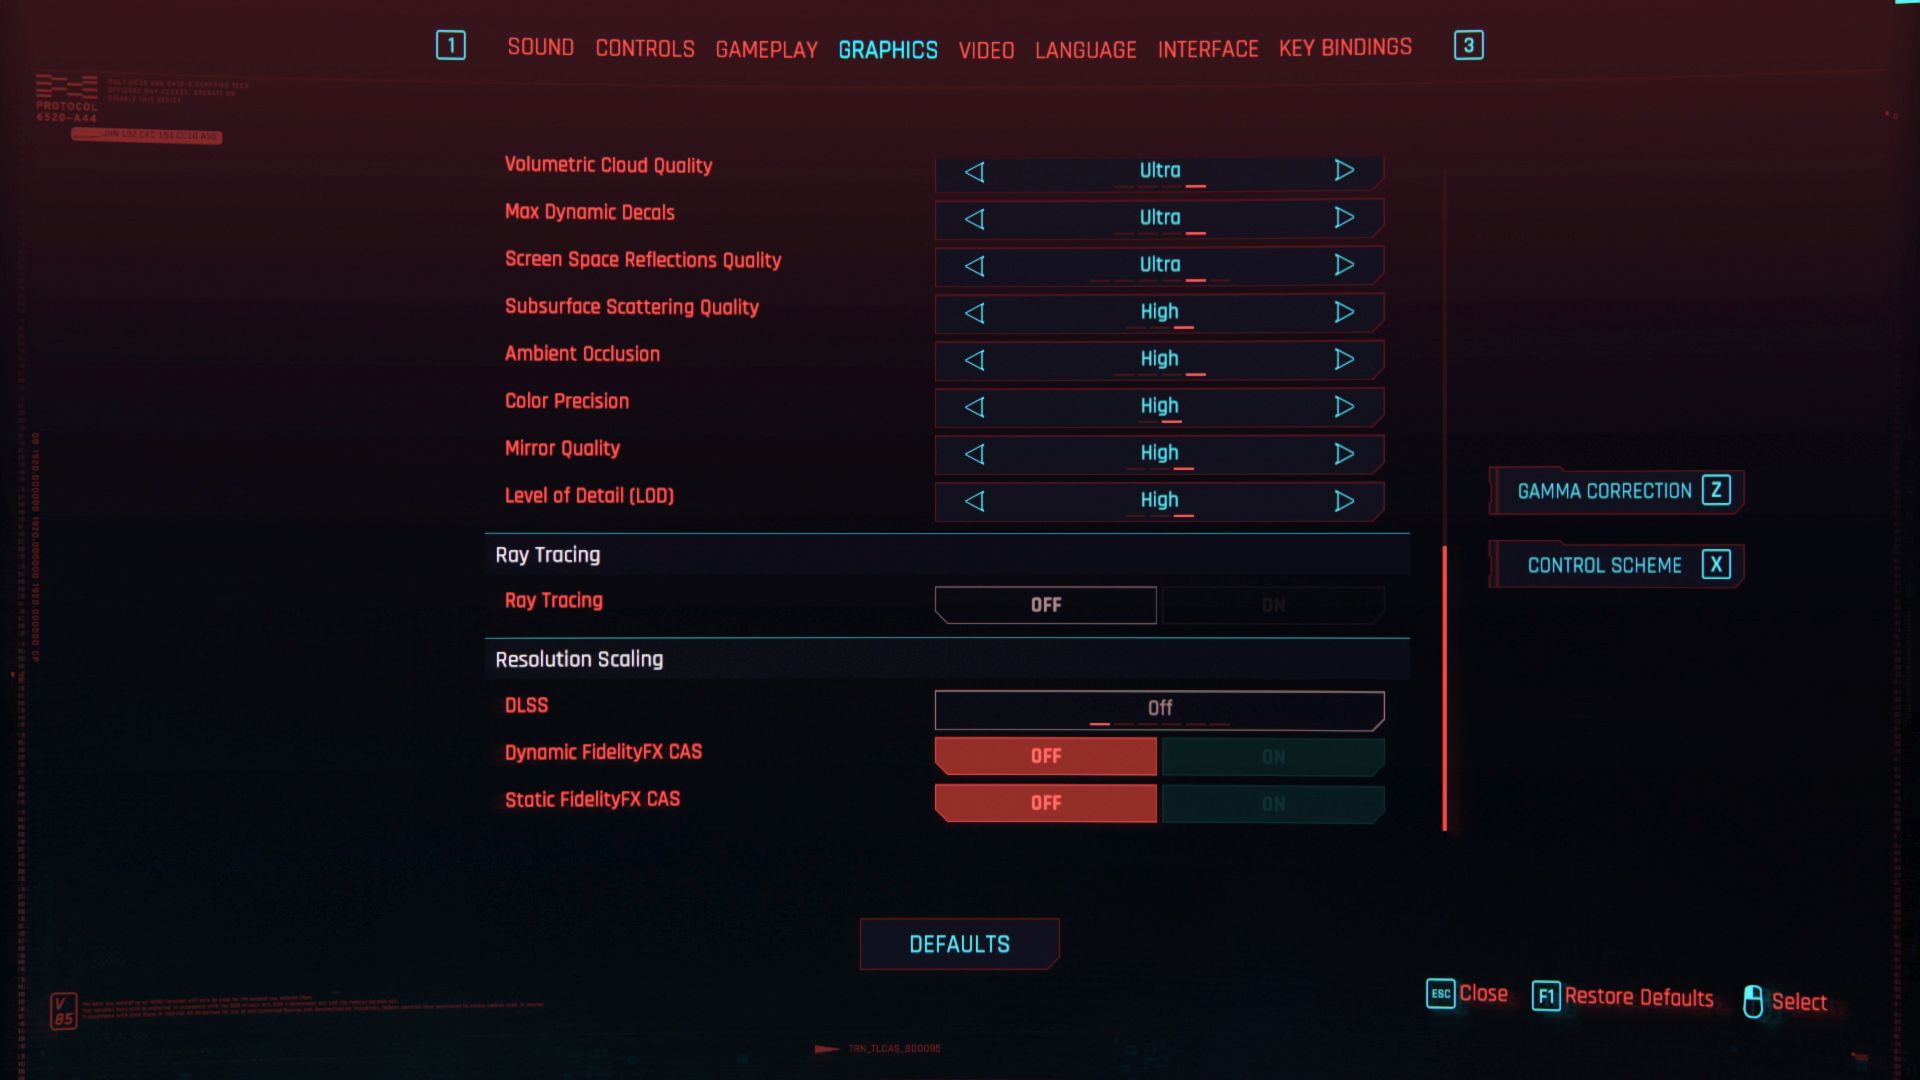
Cyberpunk 2077
Test platform custom scene (Little China); API DirectX 12, graphics settings preset Ultra; no extra settings.
After the GeForce RTX 4080 graphics cards, which wasn’t to many people’s taste due to the higher price, Nvidia has released a significantly cheaper GPU for the GeForce RTX 4070 Ti. The performance versus the RTX 4080 is admittedly noticeably weaker, but percentage-wise not by as much as the roughly two-thirds lower price of the RTX 4070 Ti. In our tests, we analyze MSI’s non-reference design from the top-of-the-line Suprim X series.
Cyberpunk 2077 with DLSS
Testo platform custom scene (Little China); API DirectX 12, graphics settings preset Ultra; extra settings DLSS (performance).
DLSS (performance)

After the GeForce RTX 4080 graphics cards, which wasn’t to many people’s taste due to the higher price, Nvidia has released a significantly cheaper GPU for the GeForce RTX 4070 Ti. The performance versus the RTX 4080 is admittedly noticeably weaker, but percentage-wise not by as much as the roughly two-thirds lower price of the RTX 4070 Ti. In our tests, we analyze MSI’s non-reference design from the top-of-the-line Suprim X series.
Cyberpunk 2077 with DXR
Test platform custom scene (Little China); API DirectX 12, graphics settings preset Ultra; extra settings Ray Tracing on (Ultra).
DXR

DXR with DLSS (performance)
After the GeForce RTX 4080 graphics cards, which wasn’t to many people’s taste due to the higher price, Nvidia has released a significantly cheaper GPU for the GeForce RTX 4070 Ti. The performance versus the RTX 4080 is admittedly noticeably weaker, but percentage-wise not by as much as the roughly two-thirds lower price of the RTX 4070 Ti. In our tests, we analyze MSI’s non-reference design from the top-of-the-line Suprim X series.
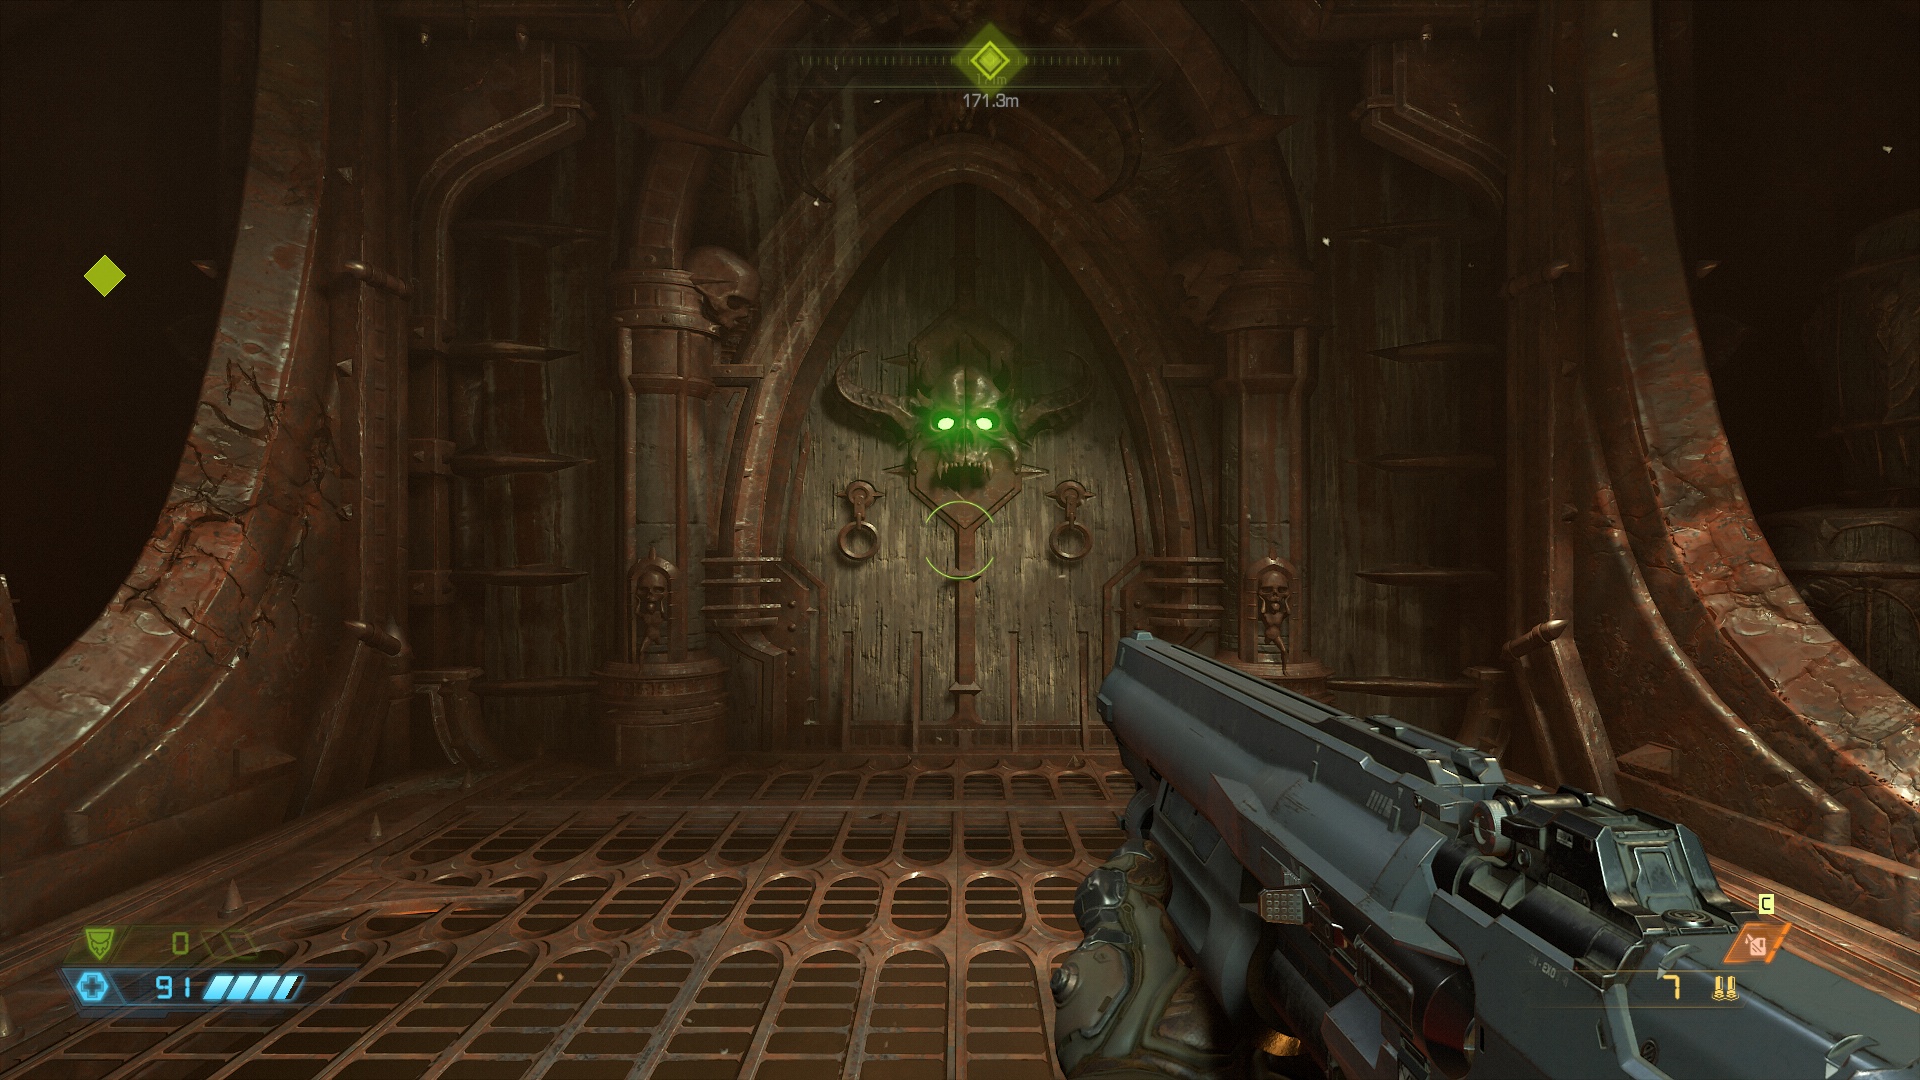
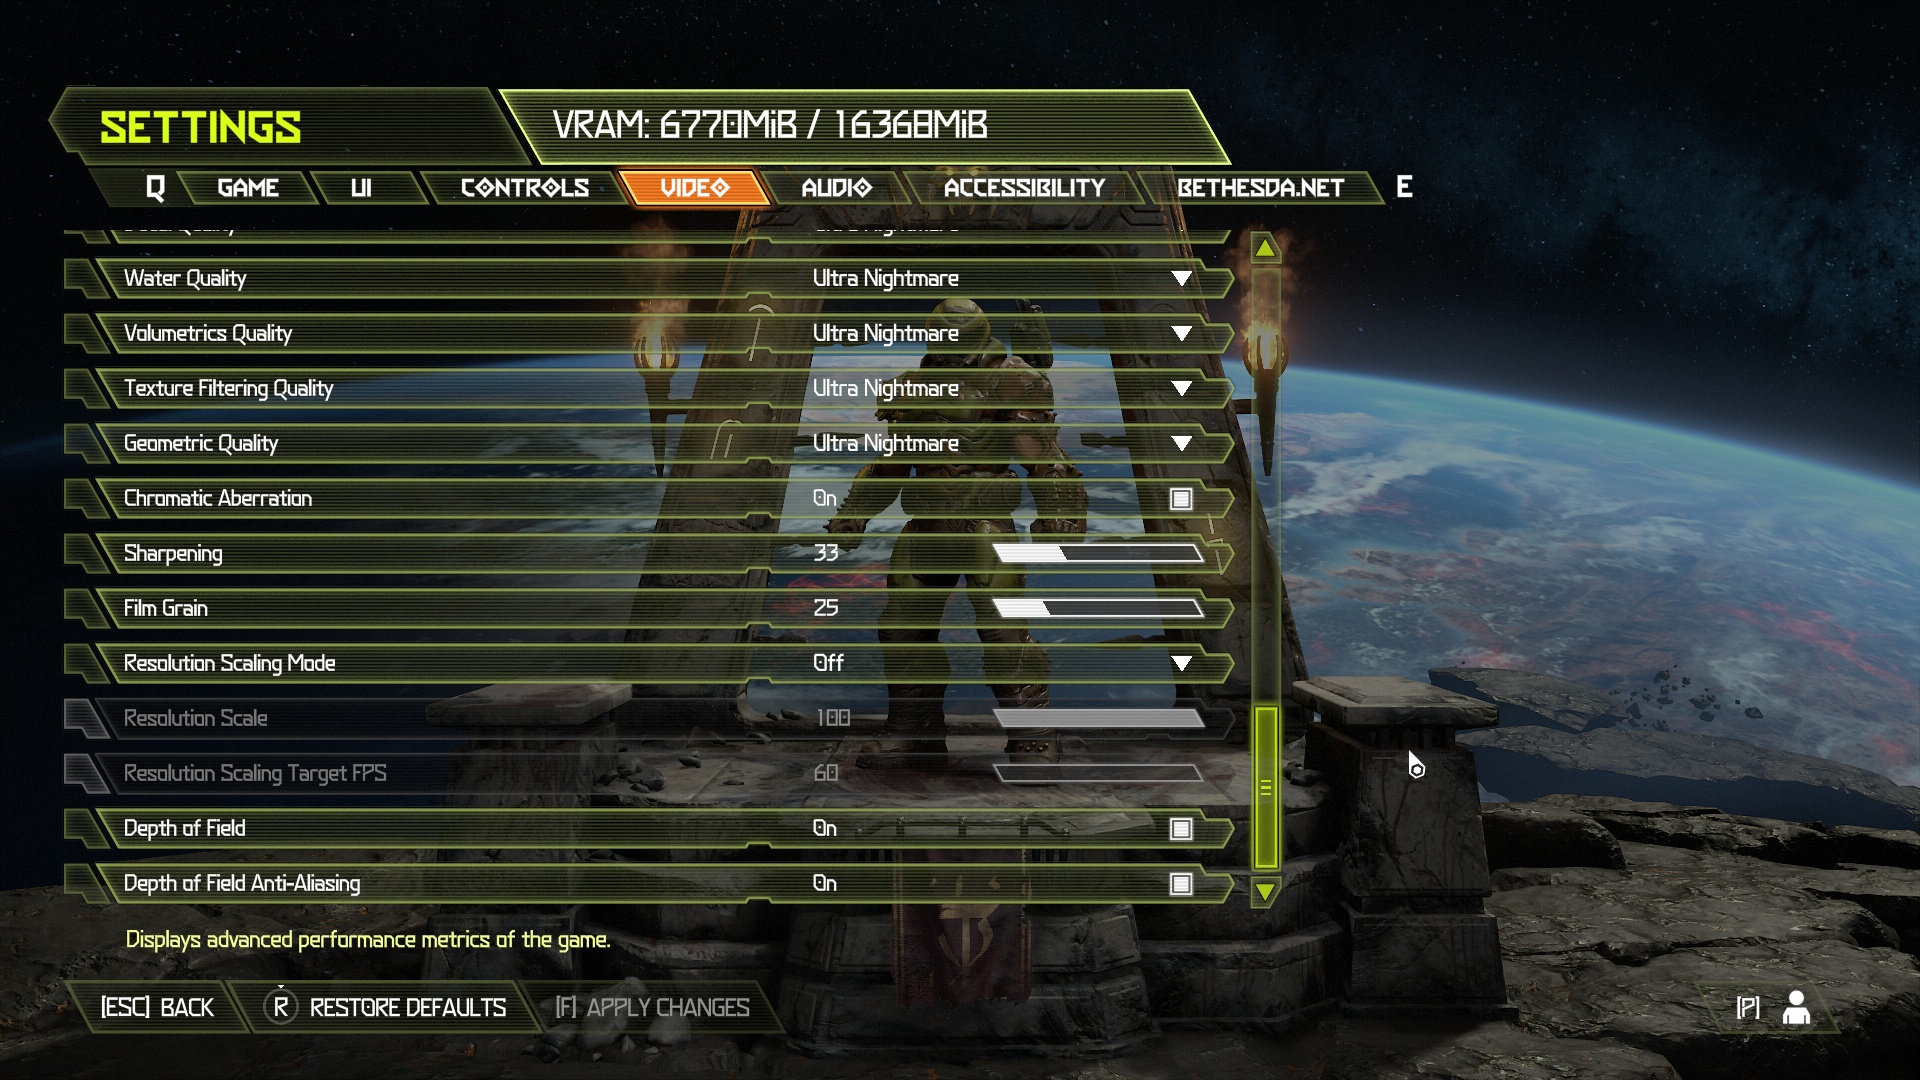
DOOM Eternal
Test platform custom scene; API Vulkan, graphics settings preset Ultra Nightmare; no extra settings.

After the GeForce RTX 4080 graphics cards, which wasn’t to many people’s taste due to the higher price, Nvidia has released a significantly cheaper GPU for the GeForce RTX 4070 Ti. The performance versus the RTX 4080 is admittedly noticeably weaker, but percentage-wise not by as much as the roughly two-thirds lower price of the RTX 4070 Ti. In our tests, we analyze MSI’s non-reference design from the top-of-the-line Suprim X series.
F1 2020
Test platform benchmark (Australia, Clear/Dry, Cycle); API DirectX 12, graphics settings preset Ultra High; TAA; extra settings Skidmarks blending off*.
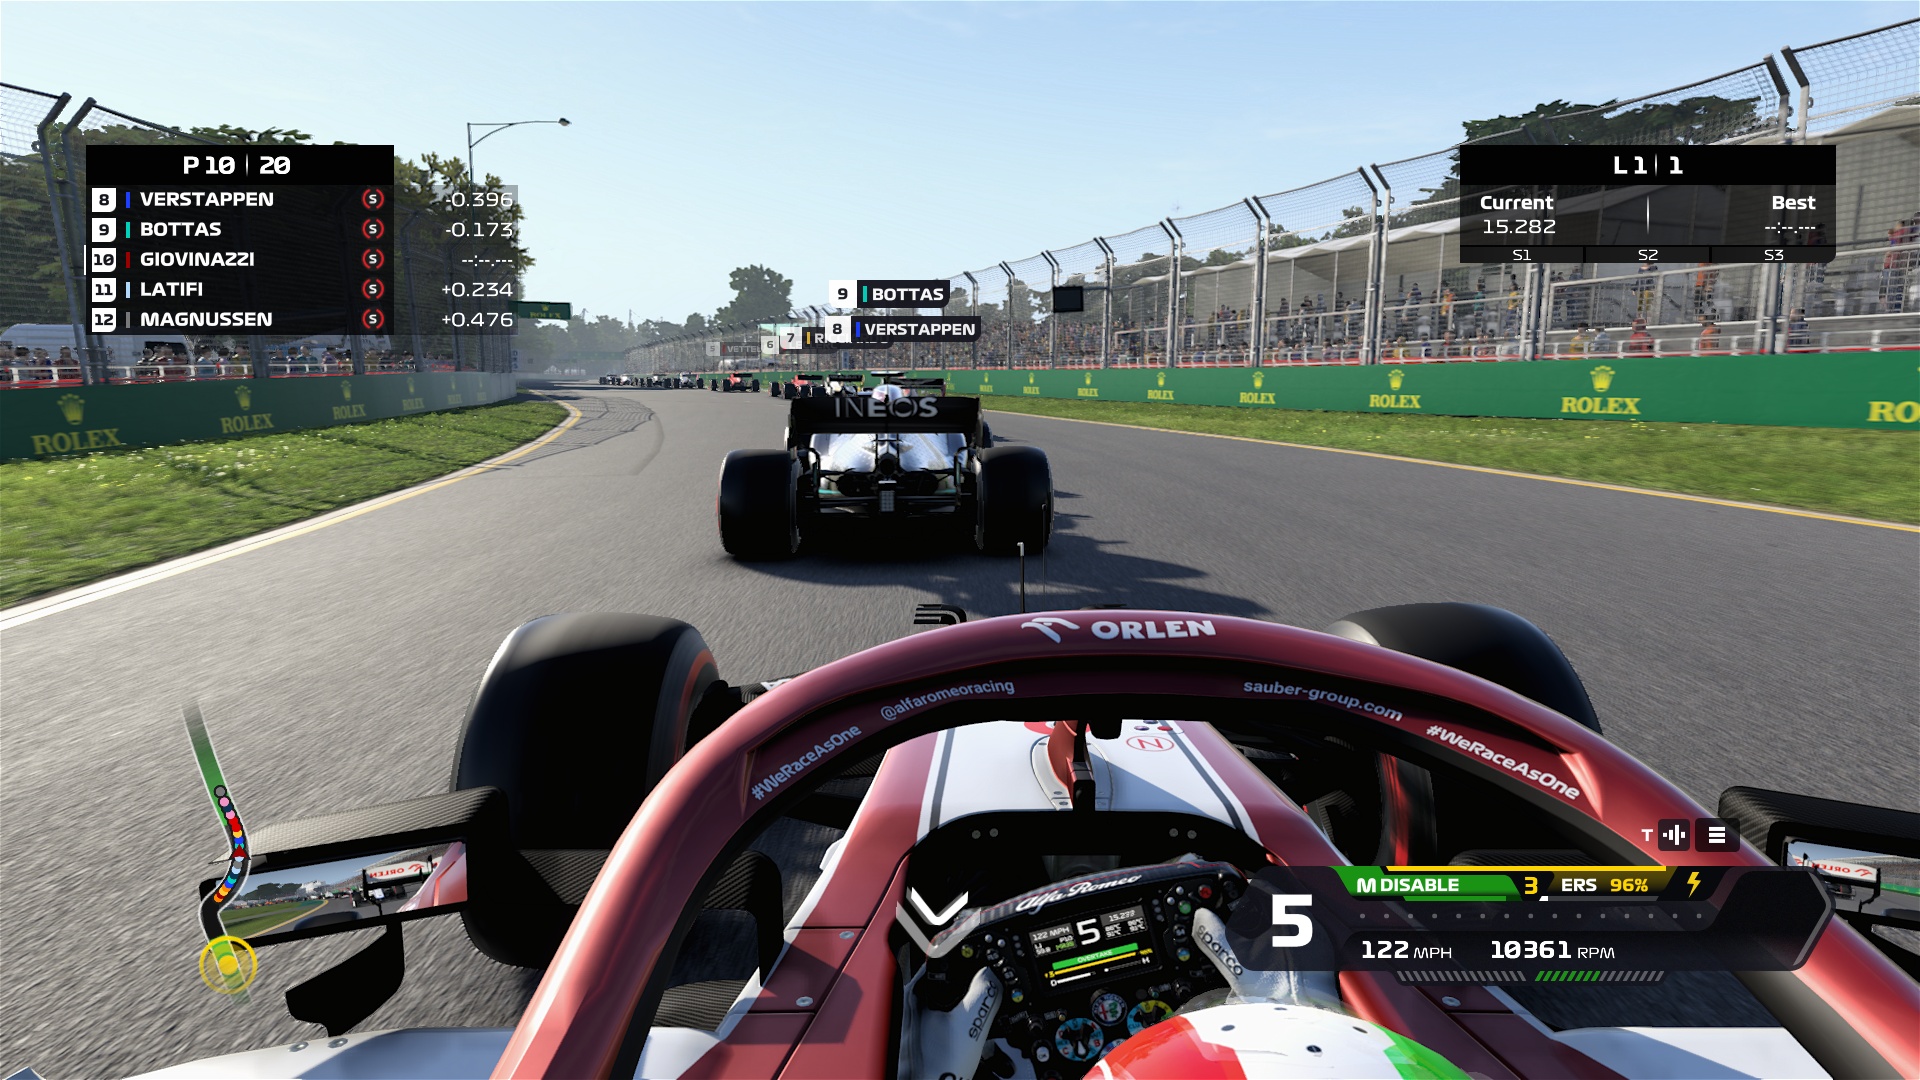

*on GeForce graphics cards, the Skidmarks blending option is disabled. This option is missing on AMD graphics cards. However, the overall quality of Skidmarks is otherwise set to High on both GeForce and AMD.
Note: The game also supports DLSS 2.0 and FidelityFX for upscaling and sharpening, but due to the relatively low hardware requirements in the native settings, we will not address them in standard tests. However, measurements on request are possible if you ask for it.
After the GeForce RTX 4080 graphics cards, which wasn’t to many people’s taste due to the higher price, Nvidia has released a significantly cheaper GPU for the GeForce RTX 4070 Ti. The performance versus the RTX 4080 is admittedly noticeably weaker, but percentage-wise not by as much as the roughly two-thirds lower price of the RTX 4070 Ti. In our tests, we analyze MSI’s non-reference design from the top-of-the-line Suprim X series.
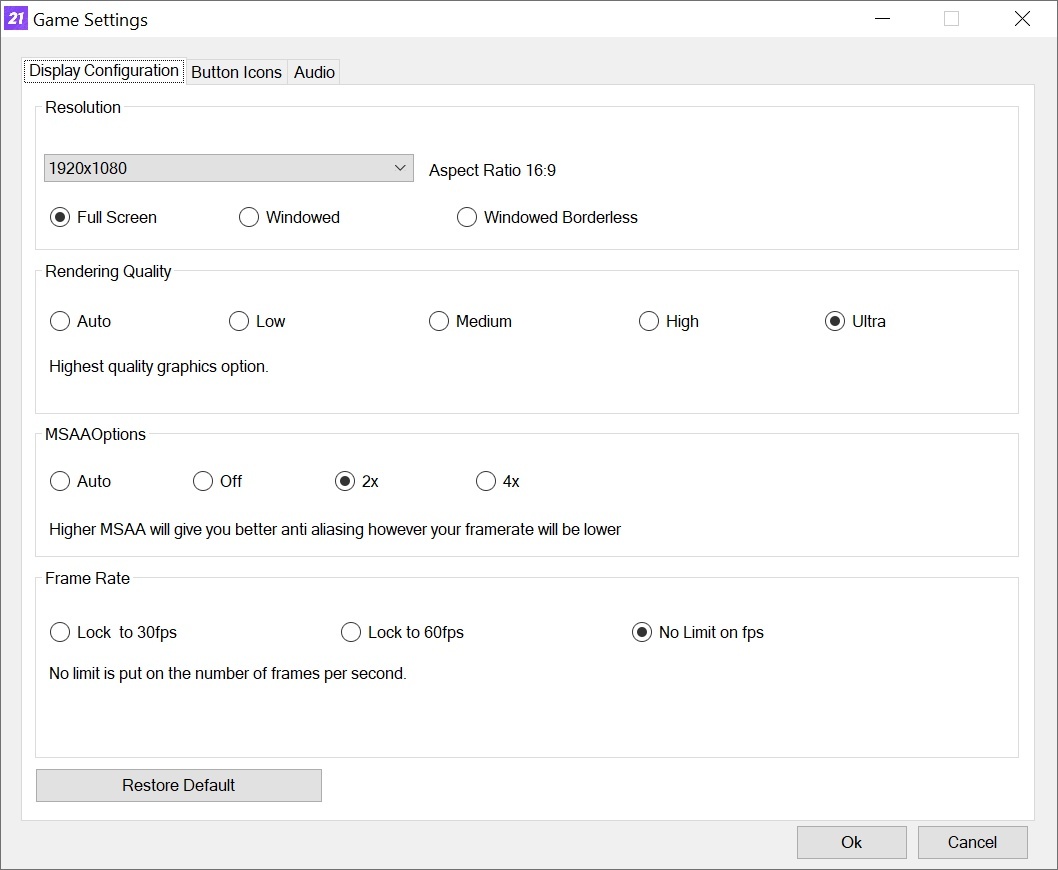
FIFA 21
Test platform custom scene (Autumn/Fall, Overcast, 9pm, Old Trafford); API DirectX 12, graphics settings preset Ultra; no extra settings.

After the GeForce RTX 4080 graphics cards, which wasn’t to many people’s taste due to the higher price, Nvidia has released a significantly cheaper GPU for the GeForce RTX 4070 Ti. The performance versus the RTX 4080 is admittedly noticeably weaker, but percentage-wise not by as much as the roughly two-thirds lower price of the RTX 4070 Ti. In our tests, we analyze MSI’s non-reference design from the top-of-the-line Suprim X series.
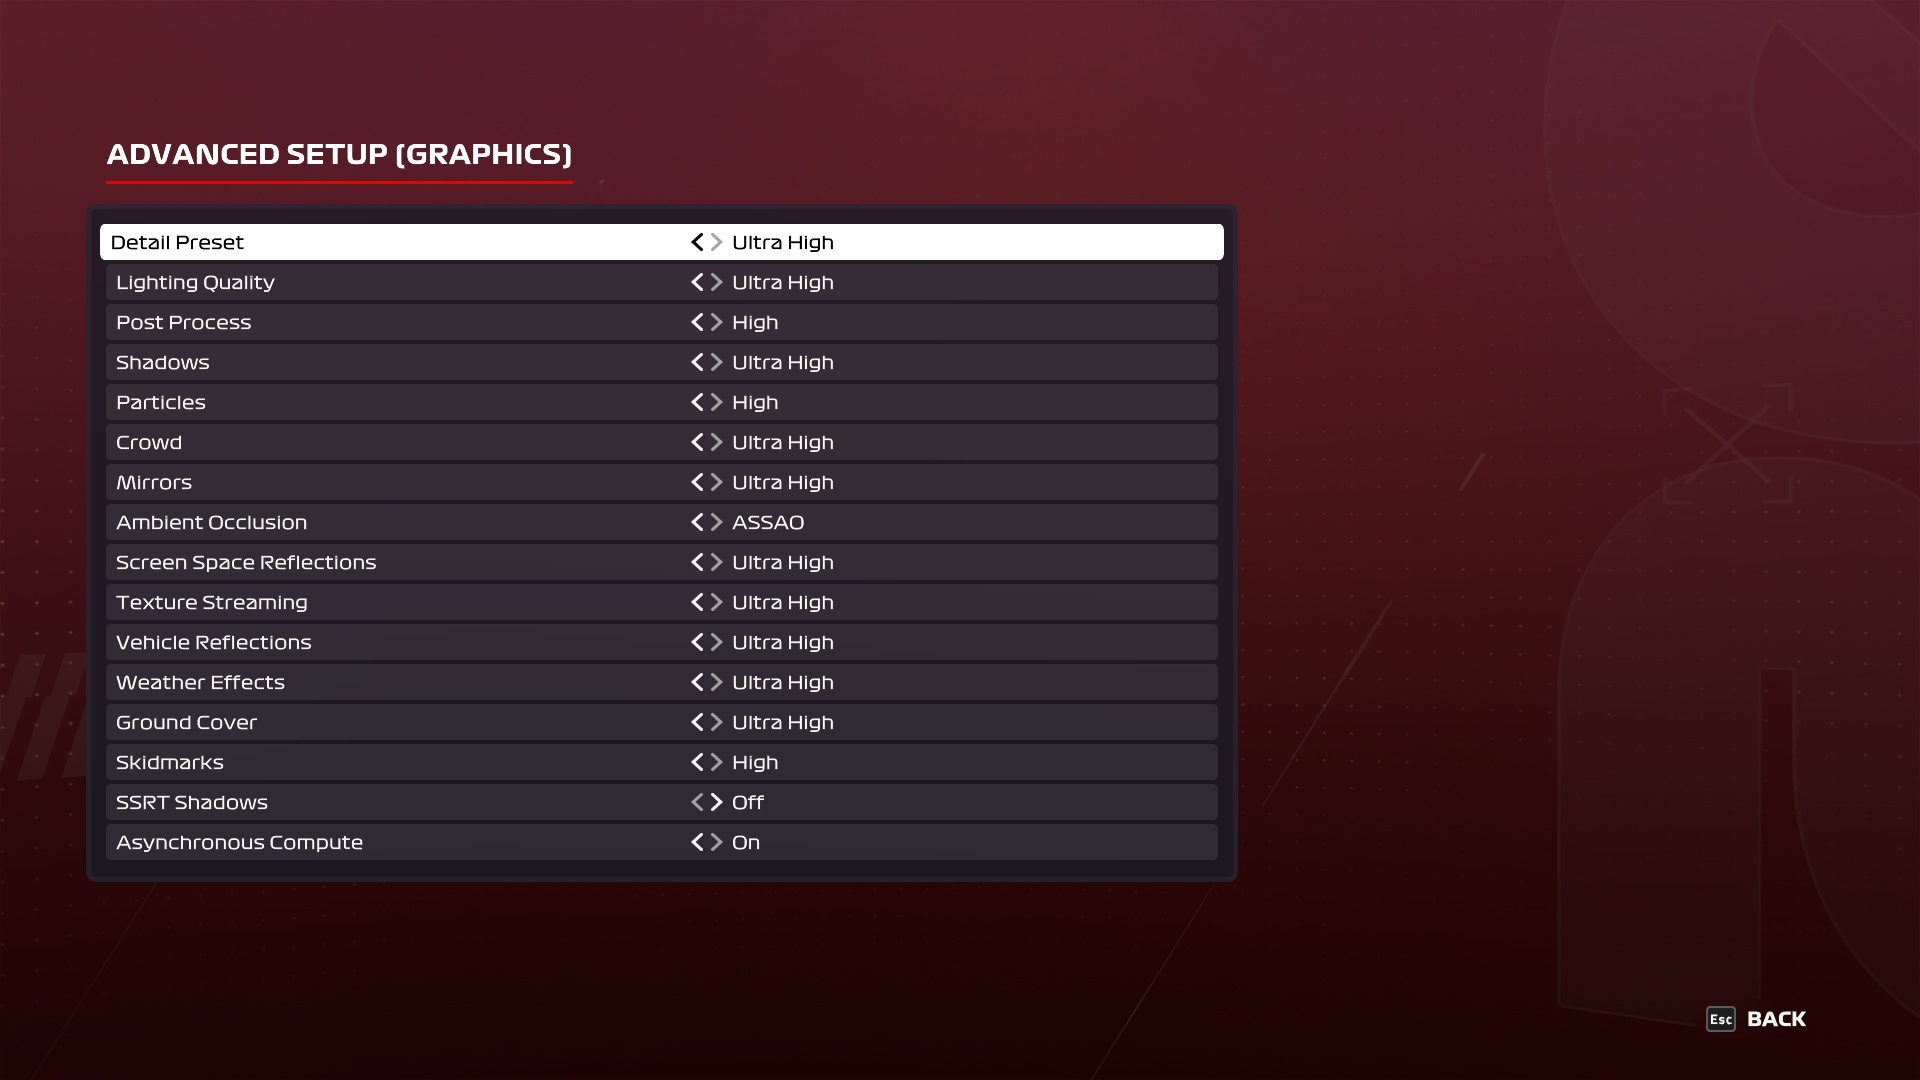
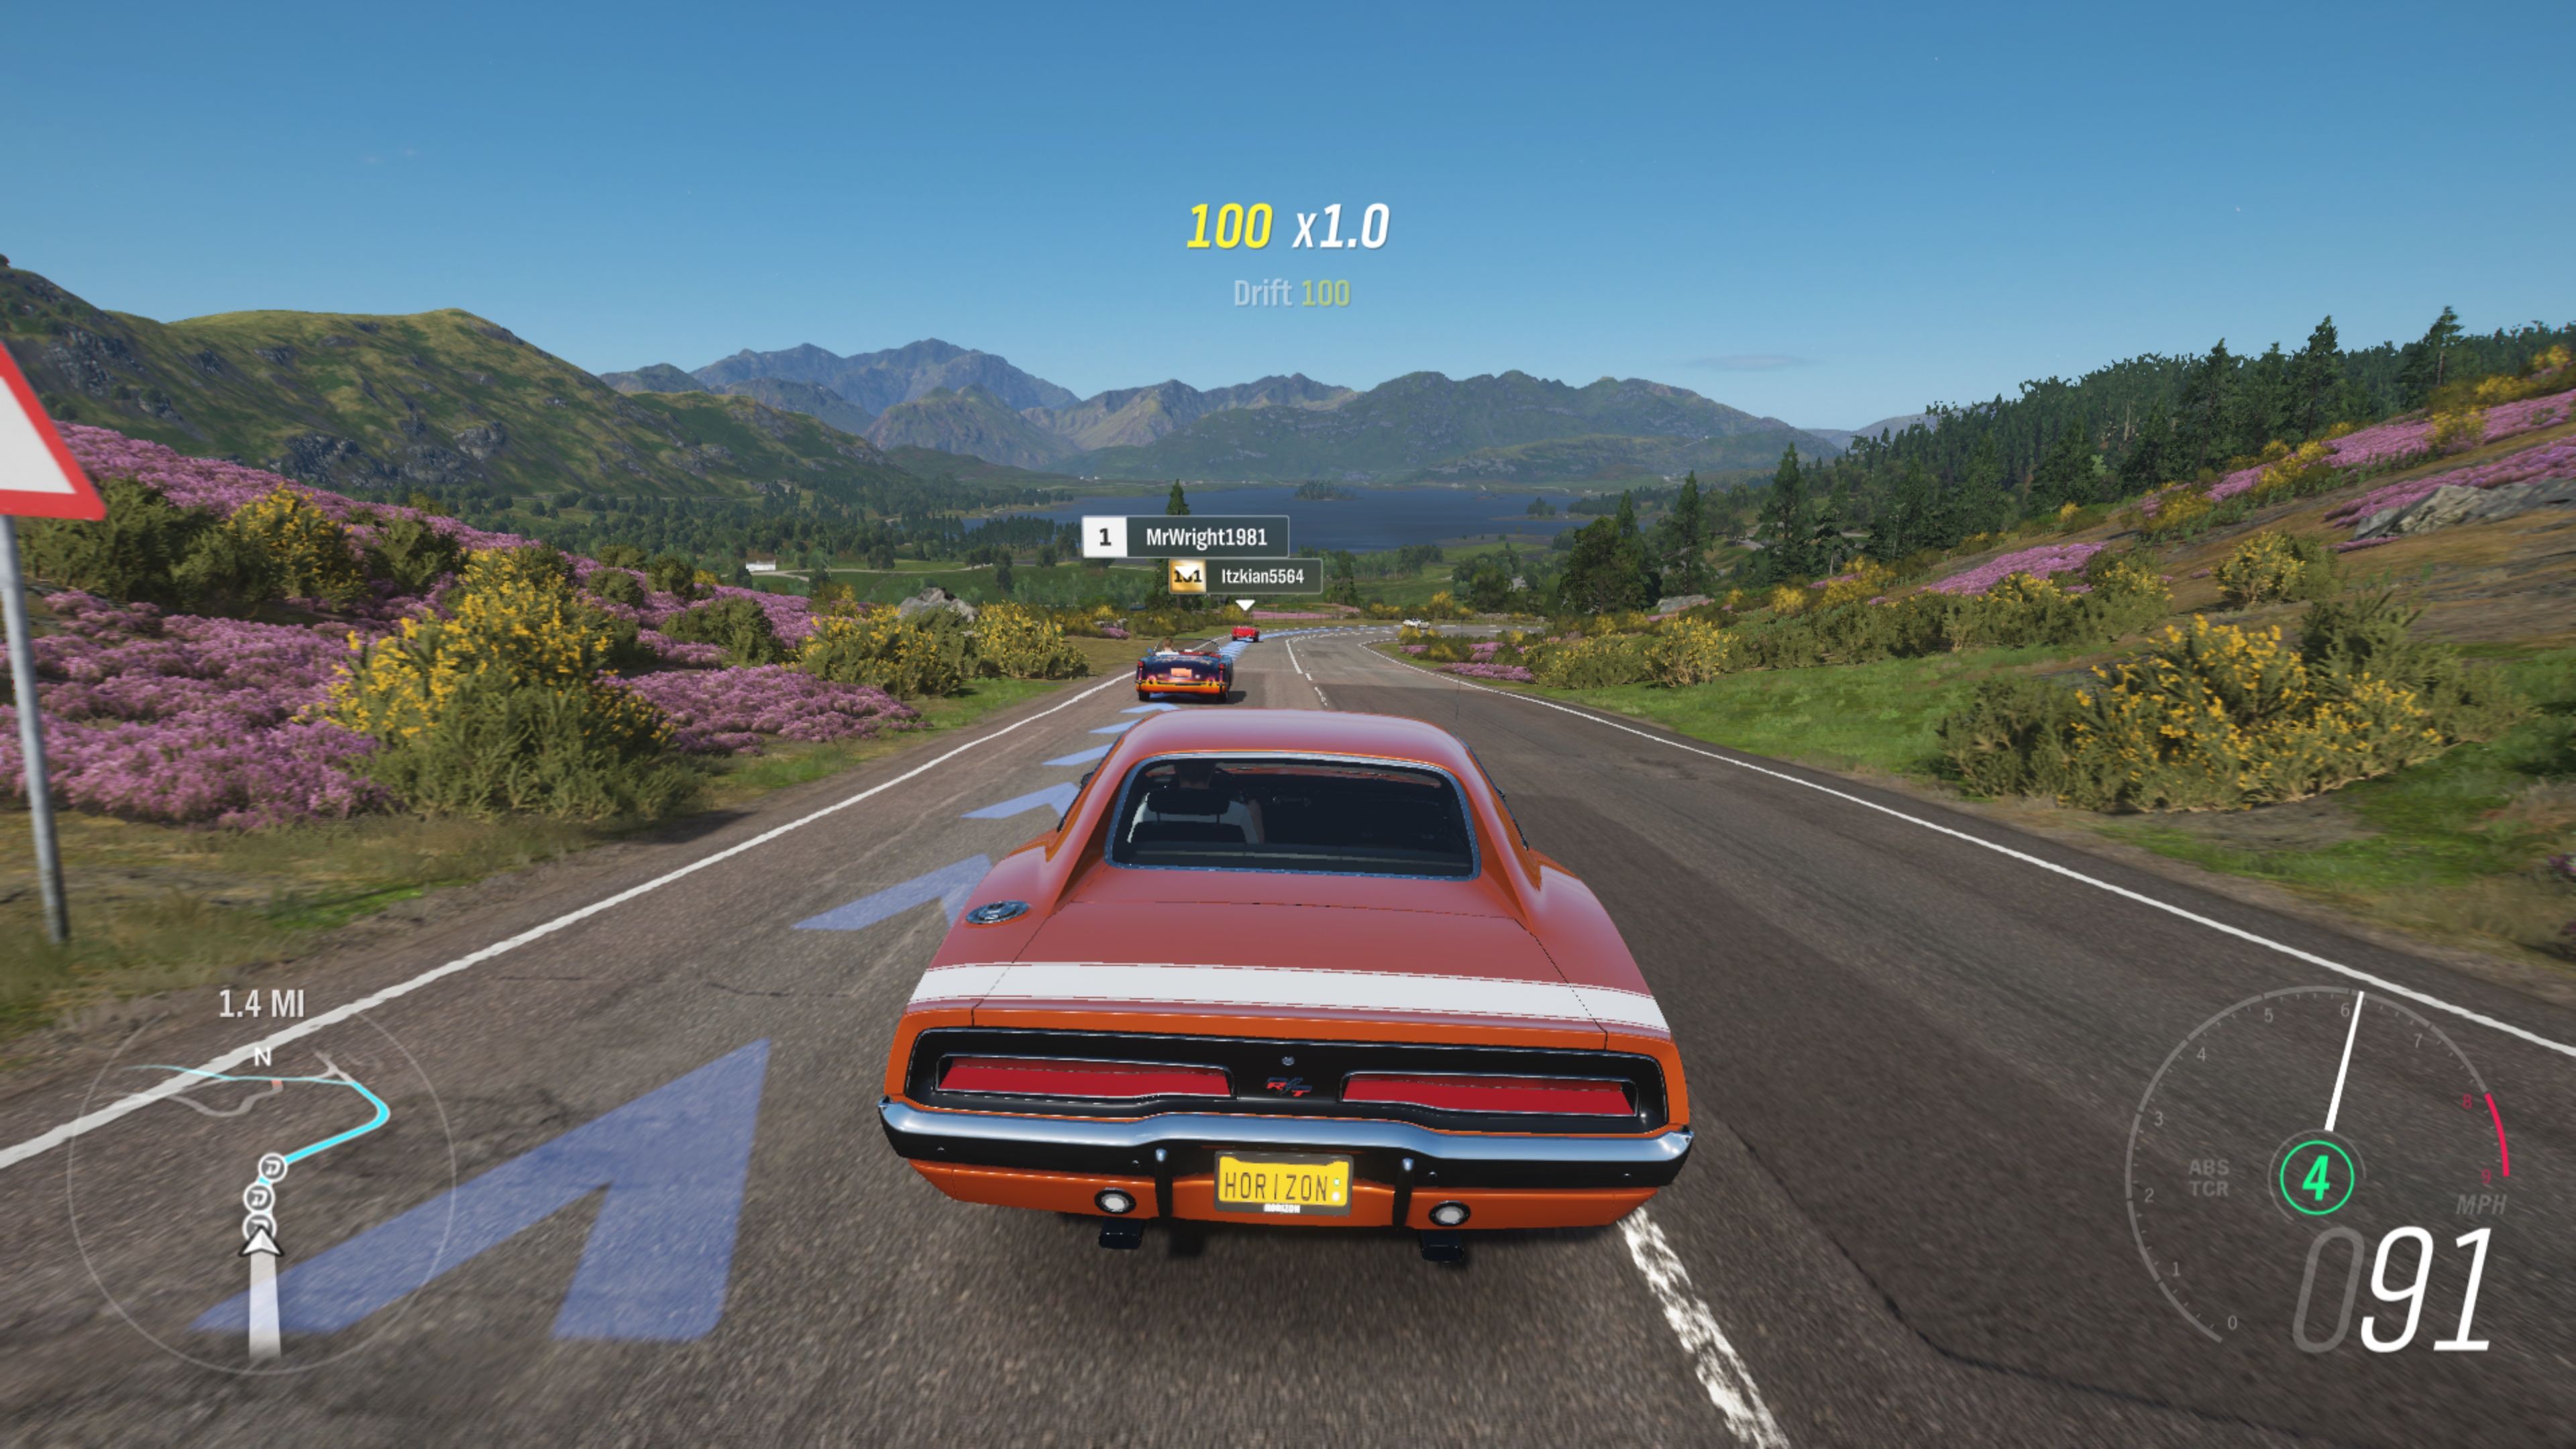
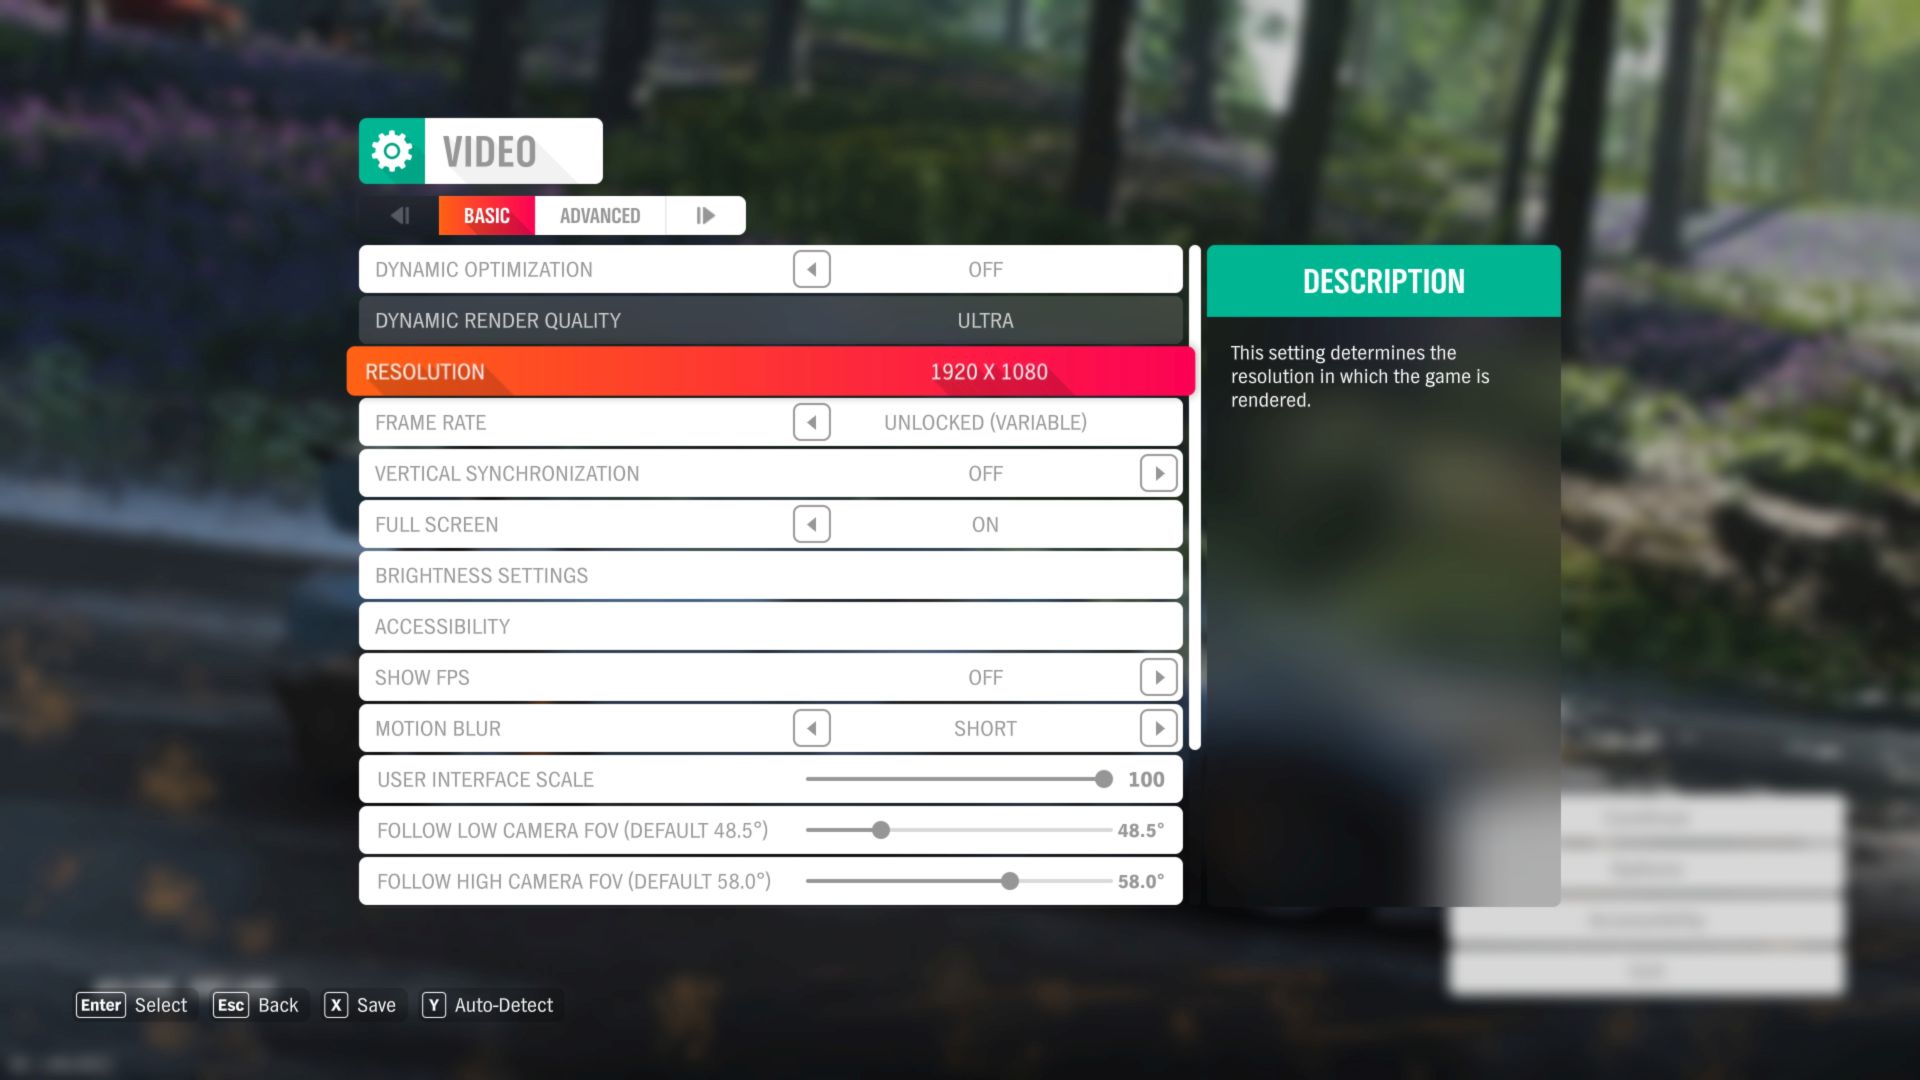
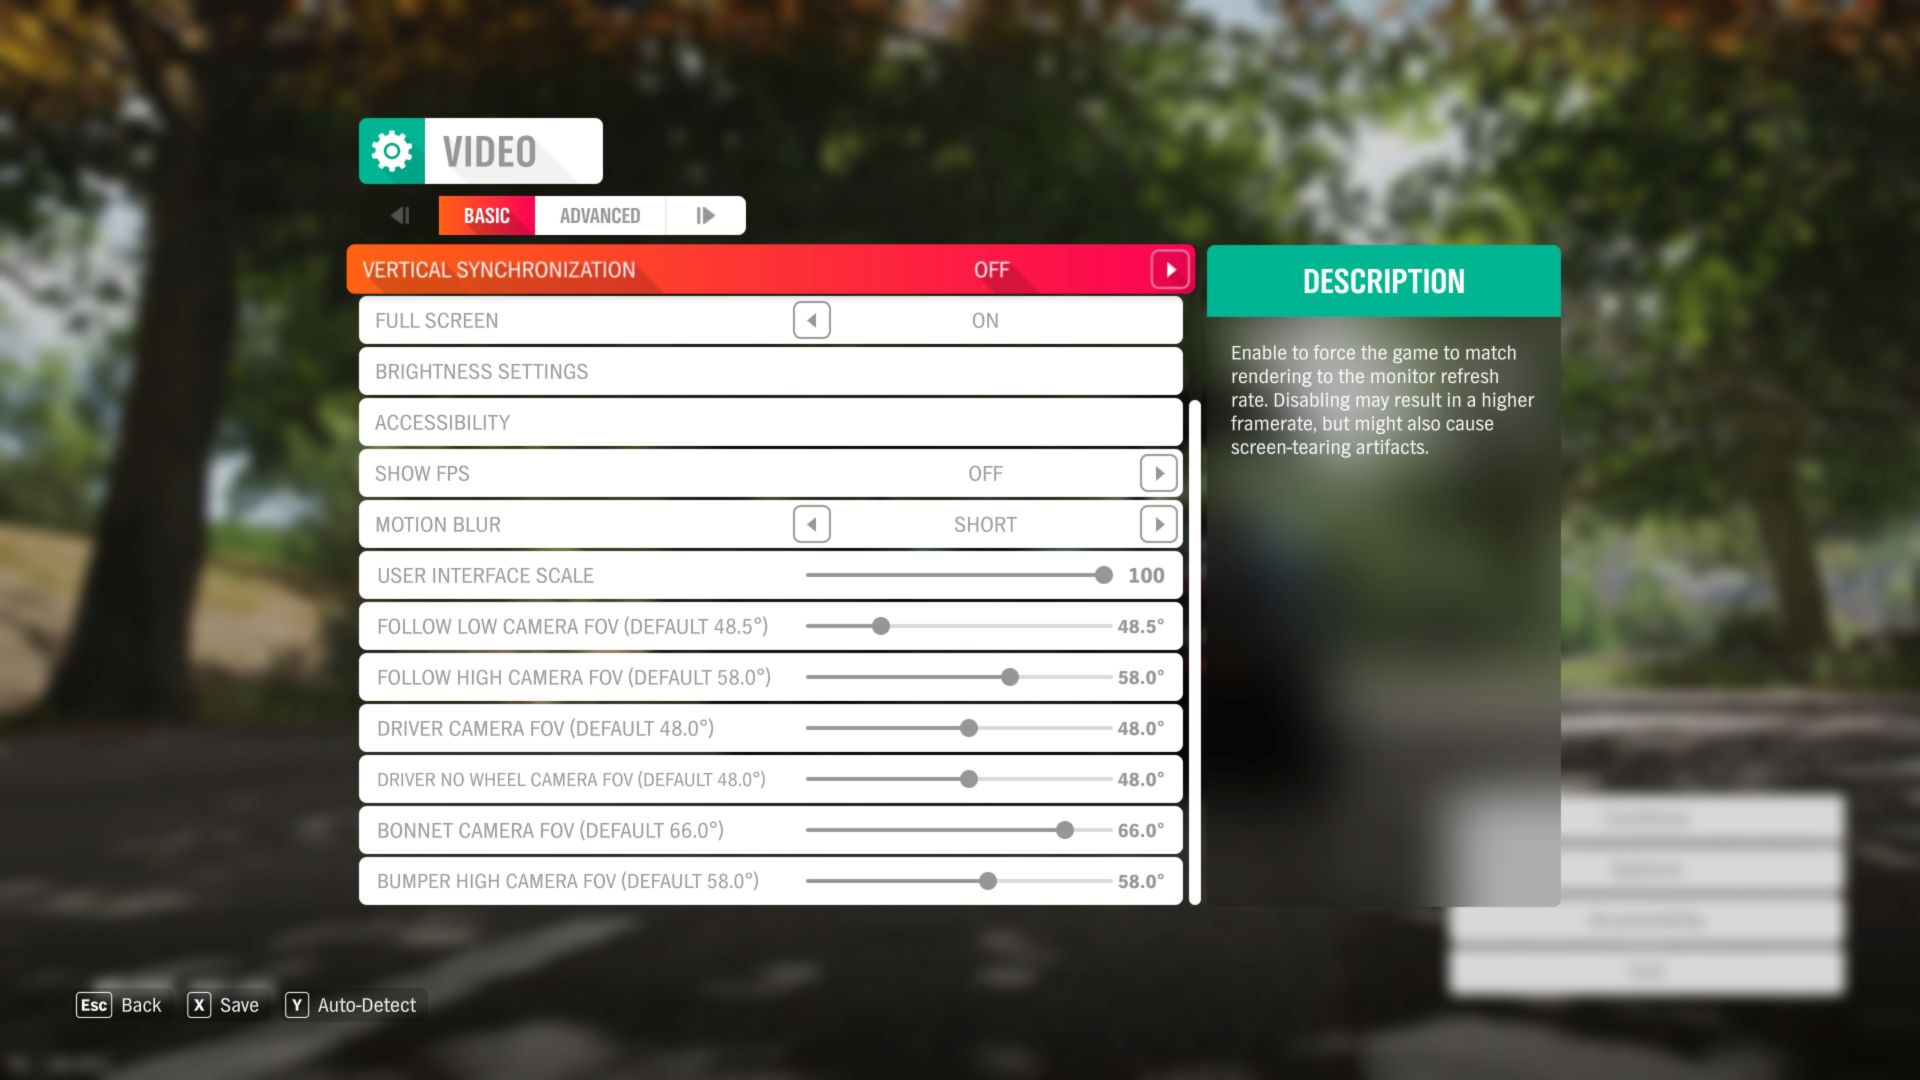
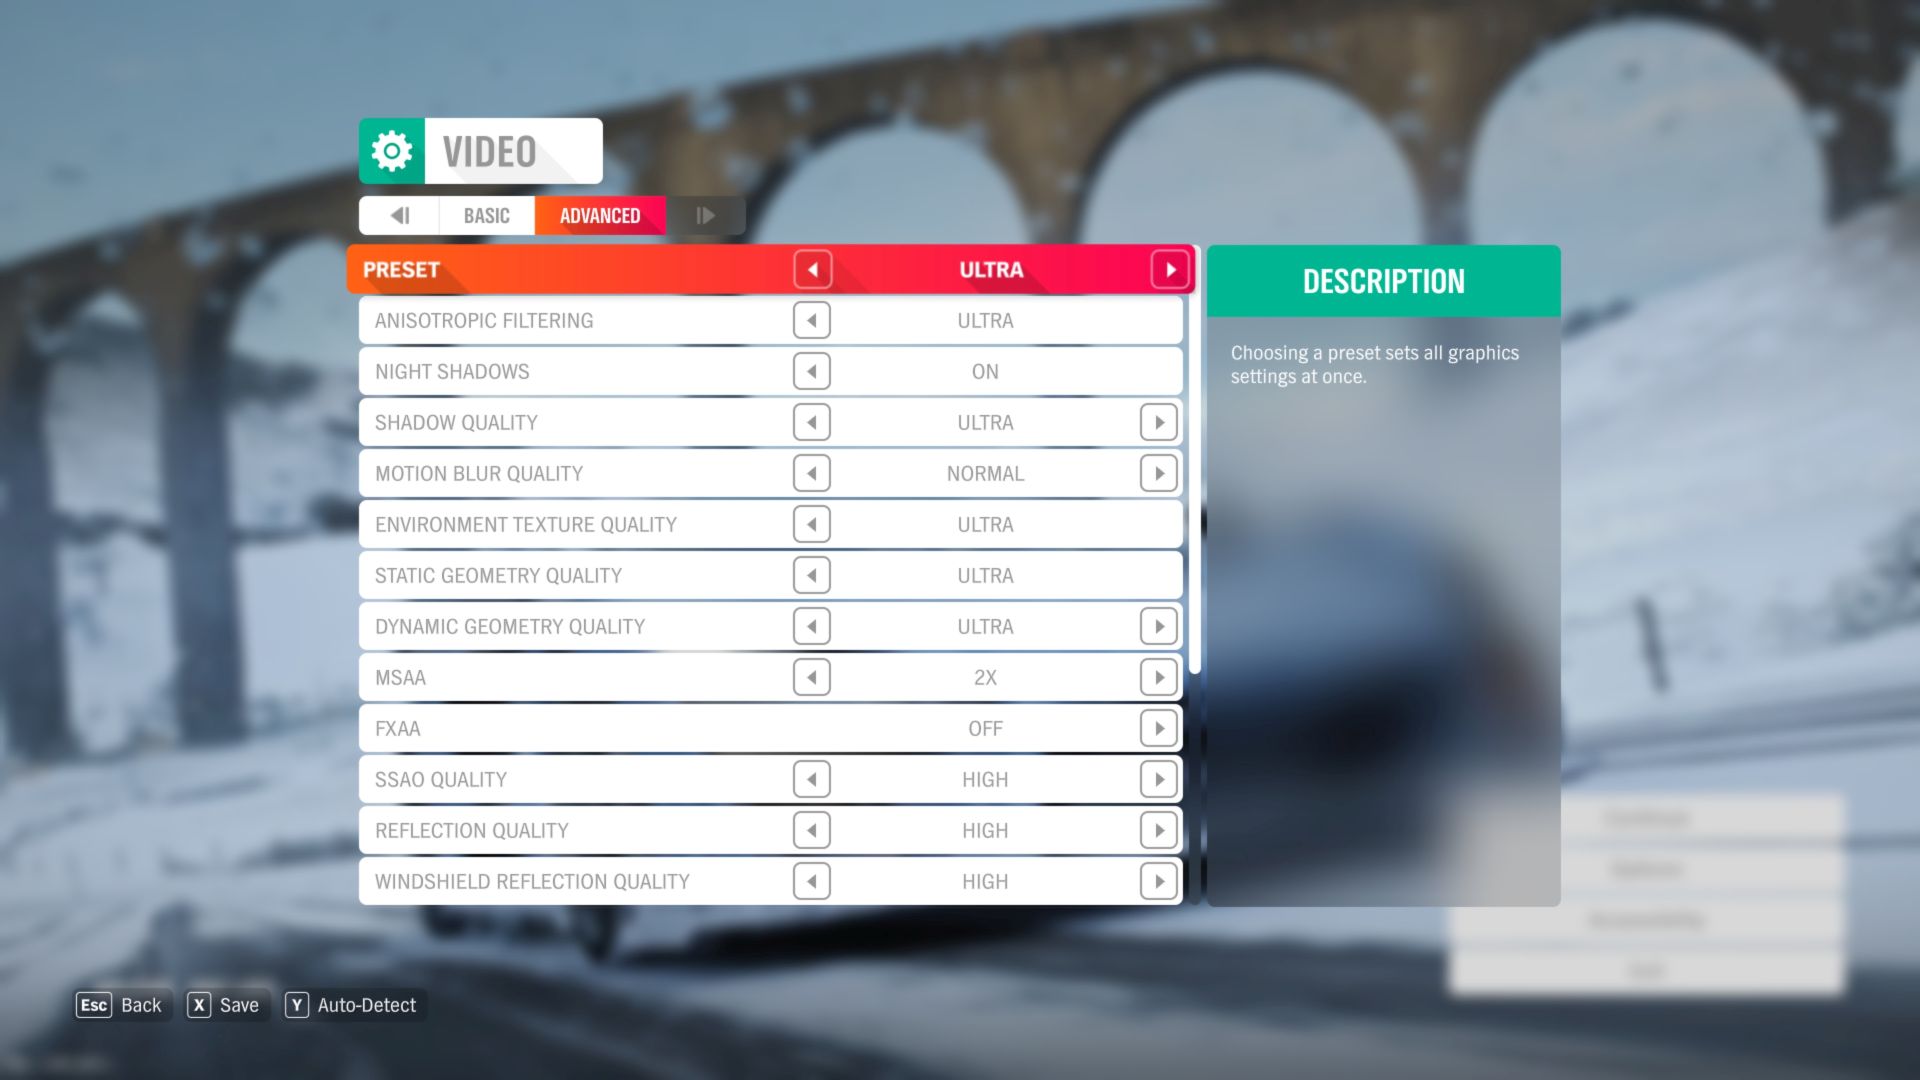
Forza Horizon 4
Test platform custom scene; API DirectX 12, graphics settings preset Ultra; 2× MSAA; no extra settings.

After the GeForce RTX 4080 graphics cards, which wasn’t to many people’s taste due to the higher price, Nvidia has released a significantly cheaper GPU for the GeForce RTX 4070 Ti. The performance versus the RTX 4080 is admittedly noticeably weaker, but percentage-wise not by as much as the roughly two-thirds lower price of the RTX 4070 Ti. In our tests, we analyze MSI’s non-reference design from the top-of-the-line Suprim X series.
Mafia: DE
Test platform custom scene (from the Salieri’s Bar parking lot to the elevated railway gate); API DirectX 11, graphics settings preset High; no extra settings.


After the GeForce RTX 4080 graphics cards, which wasn’t to many people’s taste due to the higher price, Nvidia has released a significantly cheaper GPU for the GeForce RTX 4070 Ti. The performance versus the RTX 4080 is admittedly noticeably weaker, but percentage-wise not by as much as the roughly two-thirds lower price of the RTX 4070 Ti. In our tests, we analyze MSI’s non-reference design from the top-of-the-line Suprim X series.
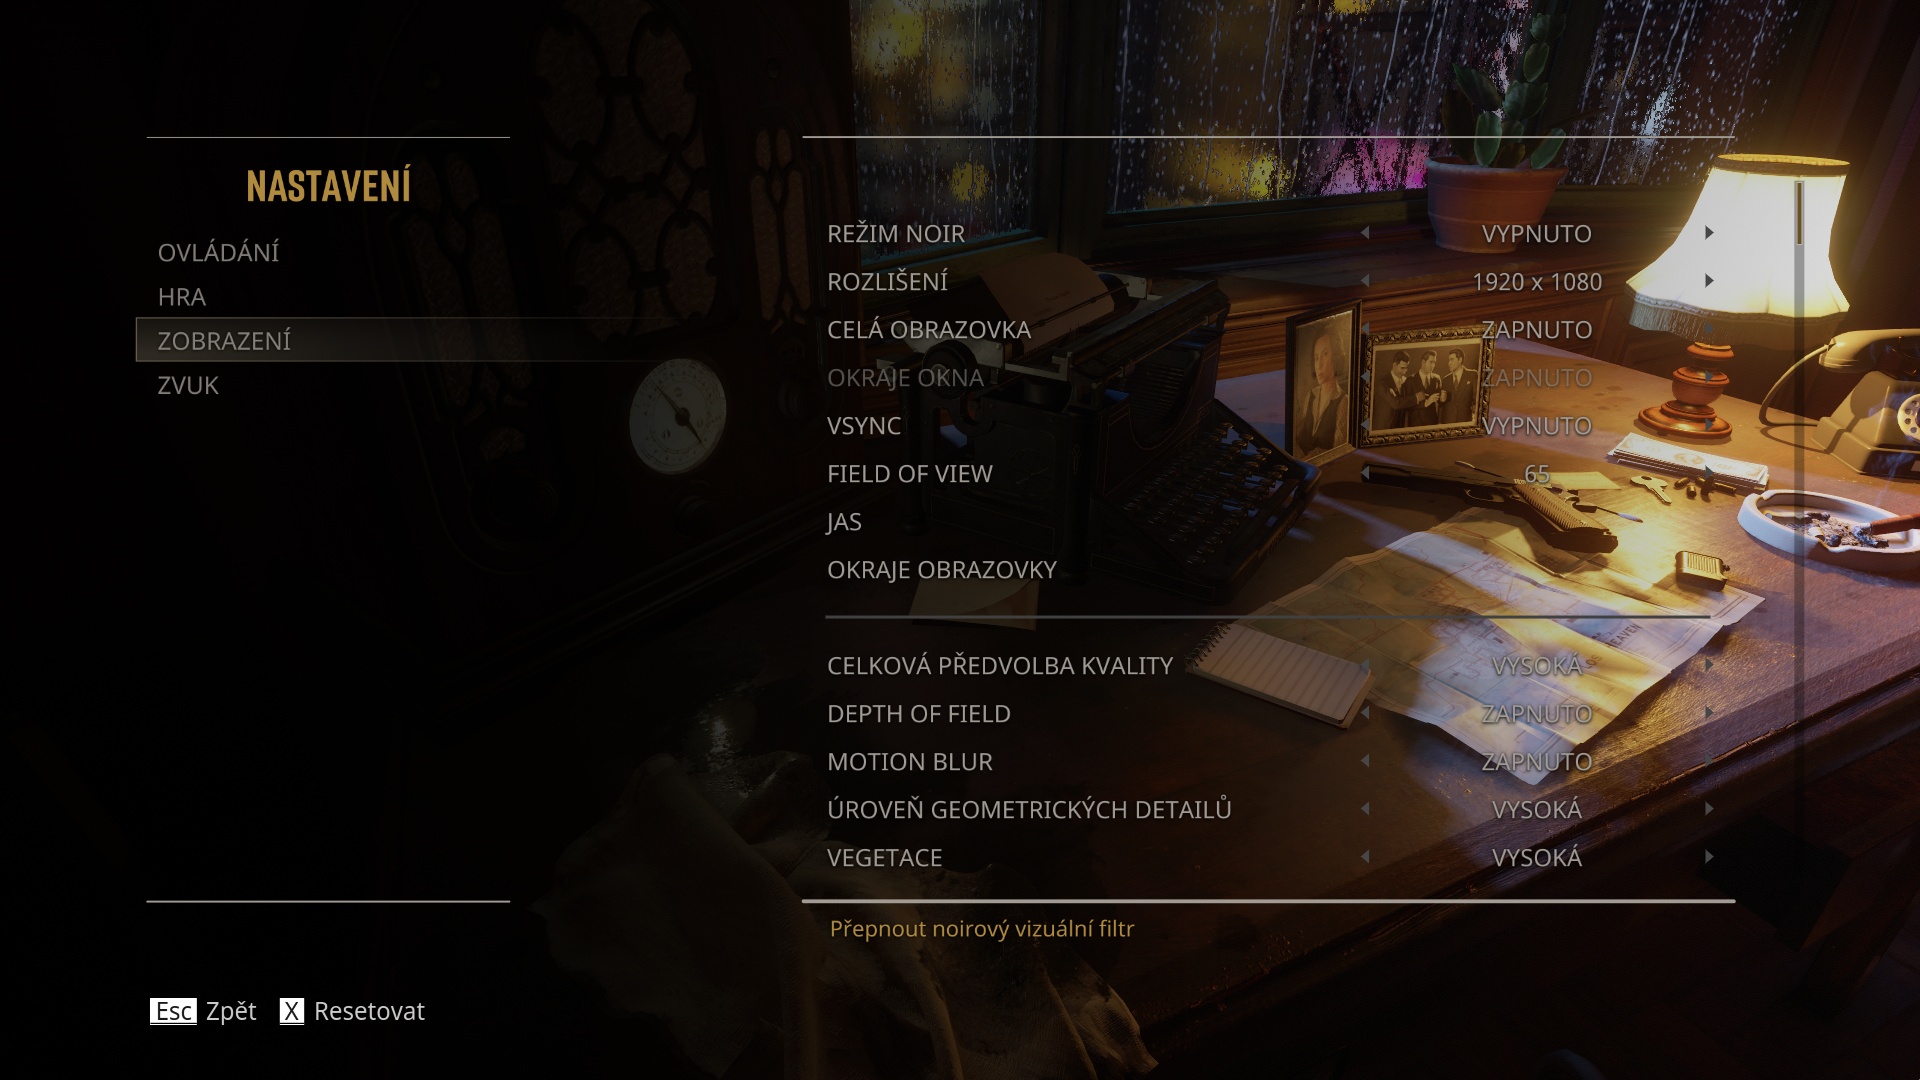
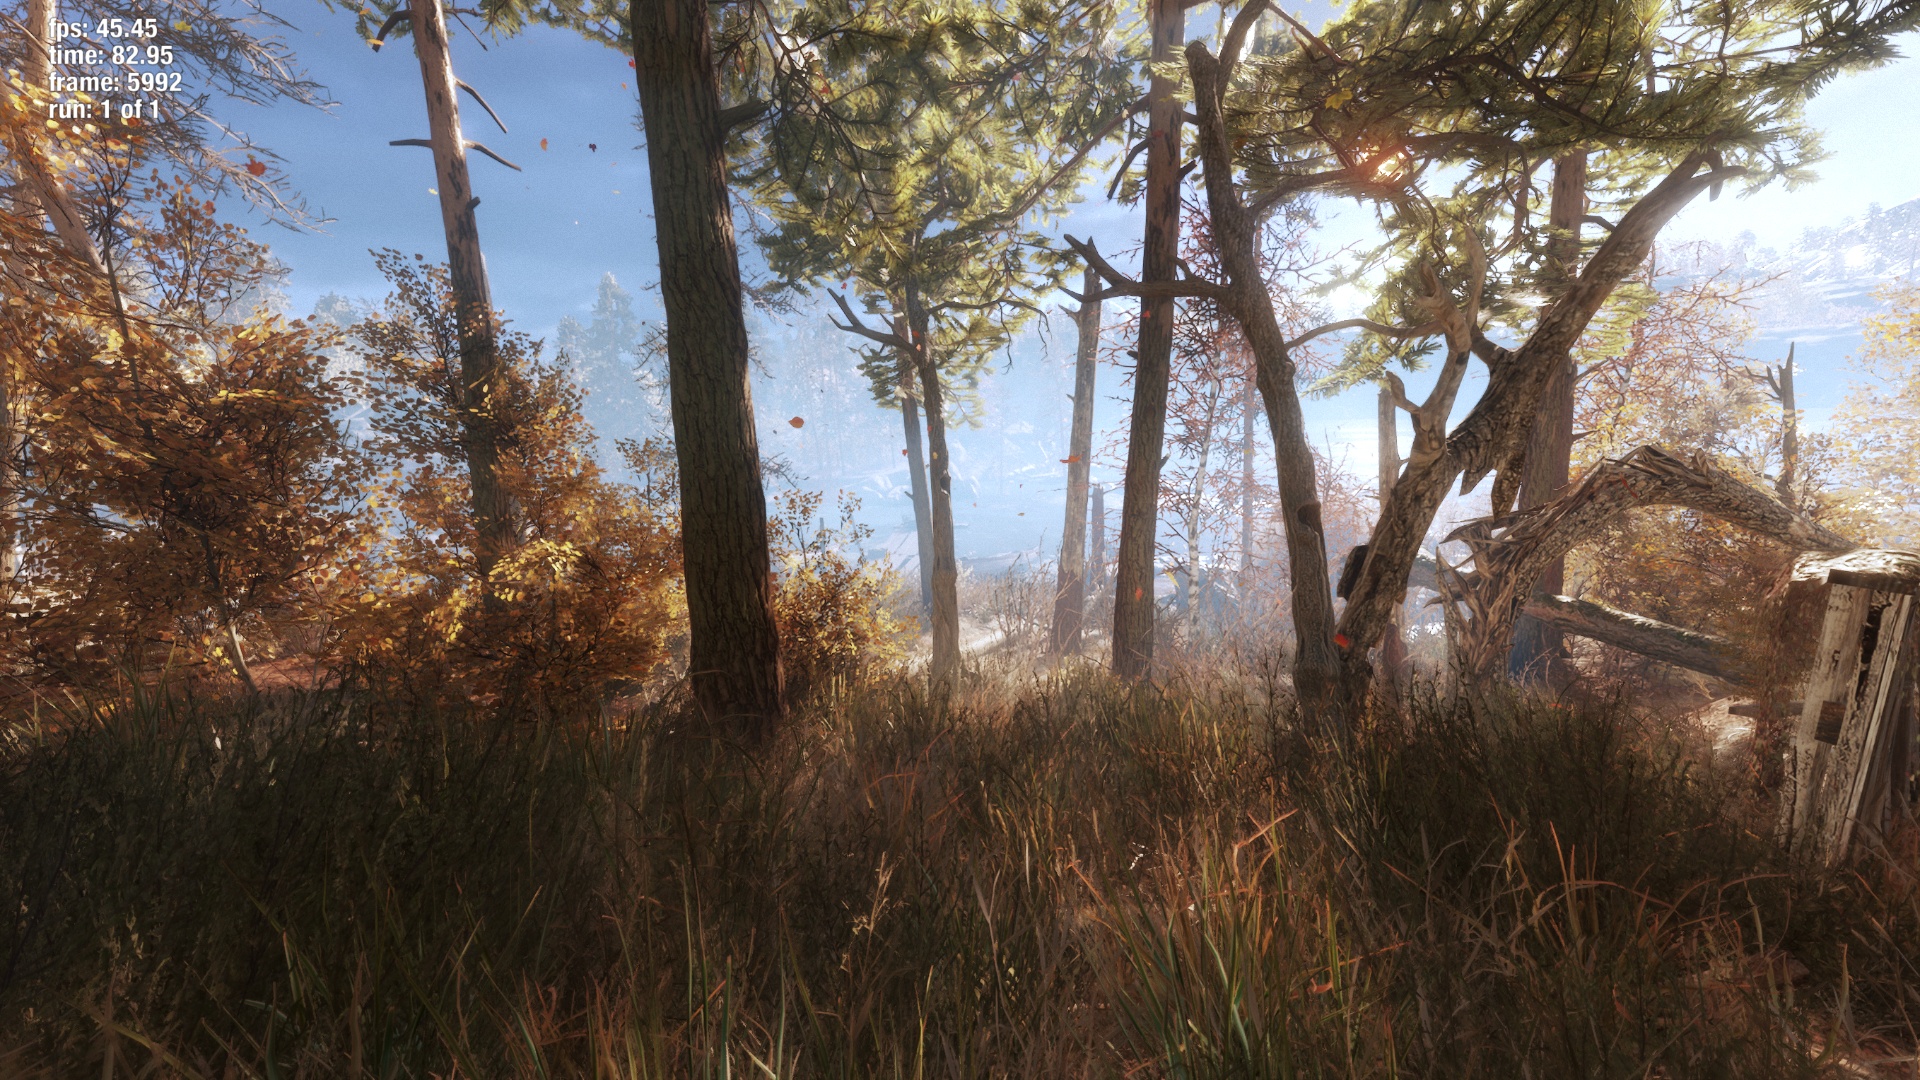
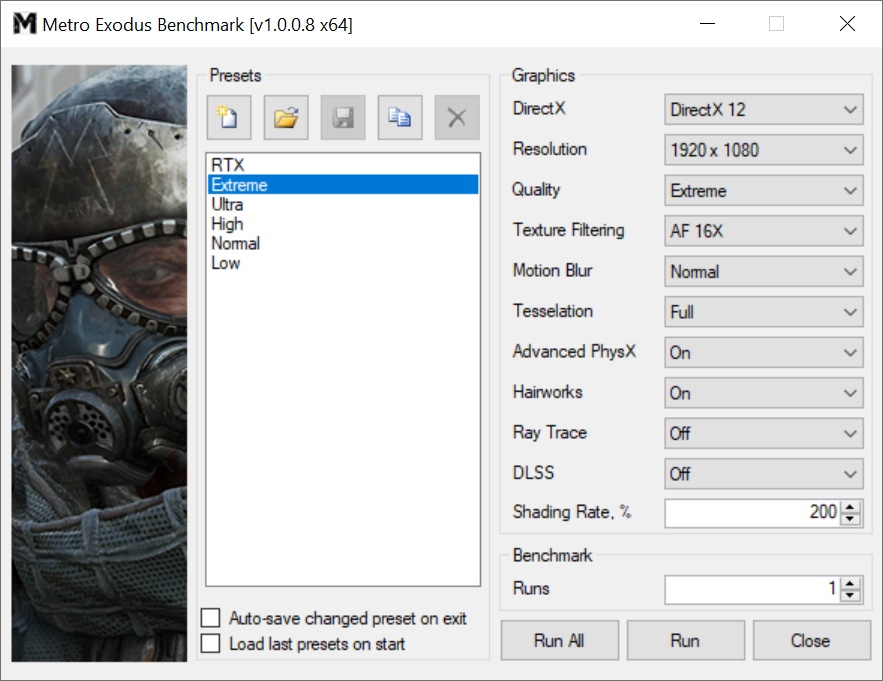
Metro Exodus
Test platform benchmark; API DirectX 12, graphics settings preset Extreme; no extra settings.
After the GeForce RTX 4080 graphics cards, which wasn’t to many people’s taste due to the higher price, Nvidia has released a significantly cheaper GPU for the GeForce RTX 4070 Ti. The performance versus the RTX 4080 is admittedly noticeably weaker, but percentage-wise not by as much as the roughly two-thirds lower price of the RTX 4070 Ti. In our tests, we analyze MSI’s non-reference design from the top-of-the-line Suprim X series.
Metro Exodus with DXR and DLSS
Test platform benchmark; API DirectX 12, graphics settings preset Ultra; extra settings DXR.
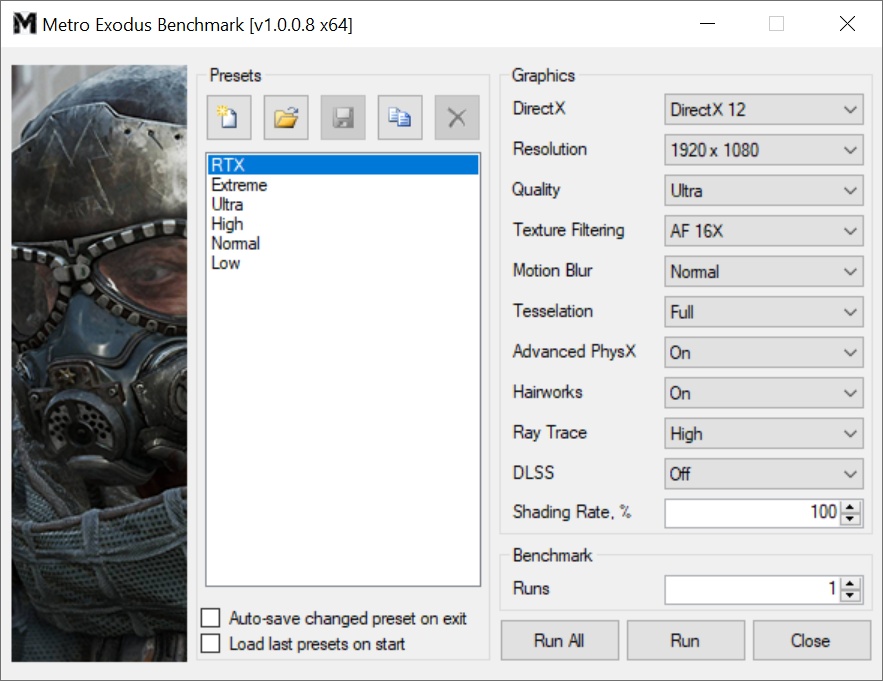
DXR (native)
DXR with DLSS (performance)
After the GeForce RTX 4080 graphics cards, which wasn’t to many people’s taste due to the higher price, Nvidia has released a significantly cheaper GPU for the GeForce RTX 4070 Ti. The performance versus the RTX 4080 is admittedly noticeably weaker, but percentage-wise not by as much as the roughly two-thirds lower price of the RTX 4070 Ti. In our tests, we analyze MSI’s non-reference design from the top-of-the-line Suprim X series.
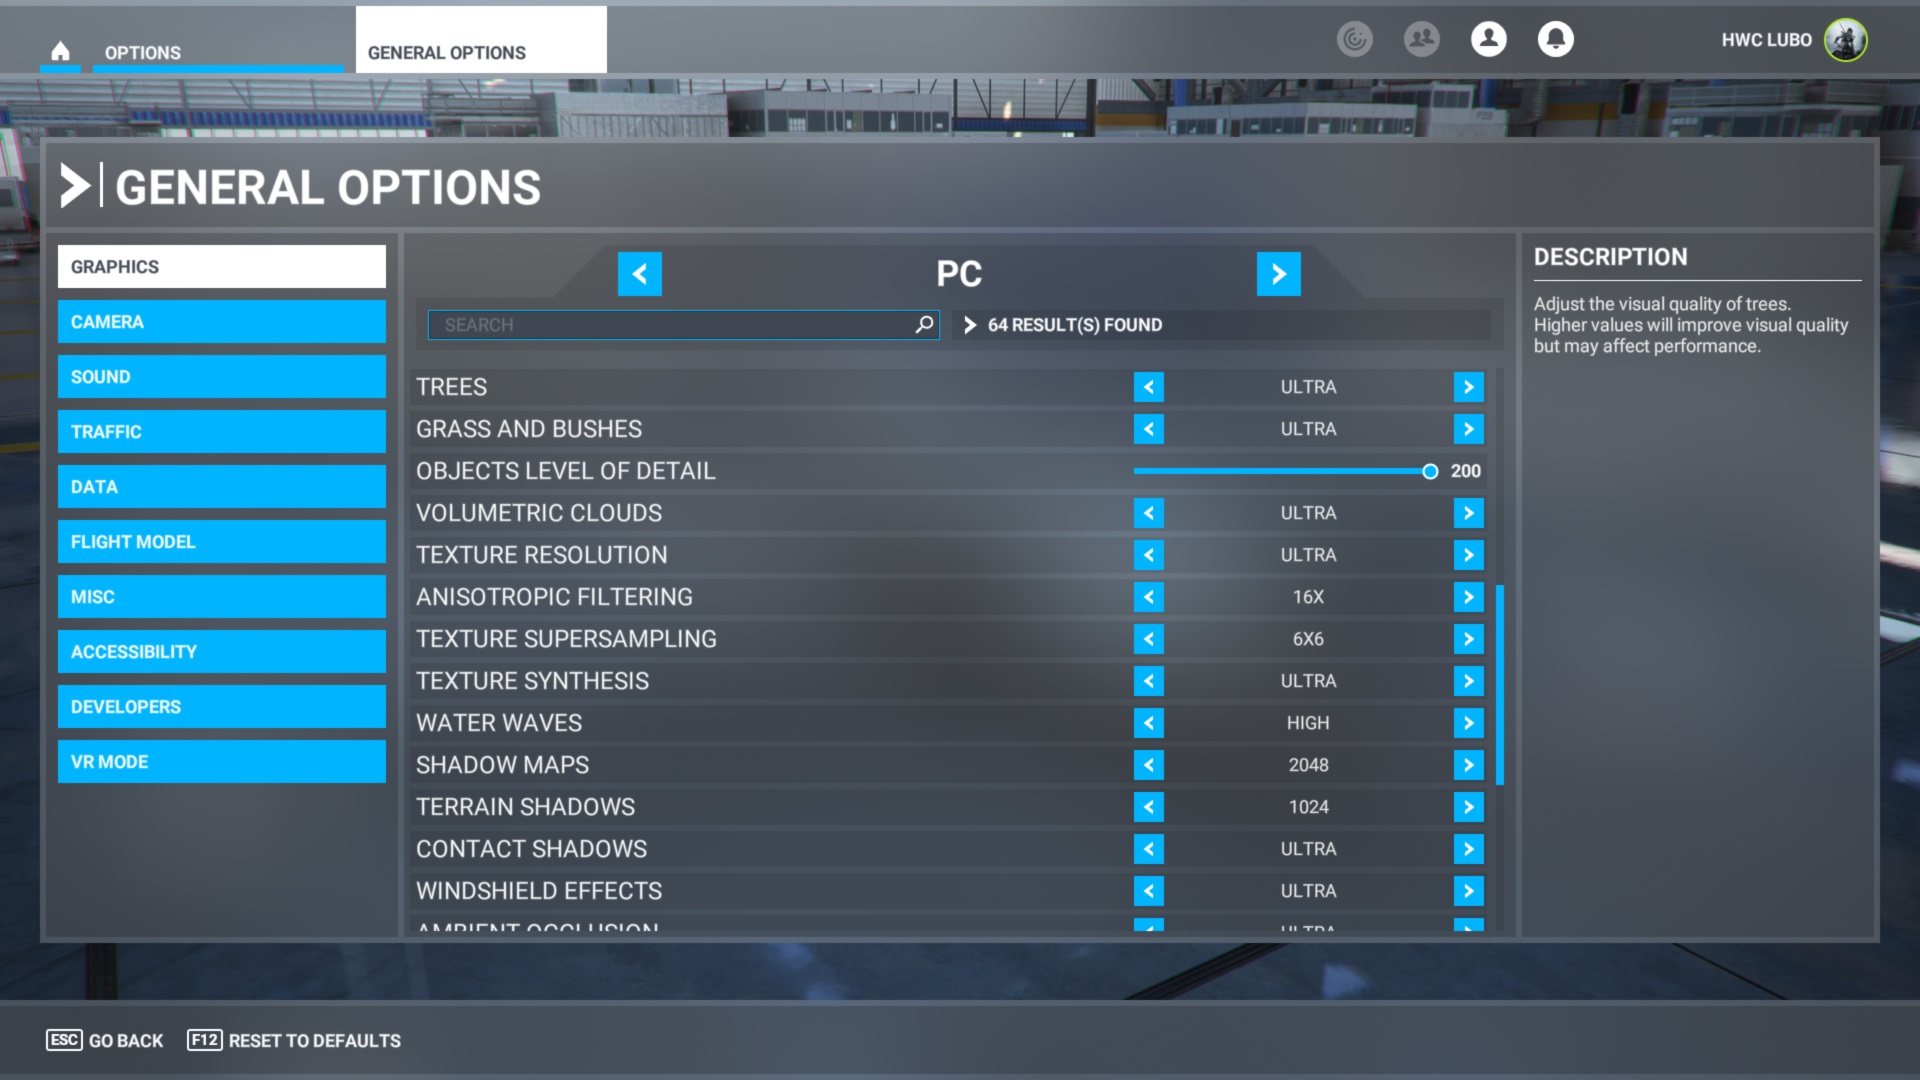
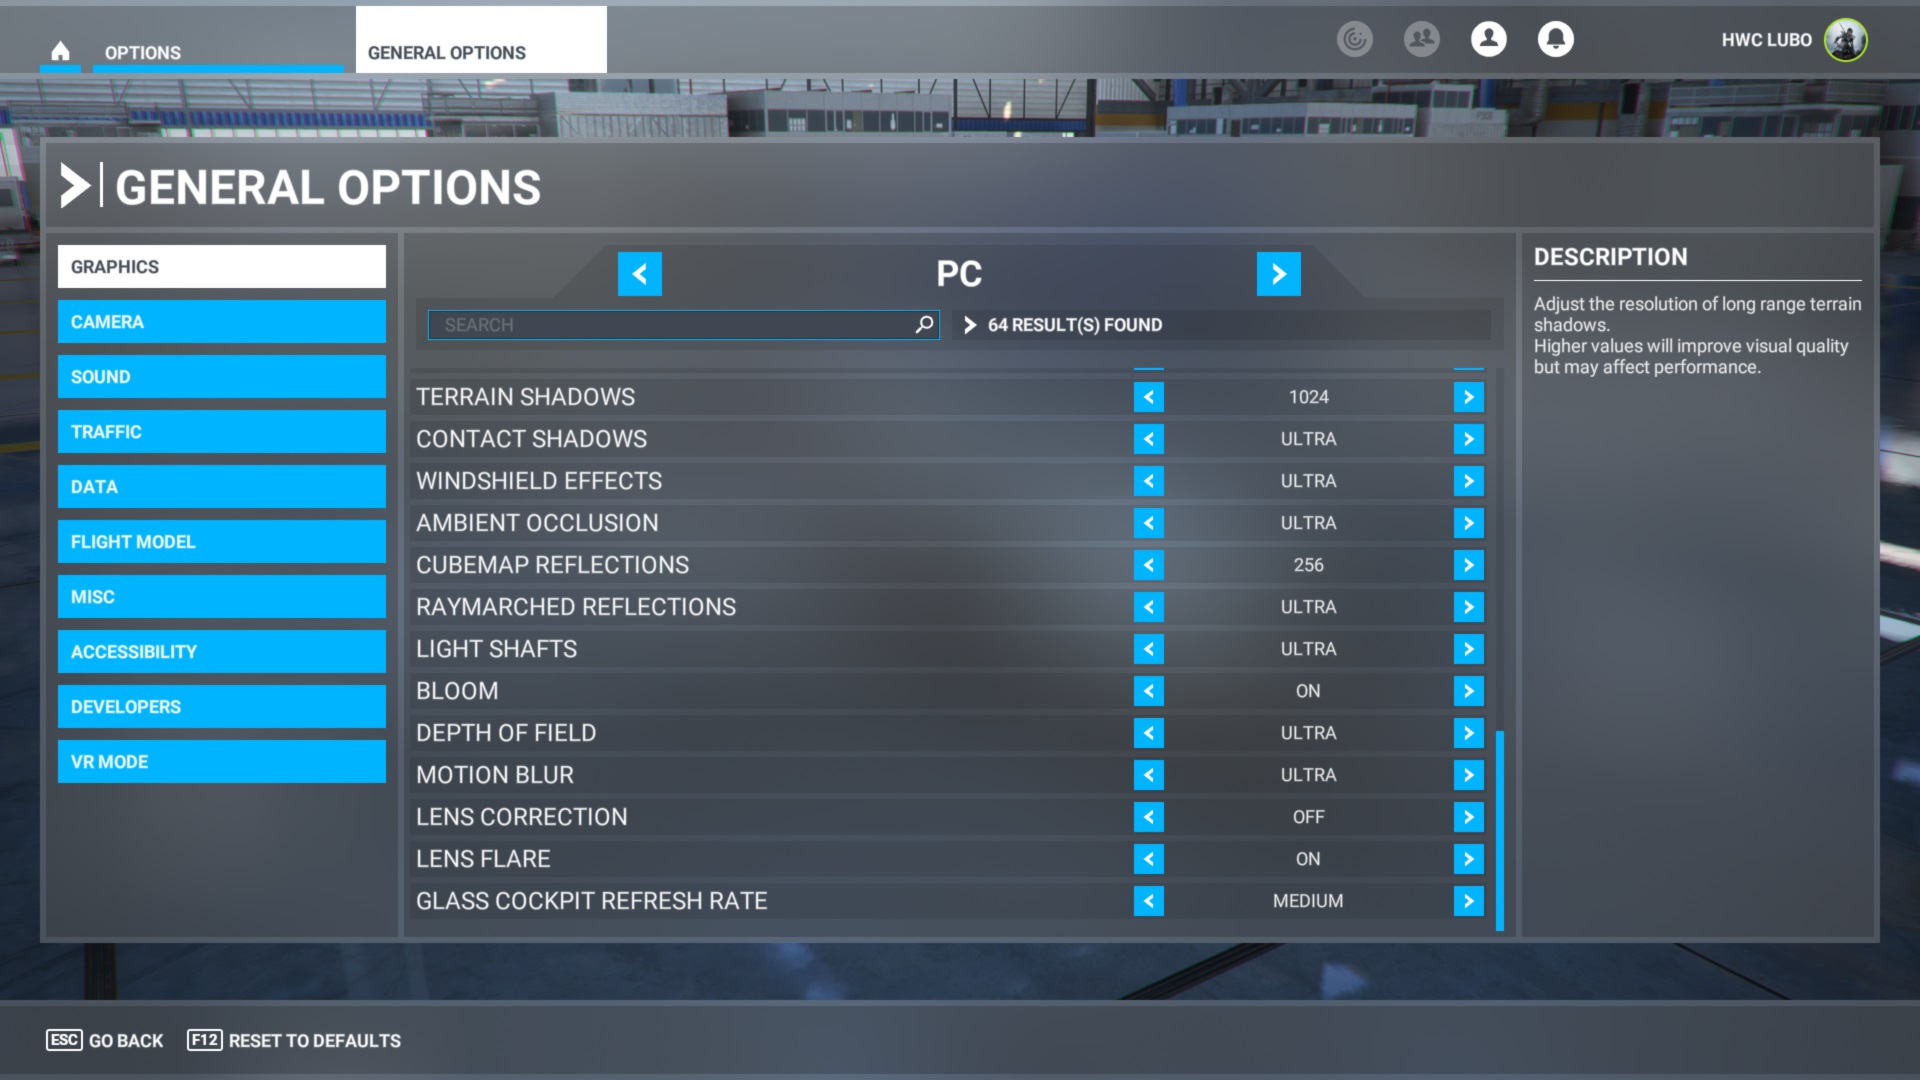
Microsoft Flight Simulator
Disclaimer: We do not use the results from this game to calculate the average gaming performance. This is because the performance of the game often changes due to updates, and when this happens, we start building the results database from scratch. To check the consistency of the MFS results, we run a test scene with the MSI RTX 3080 Gaming X Trio before testing each new graphics card.
Test platform custom scene (Paris-Charles de Gaulle, Air Traffic: AI, February 14, 9:00 am) autopilot: from 1000 until hitting the terrain; API DirectX 11, graphics settings preset Ultra; TAA; no extra settings.


After the GeForce RTX 4080 graphics cards, which wasn’t to many people’s taste due to the higher price, Nvidia has released a significantly cheaper GPU for the GeForce RTX 4070 Ti. The performance versus the RTX 4080 is admittedly noticeably weaker, but percentage-wise not by as much as the roughly two-thirds lower price of the RTX 4070 Ti. In our tests, we analyze MSI’s non-reference design from the top-of-the-line Suprim X series.
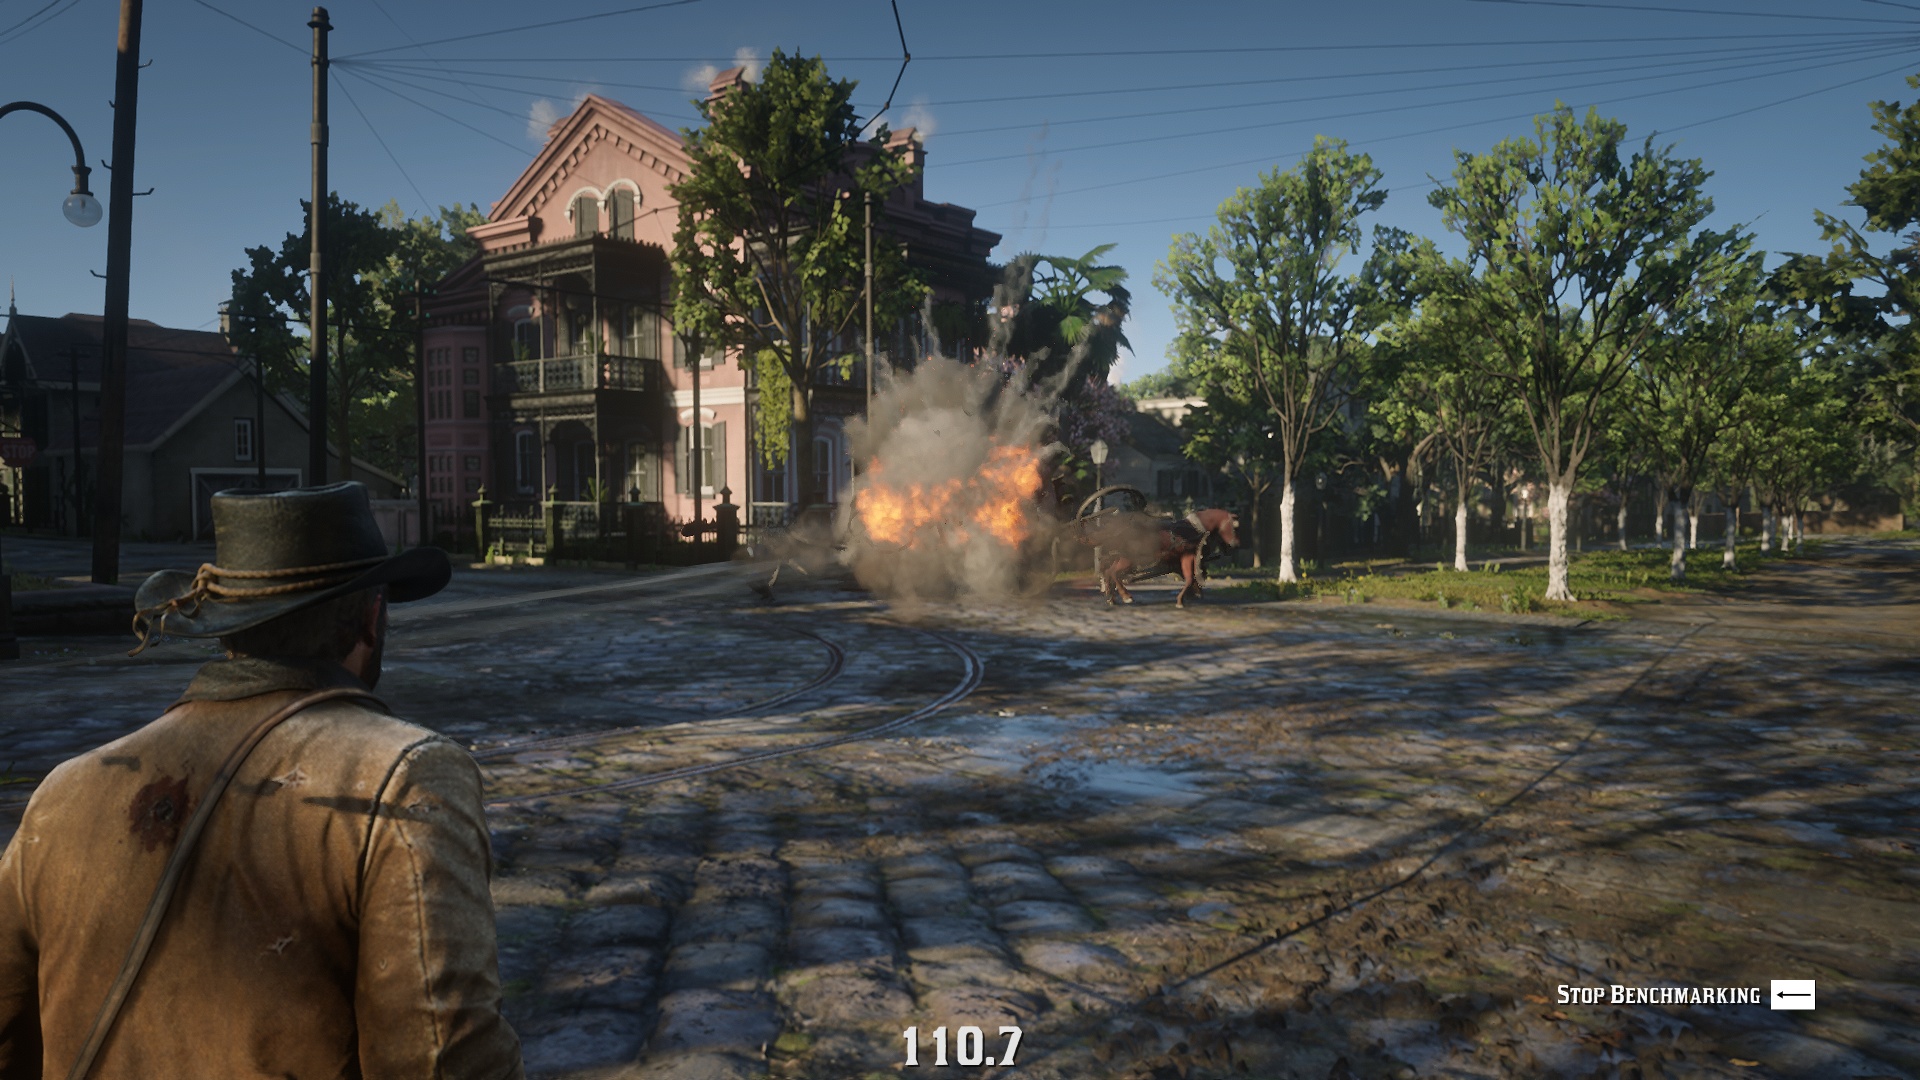
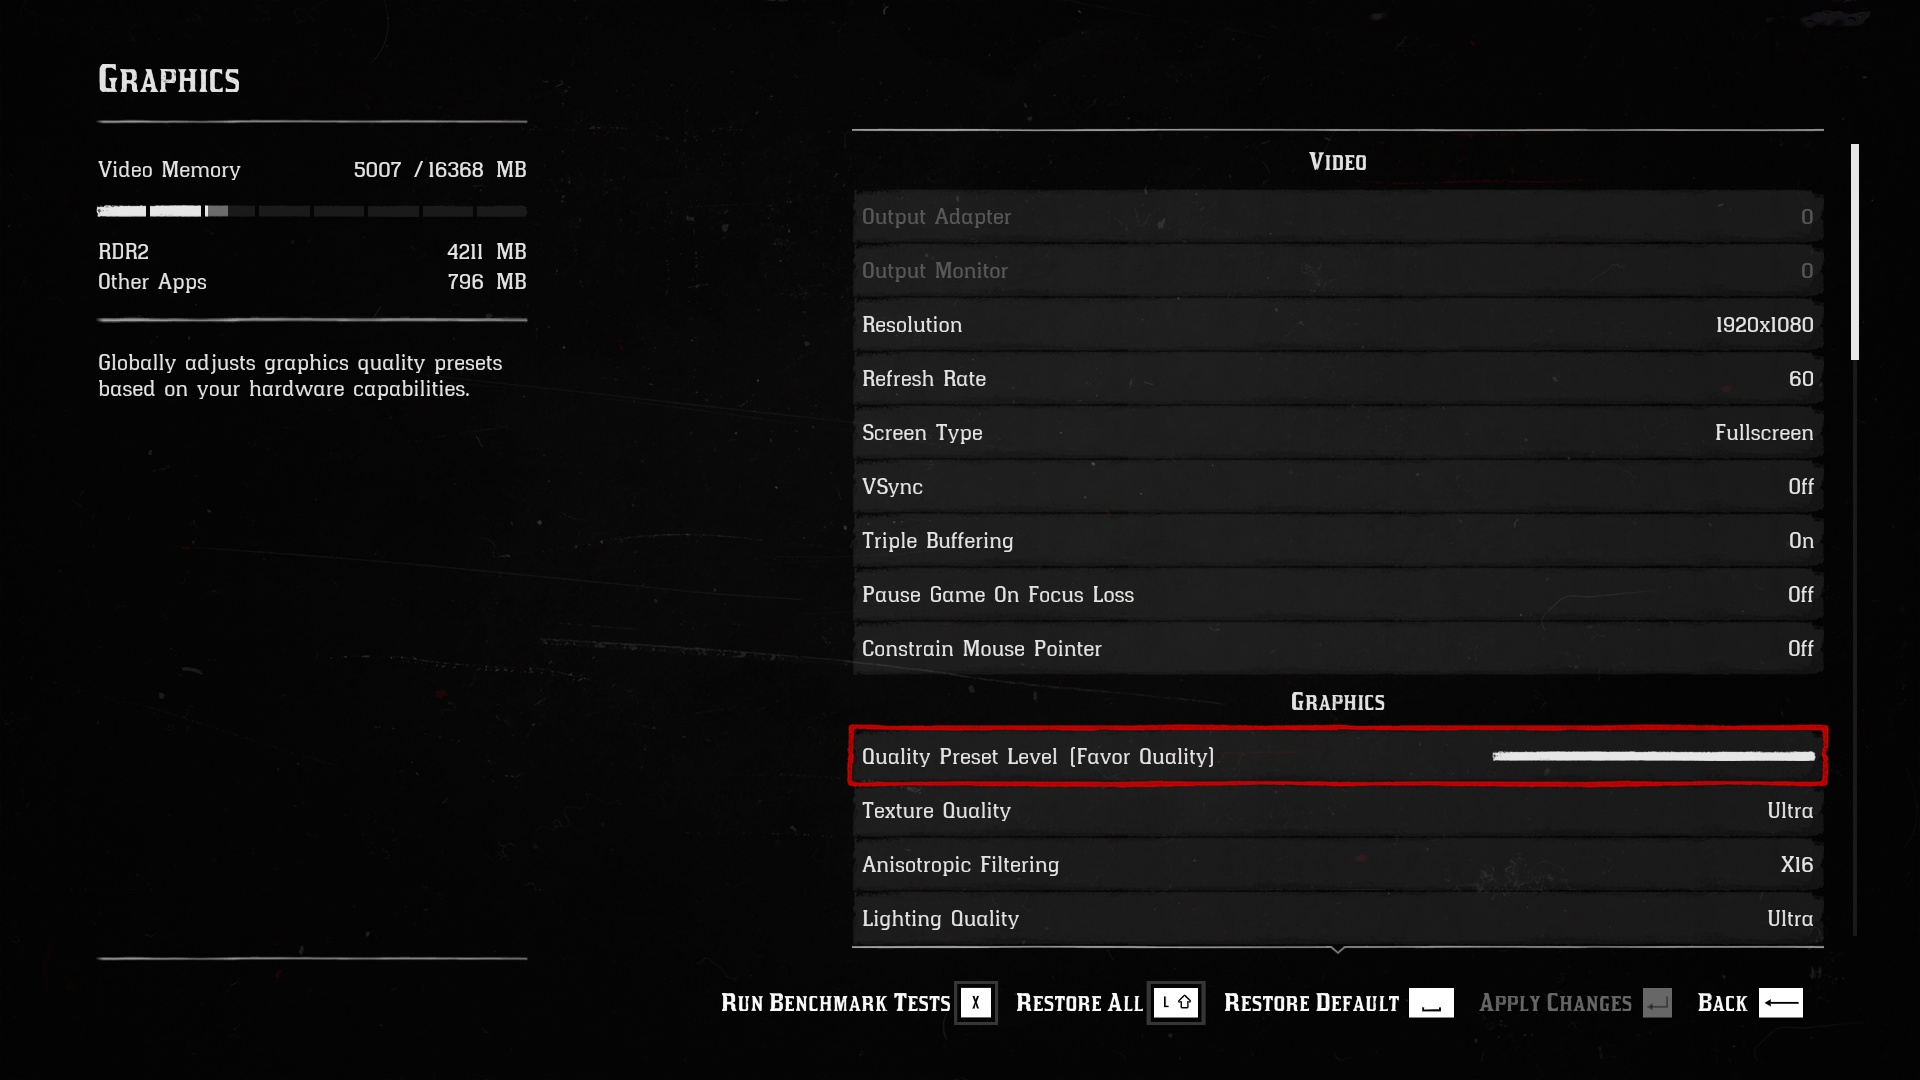
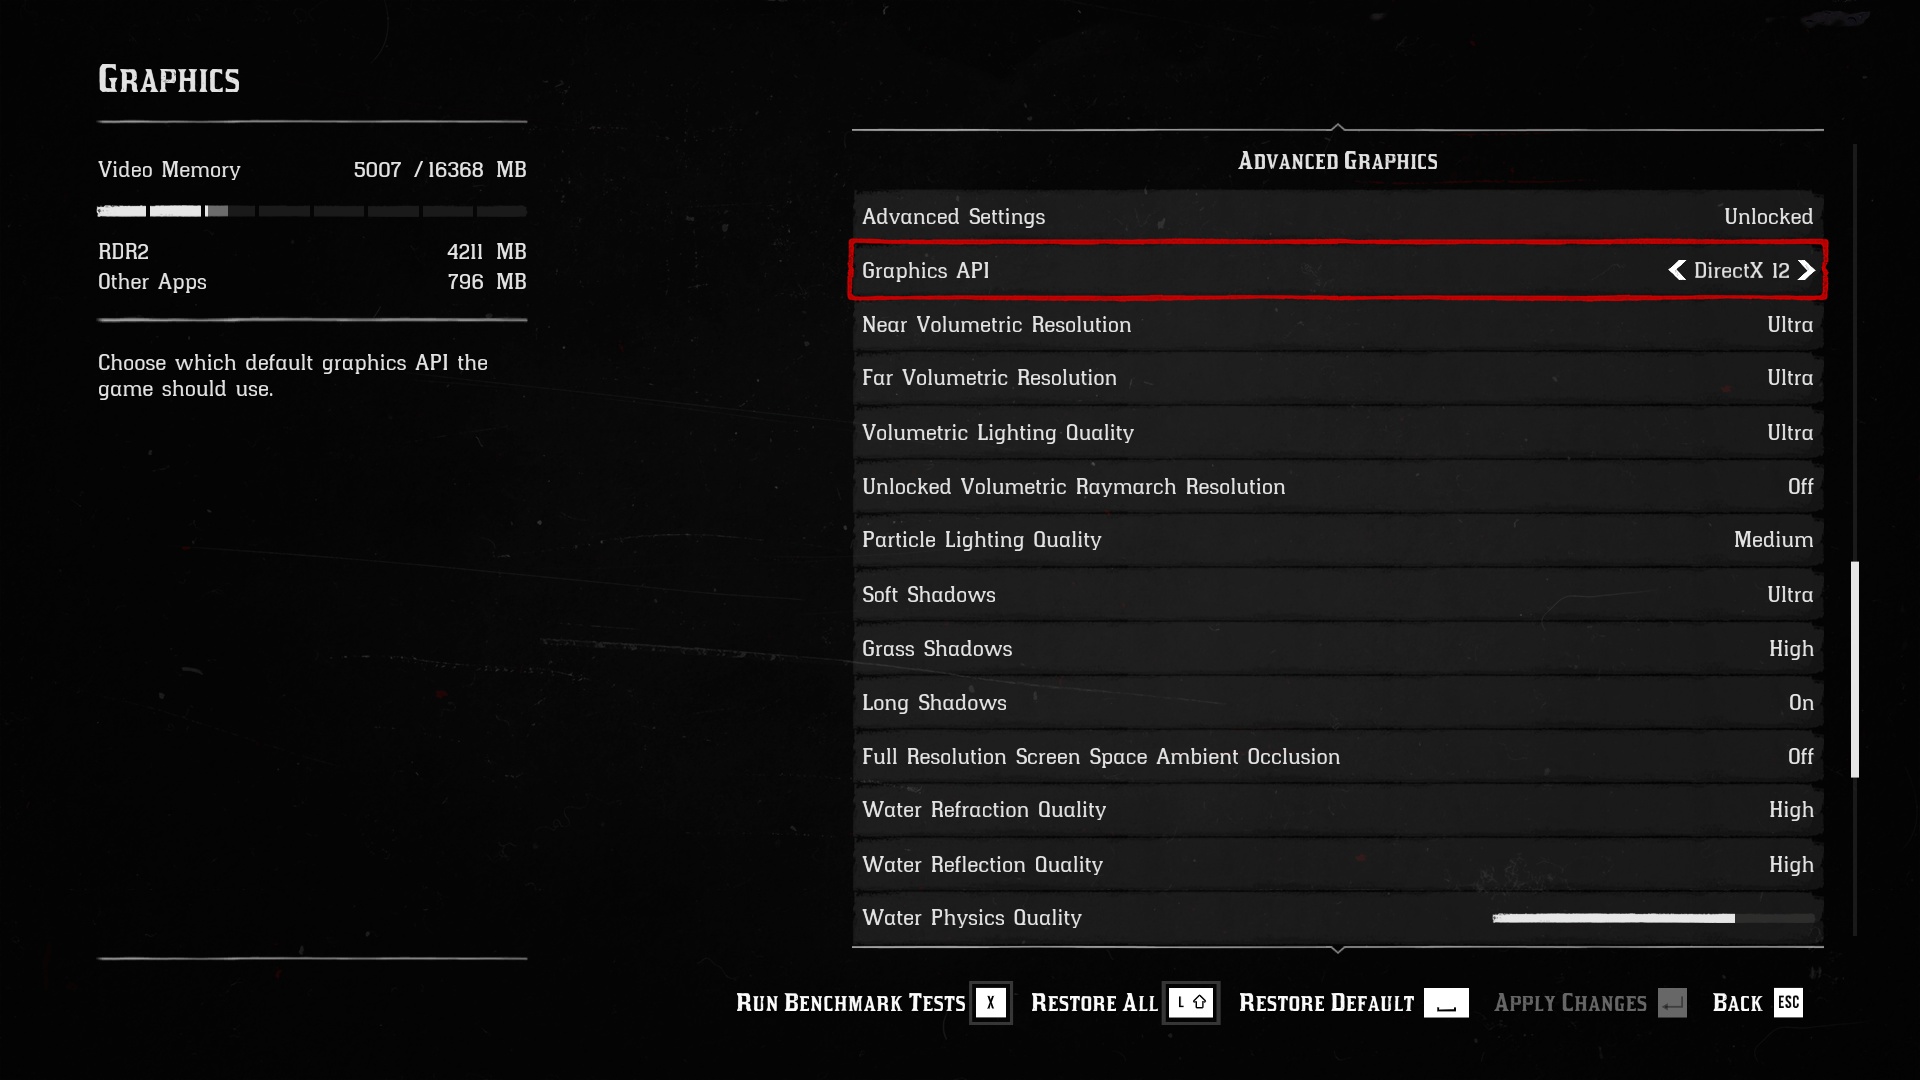
Red Dead Redemption 2 (Vulkan)
Test platform custom scene; API Vulkan, graphics settings preset Favor Quality; no extra settings.


After the GeForce RTX 4080 graphics cards, which wasn’t to many people’s taste due to the higher price, Nvidia has released a significantly cheaper GPU for the GeForce RTX 4070 Ti. The performance versus the RTX 4080 is admittedly noticeably weaker, but percentage-wise not by as much as the roughly two-thirds lower price of the RTX 4070 Ti. In our tests, we analyze MSI’s non-reference design from the top-of-the-line Suprim X series.
Red Dead Redemption 2 (Dx12)
Test platform custom scene; API DirectX 12, graphics settings preset Favor Quality; no extra settings.
After the GeForce RTX 4080 graphics cards, which wasn’t to many people’s taste due to the higher price, Nvidia has released a significantly cheaper GPU for the GeForce RTX 4070 Ti. The performance versus the RTX 4080 is admittedly noticeably weaker, but percentage-wise not by as much as the roughly two-thirds lower price of the RTX 4070 Ti. In our tests, we analyze MSI’s non-reference design from the top-of-the-line Suprim X series.
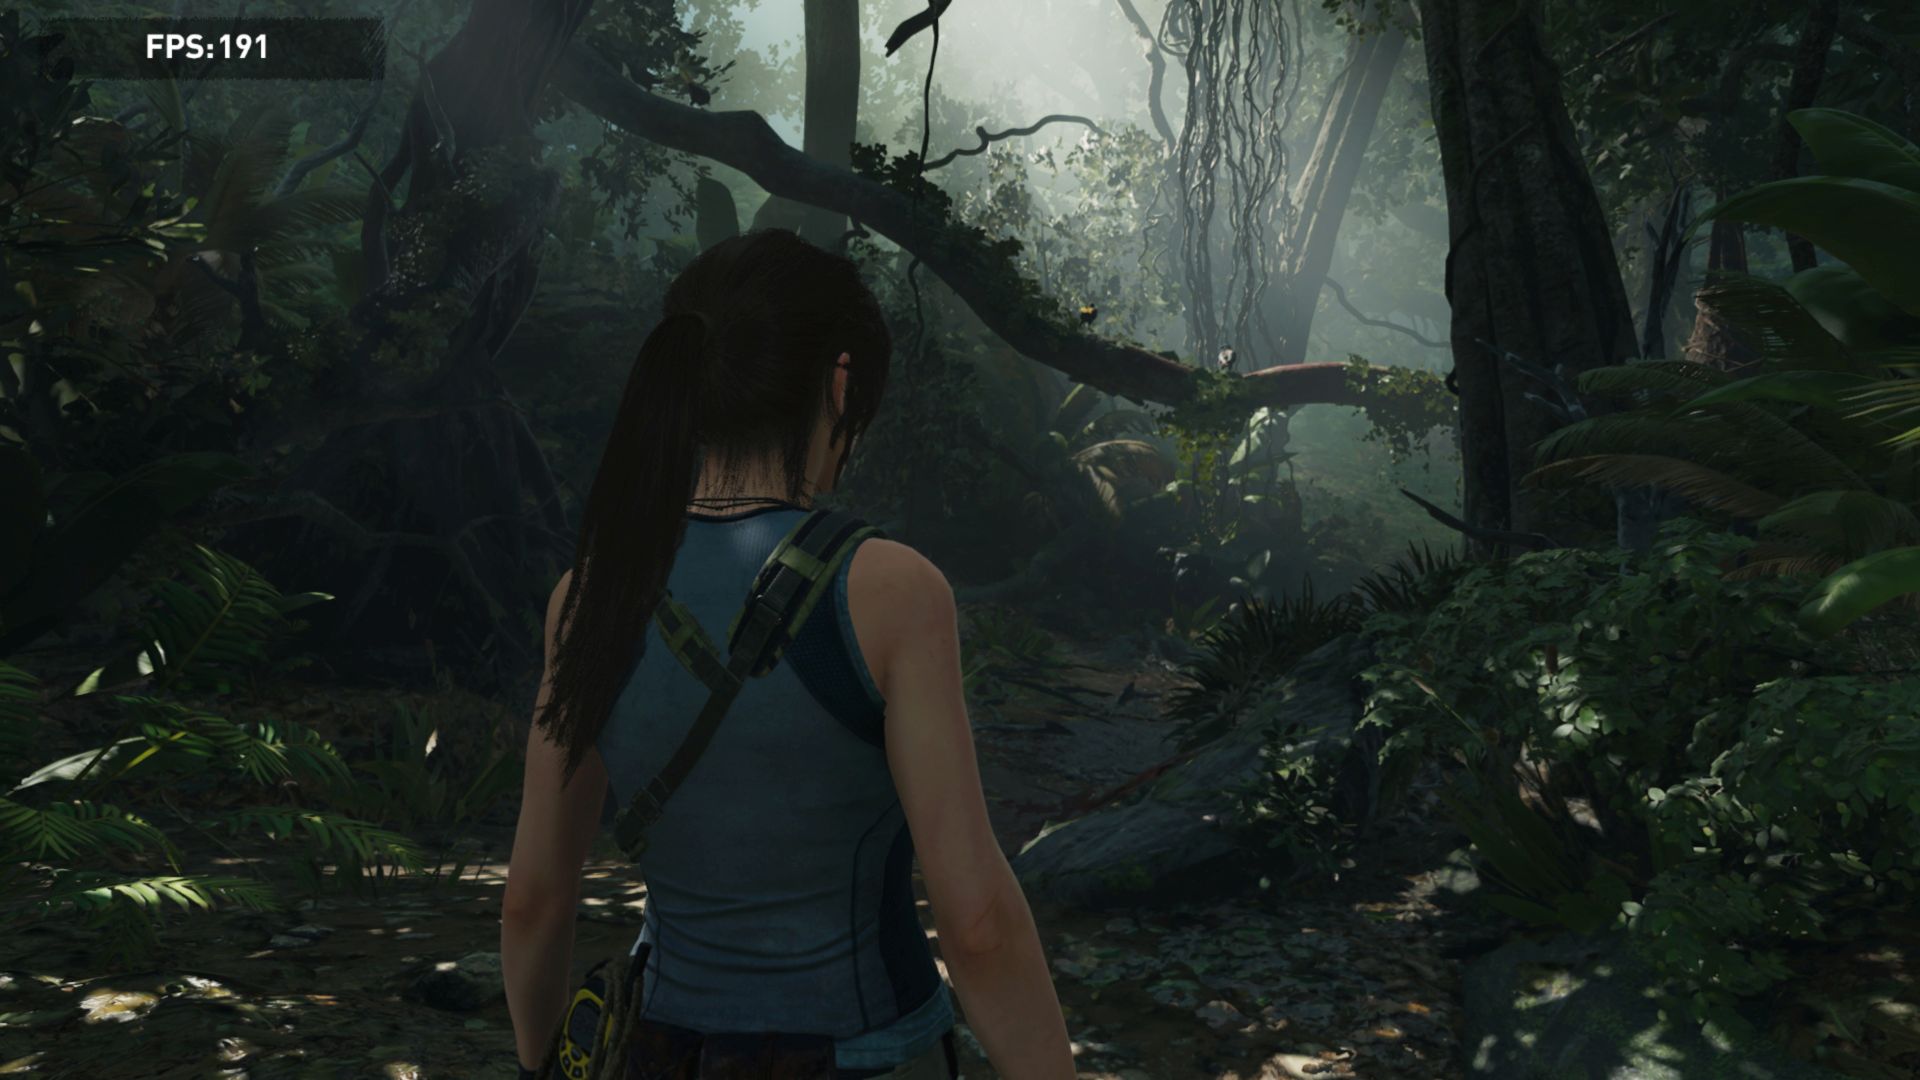
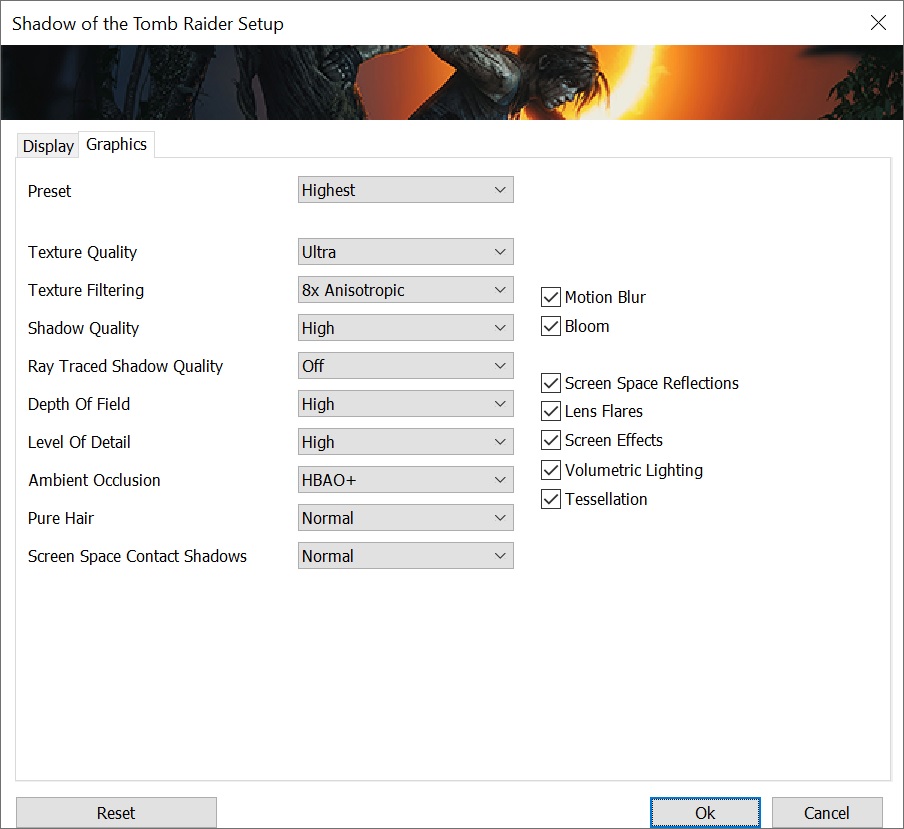
Shadow of the Tomb Raider
Test platform custom scene; API DirectX 12, graphics settings preset Highest; TAA; no extra settings.

After the GeForce RTX 4080 graphics cards, which wasn’t to many people’s taste due to the higher price, Nvidia has released a significantly cheaper GPU for the GeForce RTX 4070 Ti. The performance versus the RTX 4080 is admittedly noticeably weaker, but percentage-wise not by as much as the roughly two-thirds lower price of the RTX 4070 Ti. In our tests, we analyze MSI’s non-reference design from the top-of-the-line Suprim X series.
Shadow of the Tomb Raider with DXR
Test platform benchmark; API DirectX 12, graphics settings preset Highest; extra settings DXR.

Note: This game also supports DLSS and FidelityFX CAS, but since this is an older title and there are more than enough tests, we will not address this setting in standard tests. However, testing on request is possible if you ask for it.
After the GeForce RTX 4080 graphics cards, which wasn’t to many people’s taste due to the higher price, Nvidia has released a significantly cheaper GPU for the GeForce RTX 4070 Ti. The performance versus the RTX 4080 is admittedly noticeably weaker, but percentage-wise not by as much as the roughly two-thirds lower price of the RTX 4070 Ti. In our tests, we analyze MSI’s non-reference design from the top-of-the-line Suprim X series.
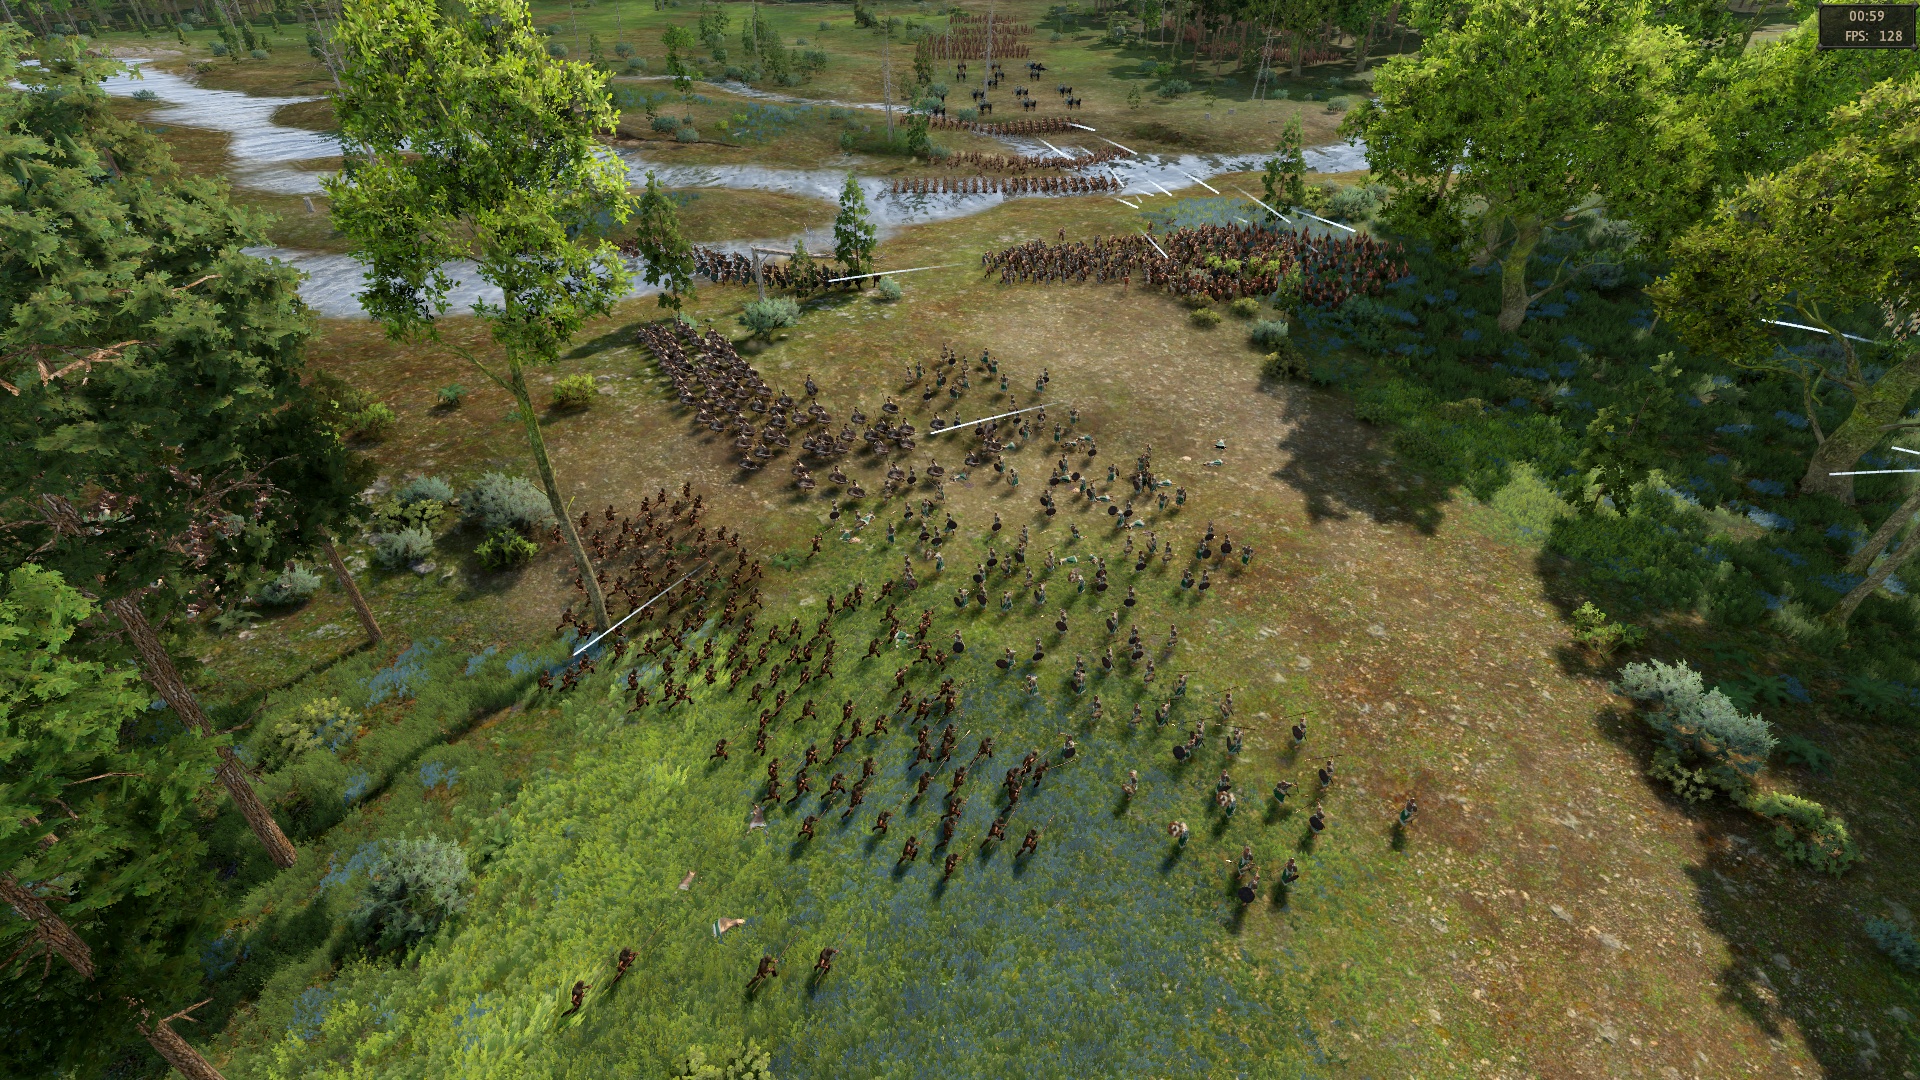
Total War Saga: Troy
Test platform benchmark; API DirectX 11, graphics settings preset Ultra; 4× AA, no extra settings.
After the GeForce RTX 4080 graphics cards, which wasn’t to many people’s taste due to the higher price, Nvidia has released a significantly cheaper GPU for the GeForce RTX 4070 Ti. The performance versus the RTX 4080 is admittedly noticeably weaker, but percentage-wise not by as much as the roughly two-thirds lower price of the RTX 4070 Ti. In our tests, we analyze MSI’s non-reference design from the top-of-the-line Suprim X series.
Wasteland 3
Test platform custom scene; API DirectX 11, graphics settings preset Ultra; no extra settings.
After the GeForce RTX 4080 graphics cards, which wasn’t to many people’s taste due to the higher price, Nvidia has released a significantly cheaper GPU for the GeForce RTX 4070 Ti. The performance versus the RTX 4080 is admittedly noticeably weaker, but percentage-wise not by as much as the roughly two-thirds lower price of the RTX 4070 Ti. In our tests, we analyze MSI’s non-reference design from the top-of-the-line Suprim X series.
Overall gaming performance
We calculate the average performance so that each game has an equal weight on the result. You can find out exactly how we arrive at the result in this article.
Performance per euro
After the GeForce RTX 4080 graphics cards, which wasn’t to many people’s taste due to the higher price, Nvidia has released a significantly cheaper GPU for the GeForce RTX 4070 Ti. The performance versus the RTX 4080 is admittedly noticeably weaker, but percentage-wise not by as much as the roughly two-thirds lower price of the RTX 4070 Ti. In our tests, we analyze MSI’s non-reference design from the top-of-the-line Suprim X series.
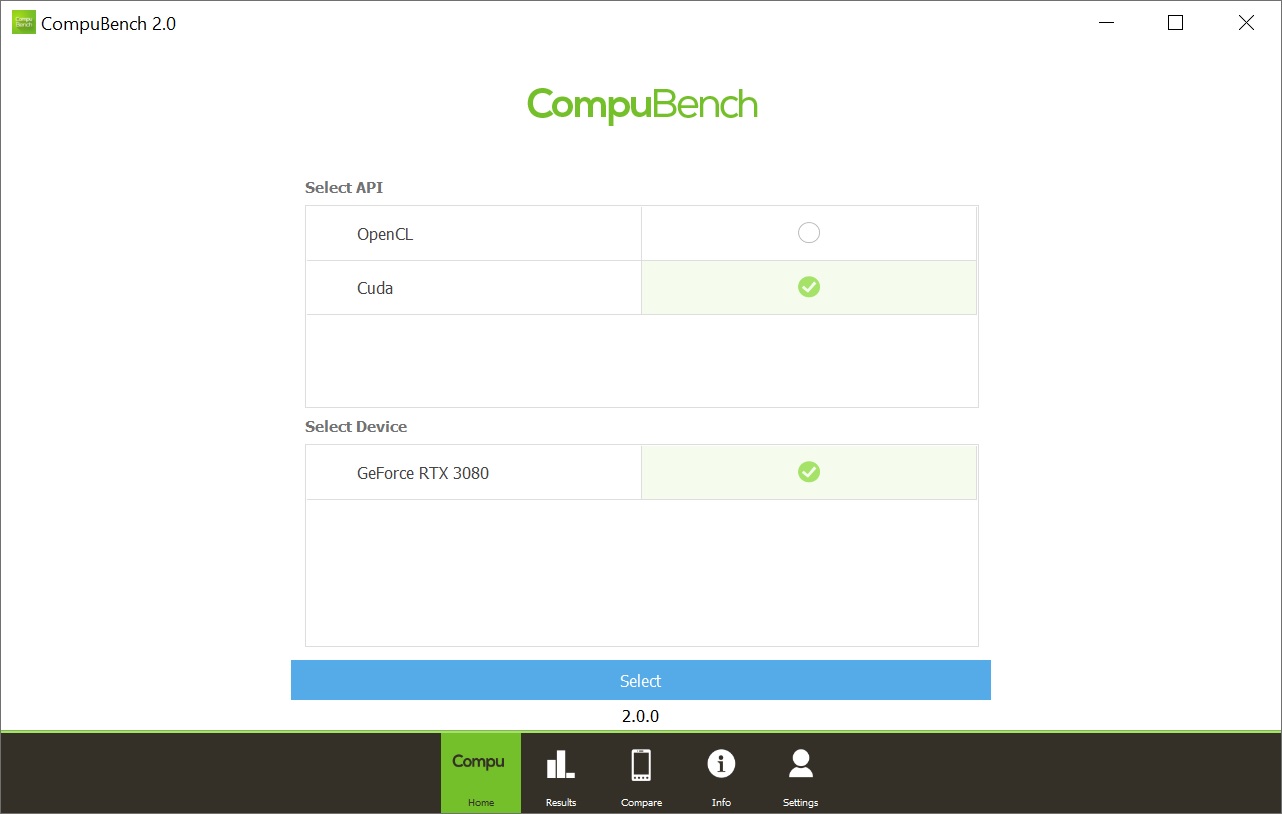
CompuBench 2.0 (OpenCL)
Test platform benchmark; API OpenCL; no extra settings.
Game Effects
Advanced Compute


High Quality Computer Generated Imagery and Rendering
Computer Vision
After the GeForce RTX 4080 graphics cards, which wasn’t to many people’s taste due to the higher price, Nvidia has released a significantly cheaper GPU for the GeForce RTX 4070 Ti. The performance versus the RTX 4080 is admittedly noticeably weaker, but percentage-wise not by as much as the roughly two-thirds lower price of the RTX 4070 Ti. In our tests, we analyze MSI’s non-reference design from the top-of-the-line Suprim X series.
SPECviewperf 2020
Test platform benchmark; API OpenGL and DirectX; no extra settings.
SPECworkstation 3
After the GeForce RTX 4080 graphics cards, which wasn’t to many people’s taste due to the higher price, Nvidia has released a significantly cheaper GPU for the GeForce RTX 4070 Ti. The performance versus the RTX 4080 is admittedly noticeably weaker, but percentage-wise not by as much as the roughly two-thirds lower price of the RTX 4070 Ti. In our tests, we analyze MSI’s non-reference design from the top-of-the-line Suprim X series.

FLOPS, IOPS and memory speed tests
Test platform benchmark; app version 6.32.5600; no extra settings.
After the GeForce RTX 4080 graphics cards, which wasn’t to many people’s taste due to the higher price, Nvidia has released a significantly cheaper GPU for the GeForce RTX 4070 Ti. The performance versus the RTX 4080 is admittedly noticeably weaker, but percentage-wise not by as much as the roughly two-thirds lower price of the RTX 4070 Ti. In our tests, we analyze MSI’s non-reference design from the top-of-the-line Suprim X series.
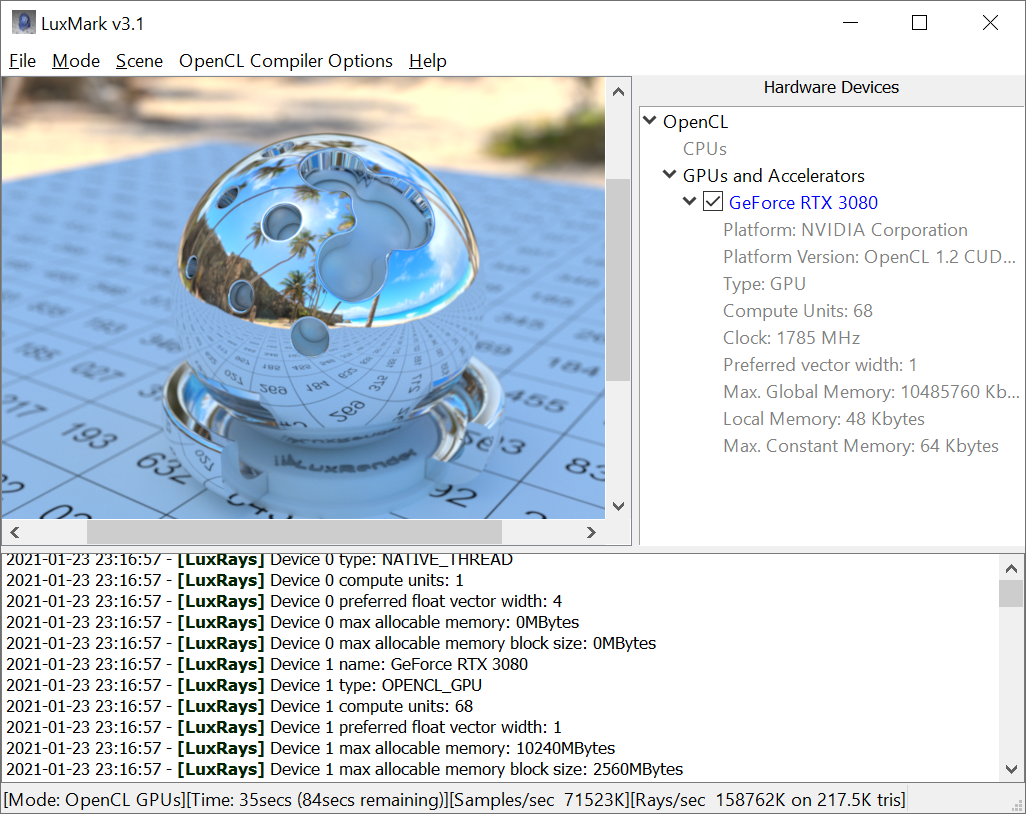
LuxMark
Test platform benchmark; API OpenCL; no extra settings.
Blender@Cycles
Test platform render BMW and Classroom; renderer Cycles, 12 tiles; extra settings: OpenCL for Radeon and CUDA for GeForce, the way most people will use it. OpenCL with GeForce is always slow because path tracing does not support GPU acceleration and is calculated by the CPU. Nvidia OptiX is tested separately on supported cards (GeForce RTX) and the results are drawn separately.

After the GeForce RTX 4080 graphics cards, which wasn’t to many people’s taste due to the higher price, Nvidia has released a significantly cheaper GPU for the GeForce RTX 4070 Ti. The performance versus the RTX 4080 is admittedly noticeably weaker, but percentage-wise not by as much as the roughly two-thirds lower price of the RTX 4070 Ti. In our tests, we analyze MSI’s non-reference design from the top-of-the-line Suprim X series.
Blender@Radeon ProRender
Test platform render BMW and Classroom; renderer Radeon ProRender, 1024 samples. Extra settings are OpenCL for Radeon and CUDA for GeForce. Nvidia OptiX is tested separately on supported graphics cards (GeForce RTX) and the results are drawn separately.
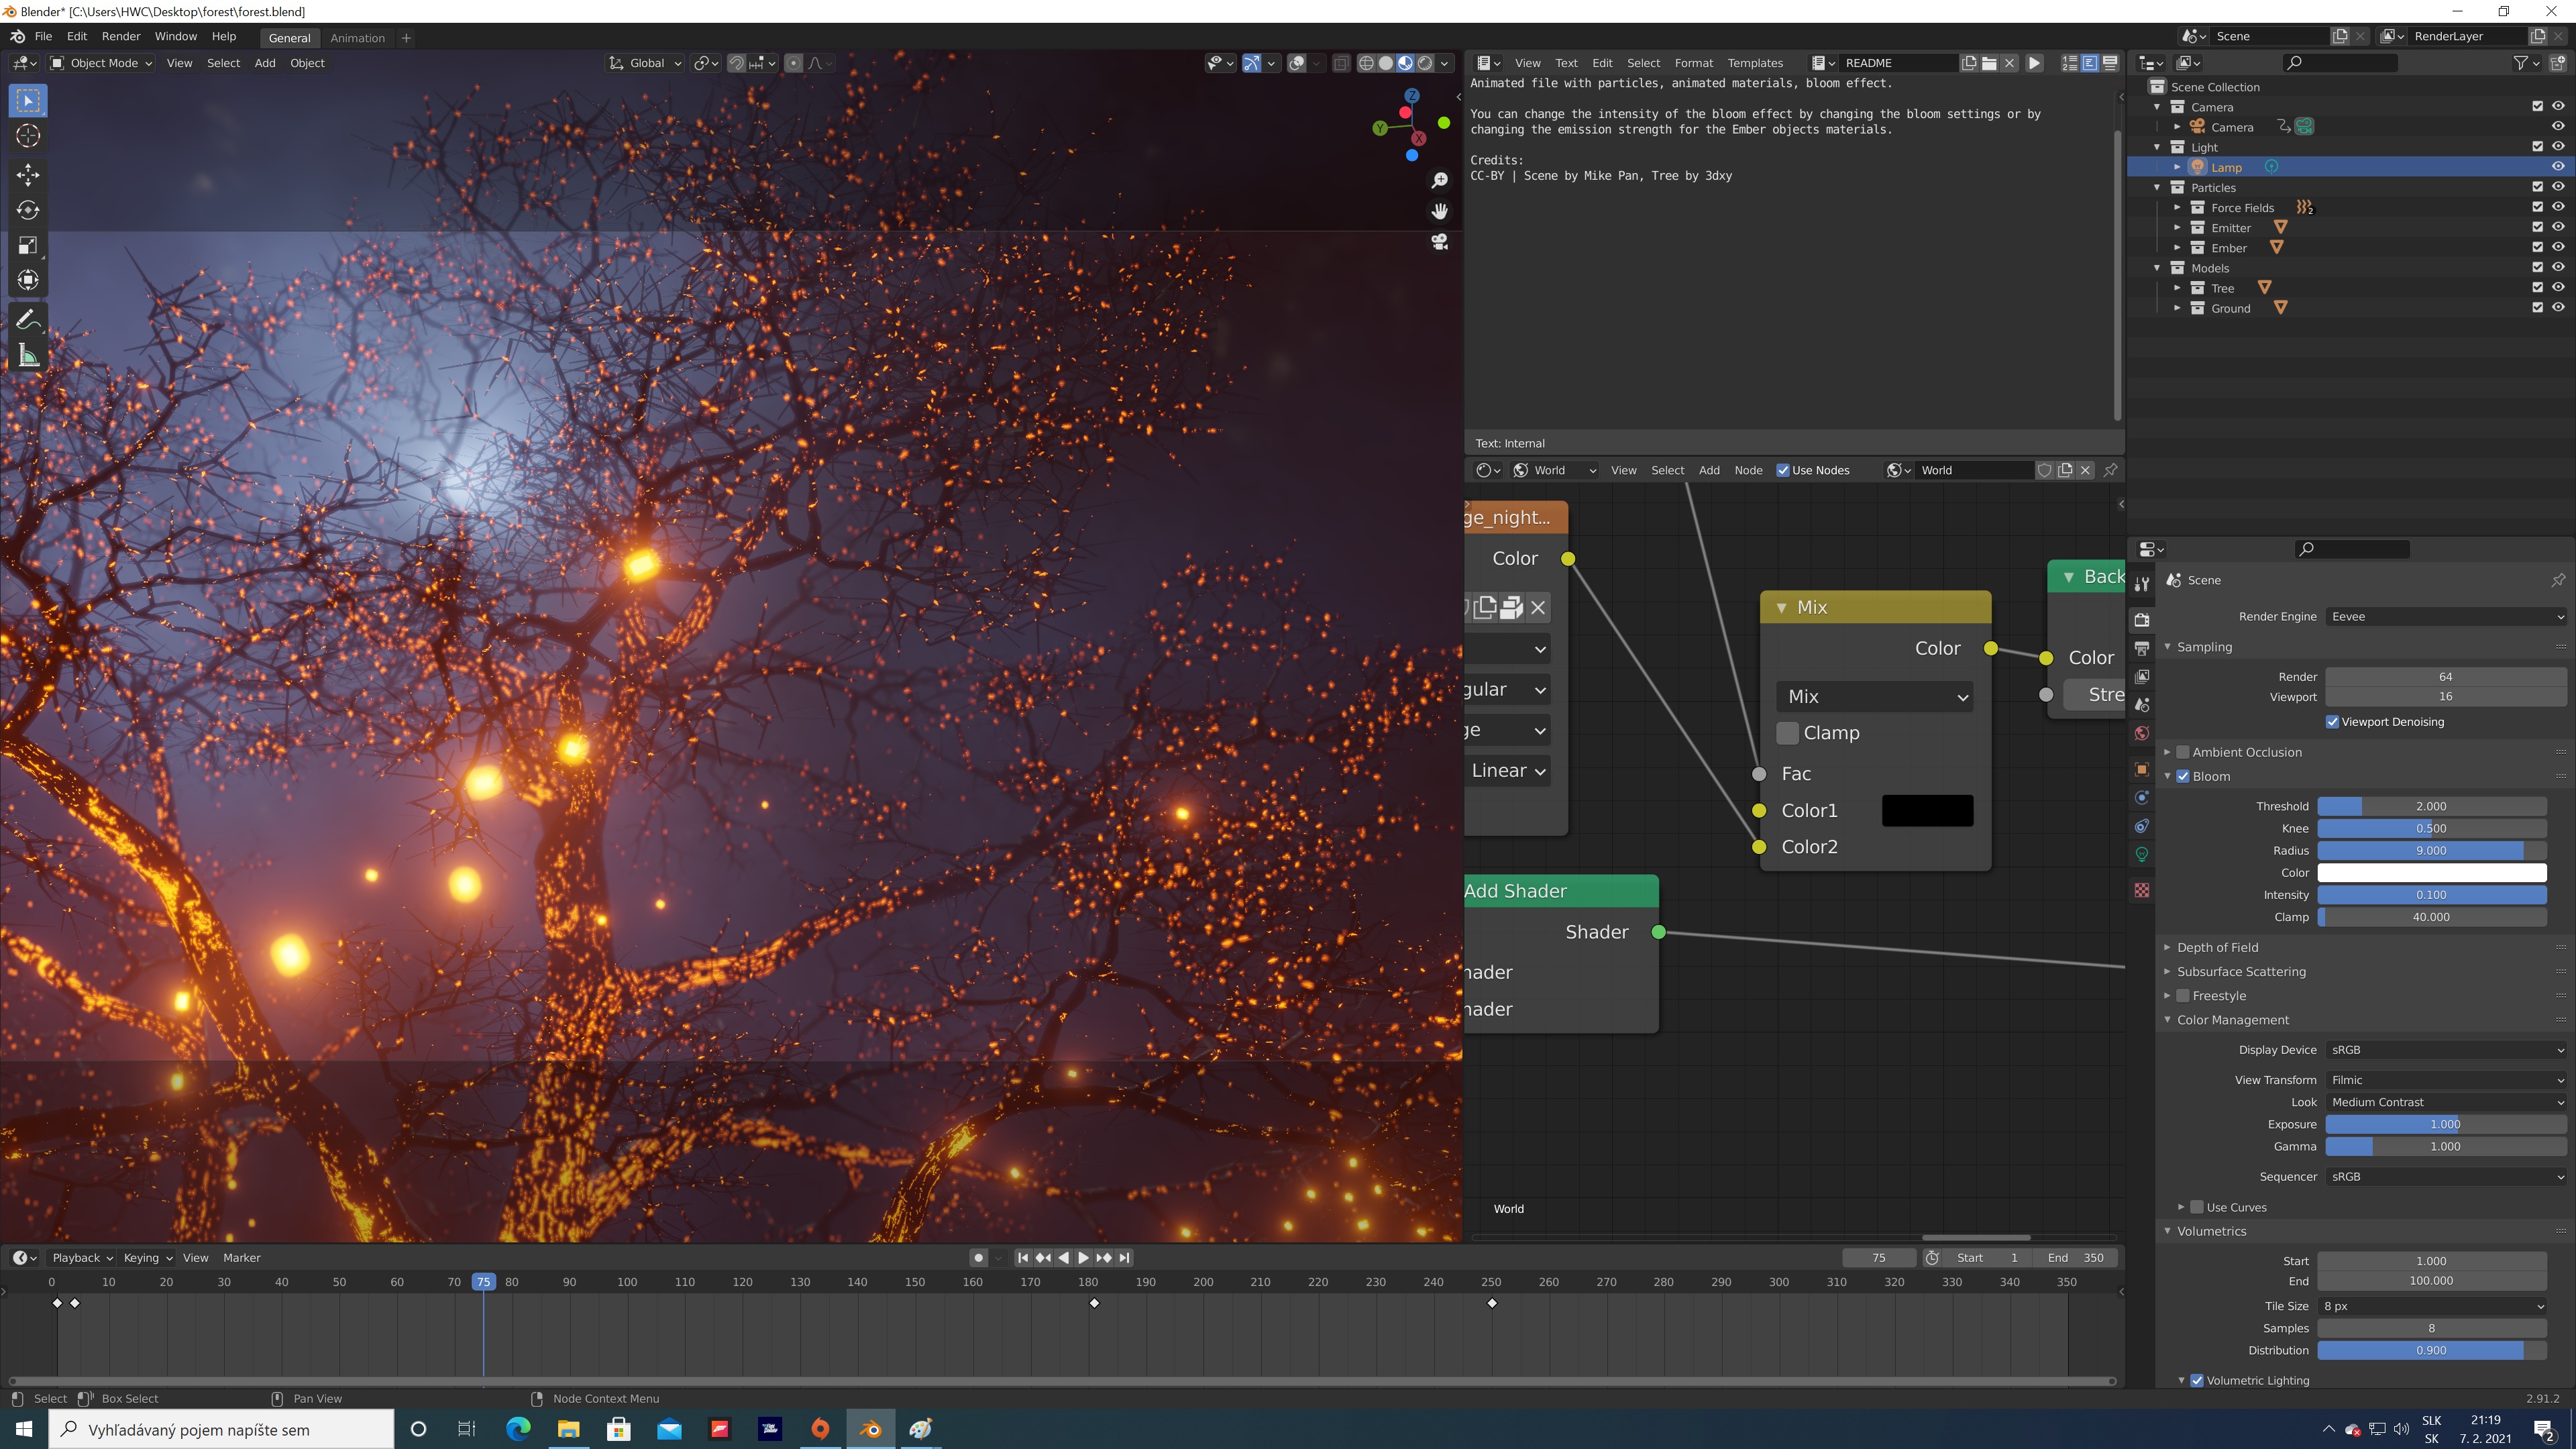
Blender@Eevee
Test platform animation render Ember Forest; renderer Eevee, 350 images; extra settings OpenCL.
After the GeForce RTX 4080 graphics cards, which wasn’t to many people’s taste due to the higher price, Nvidia has released a significantly cheaper GPU for the GeForce RTX 4070 Ti. The performance versus the RTX 4080 is admittedly noticeably weaker, but percentage-wise not by as much as the roughly two-thirds lower price of the RTX 4070 Ti. In our tests, we analyze MSI’s non-reference design from the top-of-the-line Suprim X series.
Photo editing
Adobe Photoshop: Test platform PugetBench; no extra settings.
Affinity Photo: Test platform built-in benchmark; no extra settings.
Adobe Lightroom: Test platform custom1-gigabyte archive of 42 raw photos (CR2) taken with DSLR; no extra settings.

After the GeForce RTX 4080 graphics cards, which wasn’t to many people’s taste due to the higher price, Nvidia has released a significantly cheaper GPU for the GeForce RTX 4070 Ti. The performance versus the RTX 4080 is admittedly noticeably weaker, but percentage-wise not by as much as the roughly two-thirds lower price of the RTX 4070 Ti. In our tests, we analyze MSI’s non-reference design from the top-of-the-line Suprim X series.
Broadcasting
OBS Studio and XSplit: Test platform F1 2020 game benchmark; extra settings – enabled encoders AMD VCE/Nvidia Nvenc (AVC/H.264), output resolution 2560 × 1440 px (60 fps), target bitrate 19,700 kbps.
After the GeForce RTX 4080 graphics cards, which wasn’t to many people’s taste due to the higher price, Nvidia has released a significantly cheaper GPU for the GeForce RTX 4070 Ti. The performance versus the RTX 4080 is admittedly noticeably weaker, but percentage-wise not by as much as the roughly two-thirds lower price of the RTX 4070 Ti. In our tests, we analyze MSI’s non-reference design from the top-of-the-line Suprim X series.
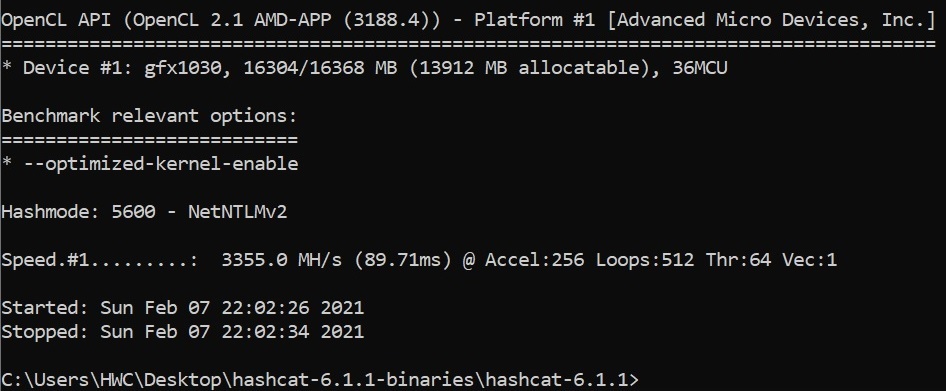
Password cracking
Test platform Hashcat; no extra settings. You can easily try the tests yourself. Just download the binary and enter the cipher you are interested in using in the command line according to the numeric code.

After the GeForce RTX 4080 graphics cards, which wasn’t to many people’s taste due to the higher price, Nvidia has released a significantly cheaper GPU for the GeForce RTX 4070 Ti. The performance versus the RTX 4080 is admittedly noticeably weaker, but percentage-wise not by as much as the roughly two-thirds lower price of the RTX 4070 Ti. In our tests, we analyze MSI’s non-reference design from the top-of-the-line Suprim X series.
GPU clock speeds
After the GeForce RTX 4080 graphics cards, which wasn’t to many people’s taste due to the higher price, Nvidia has released a significantly cheaper GPU for the GeForce RTX 4070 Ti. The performance versus the RTX 4080 is admittedly noticeably weaker, but percentage-wise not by as much as the roughly two-thirds lower price of the RTX 4070 Ti. In our tests, we analyze MSI’s non-reference design from the top-of-the-line Suprim X series.
GPU temperature
VRAM temperature
Note: If the measured value is missing for the selected graphics card, it means that it cannot be detected by the internal sensor.
After the GeForce RTX 4080 graphics cards, which wasn’t to many people’s taste due to the higher price, Nvidia has released a significantly cheaper GPU for the GeForce RTX 4070 Ti. The performance versus the RTX 4080 is admittedly noticeably weaker, but percentage-wise not by as much as the roughly two-thirds lower price of the RTX 4070 Ti. In our tests, we analyze MSI’s non-reference design from the top-of-the-line Suprim X series.
Net GPU power draw
Performance per watt
After the GeForce RTX 4080 graphics cards, which wasn’t to many people’s taste due to the higher price, Nvidia has released a significantly cheaper GPU for the GeForce RTX 4070 Ti. The performance versus the RTX 4080 is admittedly noticeably weaker, but percentage-wise not by as much as the roughly two-thirds lower price of the RTX 4070 Ti. In our tests, we analyze MSI’s non-reference design from the top-of-the-line Suprim X series.
Analysis of 12 V branch power supply (higher load)

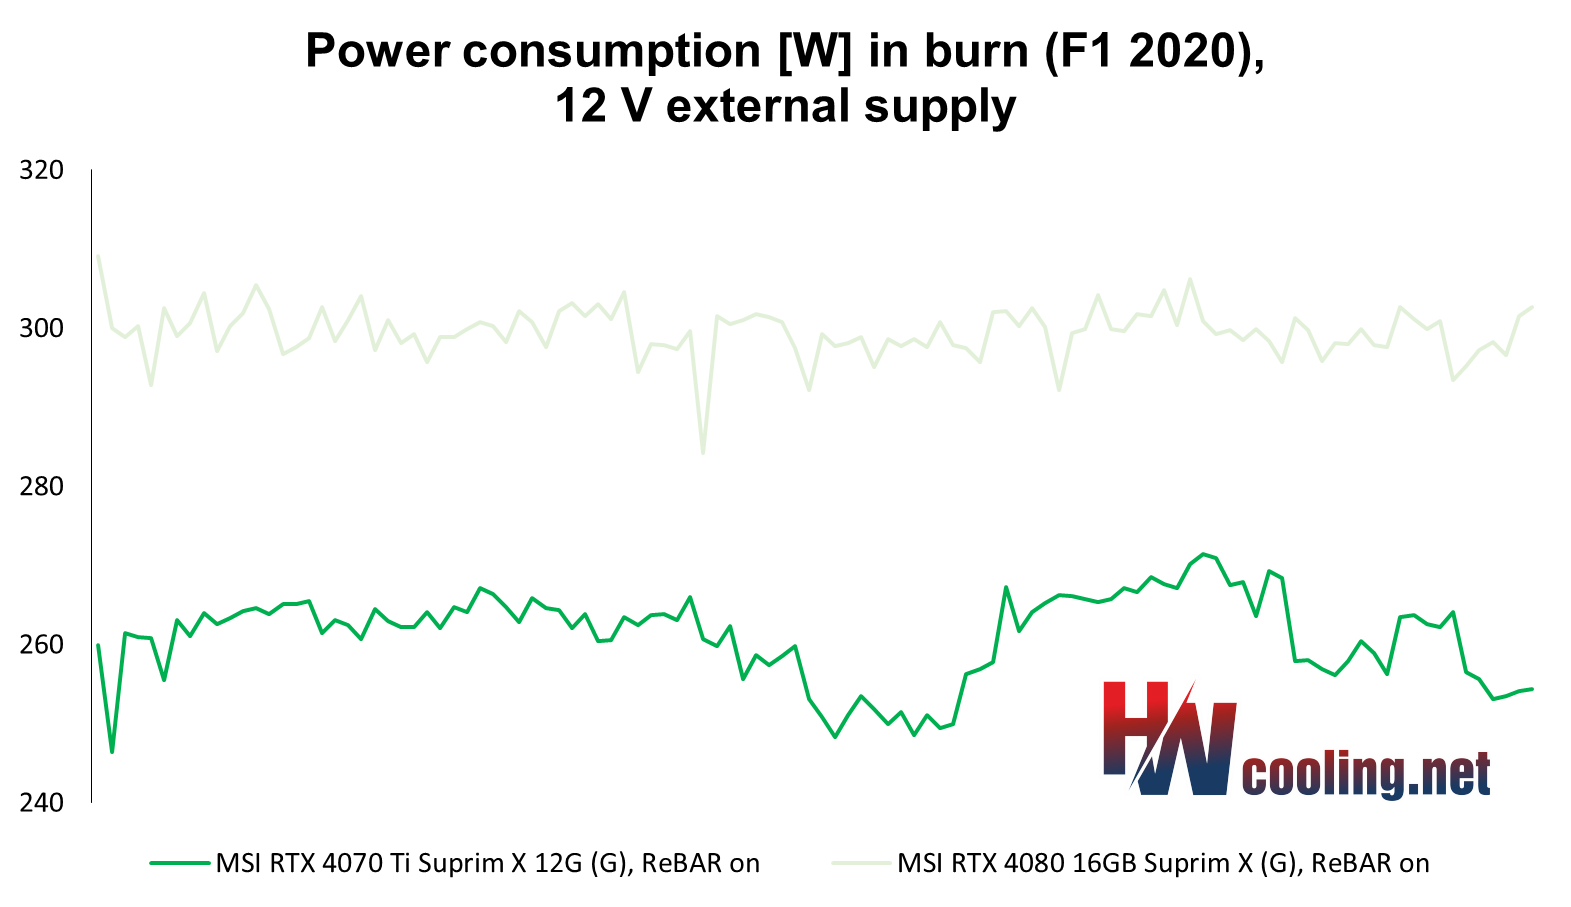
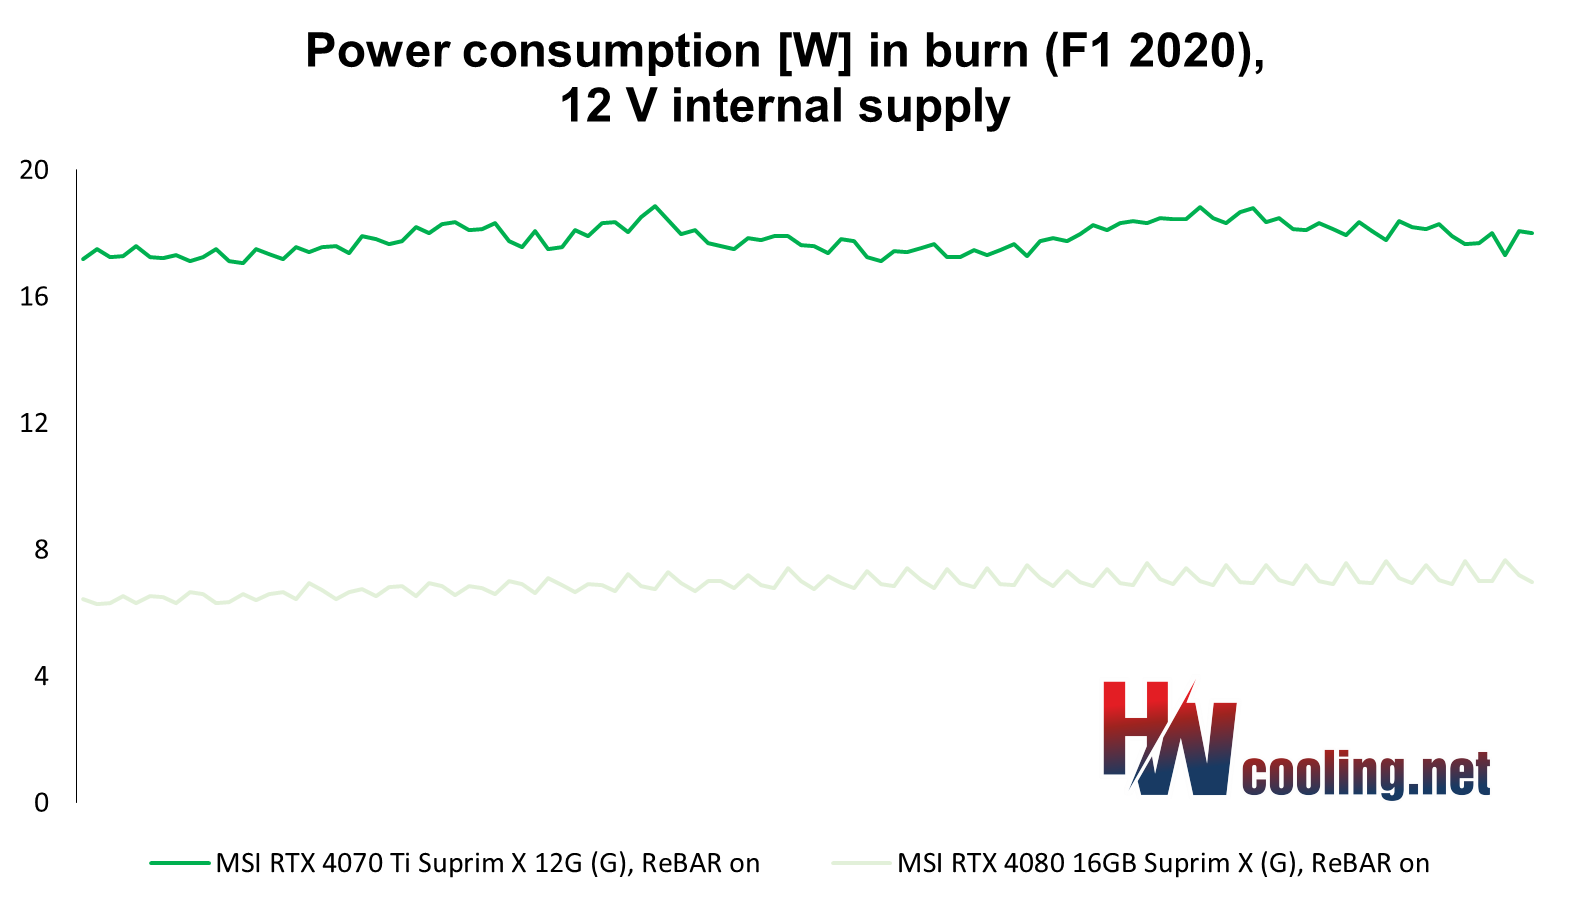
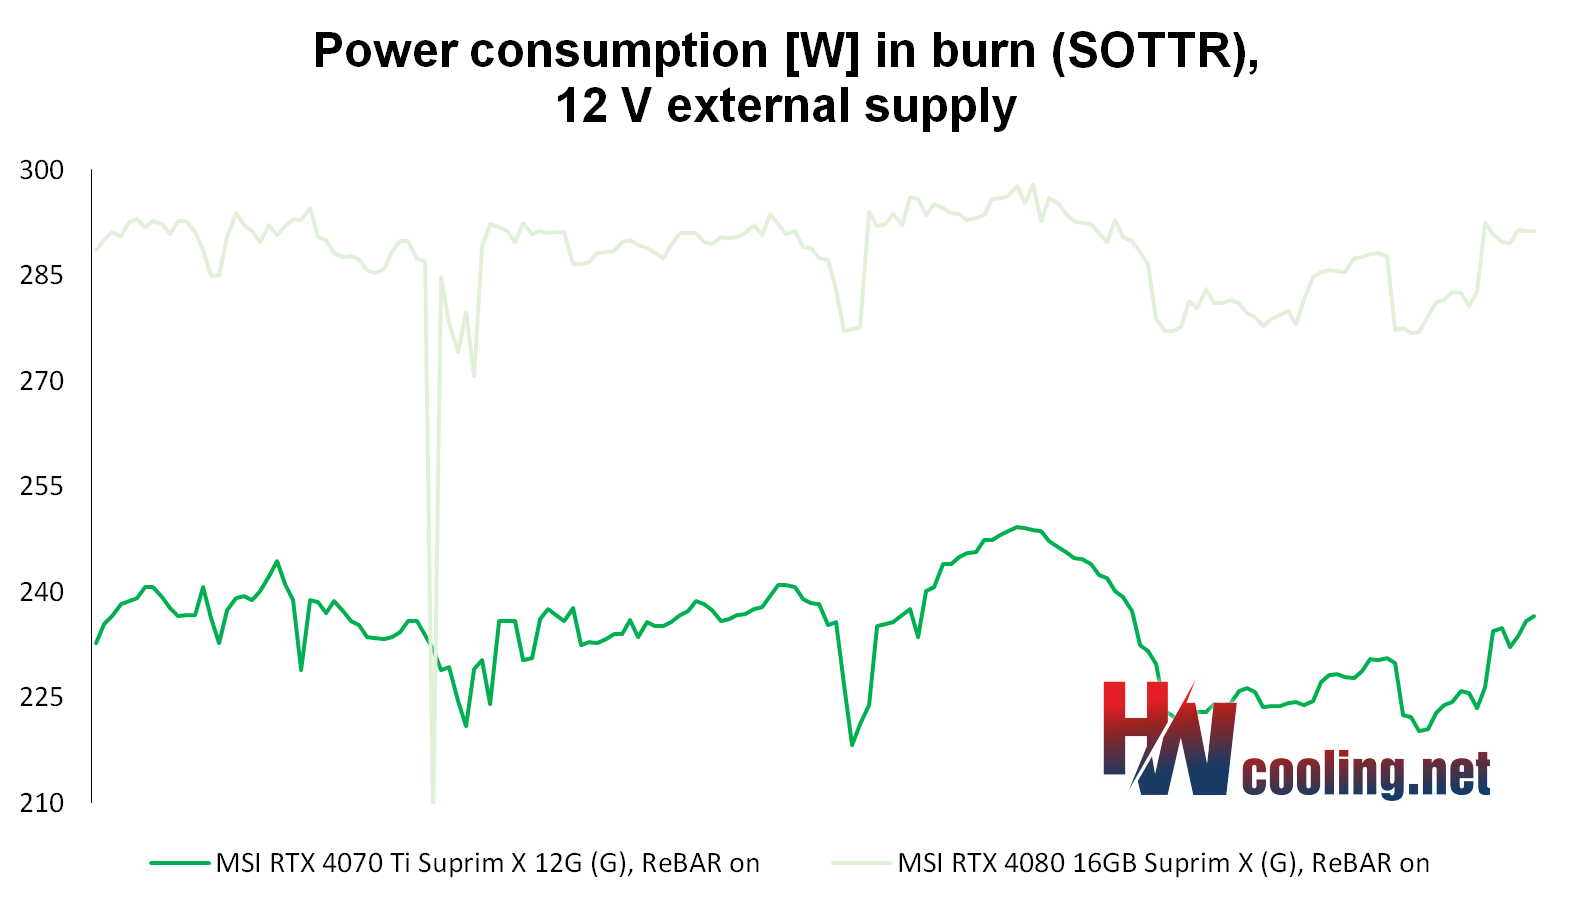
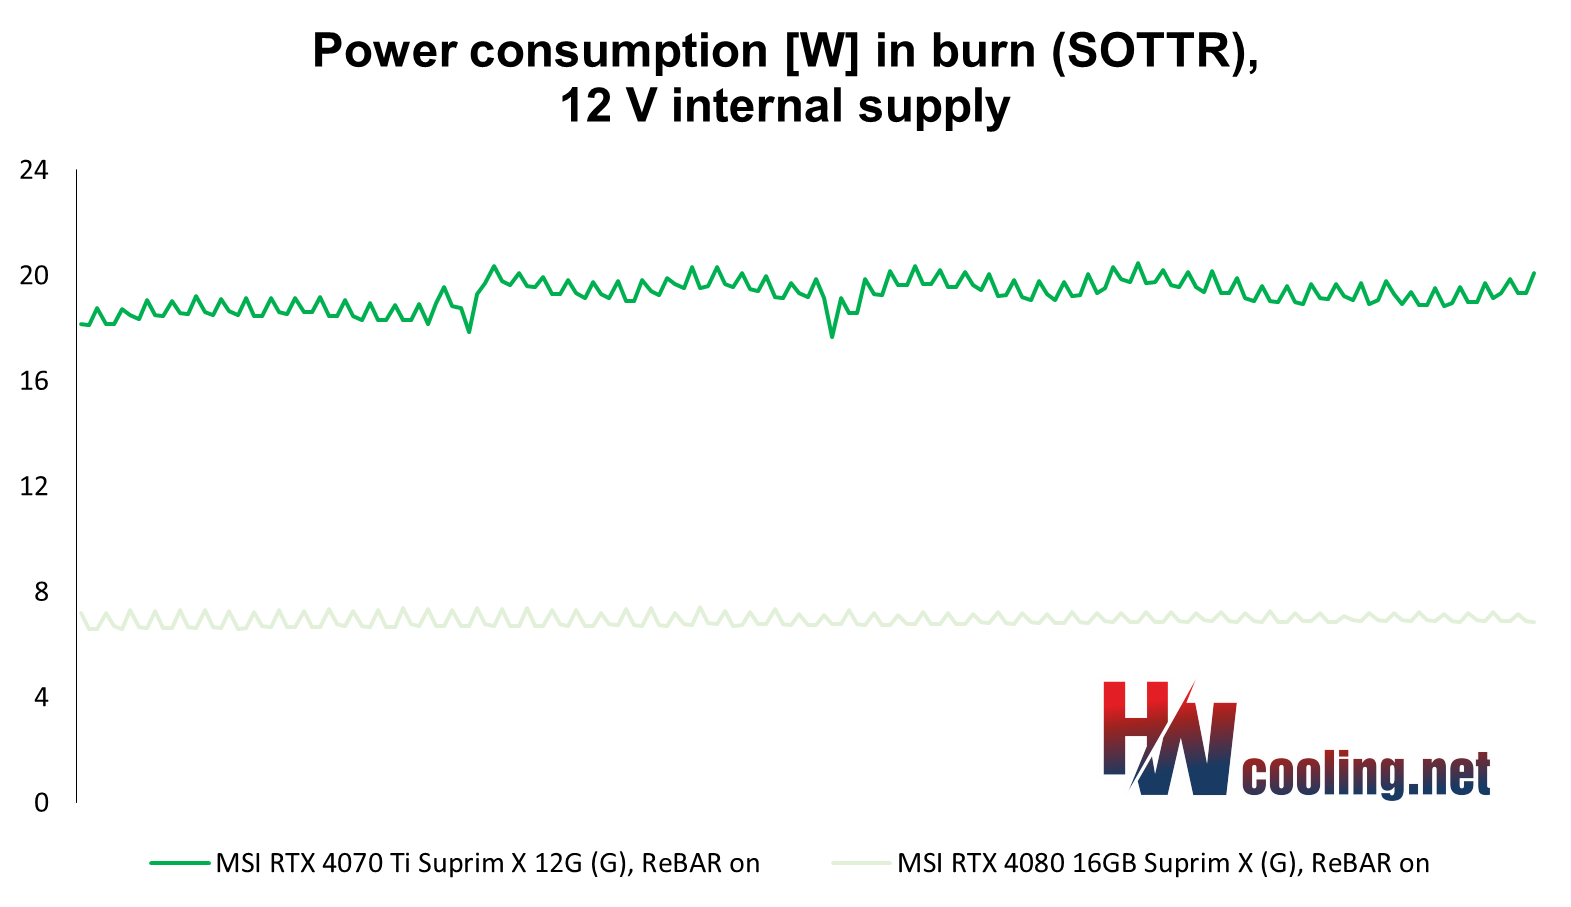
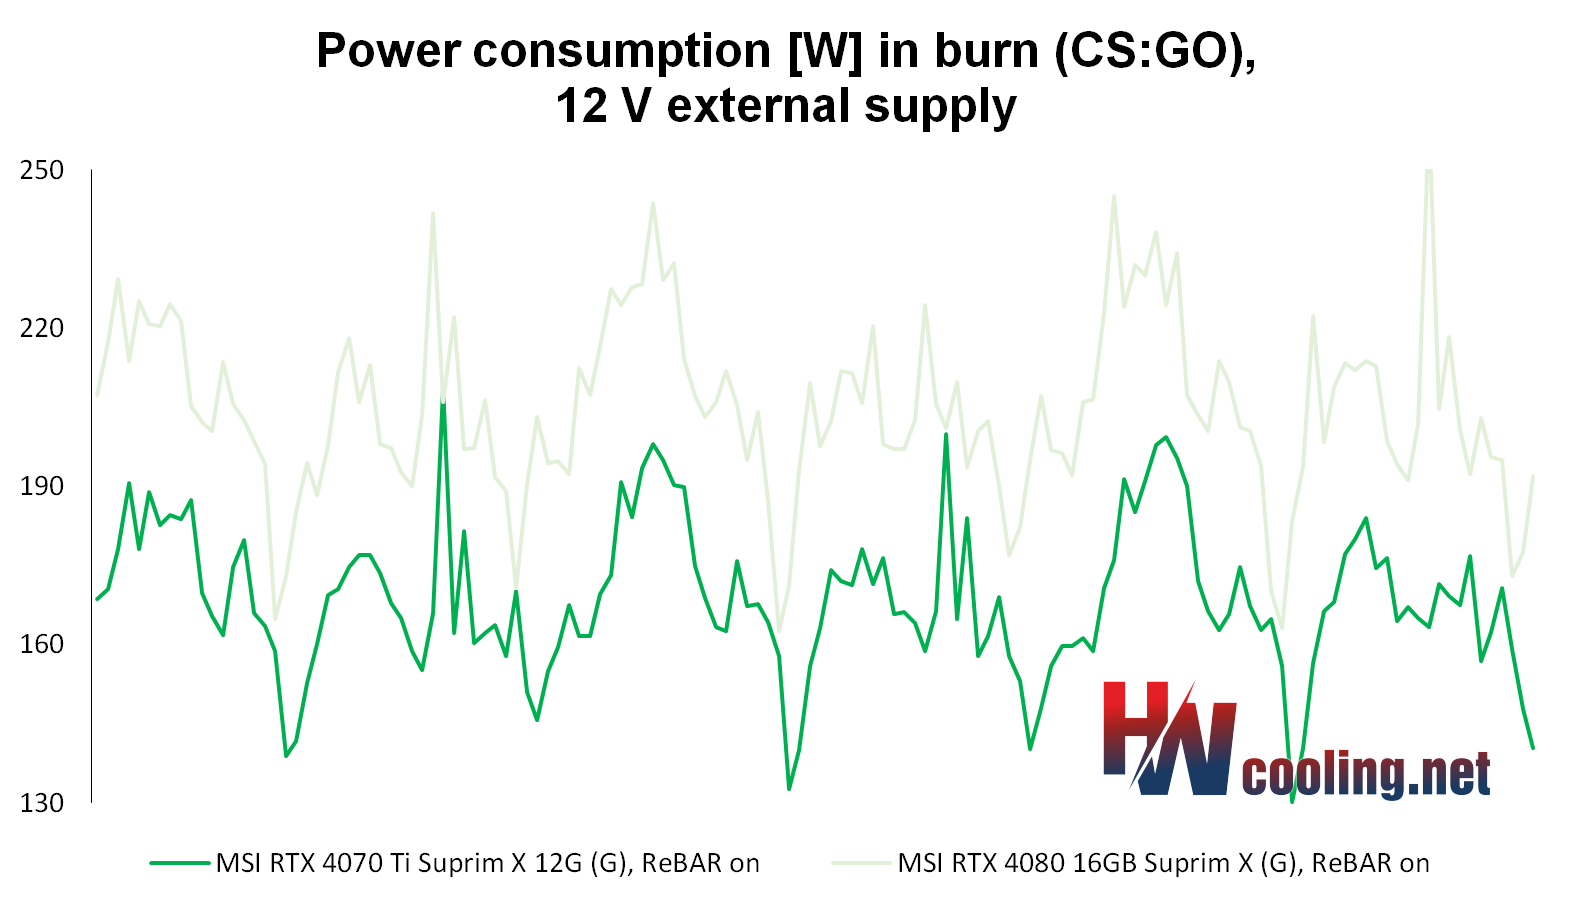
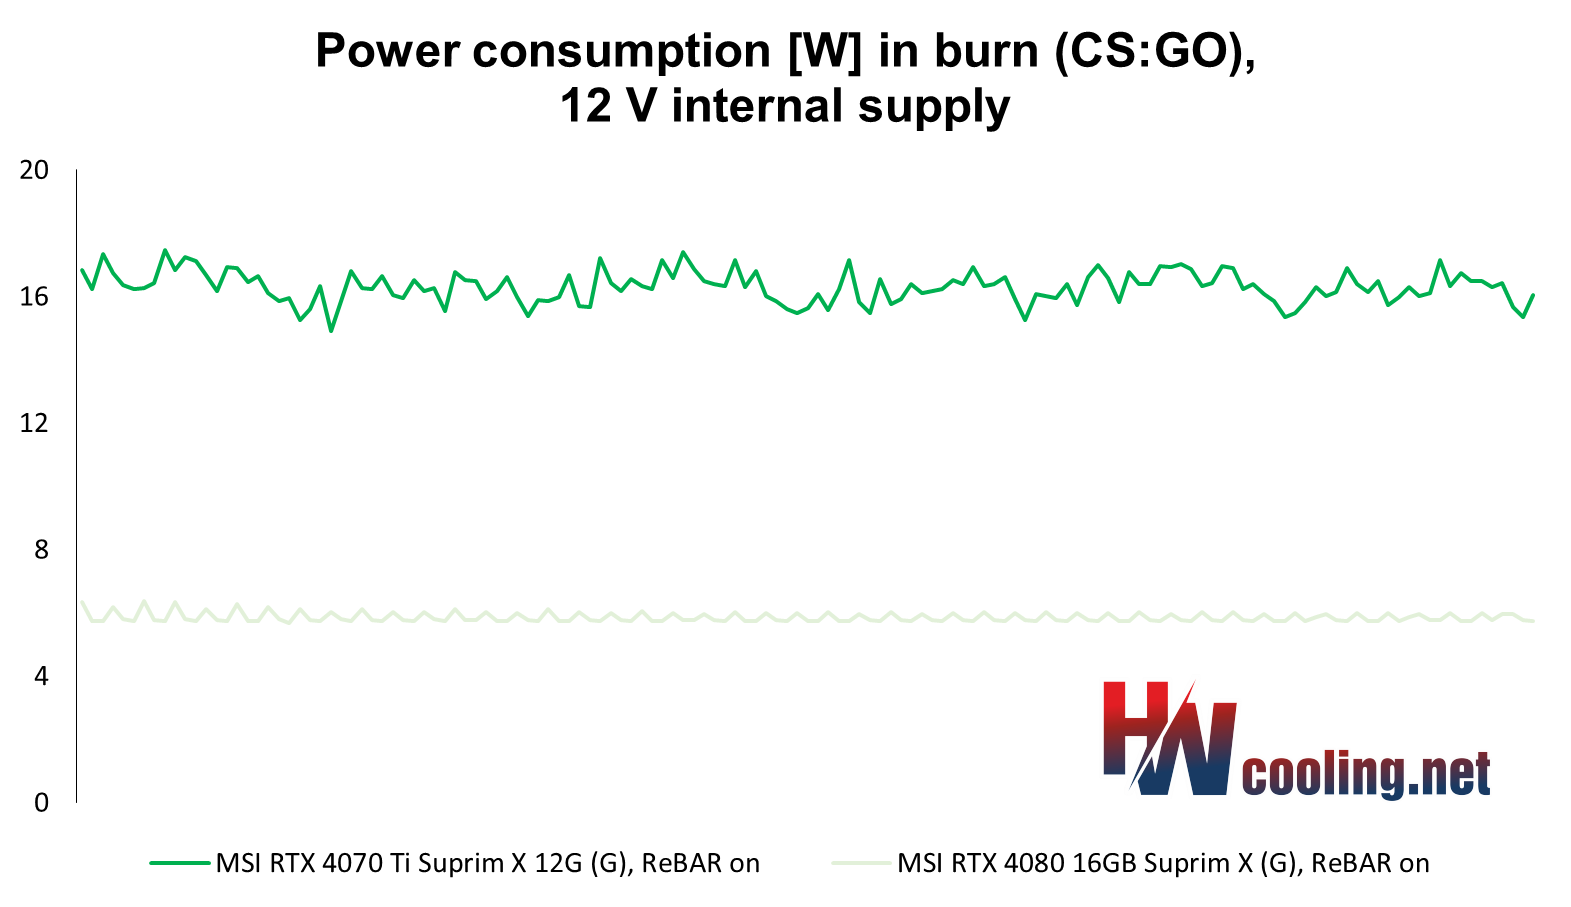
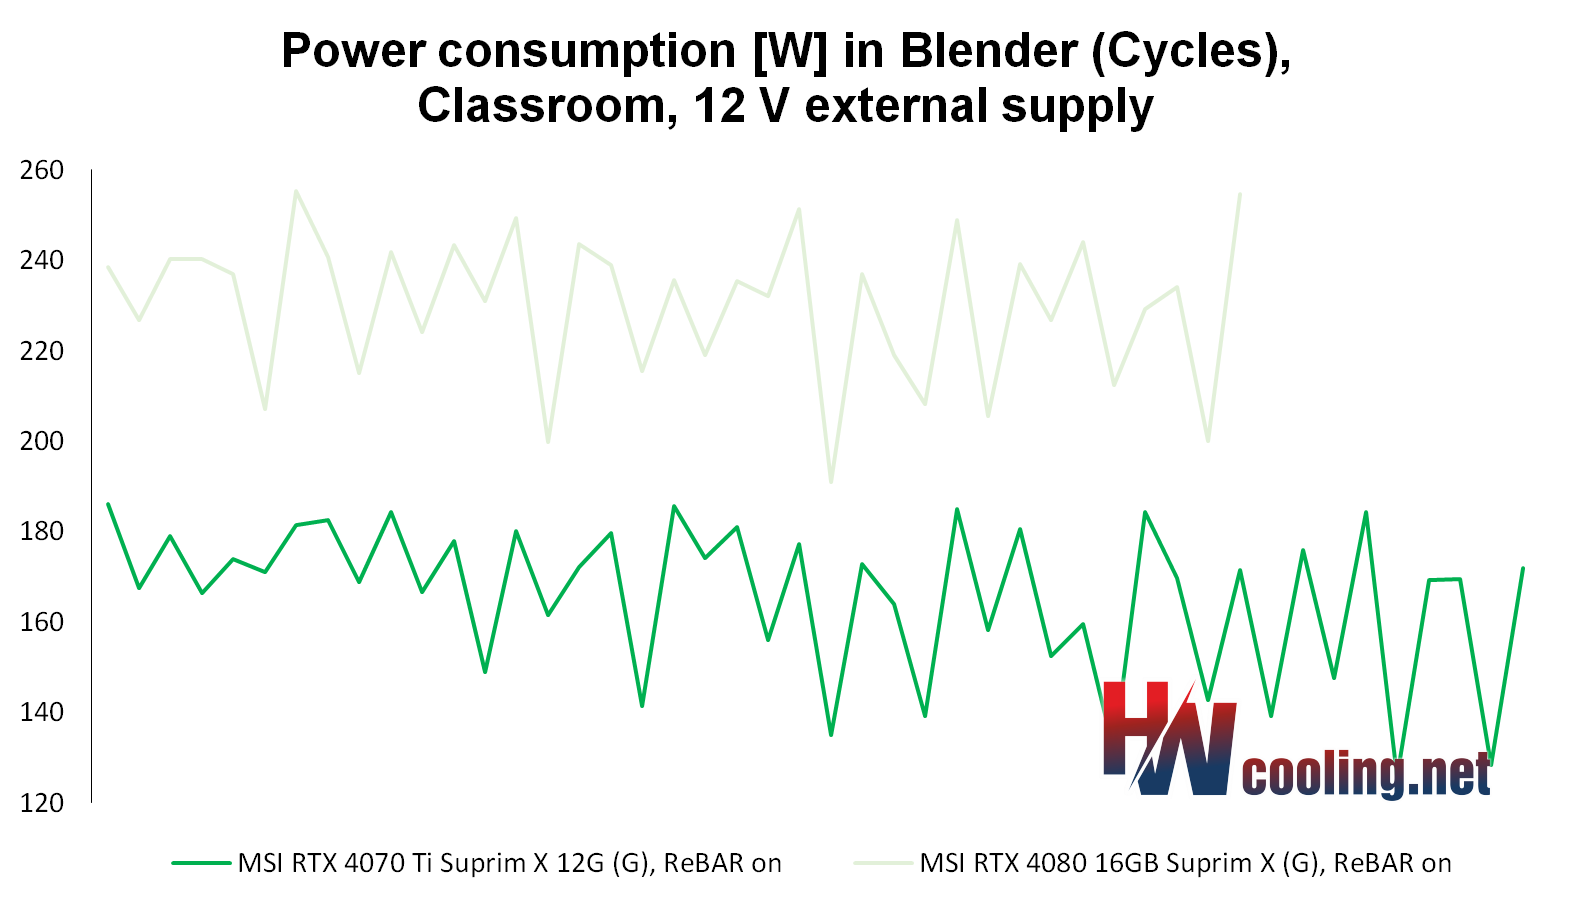
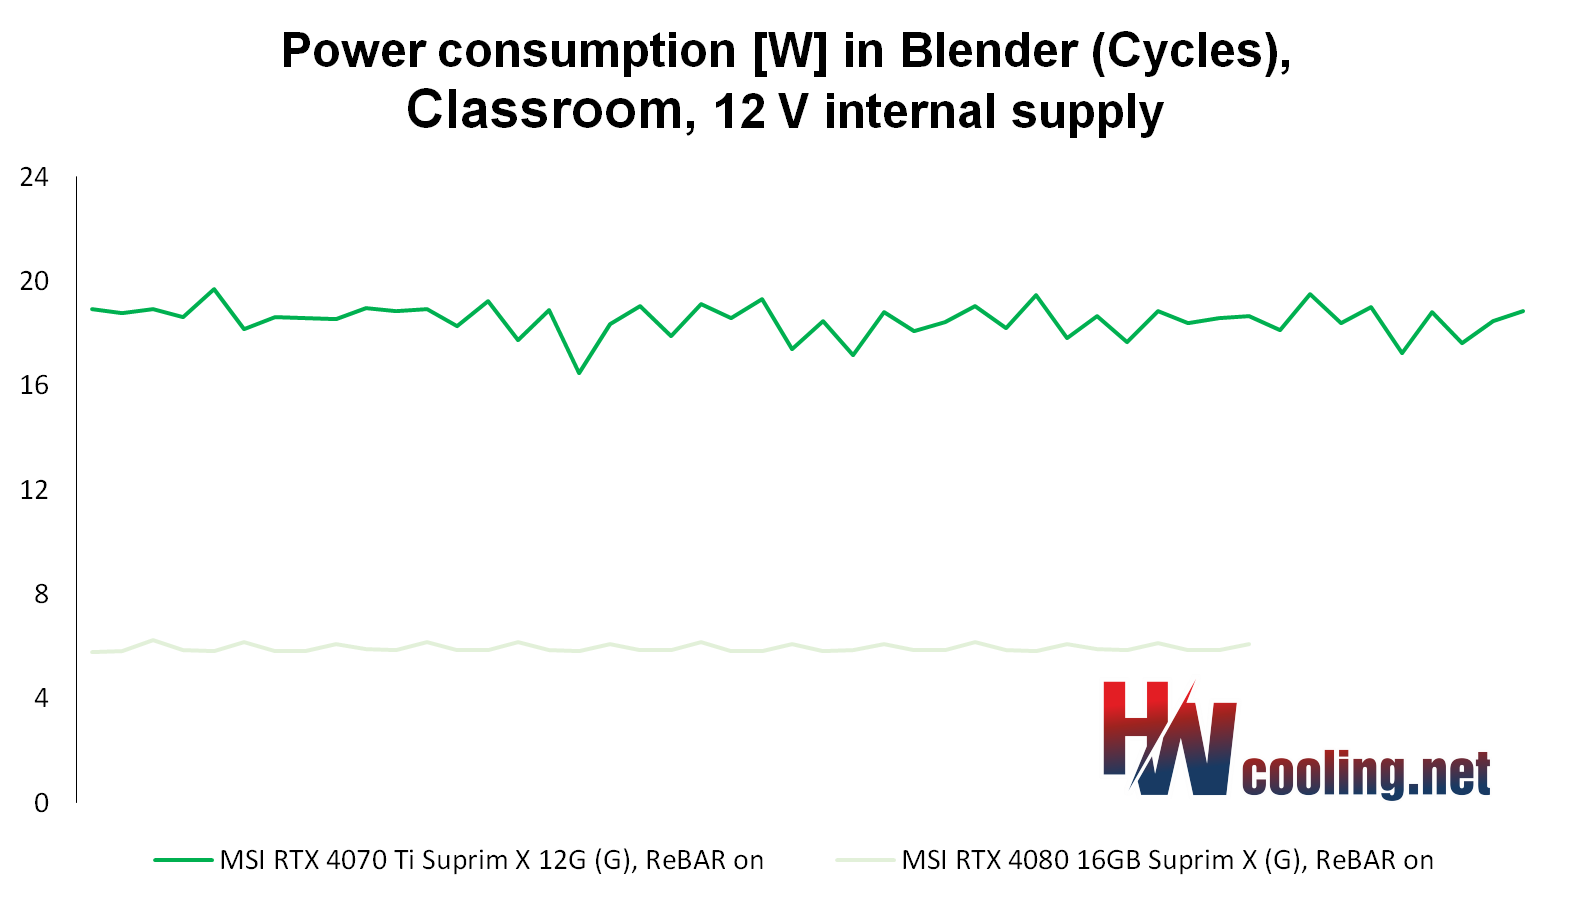
After the GeForce RTX 4080 graphics cards, which wasn’t to many people’s taste due to the higher price, Nvidia has released a significantly cheaper GPU for the GeForce RTX 4070 Ti. The performance versus the RTX 4080 is admittedly noticeably weaker, but percentage-wise not by as much as the roughly two-thirds lower price of the RTX 4070 Ti. In our tests, we analyze MSI’s non-reference design from the top-of-the-line Suprim X series.
Analysis of 12 V branch power supply (lower load)
After the GeForce RTX 4080 graphics cards, which wasn’t to many people’s taste due to the higher price, Nvidia has released a significantly cheaper GPU for the GeForce RTX 4070 Ti. The performance versus the RTX 4080 is admittedly noticeably weaker, but percentage-wise not by as much as the roughly two-thirds lower price of the RTX 4070 Ti. In our tests, we analyze MSI’s non-reference design from the top-of-the-line Suprim X series.
Analysis of 3,3 V branch power supply
After the GeForce RTX 4080 graphics cards, which wasn’t to many people’s taste due to the higher price, Nvidia has released a significantly cheaper GPU for the GeForce RTX 4070 Ti. The performance versus the RTX 4080 is admittedly noticeably weaker, but percentage-wise not by as much as the roughly two-thirds lower price of the RTX 4070 Ti. In our tests, we analyze MSI’s non-reference design from the top-of-the-line Suprim X series.
Noise level
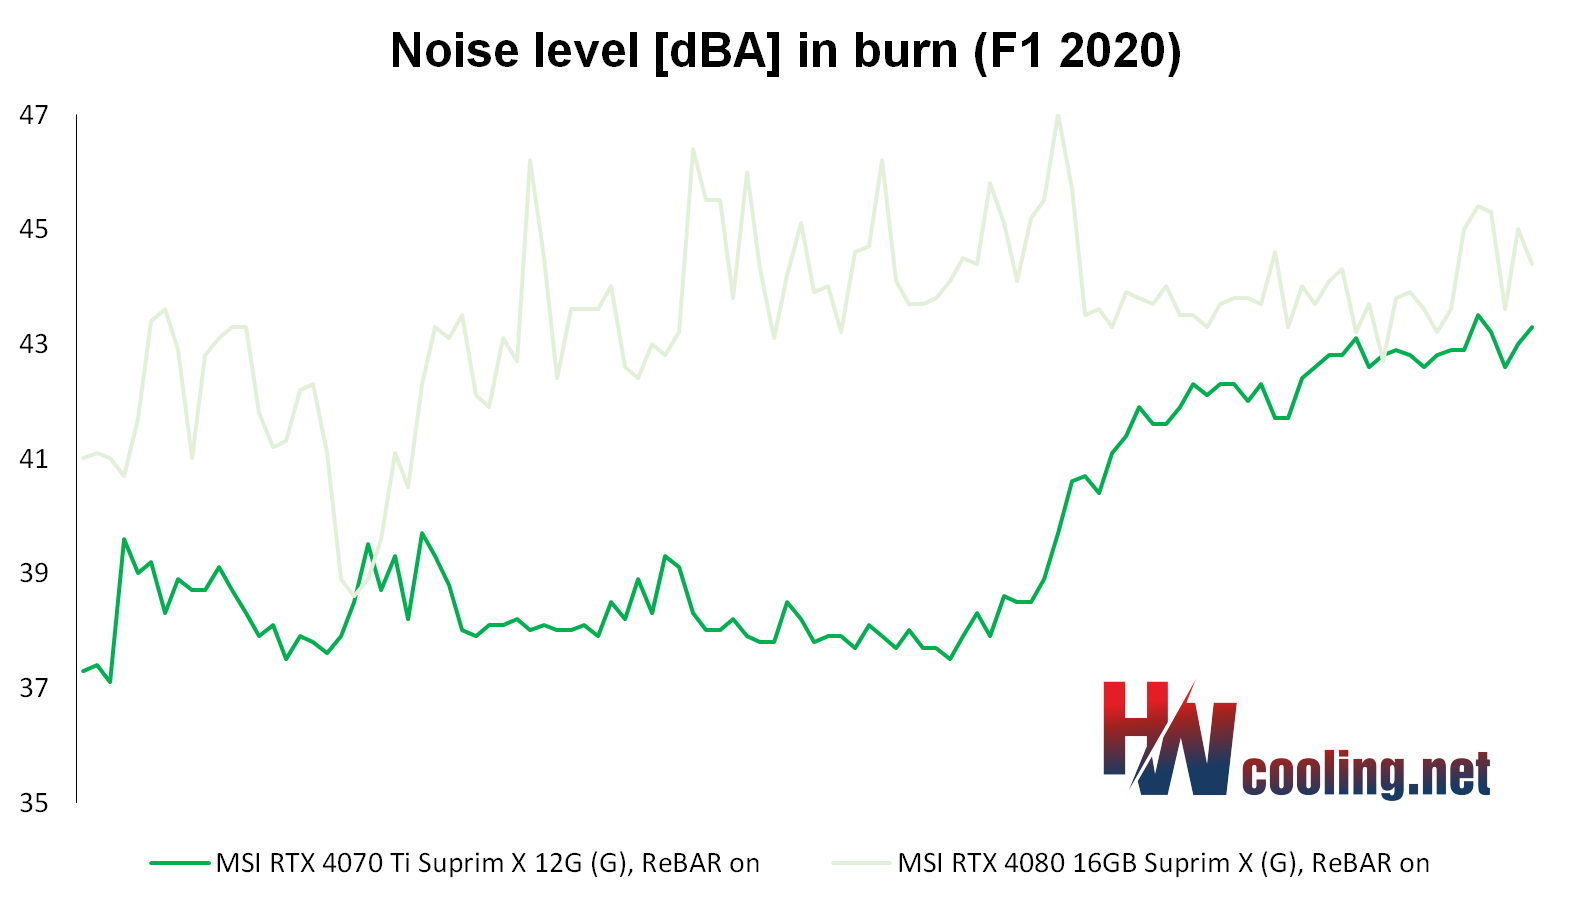

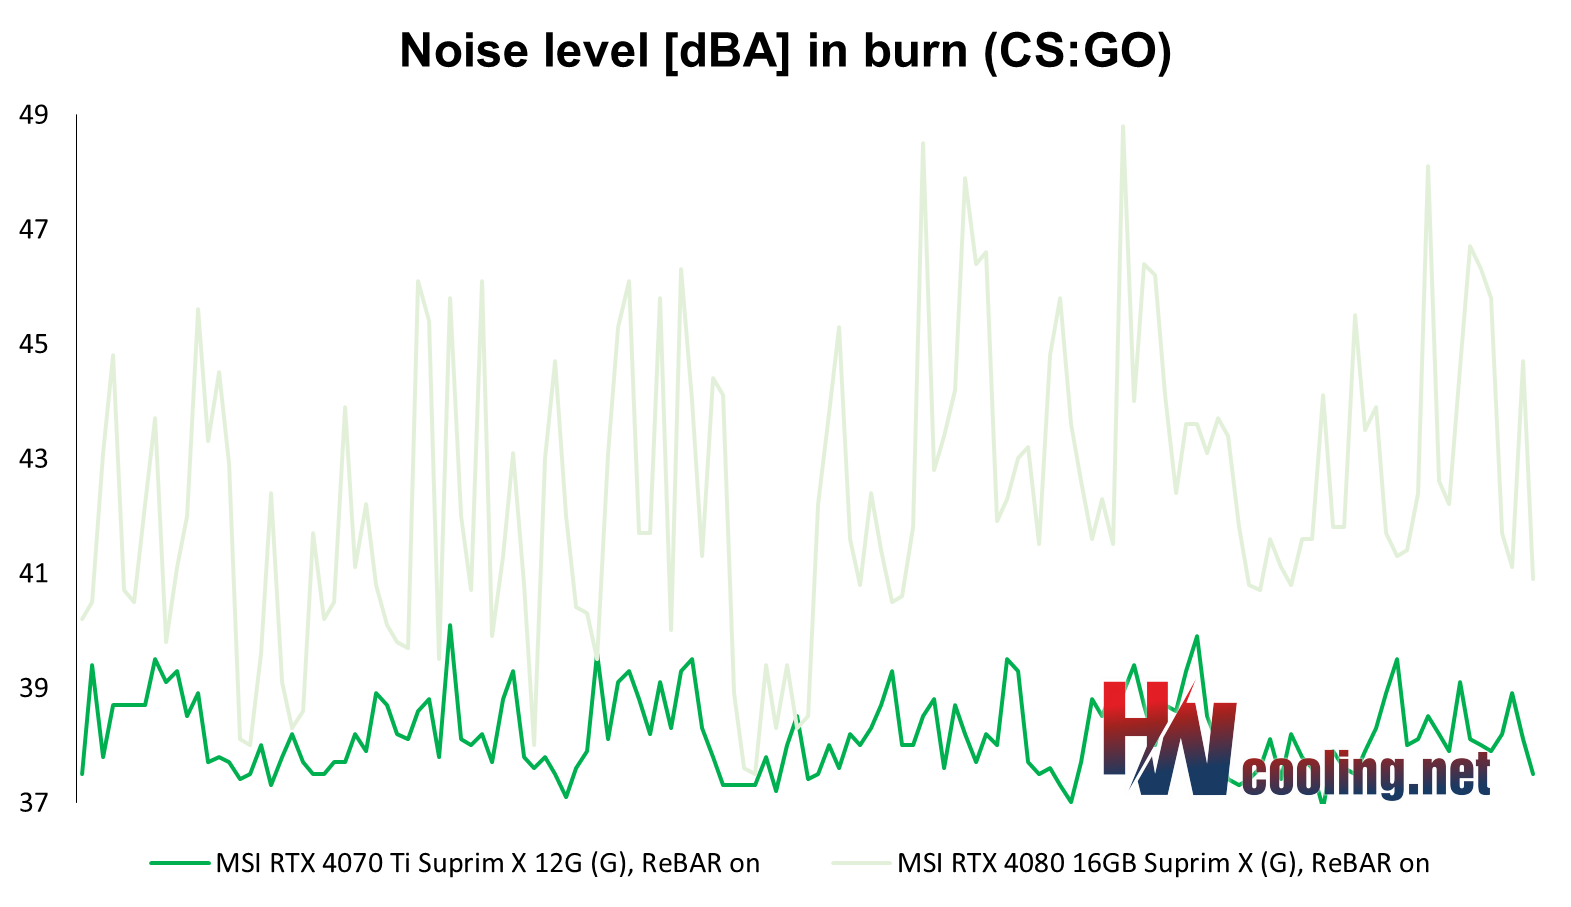
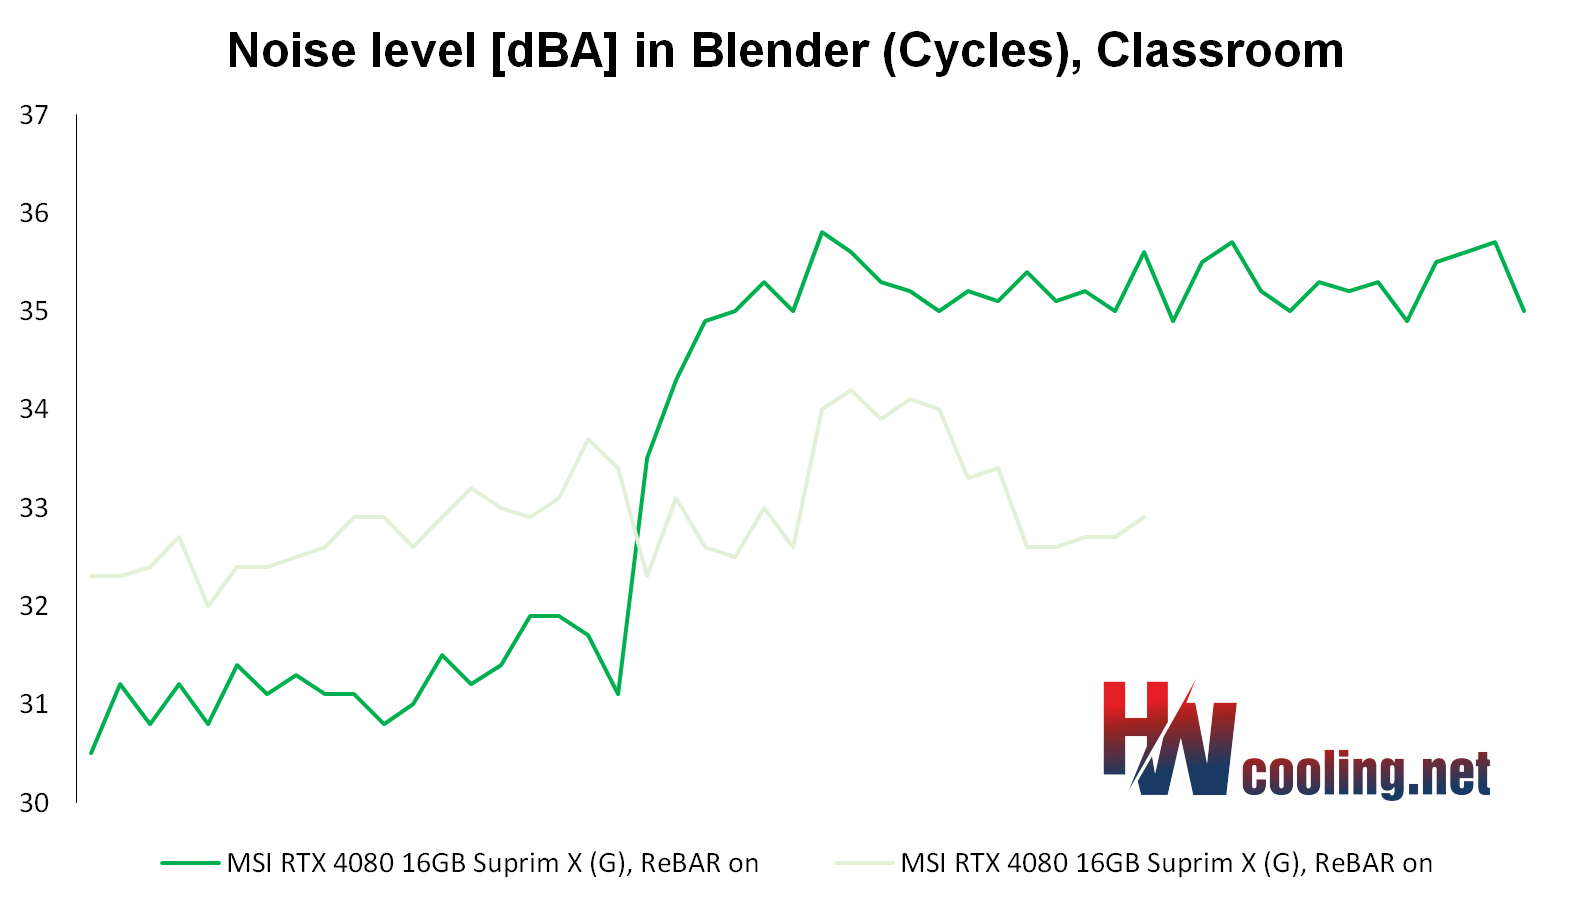
After the GeForce RTX 4080 graphics cards, which wasn’t to many people’s taste due to the higher price, Nvidia has released a significantly cheaper GPU for the GeForce RTX 4070 Ti. The performance versus the RTX 4080 is admittedly noticeably weaker, but percentage-wise not by as much as the roughly two-thirds lower price of the RTX 4070 Ti. In our tests, we analyze MSI’s non-reference design from the top-of-the-line Suprim X series.
Frequency response of sound
Measurements are performed in the TrueRTA application, which records sound in a range of 240 frequencies in the recorded range of 20–20,000 Hz. For the possibility of comparison across articles, we export the dominant frequency from the low (20–200 Hz), medium (201–2,000 Hz) and high (2,001–20,000 Hz) range to standard bar graphs.
However, for an even more detailed analysis of the sound expression, it is important to perceive the overall shape of the graph and the intensity of all frequencies/tones. If you don’t understand something in the graphs or tables below, you’ll find the answers to all your questions in this article. This explains how to read the measured data below correctly.
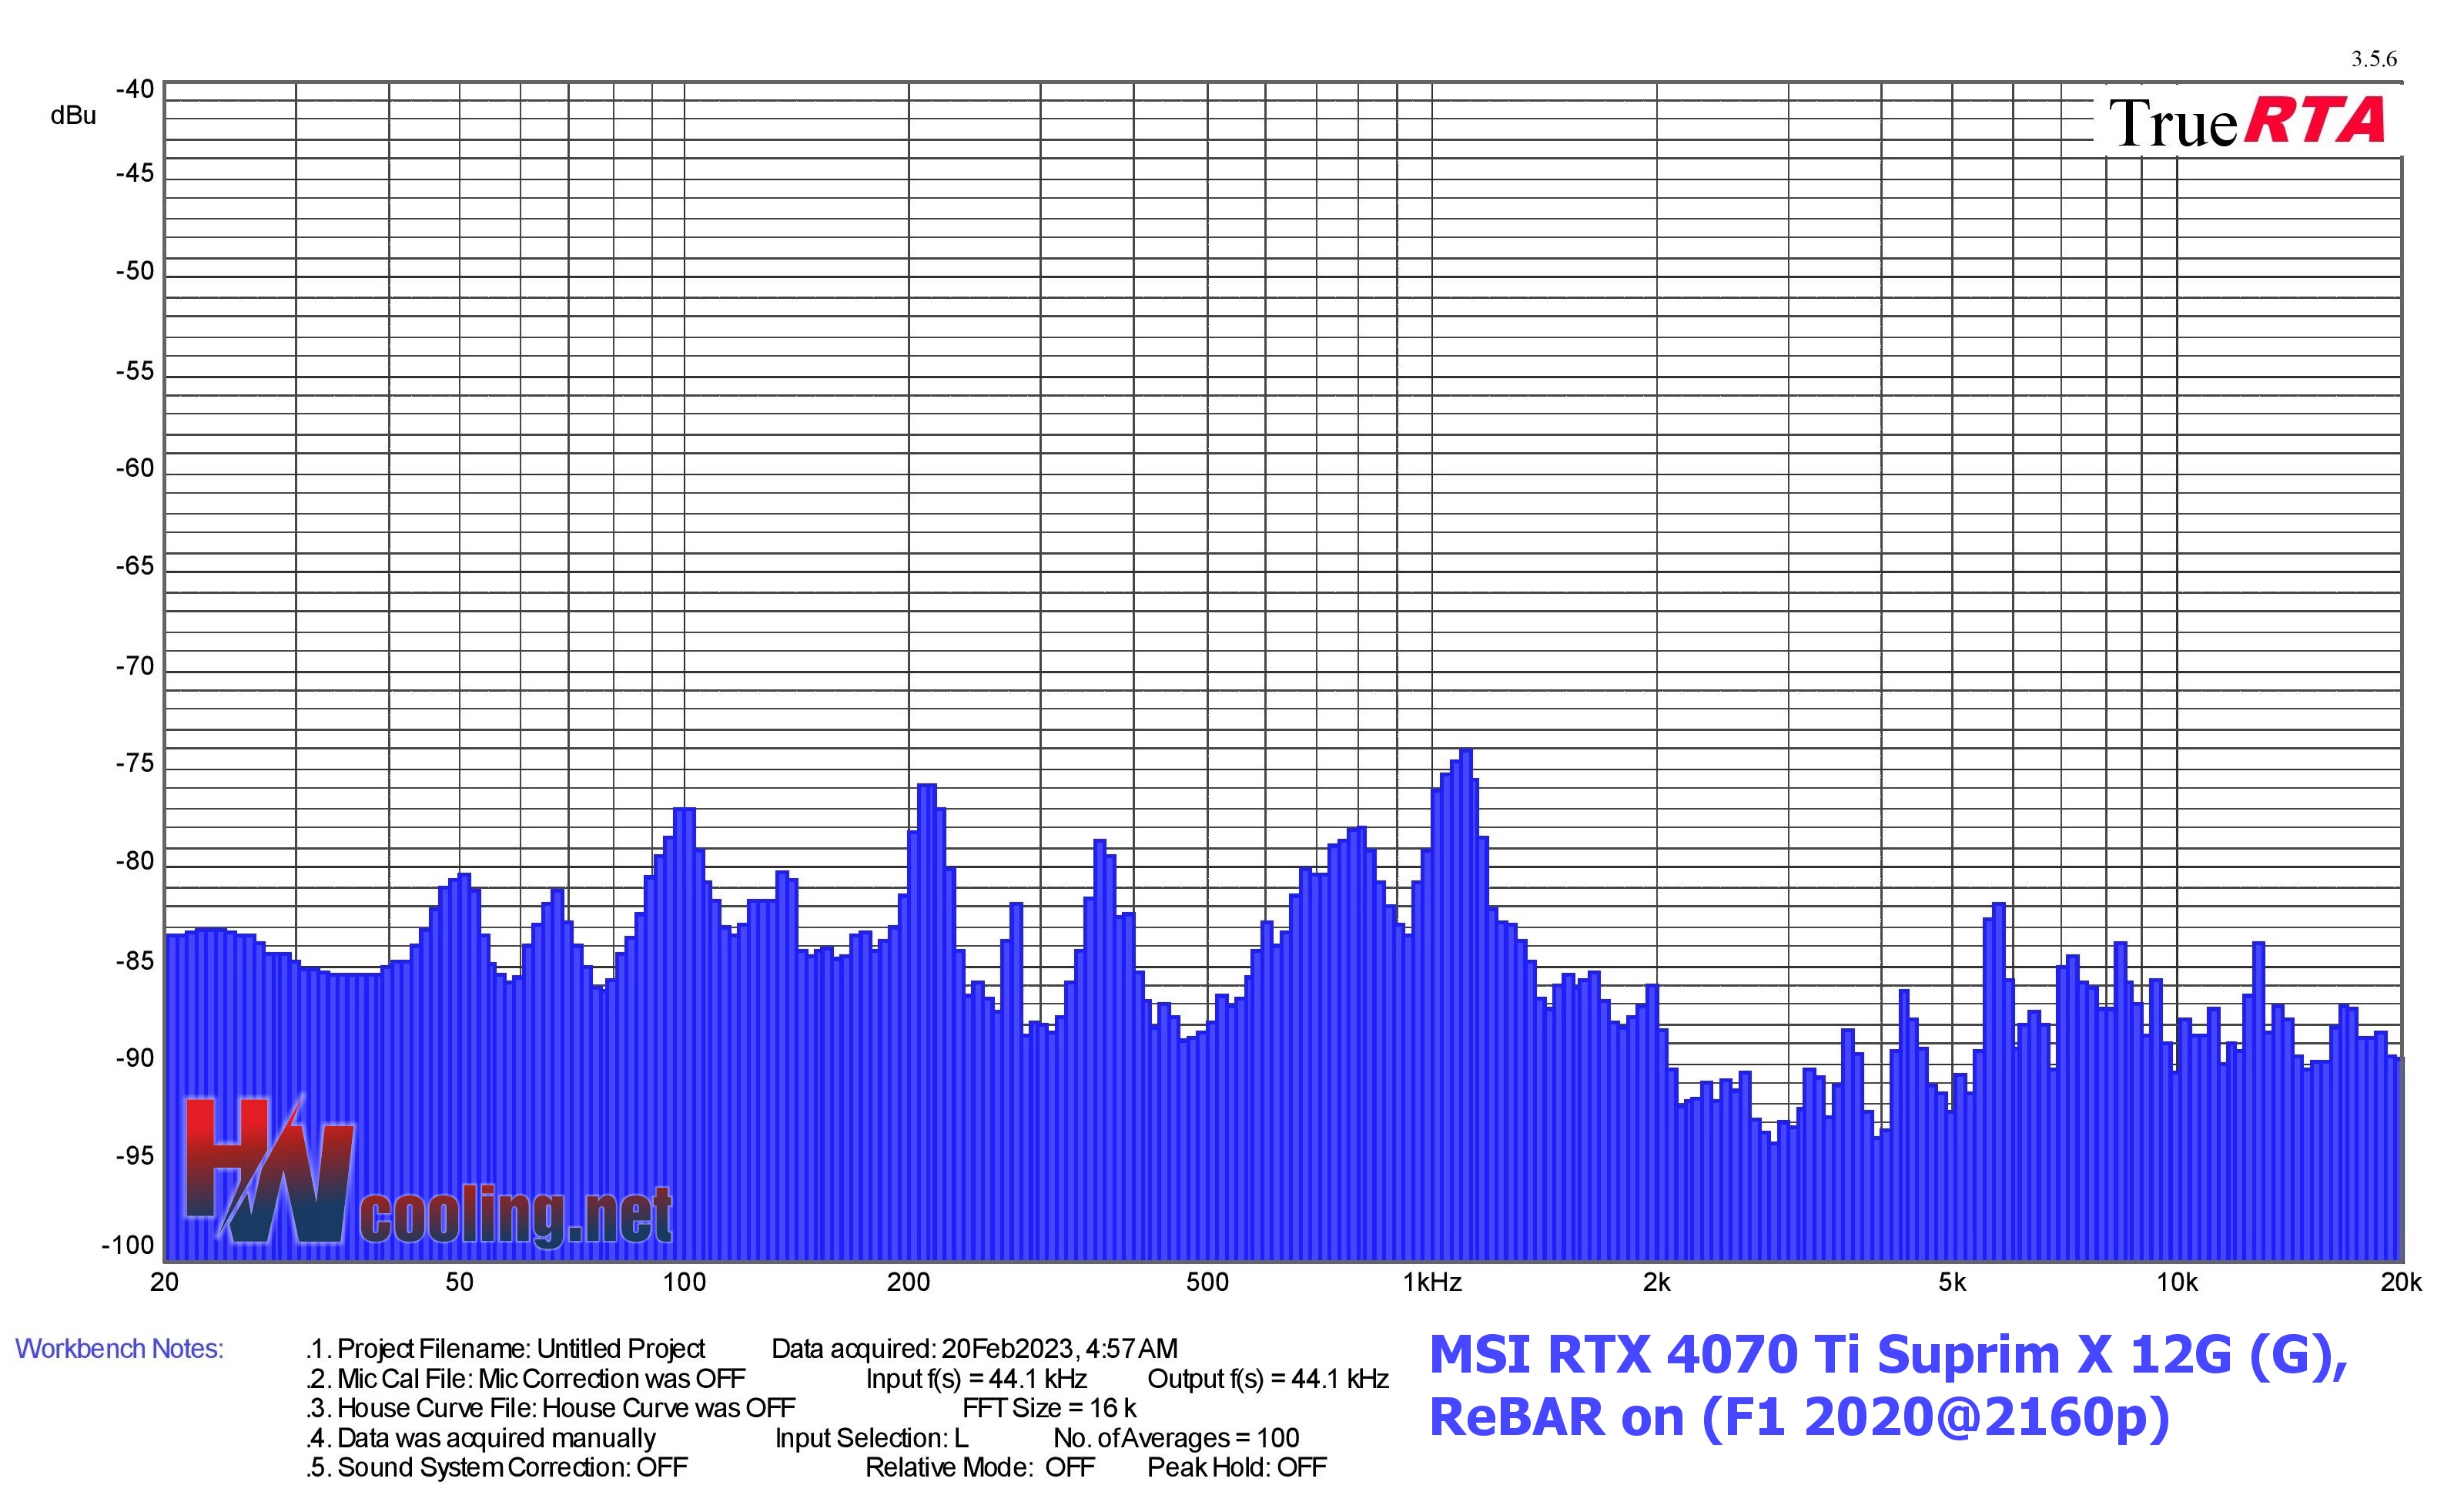
| Graphics card | Dominant sound freq. and noise level in F1 2020@2160p | NF-F12 PWM | NF-A15 PWM | ||||
| Low range | Mid range | High range | |||||
| Frequency [Hz] | Noise level [dBu] | Frequency [Hz] | Noise level [dBu] | Frequency [Hz] | Noise level [dBu] | ||
| MSI RTX 4070 Ti Suprim X 12G (G), ReBAR on | 97,9 | -77,0 | 1107,9 | -74,1 | 5747,0 | -81,8 | |
| MSI RTX 4080 16GB Suprim X (G), ReBAR on | 71,3 | -77,2 | 1076,3 | -69,3 | 11830,8 | -75,4 | |
| MSI RTX 3050 Ventus 2X 8G OC, ReBAR off | 138,5 | -78,8 | 1107,9 | -78,6 | 2031,9 | -84,8 | |
| MSI RTX 3050 Ventus 2X 8G OC, ReBAR on | 123,4 | -81,2 | 1107,9 | -80,0 | 18245,6 | -83,7 | |
| Sapphire RX 6650 XT Nitro+ (P), ReBAR on | 50,4 | -83,3 | 1107,9 | -72,4 | 7240,8 | -82,5 | |
| Sapphire RX 6650 XT Nitro+ (P), ReBAR off | 184,9 | -82,3 | 1107,9 | -71,4 | 6834,4 | -82,2 | |
| Sapphire RX 6600 XT Pulse, ReBAR on | Sapphire RX 6600 XT Pulse, ReBAR on | 100,8 | -71,8 | 1356,1 | -72,7 | 6088,7 | -80,9 |
| Sapphire RX 6600 XT Pulse, ReBAR off | Sapphire RX 6600 XT Pulse, ReBAR off | 100,8 | -71,8 | 219,8 | -74,5 | 6088,7 | -81,0 |
| Aorus RTX 3080 Xtreme 10G (OC), ReBAR on | 50,4 | -77,0 | 1076,3 | -56,5 | 2031,9 | -69,4 | |
| Aorus RTX 3080 Xtreme 10G (OC), ReBAR off | 50,4 | -75,9 | 1076,3 | -56,7 | 2031,9 | -69,6 | |
| Sapphire RX 6900 XT Toxic LE (P), ReBAR on | Sapphire RX 6900 XT Toxic LE (P), ReBAR on | 138,5 | -62,4 | 1107,9 | -56,6 | 11166,8 | -74,7 |
| Sapphire RX 6900 XT Toxic LE (P), ReBAR off | Sapphire RX 6900 XT Toxic LE (P), ReBAR on | 138,5 | -61,9 | 1107,9 | -55,6 | 5747,0 | -74,7 |
| Sapphire RX 6700 XT Nitro+ (P), ReBAR on | 100,8 | -73,2 | 1076,3 | -71,2 | 7034,6 | -76,5 | |
| Sapphire RX 6700 XT Nitro+ (P), ReBAR off | 100,8 | -75,2 | 1076,3 | -73,5 | 7034,6 | -76,5 | |
| MSI RTX 3060 Ti Gaming X Trio, ReBAR off | 100,8 | -70,6 | 1107,9 | -82,8 | 7034,6 | -83,7 | |
| Gigabyte RTX 3060 Eagle OC 12G, ReBAR off | 100,8 | -71,6 | 213,6 | -64,3 | 2031,9 | -74,2 | |
| MSI RTX 3090 Gaming X Trio, ReBAR off | 100,8 | -72,3 | 1076,3 | -76,0 | 4561,4 | -81,2 | |
| MSI RTX 3070 Gaming X Trio, ReBAR off | 100,8 | -73,9 | 1076,3 | -79,7 | 6267,2 | -85,1 | |
| AMD Radeon RX 6800, ReBAR on | 100,8 | -71,0 | 1076,3 | -66,5 | 9665,3 | -81,3 | |
| AMD Radeon RX 6800, ReBAR off | 100,8 | -71,8 | 1107,9 | -67,4 | 2091,4 | -75,3 | |
| TUF RTX 3080 O10G Gaming, ReBAR off | 100,8 | -76,0 | 1107,9 | -77,9 | 7034,6 | -74,4 | |
| AMD Radeon RX 6800 XT, ReBAR on | 100,8 | -71,6 | 1107,9 | -74,7 | 10848,9 | -76,3 | |
| AMD Radeon RX 6800 XT, ReBAR off | 100,8 | -73,0 | 1107,9 | -74,7 | 10848,9 | -76,5 |
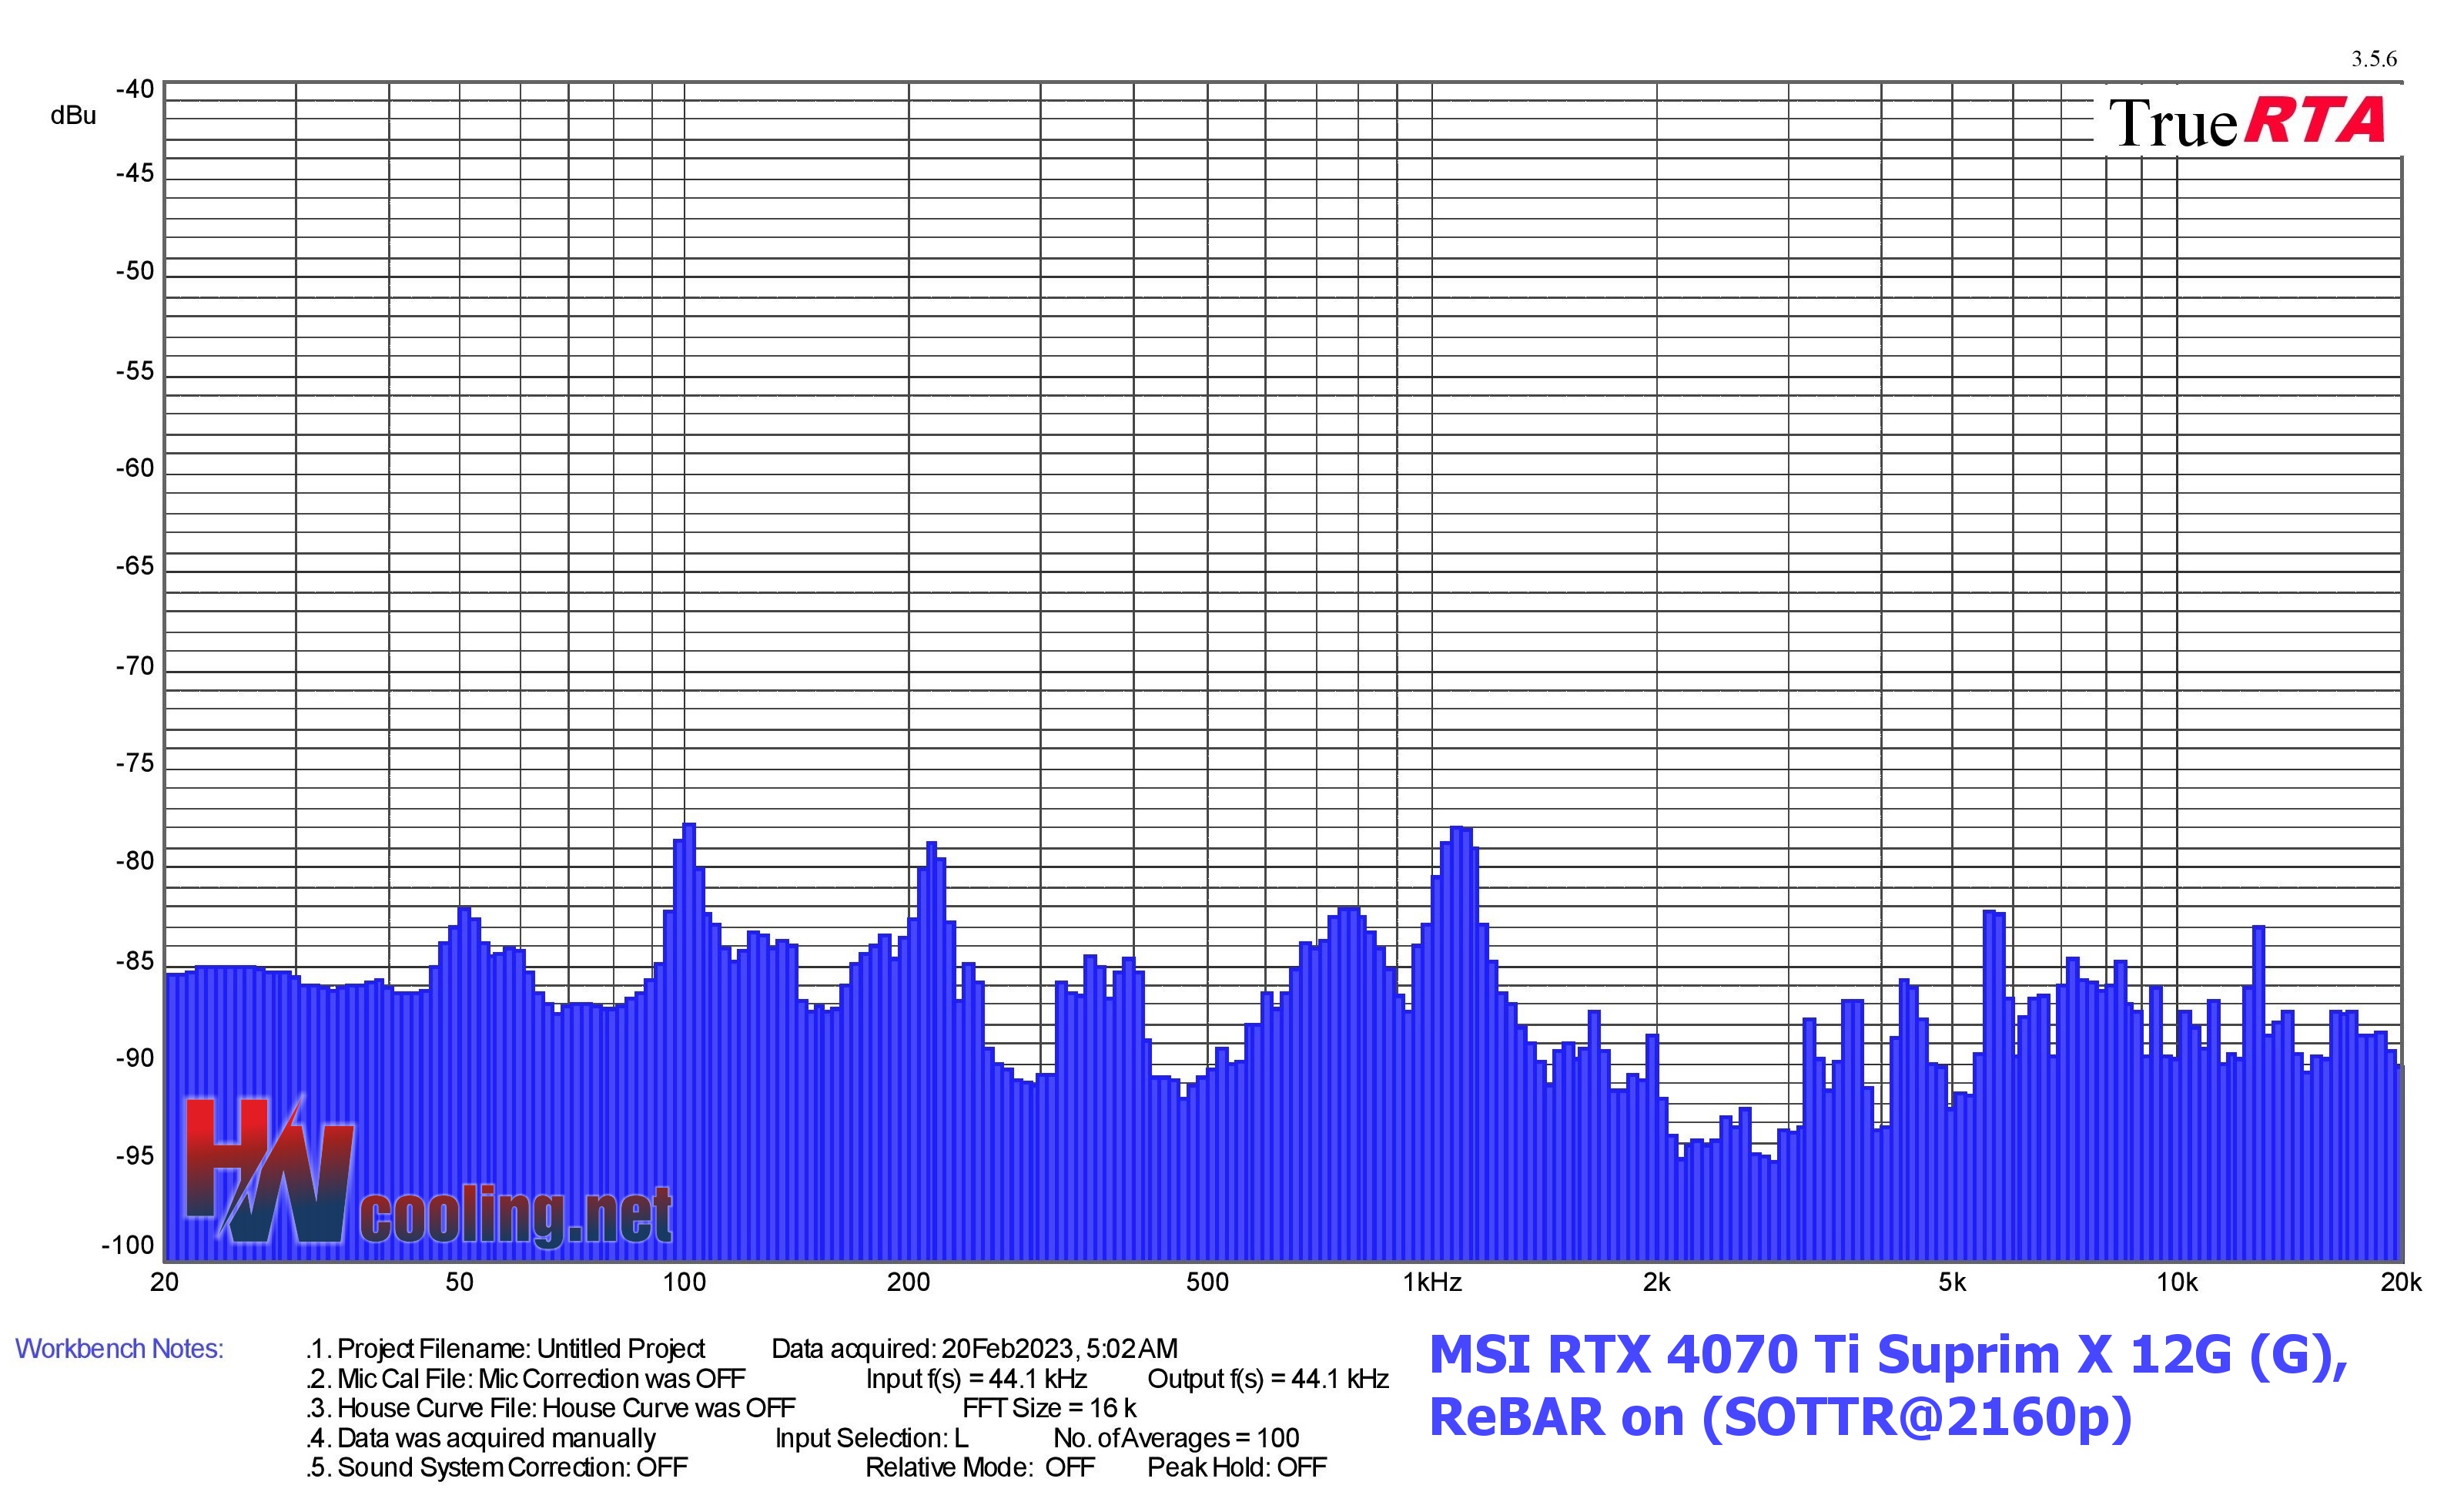
| Graphics card | Dominant sound freq. and noise level in SOTTR@2160p | NF-F12 PWM | NF-A15 PWM | ||||
| Low range | Mid range | High range | |||||
| Frequency [Hz] | Noise level [dBu] | Frequency [Hz] | Noise level [dBu] | Frequency [Hz] | Noise level [dBu] | ||
| MSI RTX 4070 Ti Suprim X 12G (G), ReBAR on | 100,8 | -77,9 | 1076,3 | -77,9 | 5583,4 | -82,2 | |
| MSI RTX 4080 16GB Suprim X (G), ReBAR on | 190,3 | -78,4 | 1045,7 | -74,4 | 11830,8 | -75,3 | |
| MSI RTX 3050 Ventus 2X 8G OC, ReBAR off | 138,5 | -78,4 | 1140,4 | -78,5 | 2031,9 | -84,7 | |
| MSI RTX 3050 Ventus 2X 8G OC, ReBAR on | 138,5 | -78,3 | 1107,9 | -78,4 | 2031,9 | -84,6 | |
| Sapphire RX 6650 XT Nitro+ (P), ReBAR on | 50,4 | -80,1 | 1107,9 | -76,5 | 6834,4 | -84,3 | |
| Sapphire RX 6650 XT Nitro+ (P), ReBAR off | 47,6 | -84,3 | 1107,9 | -75,9 | 6834,4 | -82,8 | |
| Sapphire RX 6600 XT Pulse, ReBAR on | 100,8 | -68,8 | 1356,1 | -75,7 | 6088,7 | -82,6 | |
| Sapphire RX 6600 XT Pulse, ReBAR off | 100,8 | -69,5 | 1356,1 | -74,8 | 5915,4 | -83,1 | |
| Aorus RTX 3080 Xtreme 10G (OC), ReBAR on | 44,9 | -73,0 | 1045,7 | -50,3 | 2031,9 | -60,5 | |
| Aorus RTX 3080 Xtreme 10G (OC), ReBAR off | 41,8 | -72,6 | 1076,3 | -51,4 | 2031,9 | -60,7 | |
| Sapphire RX 6900 XT Toxic LE (P), ReBAR on | Sapphire RX 6900 XT Toxic LE (P), ReBAR on | 138,5 | -63,1 | 1140,4 | -57,9 | 5747,0 | -74,7 |
| Sapphire RX 6900 XT Toxic LE (P), ReBAR off | Sapphire RX 6900 XT Toxic LE (P), ReBAR off | 134,5 | -61,7 | 1107,9 | -58,6 | 5747,0 | -74,2 |
| Sapphire RX 6700 XT Nitro+ (P), ReBAR on | 100,8 | -73,9 | 1140,4 | -75,4 | 5915,4 | -77,2 | |
| Sapphire RX 6700 XT Nitro+ (P), ReBAR off | 100,8 | -75,1 | 1107,9 | -75,2 | 5915,4 | -76,5 | |
| MSI RTX 3060 Ti Gaming X Trio, ReBAR off | 100,8 | -70,8 | 1076,3 | -83,6 | 7034,6 | -81,9 | |
| Gigabyte RTX 3060 Eagle OC 12G, ReBAR off | 100,8 | -71,9 | 213,6 | -64,5 | 2031,9 | -73,8 | |
| MSI RTX 3090 Gaming X Trio, ReBAR off | 106,8 | -74,5 | 213,6 | -71,3 | 4561,4 | -79,3 | |
| MSI RTX 3070 Gaming X Trio, ReBAR off | 100,8 | -73,0 | 213,6 | -72,3 | 6267,2 | -84,9 | |
| AMD Radeon RX 6800, ReBAR on | 100,8 | -71,8 | 1140,4 | -66,1 | 9948,5 | -81,3 | |
| AMD Radeon RX 6800, ReBAR off | 100,8 | -71,6 | 1140,4 | -67,8 | 9665,3 | -80,6 | |
| TUF RTX 3080 O10G Gaming, ReBAR off | 100,8 | -75,4 | 1076,3 | -72,3 | 7240,8 | -74,2 | |
| AMD Radeon RX 6800 XT, ReBAR on | 100,8 | -73,2 | 1107,9 | -73,9 | 10848,9 | -76,3 | |
| AMD Radeon RX 6800 XT, ReBAR off | 100,8 | -73,2 | 1107,9 | -75,3 | 10848,9 | -75,4 |
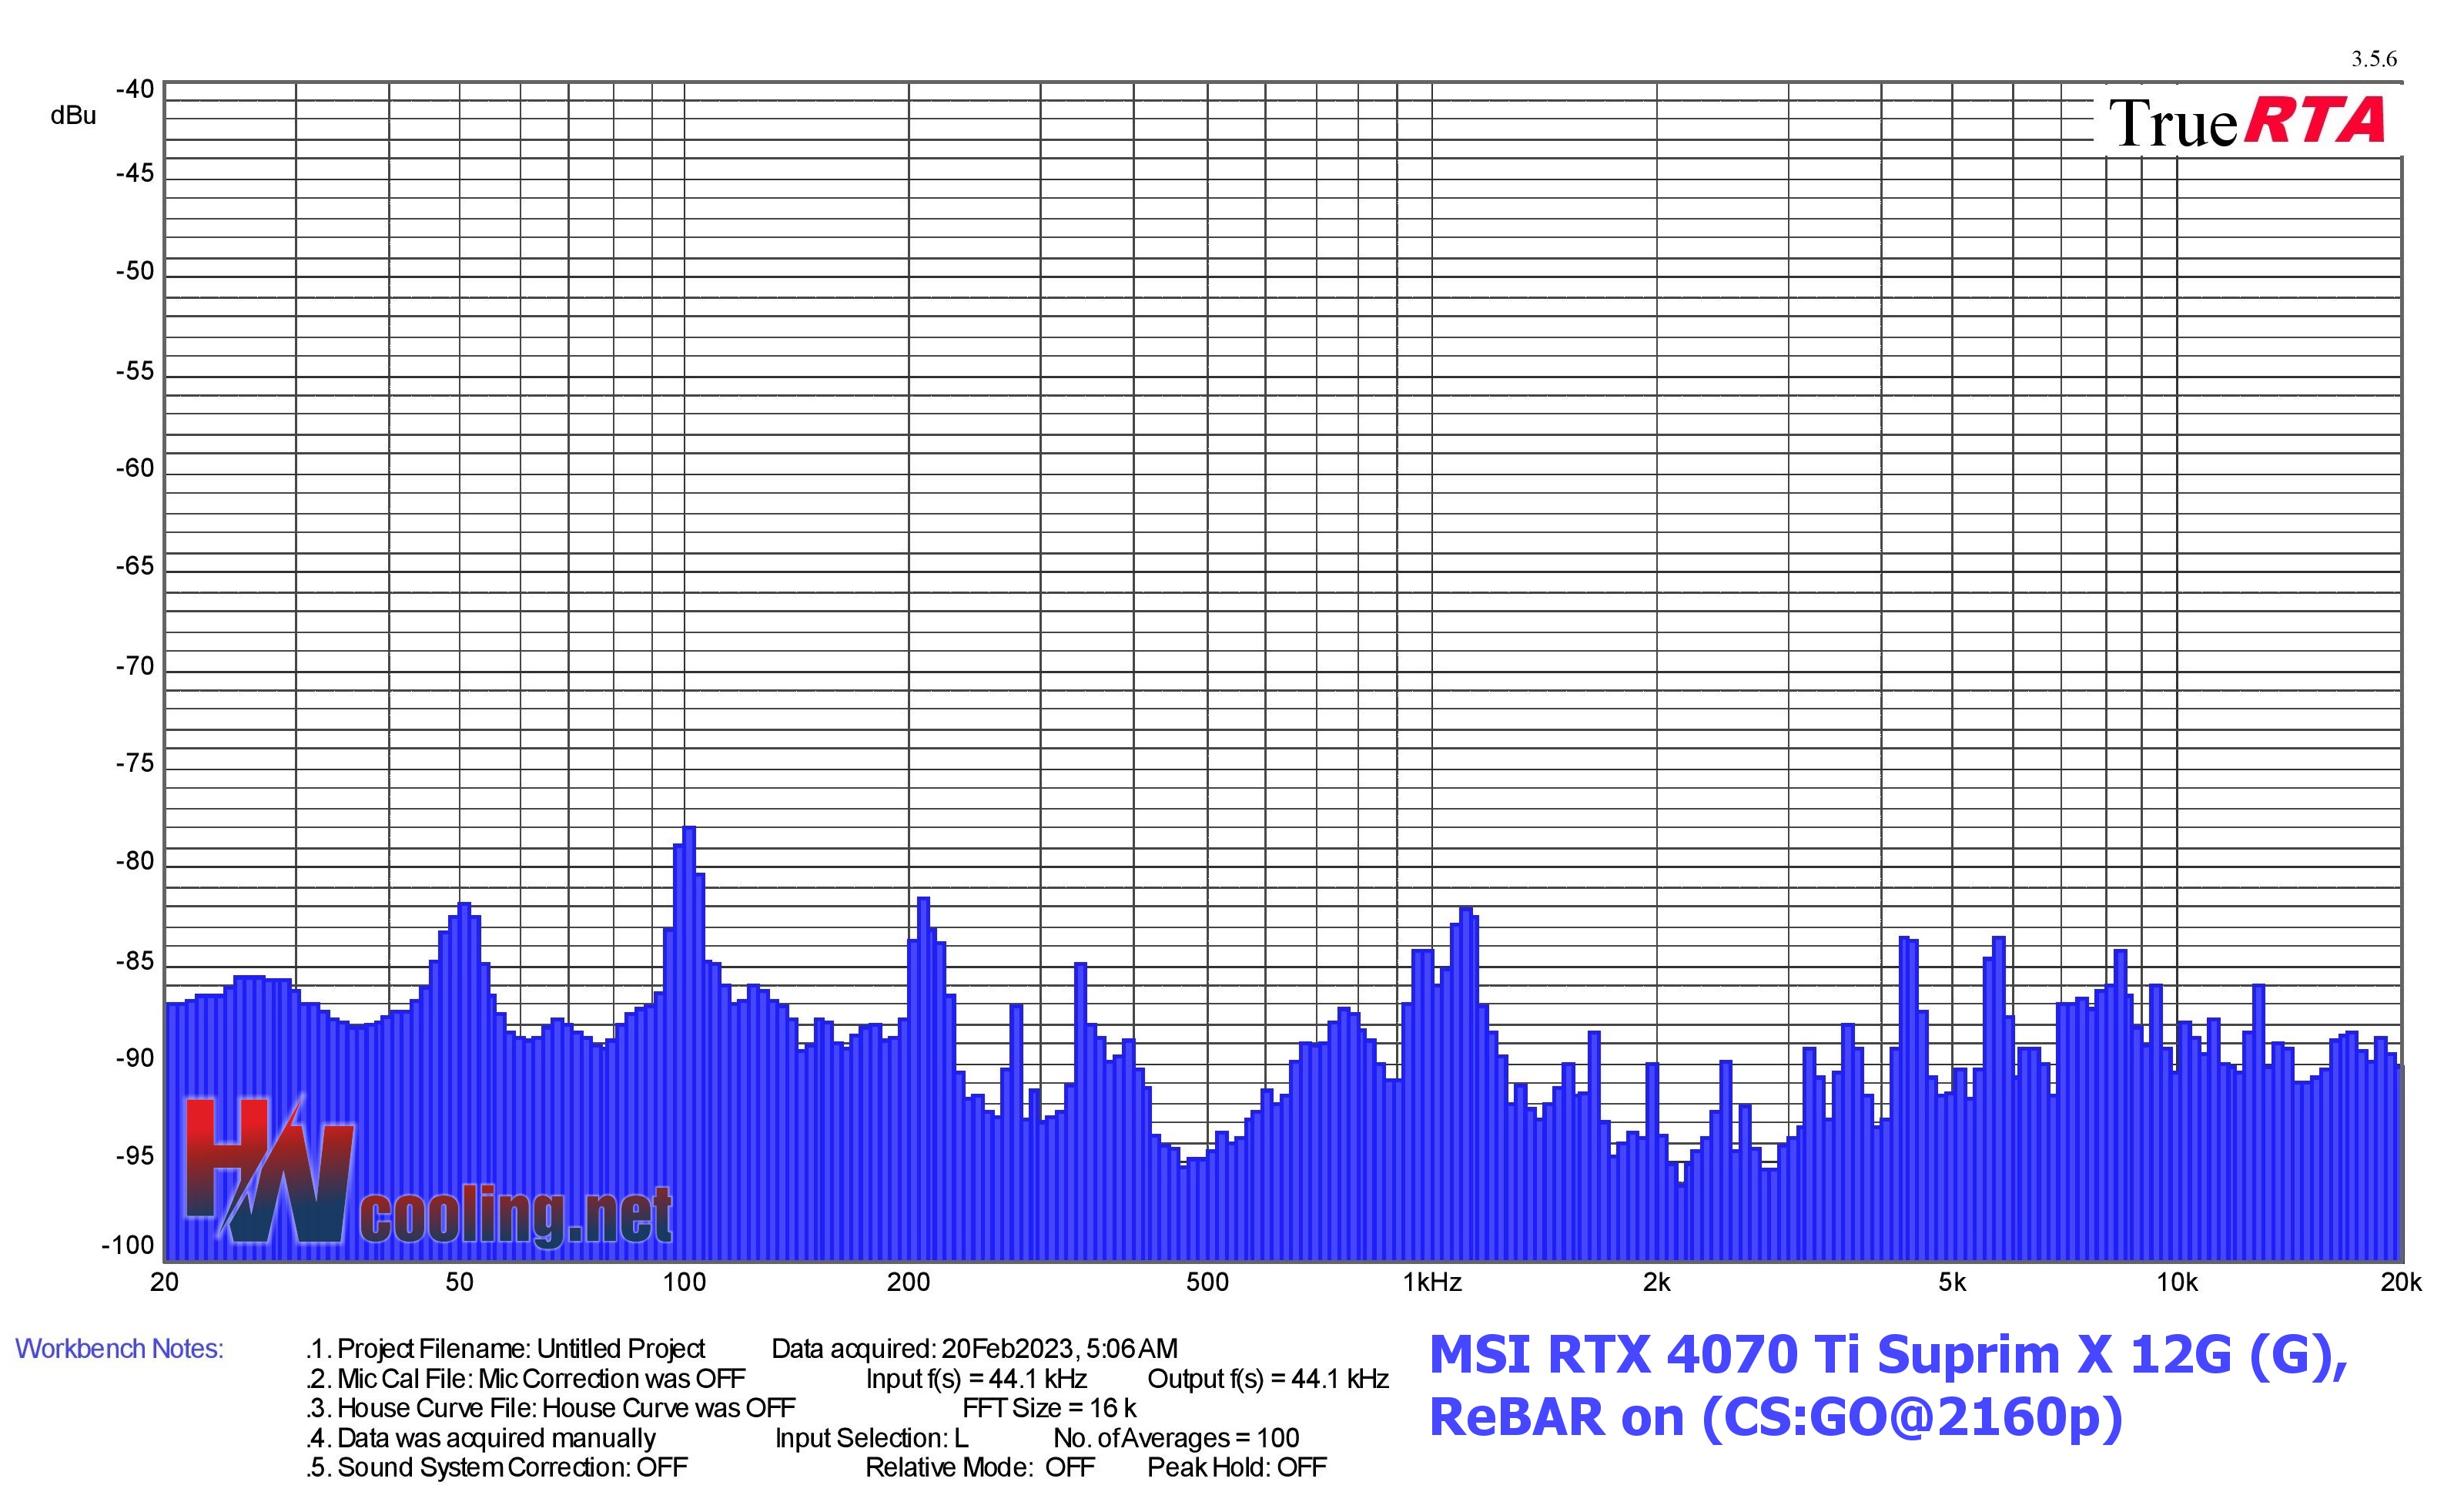
| Graphics card | Dominant sound freq. and noise level in CS:GO@2160p | NF-F12 PWM | NF-A15 PWM | ||||
| Low range | Mid range | High range | |||||
| Frequency [Hz] | Noise level [dBu] | Frequency [Hz] | Noise level [-dBu] | Frequency [Hz] | Noise level [-dBu] | ||
| MSI RTX 4070 Ti Suprim X 12G (G), ReBAR on | 100,8 | -77,9 | 207,5 | -81,6 | 4305,4 | -83,5 | |
| MSI RTX 4080 16GB Suprim X (G), ReBAR on | 100,8 | -79,0 | 1076,3 | -72,2 | 11830,8 | -76,4 | |
| MSI RTX 3050 Ventus 2X 8G OC, ReBAR off | 138,5 | -79,8 | 1107,9 | -77,6 | 2031,9 | -83,4 | |
| MSI RTX 3050 Ventus 2X 8G OC, ReBAR on | 123,4 | -81,0 | 1107,9 | -77,8 | 2031,9 | -83,6 | |
| Sapphire RX 6650 XT Nitro+ (P), ReBAR on | 50,4 | -79,6 | 1107,9 | -74,2 | 7240,8 | -80,8 | |
| Sapphire RX 6650 XT Nitro+ (P), ReBAR off | 49,0 | -84,3 | 1107,9 | -80,0 | 6834,4 | -80,2 | |
| Sapphire RX 6600 XT Pulse, ReBAR on | 100,8 | -68,7 | 1356,1 | -74,7 | 6088,7 | -80,8 | |
| Sapphire RX 6600 XT Pulse, ReBAR off | 100,8 | -69,3 | 1356,1 | -75,1 | 6088,7 | -79,2 | |
| Aorus RTX 3080 Xtreme 10G (OC), ReBAR on | 47,6 | -67,1 | 1045,7 | -49,6 | 2031,9 | -60,1 | |
| Aorus RTX 3080 Xtreme 10G (OC), ReBAR off | 47,6 | -70,3 | 1140,4 | -50,8 | 2031,9 | -60,2 | |
| Sapphire RX 6900 XT Toxic LE (P), ReBAR on | Sapphire RX 6900 XT Toxic LE (P), ReBAR on | 138,5 | -64,1 | 1107,9 | -60,1 | 8610,8 | -70,9 |
| Sapphire RX 6900 XT Toxic LE (P), ReBAR off | Sapphire RX 6900 XT Toxic LE (P), ReBAR off | 134,5 | -71,6 | 1107,9 | -66,4 | 8365,6 | -72,1 |
| Sapphire RX 6700 XT Nitro+ (P), ReBAR on | 100,8 | -72,6 | 1173,8 | -74,9 | 5915,4 | -74,6 | |
| Sapphire RX 6700 XT Nitro+ (P), ReBAR off | 100,8 | -75,0 | 1107,9 | -73,8 | 5747,0 | -74,2 | |
| MSI RTX 3060 Ti Gaming X Trio, ReBAR off | 100,8 | -71,4 | 1107,9 | -83,1 | 6267,2 | -82,5 | |
| Gigabyte RTX 3060 Eagle OC 12G, ReBAR off | 100,8 | -72,6 | 213,6 | -64,8 | 2031,9 | -73,8 | |
| MSI RTX 3090 Gaming X Trio, ReBAR off | 106,8 | -75,7 | 213,6 | -73,4 | 4695,1 | -77,6 | |
| MSI RTX 3070 Gaming X Trio, ReBAR off | 106,8 | -75,7 | 213,6 | -73,4 | 6267,2 | -82,7 | |
| AMD Radeon RX 6800, ReBAR on | 100,8 | -71,2 | 1107,9 | -66,2 | 9948,5 | -77,4 | |
| AMD Radeon RX 6800, ReBAR off | 100,8 | -71,1 | 1076,3 | -77,3 | 9665,3 | -77,7 | |
| TUF RTX 3080 O10G Gaming, ReBAR off | 100,8 | -74,2 | 1076,3 | -70,9 | 7240,8 | -74,4 | |
| AMD Radeon RX 6800 XT, ReBAR on | 100,8 | -73,0 | 1107,9 | -74,3 | 7671,3 | -72,4 | |
| AMD Radeon RX 6800 XT, ReBAR off | 100,8 | -72,3 | 1107,9 | -73,7 | 10848,9 | -72,5 |

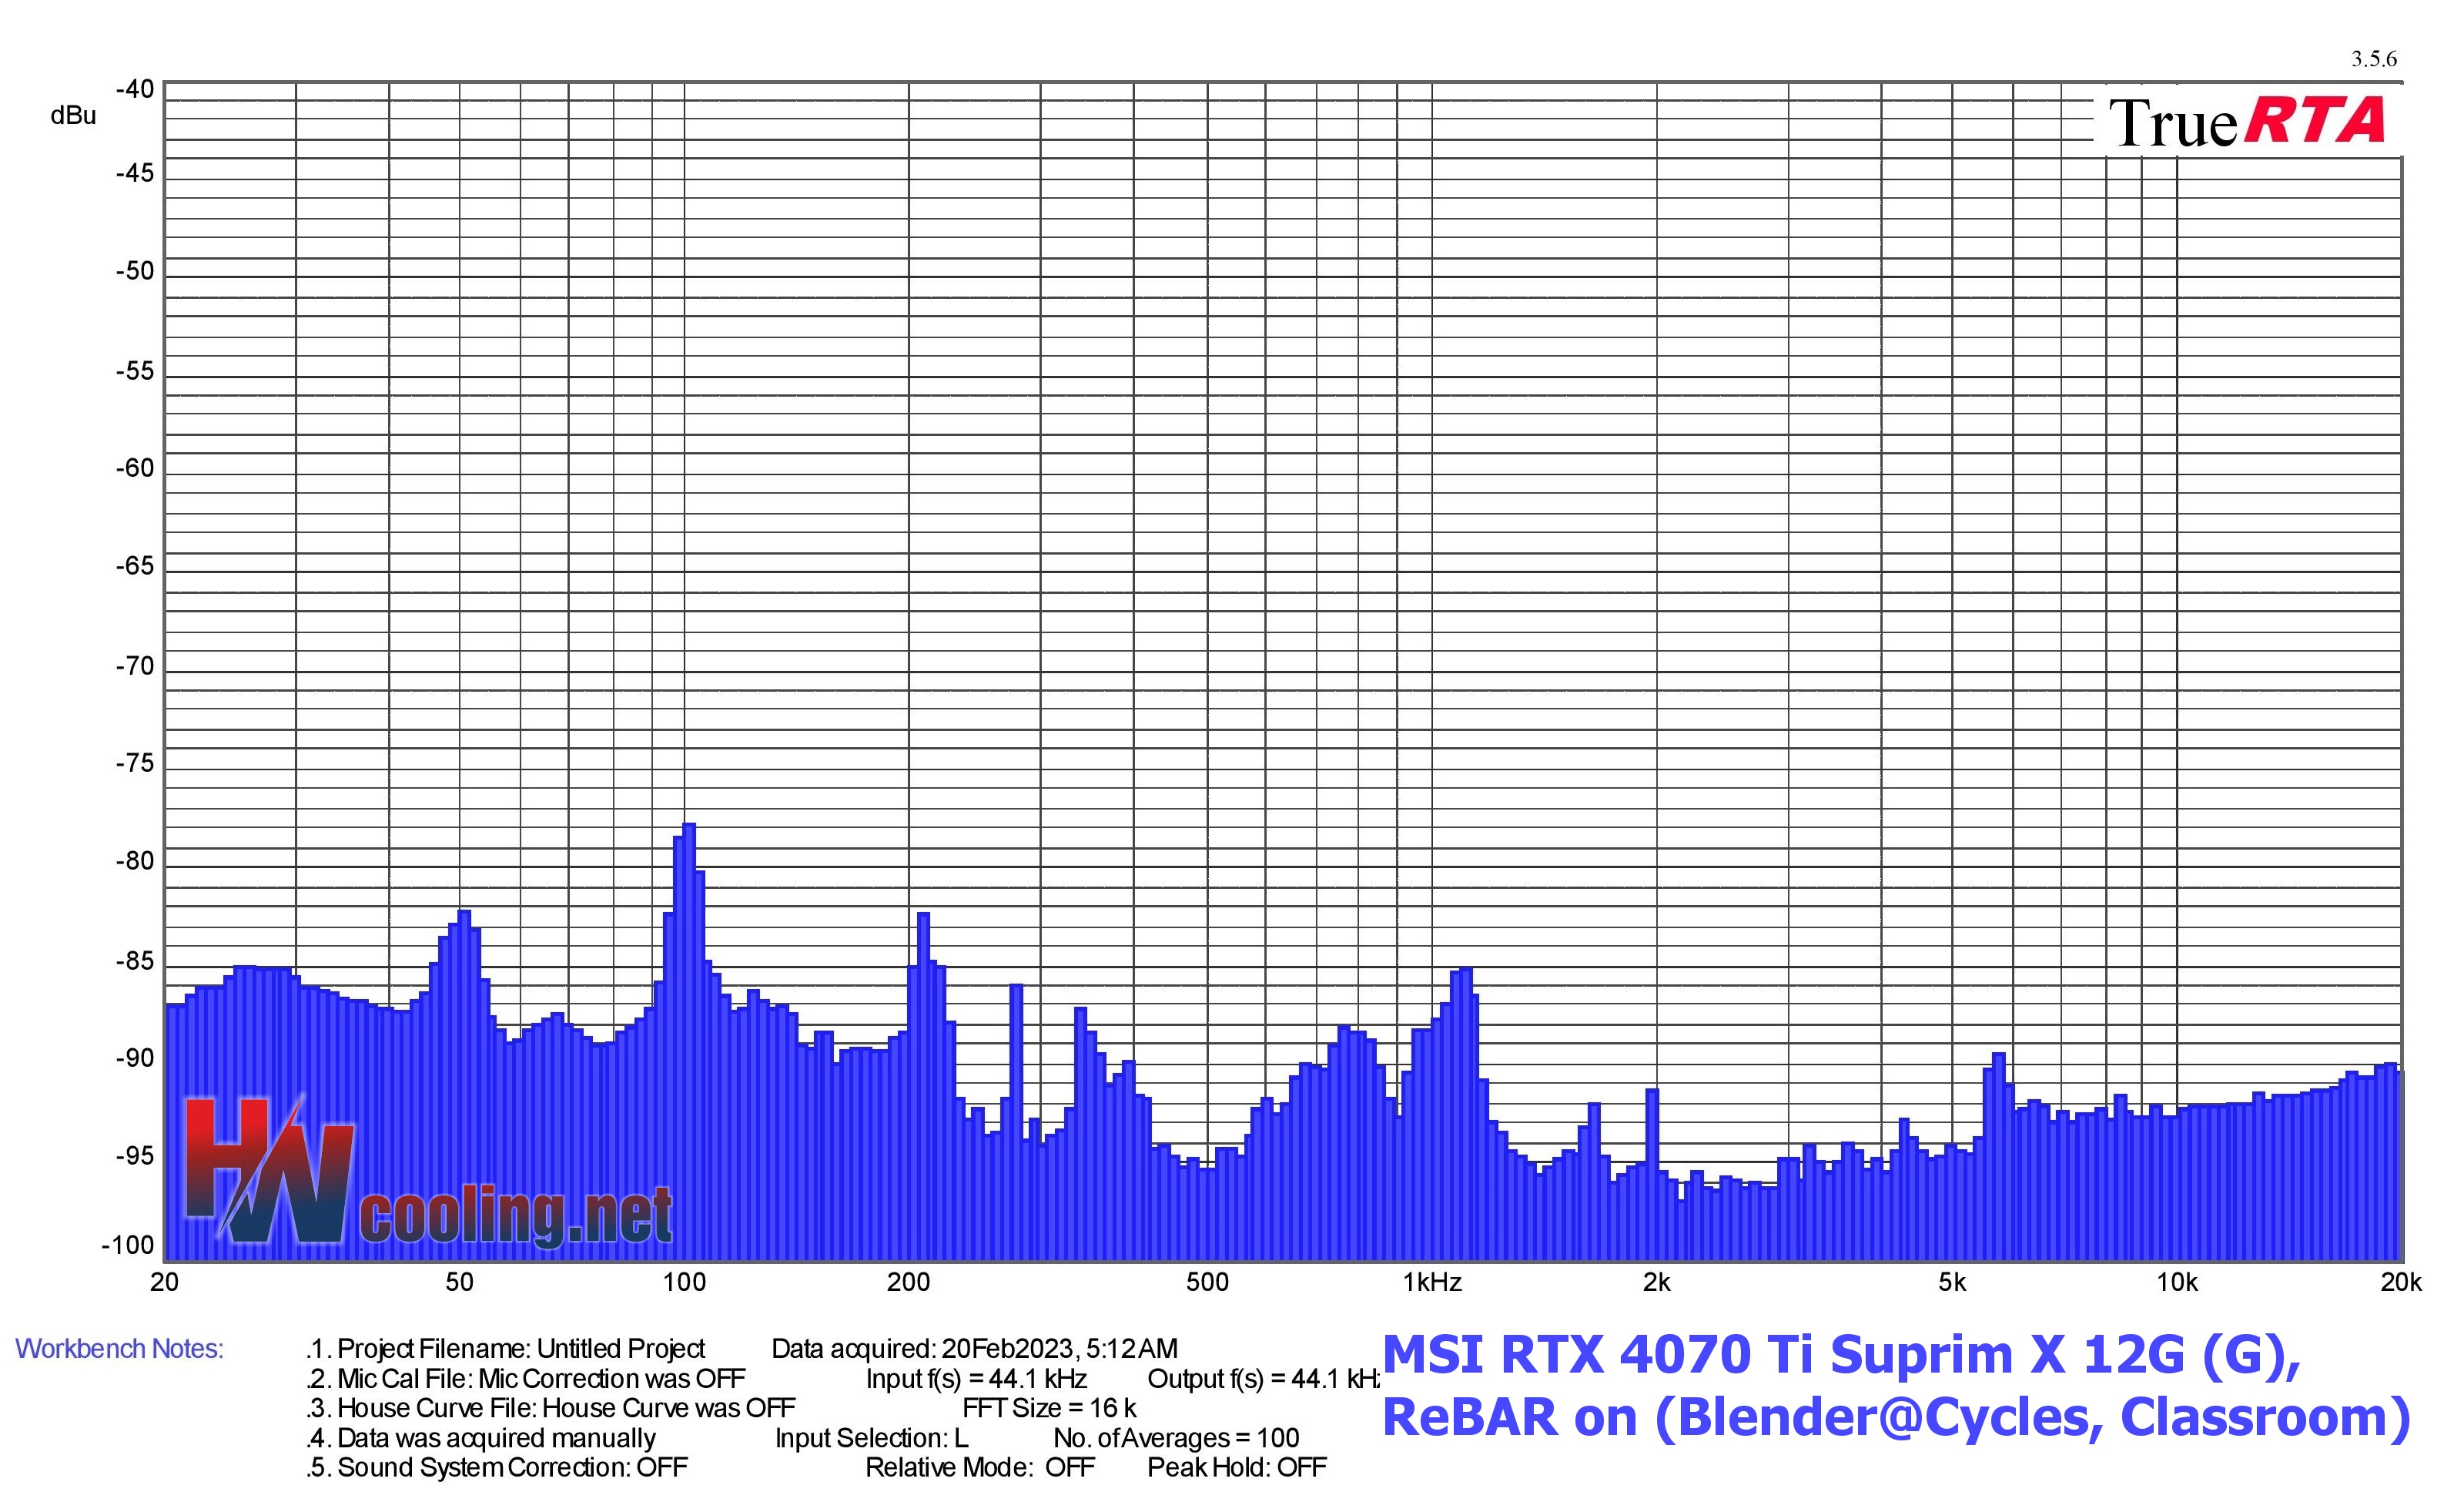
| Graphics card | Dominant sound freq. and noise level in Blender (Cycles), Classroom | NF-F12 PWM | NF-A15 PWM | ||||
| Low range | Mid range | High range | |||||
| Frequency [Hz] | Noise level [dBu] | Frequency [Hz] | Noise level [dBu] | Frequency [Hz] | Noise level [dBu] | ||
| MSI RTX 4070 Ti Suprim X 12G (G), ReBAR on | 100,8 | -77,8 | 207,5 | -82,3 | 5747,0 | -89,5 | |
| MSI RTX 4080 16GB Suprim X (G), ReBAR on | 100,8 | -80,3 | 1140,4 | -86,7 | 11830,8 | -89,4 | |
| MSI RTX 3050 Ventus 2X 8G OC, ReBAR off | 123,4 | -79,3 | 213,6 | -81,4 | 18245,6 | -85,5 | |
| MSI RTX 3050 Ventus 2X 8G OC, ReBAR on | 123,4 | -79,5 | 213,6 | -81,5 | 18245,6 | -85,6 | |
| Sapphire RX 6650 XT Nitro+ (P), ReBAR on | 50,4 | -77,9 | 1107,9 | -83,5 | 7240,8 | -87,3 | |
| Sapphire RX 6650 XT Nitro+ (P), ReBAR off | 50,4 | -79,1 | 1107,9 | -83,9 | 7240,8 | -87,5 | |
| Sapphire RX 6600 XT Pulse, ReBAR on | 100,8 | -70,1 | 1356,1 | -73,4 | 5583,4 | -86,1 | |
| Sapphire RX 6600 XT Pulse, ReBAR off | 100,8 | -69,8 | 1356,1 | -73,7 | 5915,4 | -86,0 | |
| Asus GT 1030 SL 2G BRK, ReBAR off | 50,397 | -71,7 | 1107,9 | -94,9 | 19330,5 | -90,5 | |
| Aorus RTX 3080 Xtreme 10G (OC), ReBAR on | 50,4 | -76,4 | 1107,9 | -57,9 | 2031,9 | -69,7 | |
| Aorus RTX 3080 Xtreme 10G (OC), ReBAR off | 50,4 | -78,7 | 1076,3 | -60,9 | 5424,5 | -74,0 | |
| Sapphire RX 6900 XT Toxic LE (P), ReBAR on | 116,5 | -65,0 | 1107,9 | -68,5 | 5120,0 | -77,3 | |
| Sapphire RX 6900 XT Toxic LE (P), ReBAR off | 116,5 | -65,1 | 1107,9 | -68,4 | 5120,0 | -77,1 | |
| Sapphire RX 6700 XT Nitro+ (P), ReBAR on | 100,8 | -72,6 | 1173,8 | -86,6 | 5915,4 | -82,4 | |
| Sapphire RX 6700 XT Nitro+ (P), ReBAR off | 100,8 | -75,8 | 1076,3 | -87,2 | 5915,4 | -82,1 | |
| MSI RTX 3060 Ti Gaming X Trio, ReBAR off | 100,8 | -70,4 | 987,0 | -89,5 | 6450,8 | -89,0 | |
| Gigabyte RTX 3060 Eagle OC 12G, ReBAR off | 100,8 | -72,6 | 213,6 | -70,0 | 2031,9 | -79,1 | |
| MSI RTX 3090 Gaming X Trio, ReBAR off | 100,8 | -71,2 | 1076,3 | -85,3 | 5915,4 | -92,0 | |
| MSI RTX 3070 Gaming X Trio, ReBAR off | 100,8 | -71,2 | 1076,3 | -85,3 | 18245,6 | -90,8 | |
| AMD Radeon RX 6800, ReBAR on | 100,8 | -71,9 | 987,0 | -89,2 | 7452,9 | -88,3 | |
| AMD Radeon RX 6800, ReBAR off | 100,8 | -71,1 | 987,0 | -89,0 | 7452,9 | -88,2 | |
| TUF RTX 3080 O10G Gaming, ReBAR off | 106,8 | -81,5 | 1660,0 | -80,6 | 6834,4 | -78,0 | |
| AMD Radeon RX 6800 XT, ReBAR on | 97,9 | -79,8 | 1208,2 | -89,6 | 7671,3 | -85,2 | |
| AMD Radeon RX 6800 XT, ReBAR off | 100,8 | -73,0 | 1243,6 | -95,2 | 7671,3 | -85,0 |
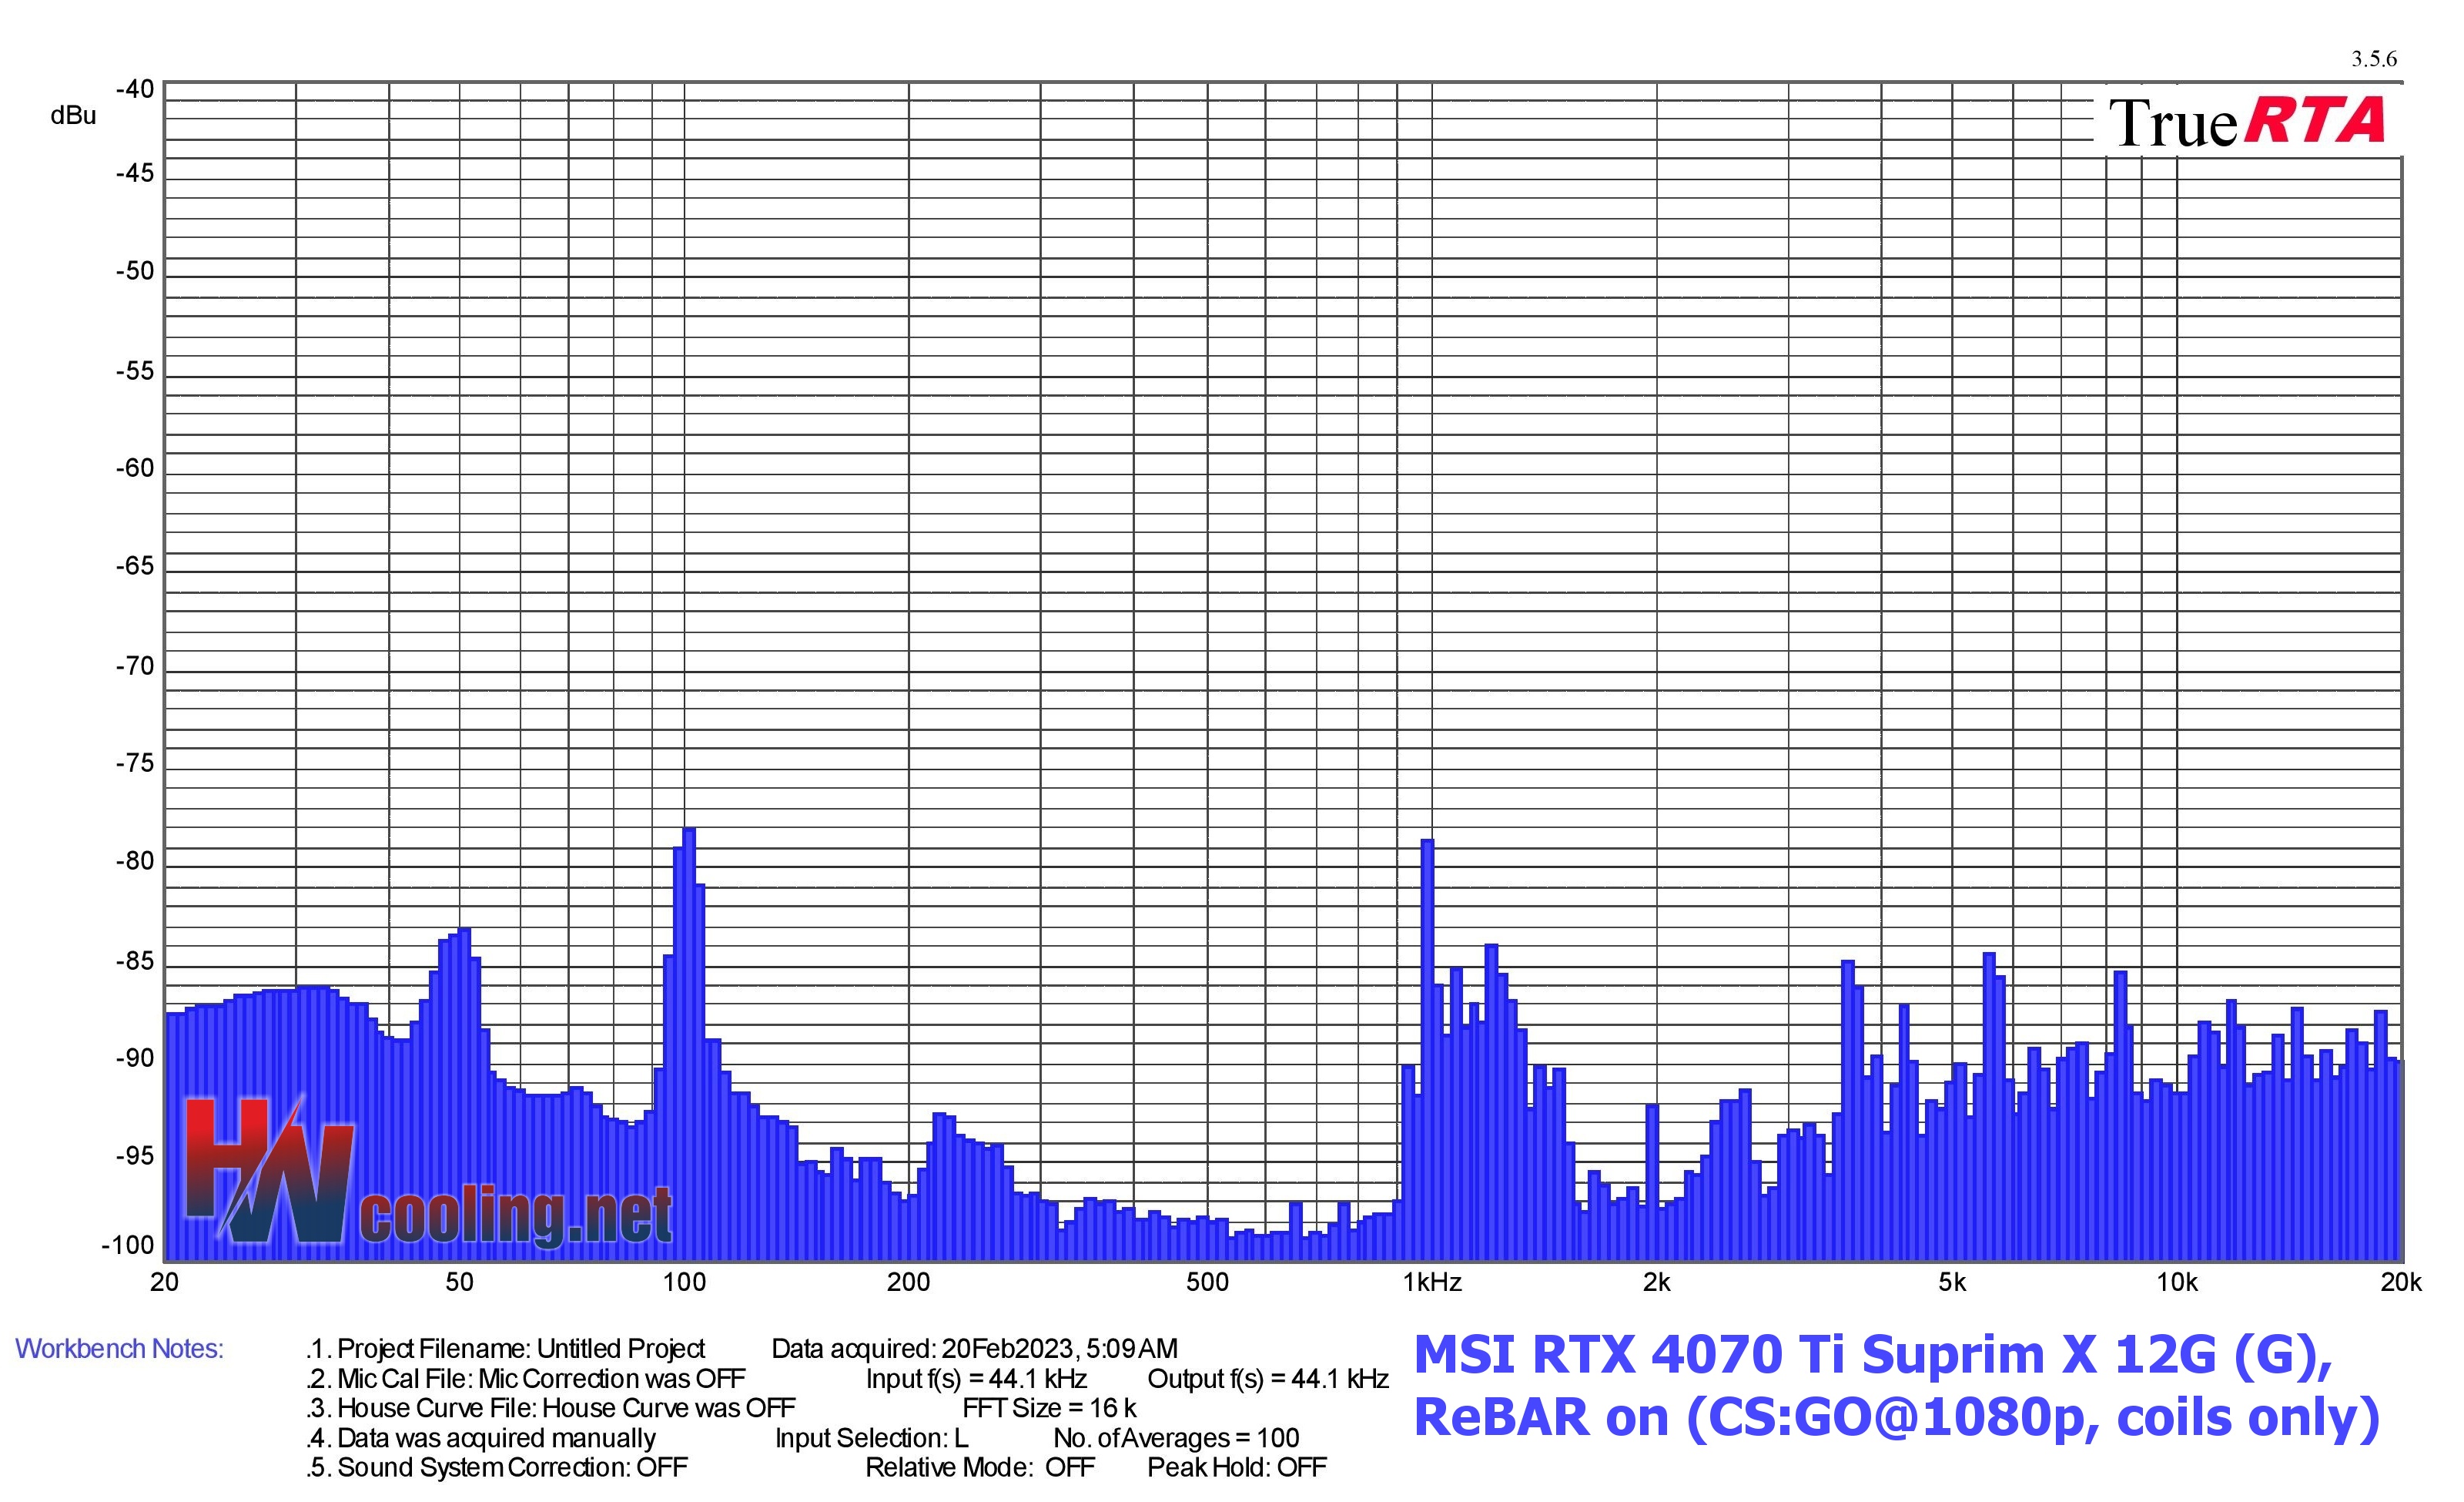
| Graphics card | Dominant sound freq. and noise level in CS:GO@1080p (coils only*) | NF-F12 PWM | NF-A15 PWM | ||||
| Low range | Mid range | High range | |||||
| Frequency [Hz] | Noise level [dBu] | Frequency [Hz] | Noise level [dBu] | Frequency [Hz] | Noise level [dBu] | ||
| MSI RTX 4070 Ti Suprim X 12G (G), ReBAR on | 100,8 | -78,0 | 987,0 | -78,6 | 5583,4 | -84,3 | |
| MSI RTX 4080 16GB Suprim X (G), ReBAR on | 100,8 | -80,5 | 1140,4 | -71,8 | 11830,8 | -74,9 | |
| MSI RTX 3050 Ventus 2X 8G OC, ReBAR off | 50,4 | -83,6 | 1317,5 | -83,0 | 7896,1 | -83,9 | |
| MSI RTX 3050 Ventus 2X 8G OC, ReBAR on | 50,4 | -77,7 | 1317,5 | -87,3 | 10848,9 | -84,5 | |
| Sapphire RX 6650 XT Nitro+ (P), ReBAR on | 50,4 | -81,8 | 1045,7 | -84,2 | 2091,4 | -77,7 | |
| Sapphire RX 6650 XT Nitro+ (P), ReBAR off | 50,4 | -83,3 | 1974,0 | -90,0 | 7034,6 | -82,4 | |
| Sapphire RX 6600 XT Pulse, ReBAR on | 100,8 | -72,0 | 1107,9 | -83,7 | 2215,8 | -79,6 | |
| Sapphire RX 6600 XT Pulse, ReBAR off | 100,8 | -68,4 | 1917,8 | -88,7 | 6450,8 | -81,4 | |
| Asus GT 1030 SL 2G BRK, ReBAR off | 50,4 | -71,1 | 1107,9 | -91,7 | 12534,3 | -89,8 | |
| Aorus RTX 3080 Xtreme 10G (OC), ReBAR on | 50,4 | -80,6 | 1660,0 | -80,3 | 7896,1 | -80,2 | |
| Aorus RTX 3080 Xtreme 10G (OC), ReBAR off | 50,4 | -78,8 | 1660,0 | -82,6 | 7671,3 | -80,4 | |
| Sapphire RX 6900 XT Toxic LE (P), ReBAR on | Sapphire RX 6900 XT Toxic LE (P), ReBAR on | 100,8 | -74,9 | 739,4 | -67,9 | 5915,4 | -78,5 |
| Sapphire RX 6900 XT Toxic LE (P), ReBAR off | Sapphire RX 6900 XT Toxic LE (P), ReBAR off | 50,4 | -81,4 | 739,4 | -70,2 | 8610,8 | -73,6 |
| Sapphire RX 6700 XT Nitro+ (P), ReBAR on | 100,8 | -74,6 | 987,0 | -84,8 | 5747,0 | -69,6 | |
| Sapphire RX 6700 XT Nitro+ (P), ReBAR off | 100,8 | -74,7 | 1395,9 | -88,4 | 5747,0 | -70,3 | |
| MSI RTX 3060 Ti Gaming X Trio, ReBAR off | 100,8 | -73,0 | 1974,0 | -88,1 | 6267,2 | -83,6 | |
| Gigabyte RTX 3060 Eagle OC 12G, ReBAR off | 100,8 | -73,6 | 1974,0 | -90,2 | 6088,7 | -83,1 | |
| MSI RTX 3090 Gaming X Trio, ReBAR off | 50,4 | -76,1 | 987,0 | -84,8 | 5915,4 | -83,3 | |
| MSI RTX 3070 Gaming X Trio, ReBAR off | 100,8 | -74,7 | 1317,5 | -81,4 | 6088,7 | -84,6 | |
| AMD Radeon RX 6800, ReBAR on | 100,8 | -71,8 | 987,0 | -87,7 | 7452,9 | -80,4 | |
| AMD Radeon RX 6800, ReBAR off | 100,8 | -72,0 | 1660,0 | -90,4 | 8863,1 | -84,5 | |
| TUF RTX 3080 O10G Gaming, ReBAR off | 100,8 | -75,6 | 1140,4 | -81,7 | 9948,5 | -78,7 | |
| AMD Radeon RX 6800 XT, ReBAR on | 100,8 | -73,6 | 1660,0 | -79,8 | 7452,9 | -74,0 | |
| AMD Radeon RX 6800 XT, ReBAR off | 100,8 | -73,3 | 1660,0 | -83,3 | 7452,9 | -76,4 |
*With the Sapphire RX 6900 XT Toxic LE, as with the only tested graphics card, the spectral analysis also includes the sound of the water pump.
After the GeForce RTX 4080 graphics cards, which wasn’t to many people’s taste due to the higher price, Nvidia has released a significantly cheaper GPU for the GeForce RTX 4070 Ti. The performance versus the RTX 4080 is admittedly noticeably weaker, but percentage-wise not by as much as the roughly two-thirds lower price of the RTX 4070 Ti. In our tests, we analyze MSI’s non-reference design from the top-of-the-line Suprim X series.
Conclusion
The RTX 4070 Ti’s gaming performance is approximately 20% (without raytracing graphics) to 25% (with RT) below the RTX 4080. This puts it very just above the top GeForce and Radeon graphics card models from the previous generation. However, the RTX 4070 Ti is always the lower-power and more efficient choice compared to them, although compared to the RTX 4080, its efficiency is lower.
From a raw performance perspective, the RTX 4070 Ti is some 75–80% of the RTX 4080, but at nearly 90% (of the RTX 4080’s) power draw. This is partly due to the fact that the RTX 4070 Ti partially compensates for the lack of computing units with higher clock speeds (with a more aggressive power supply), thus trying to squeeze out gaming performance in particular. However, the latter is still significantly higher per unit of power draw than with the RTX 3080 (+ approx. 70%) or the RX 6900 XT (+ approx. 50%).
For gaming, the RTX 4070 Ti is suitable up to 1440p resolution (especially for monitors with very high refresh rates) or up to 2160p, where the CPU bottleneck is the smallest. With bright exceptions (like Cyperpunk 2077), the vast majority of games on the RTX 4070 Ti don’t drop below 60 fps, even at UHD resolution with graphical detail set to maximum. With ray-tracing, it’s already “worse” and DLSS needs to be applied for smooth or smoother operation. For example, you can bring Control (with DLSS on “performance”) from an average of 34 to 103 fps, Cyperpunk 2077 from an unplayable 18 to 73 fps. Games with less extensive RT graphics, such as Shadow of the Tomb Raider or Battlefield V, are snappy on the RTX 4070 Ti even at native UHD resolution.
Speed increase in games over the RTX 3090 (Ti) occurs in the vast majority of cases, but there are also situations where the opposite trend can be observed. Such games include Total War Saga: Troy or, paradoxically, even the undemanding Age of Empires II: DE. The power draw is also low in this game, so obviously the GPU resources are not being properly utilized.
A significantly above-average increase in gaming performance over the RTX 3080, for example, is in DOOM Eternal, up to 20%. Rather than comparing to older graphics cards, we’ll be prospectively interested in how the RTX 4070 Ti as well as the RTX 4080 will stand up against the competing Radeon RX 7900 XT.
For those not buying a graphics card for gaming: The computing performance available for 3D rendering is between the RTX 4080 and RTX 3080. The RTX 4070 Ti is roughly 25–28% away from both, in one case (RTX 3080) to the plus, in the other (RTX 4080) to the minus. If you are interested in performance in Autodesk applications (3Ds Max, Creo, Maya, …) or acceleration of graphic editors (Adobe Photoshop or Affinity Photo), we’ve tested that as well.
And now more specifically to the tested RTX 4070 Ti – the Suprim X. GPU clock speeds are super high in boost, 2840–2860 MHz, but that won’t be the case with the cheaper models.
The cooler is perfect, it doesn’t let the GPU or memory temperatures get high and at the same time even at maximum performance it is extremely quiet regardless of the BIOS (Silent/Performance), one of the quietest in the tests. It’s practically on par with the quiet RTX 3050 Ventus 2X 8G OC with less than half the power draw. However, again this is somewhat spoiled by the coils, which are considerably more annoying than the aerodynamic component of the sound. While their noise intensity is lower than the RTX 4080, they’re still louder than, say, on the RTX 3090 Gaming X Trio. It is technically quite possible to make significantly quieter coils, but apparently the voice of the people on this matter is too weak to motivate the manufacturers in any way. Either way, though, the execution of the MSI RTX 4070 Ti Suprim X graphics card is top-notch, and it doesn’t leave much room for other non-reference variants to excel at anything.
English translation and edit by Jozef Dudáš
| MSI RTX 4070 Ti Suprim X 12G |
| + Veľmi vysoký výkon (vhodný i na hranie v 2160p/4K) |
| + Veľmi slušný výkon s ray-tracingom |
| + Atraktívna efektivita – vysoký výkon na jednotku spotreby |
| + Exkluzívna podpora DLSS (3), CUDA a OptiX |
| + V kontexte iných (lacnejších) RTX 4070 Ti veľmi vysoké frekvencie GPU |
| + Podpora kódovania AV1 |
| + Súčasťou balenia je i držiak/podpera slotu PCI Express |
| + Efektné osvetlenie RGB LED |
| + Atraktívnejší pomer cena/výkon ako u RTX 4080 |
| + Veľmi tichý chladič Tri Frozr 3S |
| - V porovnaní s RTX 4080 nižšia efektivita (nižší výkon na watt) |
| - Celkovo väčšie rozmery a horšia kompatibilita so skrinkami |
| - DisplayPort iba vo verzii 1.4a (týka sa všetkých RTX 4070 Ti, resp. grafických kariet GeForce Ada Lovelace) |
| Odporúčaná koncová cena: 1055 eur/24 999 Kč |
We are grateful to e-shopu Datacomp for their cooperation in providing the tested hardware
![]()

- Contents
- MSI RTX 4070 Ti Suprim X 12G in detail
- Table of parameters
- Methodology: performance tests
- Methodology: how we measure power draw
- Methodology: noise and sound measurement
- Methodology: temperature tests
- Test setup
- 3DMark
- Age of Empires II: DE
- Assassin’s Creed: Valhalla
- Battlefield V
- Battlefield V with DXR
- Borderlands 3
- Control
- Control with DXR and DLSS
- Counter-Strike: GO
- Cyberpunk 2077
- Cyberpunk 2077 with DLSS
- Cyberpunk 2077 with DXR (and DXR with DLSS)
- DOOM Eternal
- F1 2020
- FIFA 21
- Forza Horizon 4
- Mafia: DE
- Metro Exodus
- Metro Exodus with DXR and DLSS
- Microsoft Flight Simulator
- Red Dead Redemption 2 (Vulkan)
- Red Dead Redemption 2 (Dx12)
- Shadow of the Tomb Raider
- Shadow of the Tomb Raider with DXR
- Total War Saga: Troy
- Wasteland 3
- Overall gaming performance and performance per euro
- CompuBench (OpenCL)
- SPECviewperf 2020 and SPECworkstation 3
- FLOPS, IOPS and memory speed tests
- 3D rendering 1/2 (LuxMark a Blender@Cycles)
- 3D rendering 2/2 (Blender@Radeon ProRender and Eevee)
- Photo editing (Adobe Photoshop, Lightroom and Affinity Photo)
- Broadcasting (OBS and Xsplit)
- Password cracking
- GPU clock speeds
- GPU and VRAM temperatures
- Net GPU power draw and performance per watt
- Analysis of 12 V branch power supply (higher load)
- Analysis of 12 V branch power supply (lower load)
- Analysis of 3,3 V branch power supply
- Noise level
- Frequency response of sound
- Conclusion