


Intel Core i5-14400F (C0 vs. B0)
For completeness of Intel Core i5-14400F processor tests we add the results of its second stepping. We’ve already tested the B0 variant, now it’s time for the C0. Its availability in stores is, at least at the moment, considerably worse and the question arises whether it is worth it at all. Is there any point in aiming for stepping C0 or is B0 also “okay”? Or does it “not matter” (what you get in the shopping lottery)?
Tests of various steppings in the popular Intel Core i5 1×400(F) processor series are already considered something of a tradition. After the 12400/F (C0 and H0), 13400/F (B0 and C0) models, there’s the 14400/F (B0 and C0) to round out the trio.
Intel Core i5-14400F (C0 vs. B0)
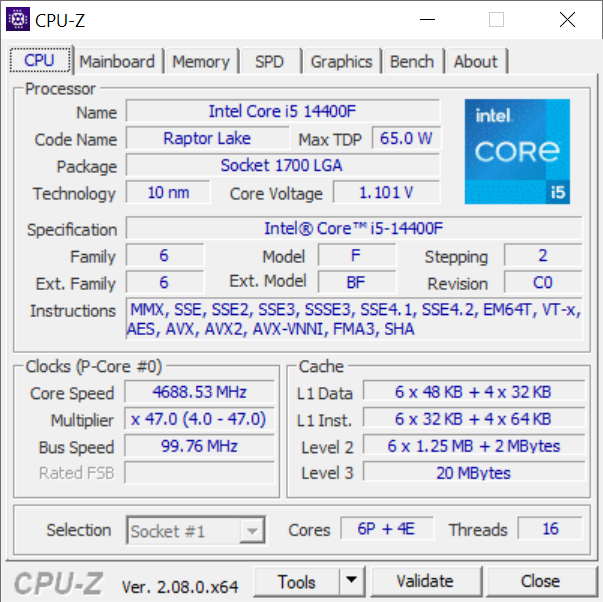
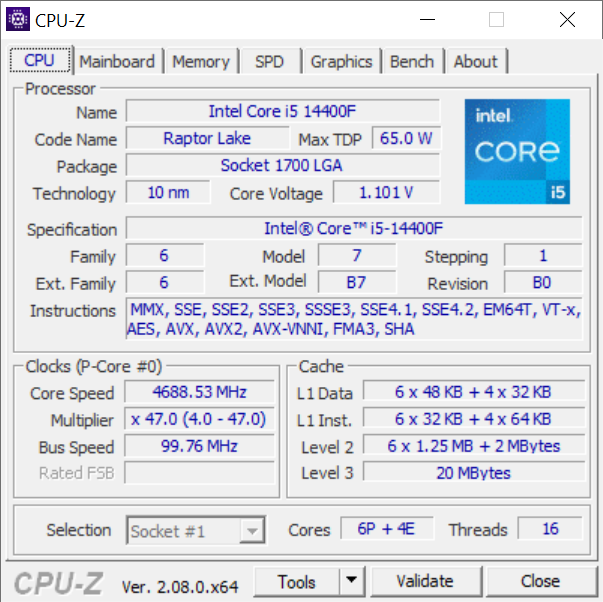
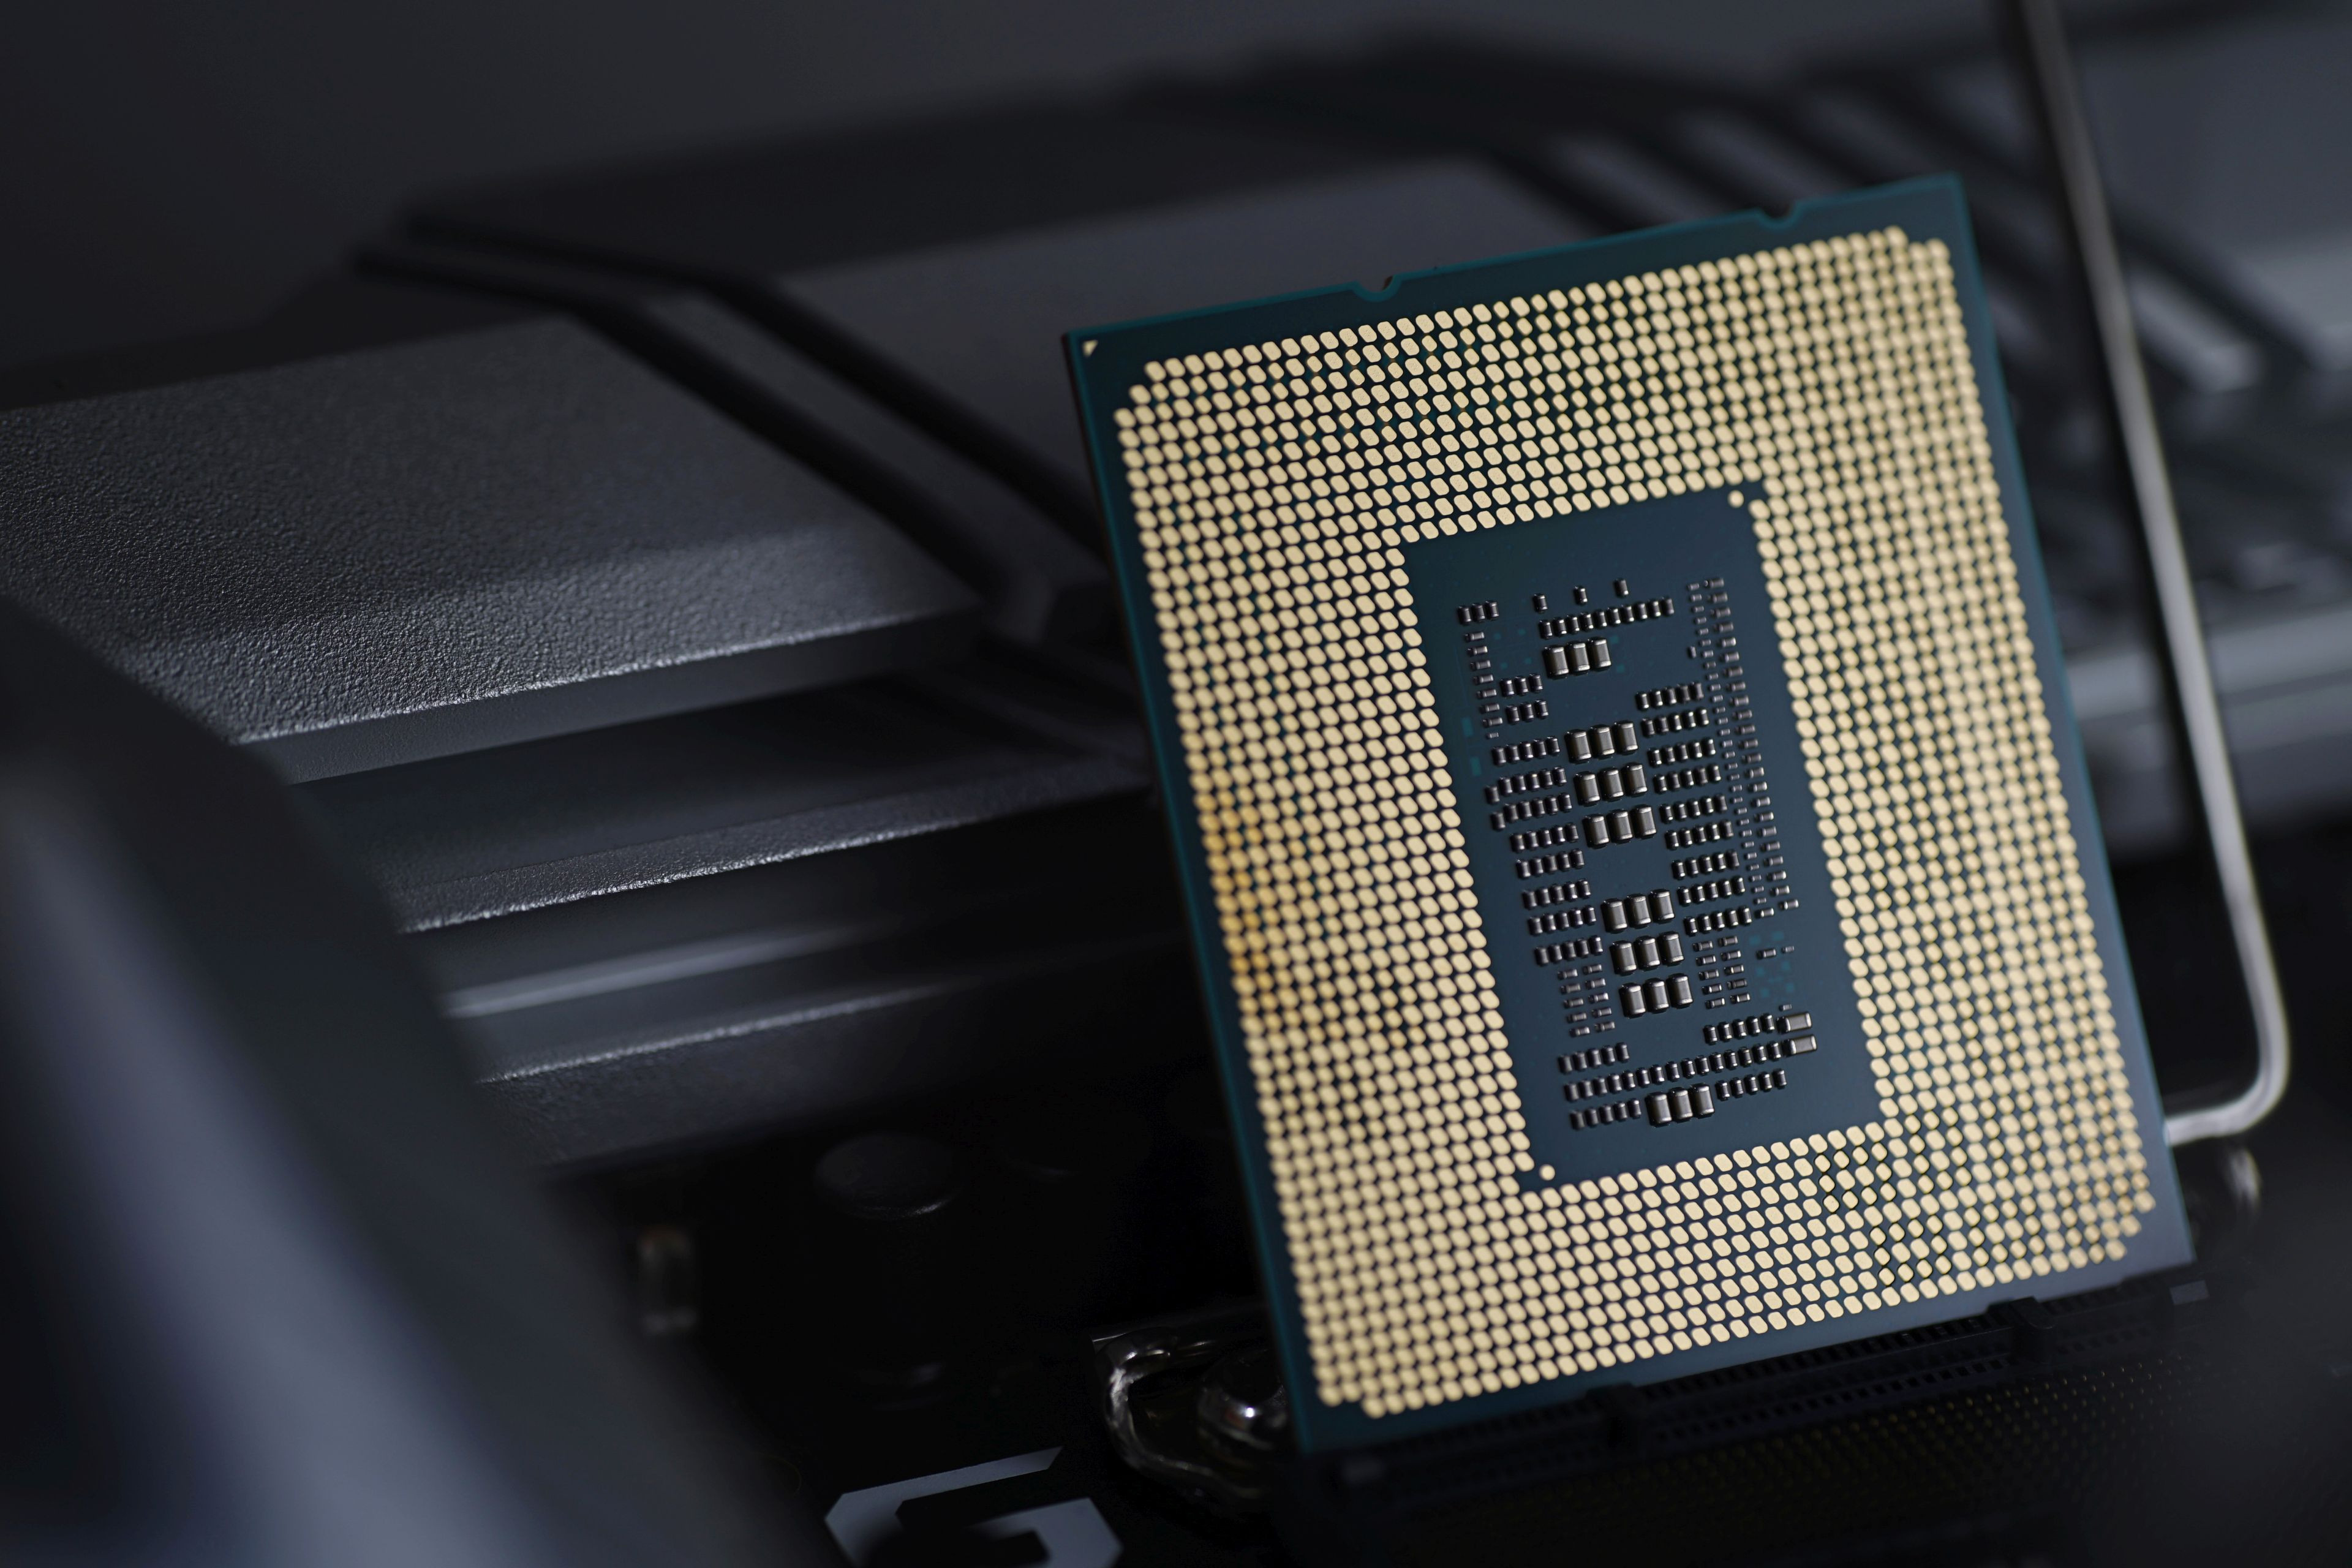
At the hardware level, the difference is that while stepping B0 is based on the Raptor Lake generation (produced by the Intel 7 Ultra process) and is built on a larger core with physically 8 P and 16 E cores, stepping C0 has a smaller “Alder Lake” silicon chip (Intel 7), which has the same number of (8) P cores, but with half the number (8) of E cores.
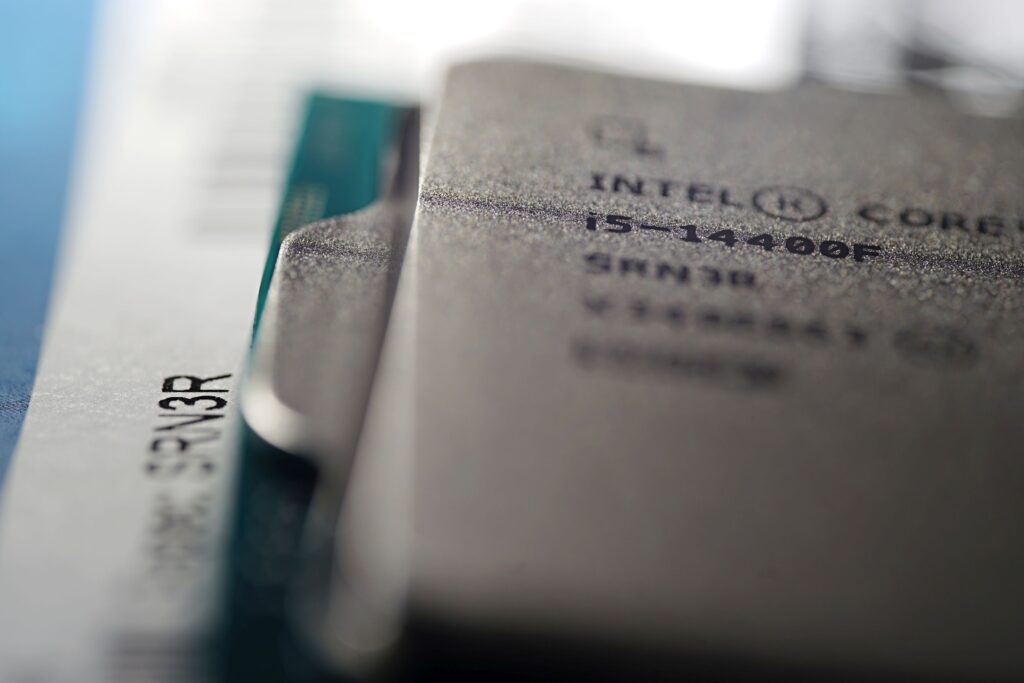
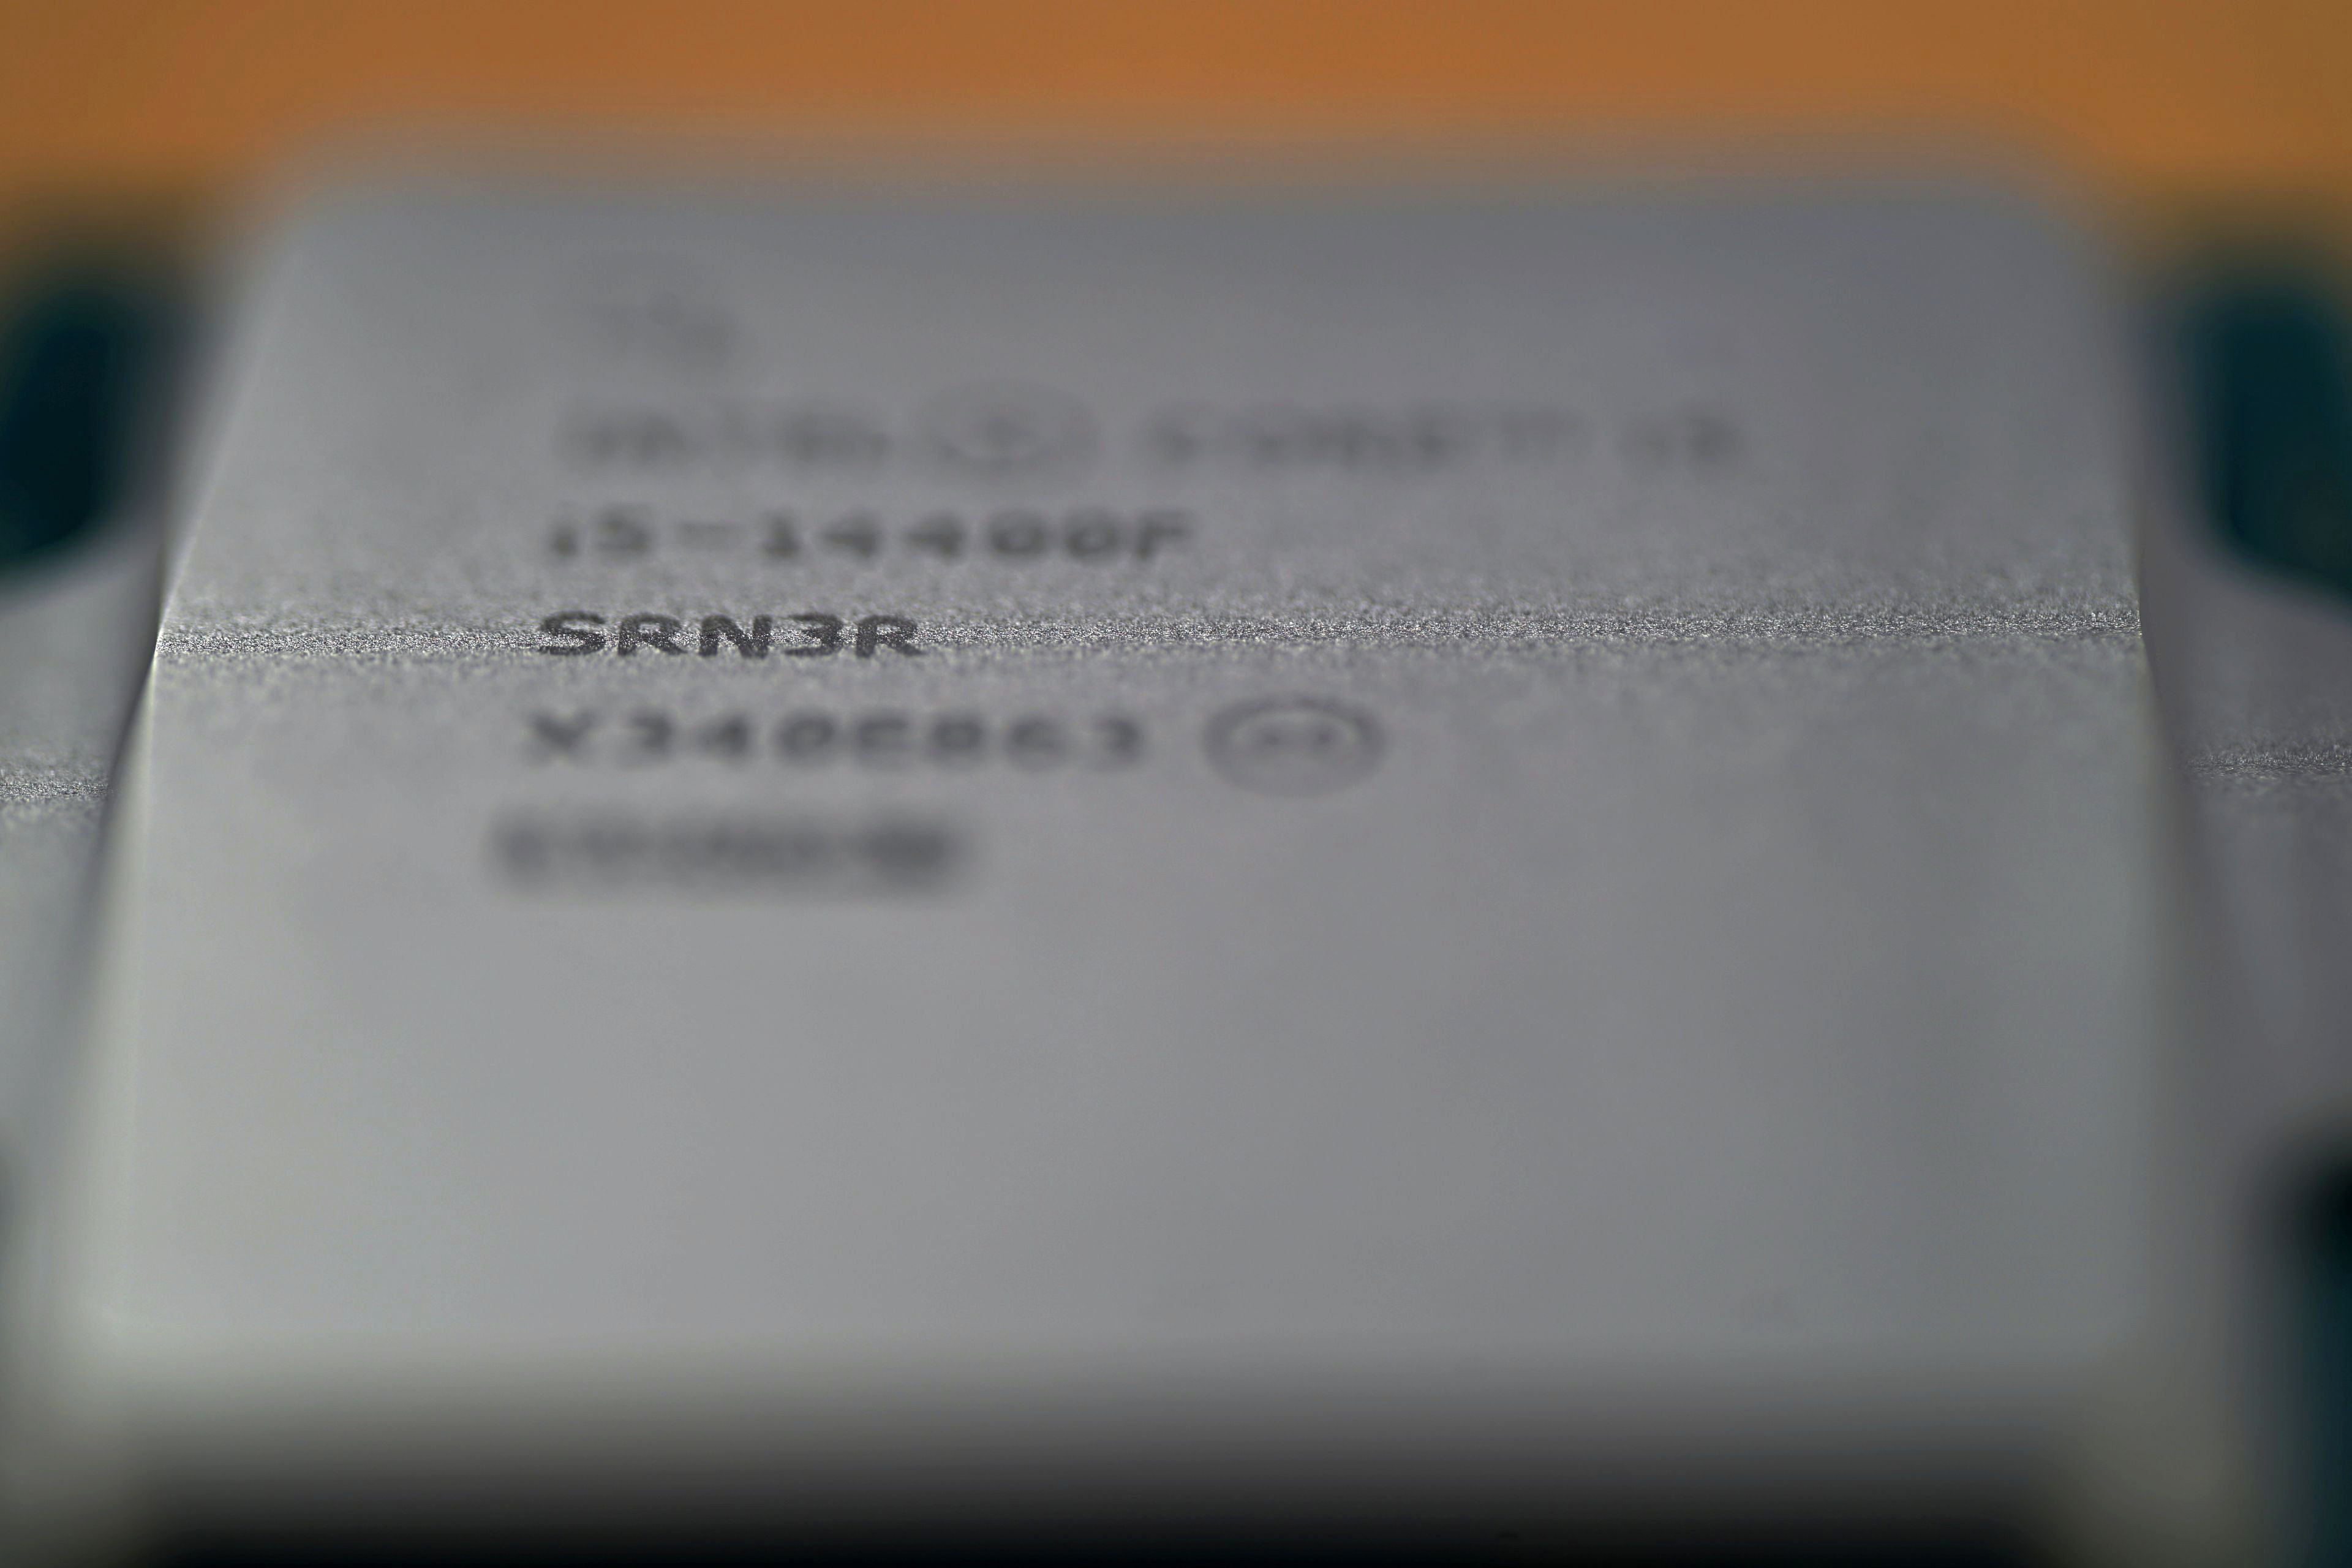
The processor stepping can be distinguished from each other at a glance by external features such as the S-Spec code (on the IHS of the processor itself and also listed on the barcode on the package label) or the SMD composition between the contacts on the bottom of the processor. Each of the steppings has this layout done differently, according to the needs of the chip itself.
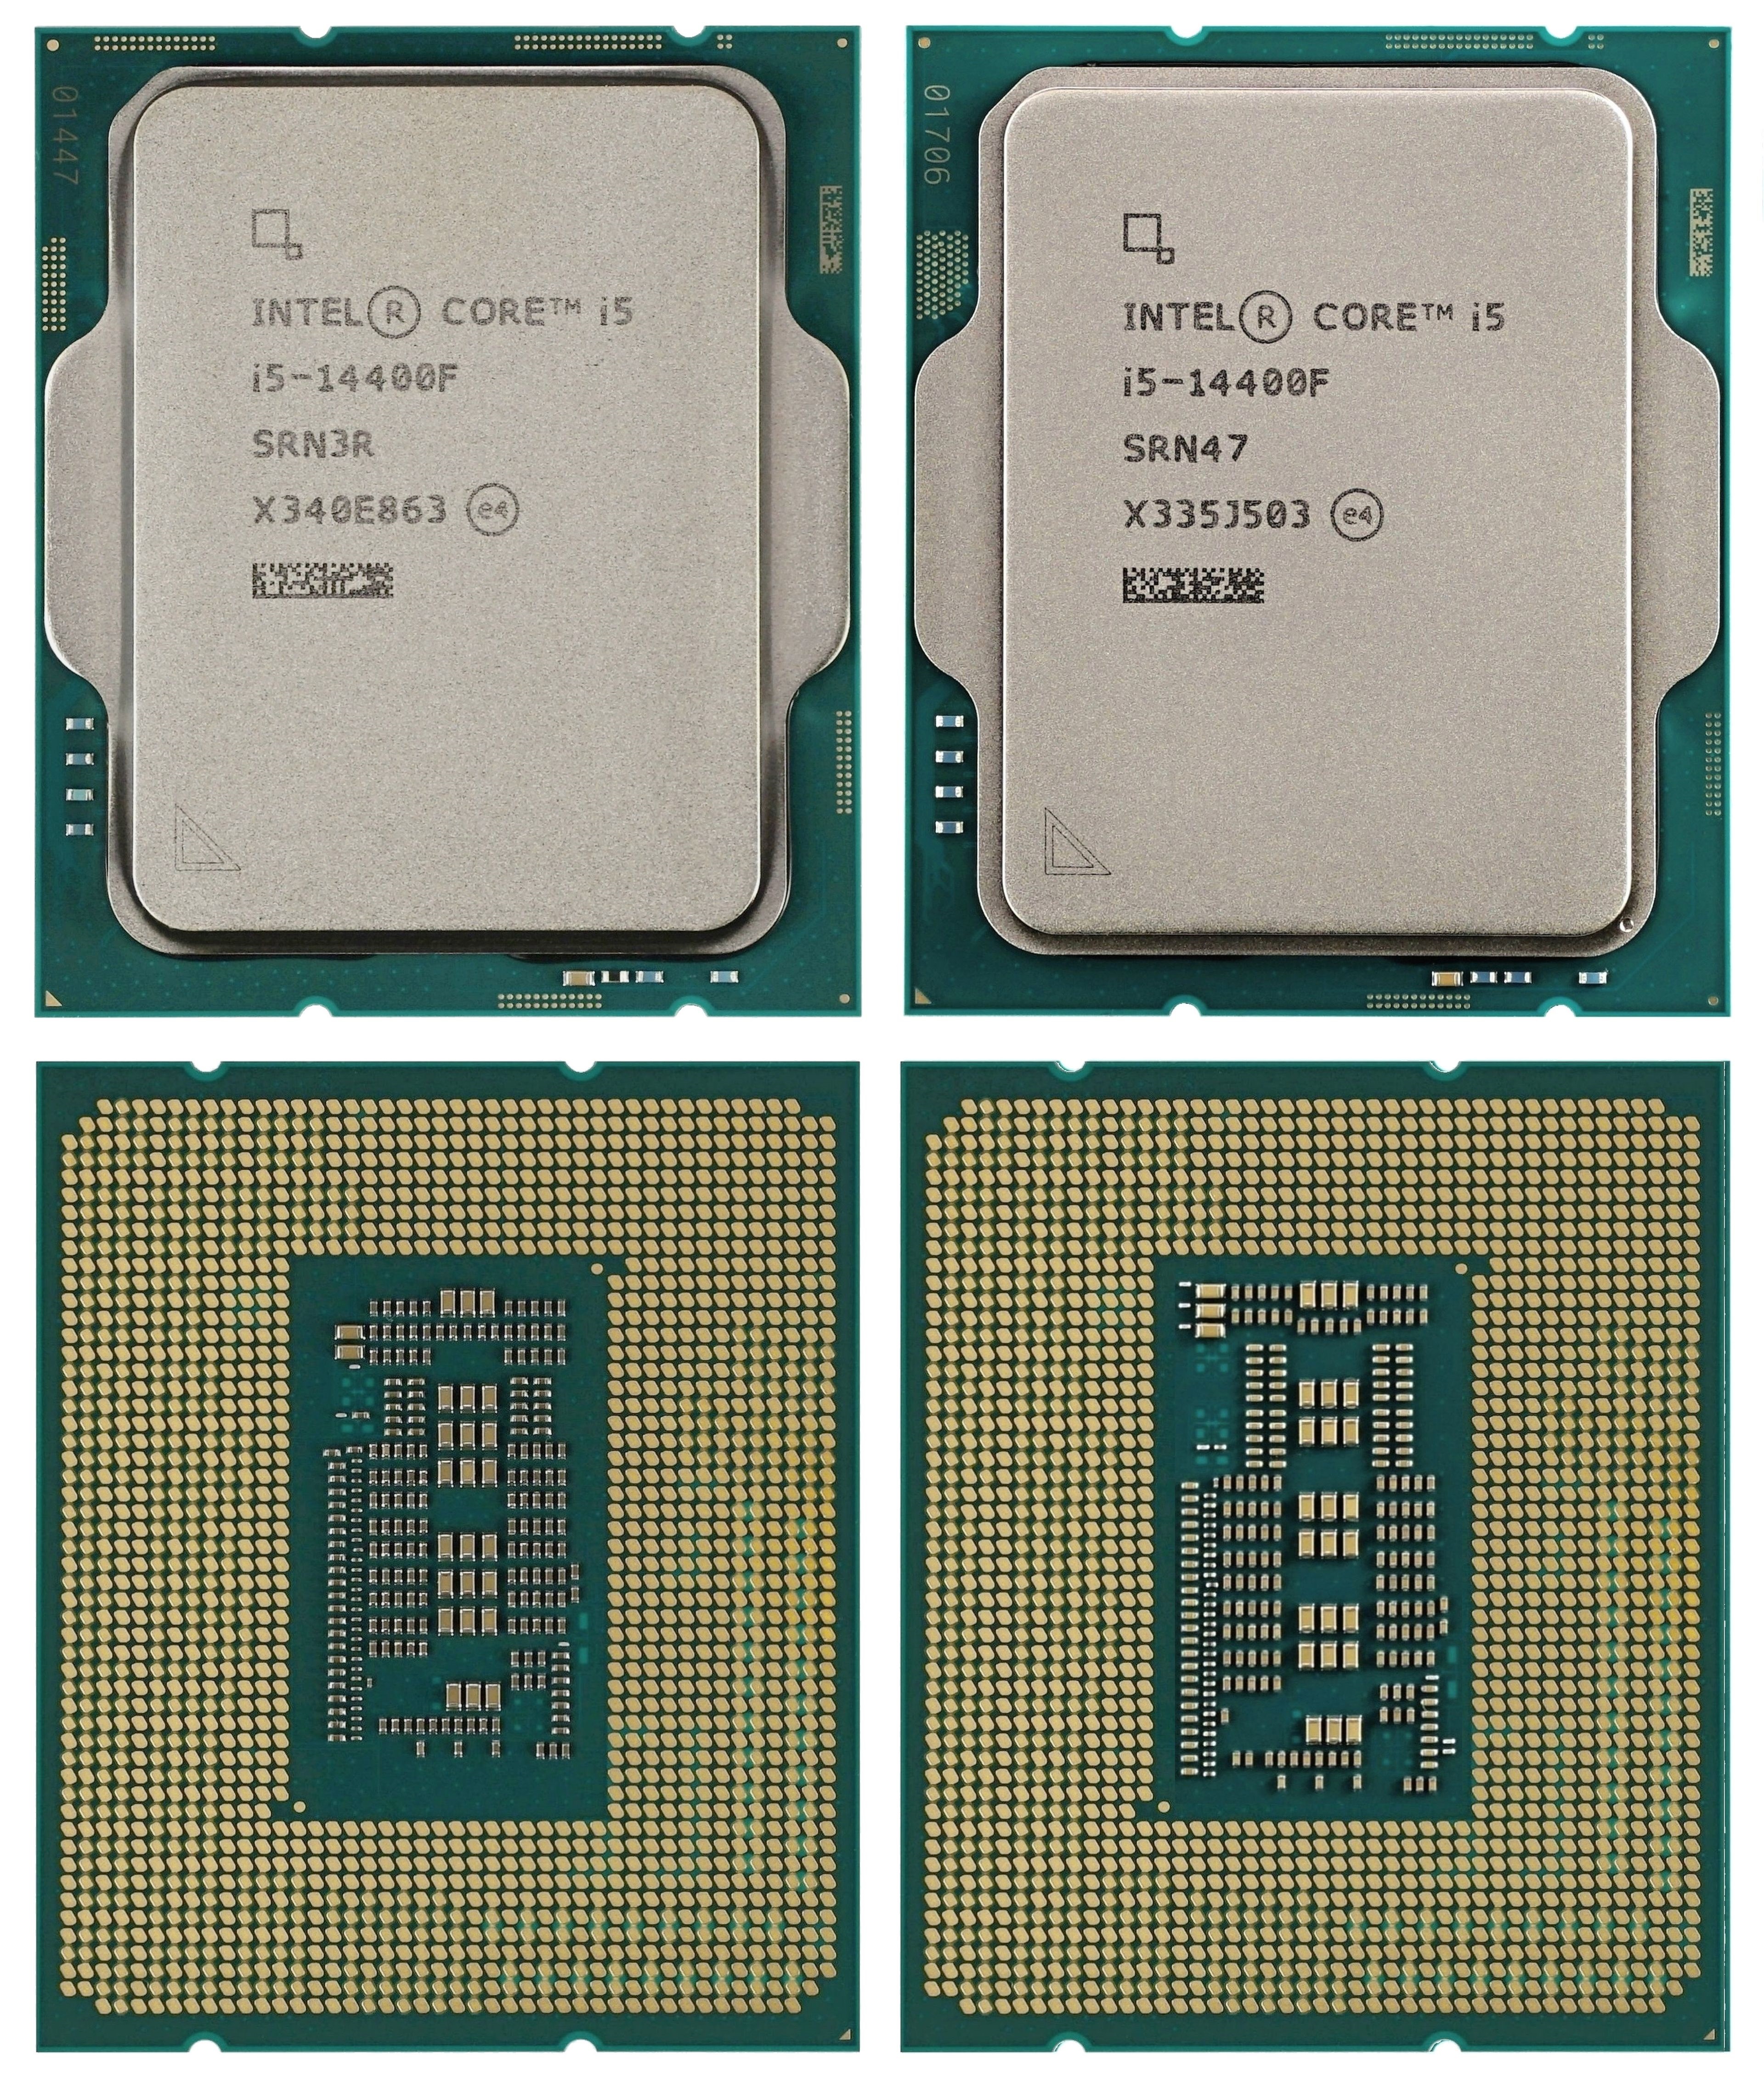
The parameters of both Core i5-14400/F processor steppings are almost identical, including the size of the L2 cache, which is natively larger (2 MB) in the full Core i5-14400/F version (stepping B0). For the Core i5-14400/F, it is always limited to 1.25 MB as per the stepping C0 maximum. From the Raptor Lake Refresh generation, the full 2 MB (L2 cache) is retained only for Core i5 models that have only one stepping – B0. These are, for example, the 14600, the 14600K, the 14600KF and the 14600T.
A single stepping, but in this case C0, is also present in all Core i5-14500 variants (the K, the KF, the T and also the model without a letter at the end of the designation). The combination (of B0 and C0) also occurs with the Core i5 “400” series. The model 14400T, as well as the 14490F, is always C0, but with the 14400 and the 14400F, you’ll run into both of them (steppings). Although it should be noted that in current practice you rarely do and mostly get to the B0 variant.
Actually, there is the opposite situation as there was with the Core i5-13400F, where there were significantly fewer B0 variants. This could theoretically indicate a larger capacity of C0 wafers, which are already running out. Also, it doesn’t have to be the case, and the significant B0 production is now present, in short, because of the large amount of “waste” from the more powerful models that is being used en masse on the Core i5-14400F. However, this state of affairs may not be permanent and later Intel may revert to older wafers (C0) for the Core i5-14400(F) as well, but who knows. This is just such an internal speculation of ours.
The reality of today (as of the end of February 2024) is that for the Core i5-14400F model tested, there is a disproportion of C0 variants (there are significantly fewer of them) to B0 variants (the vast majority of production). The new thing compared to the last generation (Core i5-13400F) is that both steppings are sold as a “box” (i.e. with a cooler, retail), the Core i5-13400F stepping B0 is sold only as a “tray”. The order number of the Core i5-14400F (box) in the rarer “C0” form (S-Spec code SRN3R) is BX8071514400F (or CM8071505093011, tray) and for the Core i5-14400F (box) “B0” it’s BX8071514400F (S-Spec code SRN47), for the package without a cooler (tray) primarily intended for OEM builds, it’s CM8071504821113.
| Manufacturer | Intel | Intel | |
| Line | Core i5 | Core i5 | |
| SKU | 14400F (C0) | 14400F (B0) | |
| Codename | Raptor Lake Refresh | Raptor Lake Refresh | |
| CPU microarchitecture | Golden Cove (P) + Gracemont (E) | Golden Cove (P) + Gracemont (E) | |
| Manufacturing node | 7 nm | 7 nm | |
| Socket | LGA 1700 | LGA 1700 | |
| Launch date | 01/08/2024 | 01/08/2024 | |
| Launch price | 196 USD | 196 USD | |
| Core count | 6+4 | 6+4 | |
| Thread count | 16 | 16 | |
| Base frequency | 2.5 GHz (P)/1.8 GHz (E) | 2.5 GHz (P)/1.8 GHz (E) | |
| Max. Boost (1 core) | 4.7 GHz (P)/3.5 GHz (E) | 4.7 GHz (P)/3.5 GHz (E) | |
| Max. boost (all-core) | 4.1 GHz | 4.1 GHz | |
| Typ boostu | TB 2.0 | TB 2.0 | |
| L1i cache | 32 kB/core (P)/64 kB/core (E) | 32 kB/core (P)/64 kB/core (E) | |
| L1d cache | 48 kB/core (P)/32 kB/core | 48 kB/core (P)/32 kB/core | |
| L2 cache | 1,25 MB/core (P)/ 2×2 MB/4 cores (E) | 1,25 MB/core (P)/ 2×2 MB/4 cores (E) | |
| L3 cache | 1× 20 MB | 1× 20 MB | |
| TDP | 65 W | 65 W | |
| Max. power draw during boost | 148 W (PL2) | 148 W (PL2) | |
| Overclocking support | No | No | |
| Memory (RAM) support | DDR5-4800/DDR4-3200 | DDR5-4800/DDR4-3200 | |
| Memory channel count | 2× 64 bit | 2× 64 bit | |
| RAM bandwidth | 76.8 GB/s/51,2 GB/s | 76.8 GB/s/51,2 GB/s | |
| ECC RAM support | No | No | |
| PCI Express support | 5.0/4.0 | 5.0/4.0 | |
| PCI Express lanes | ×16 (5.0) + ×4 (4.0) | ×16 (5.0) + ×4 (4.0) | |
| Chipset downlink | DMI 4.0 ×8 | DMI 4.0 ×8 | |
| Chipset downlink bandwidth | 16.0 GB/s duplex | 16.0 GB/s duplex | |
| BCLK | 100 MHz | 100 MHz | |
| Die size | ~209 mm² | ~257 mm² | |
| Transistor count | ? bn. | ? bn. | |
| TIM used under IHS | Solder | Solder | |
| Boxed cooler in package | Intel Laminar RM1 | Intel Laminar RM1 | |
| Instruction set extensions | SSE4.2, AVX2, FMA, SHA, VNNI (256-bit), GNA 3.0, VAES (256-bit), vPro | SSE4.2, AVX2, FMA, SHA, VNNI (256-bit), GNA 3.0, VAES (256-bit), vPro | |
| Virtualization | VT-x, VT-d, EPT | VT-x, VT-d, EPT | |
| Integrated GPU | N/A | N/A | |
| GPU architecture | – | – | |
| GPU: shader count | – | – | |
| GPU: TMU count | – | – | |
| GPU: ROP count | – | – | |
| GPU frequency | – | – | |
| Display outputs | – | – | |
| Max. resolution | – | – | |
| HW video encode | – | – | |
| HW video decode | – | – |
For completeness of Intel Core i5-14400F processor tests we add the results of its second stepping. We’ve already tested the B0 variant, now it’s time for the C0. Its availability in stores is, at least at the moment, considerably worse and the question arises whether it is worth it at all. Is there any point in aiming for stepping C0 or is B0 also “okay”? Or does it “not matter” (what you get in the shopping lottery)?
Gaming tests
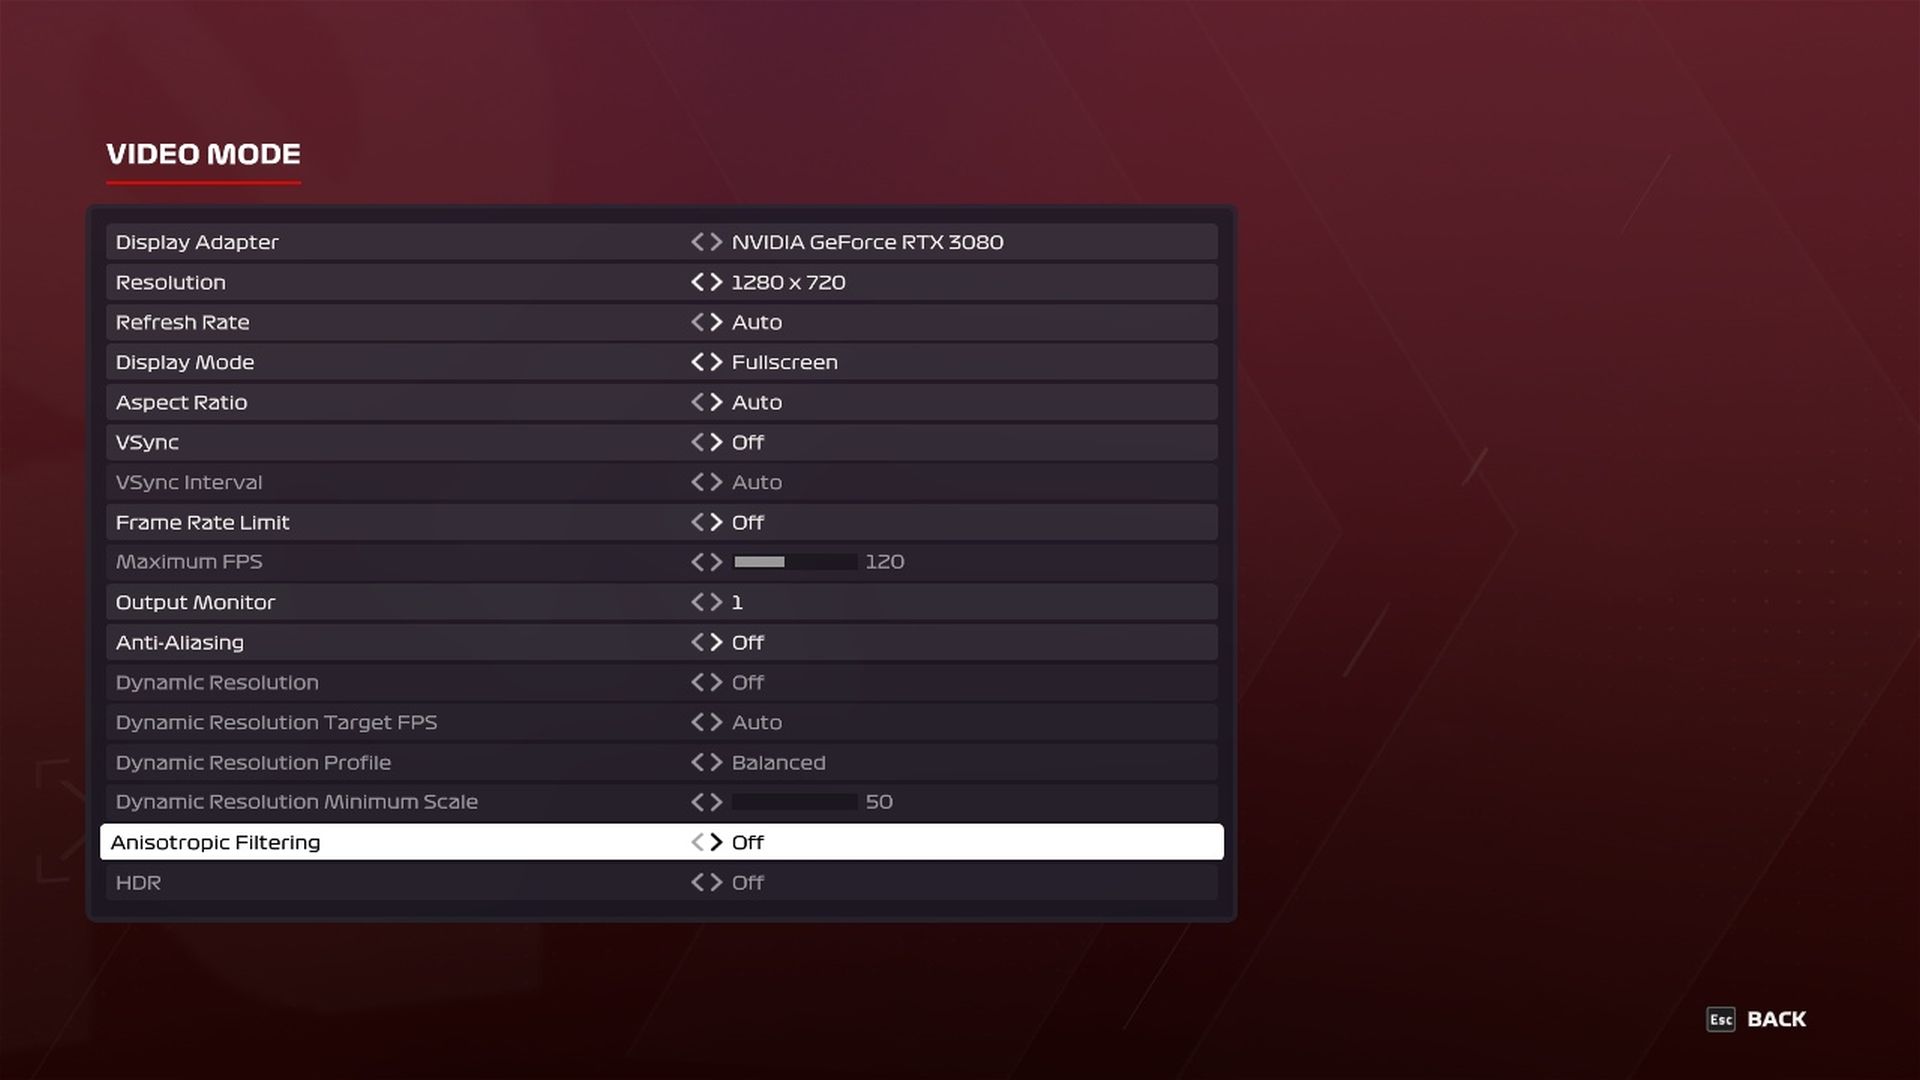
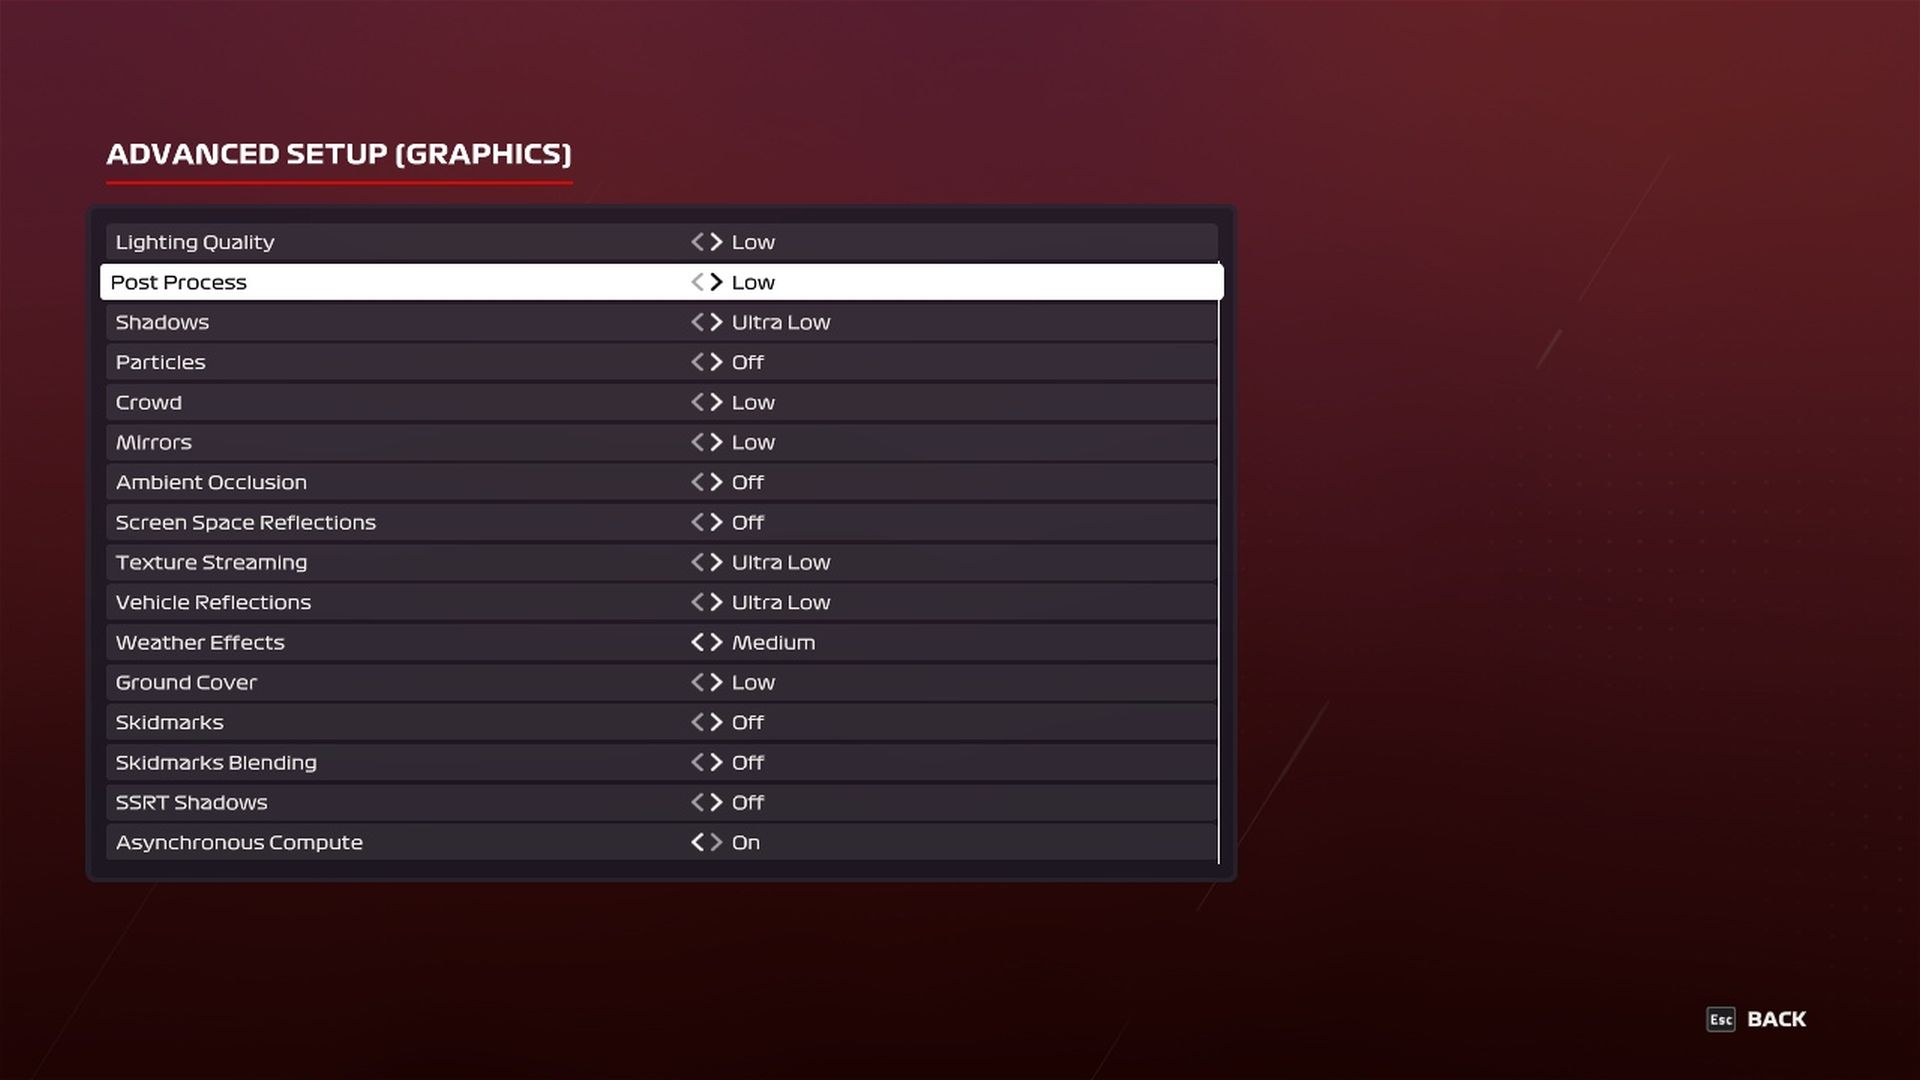
We test performance in games in four resolutions with different graphics settings. To warm up, there is more or less a theoretical resolution of 1280 × 720 px. We had been tweaking graphics settings for this resolution for a long time. We finally decided to go for the lowest possible (Low, Lowest, Ultra Low, …) settings that a game allows.
One could argue that a processor does not calculate how many objects are drawn in such settings (so-called draw calls). However, with high detail at this very low resolution, there was not much difference in performance compared to FHD (which we also test). On the contrary, the GPU load was clearly higher, and this impractical setting should demonstrate the performance of a processor with the lowest possible participation of a graphics card.
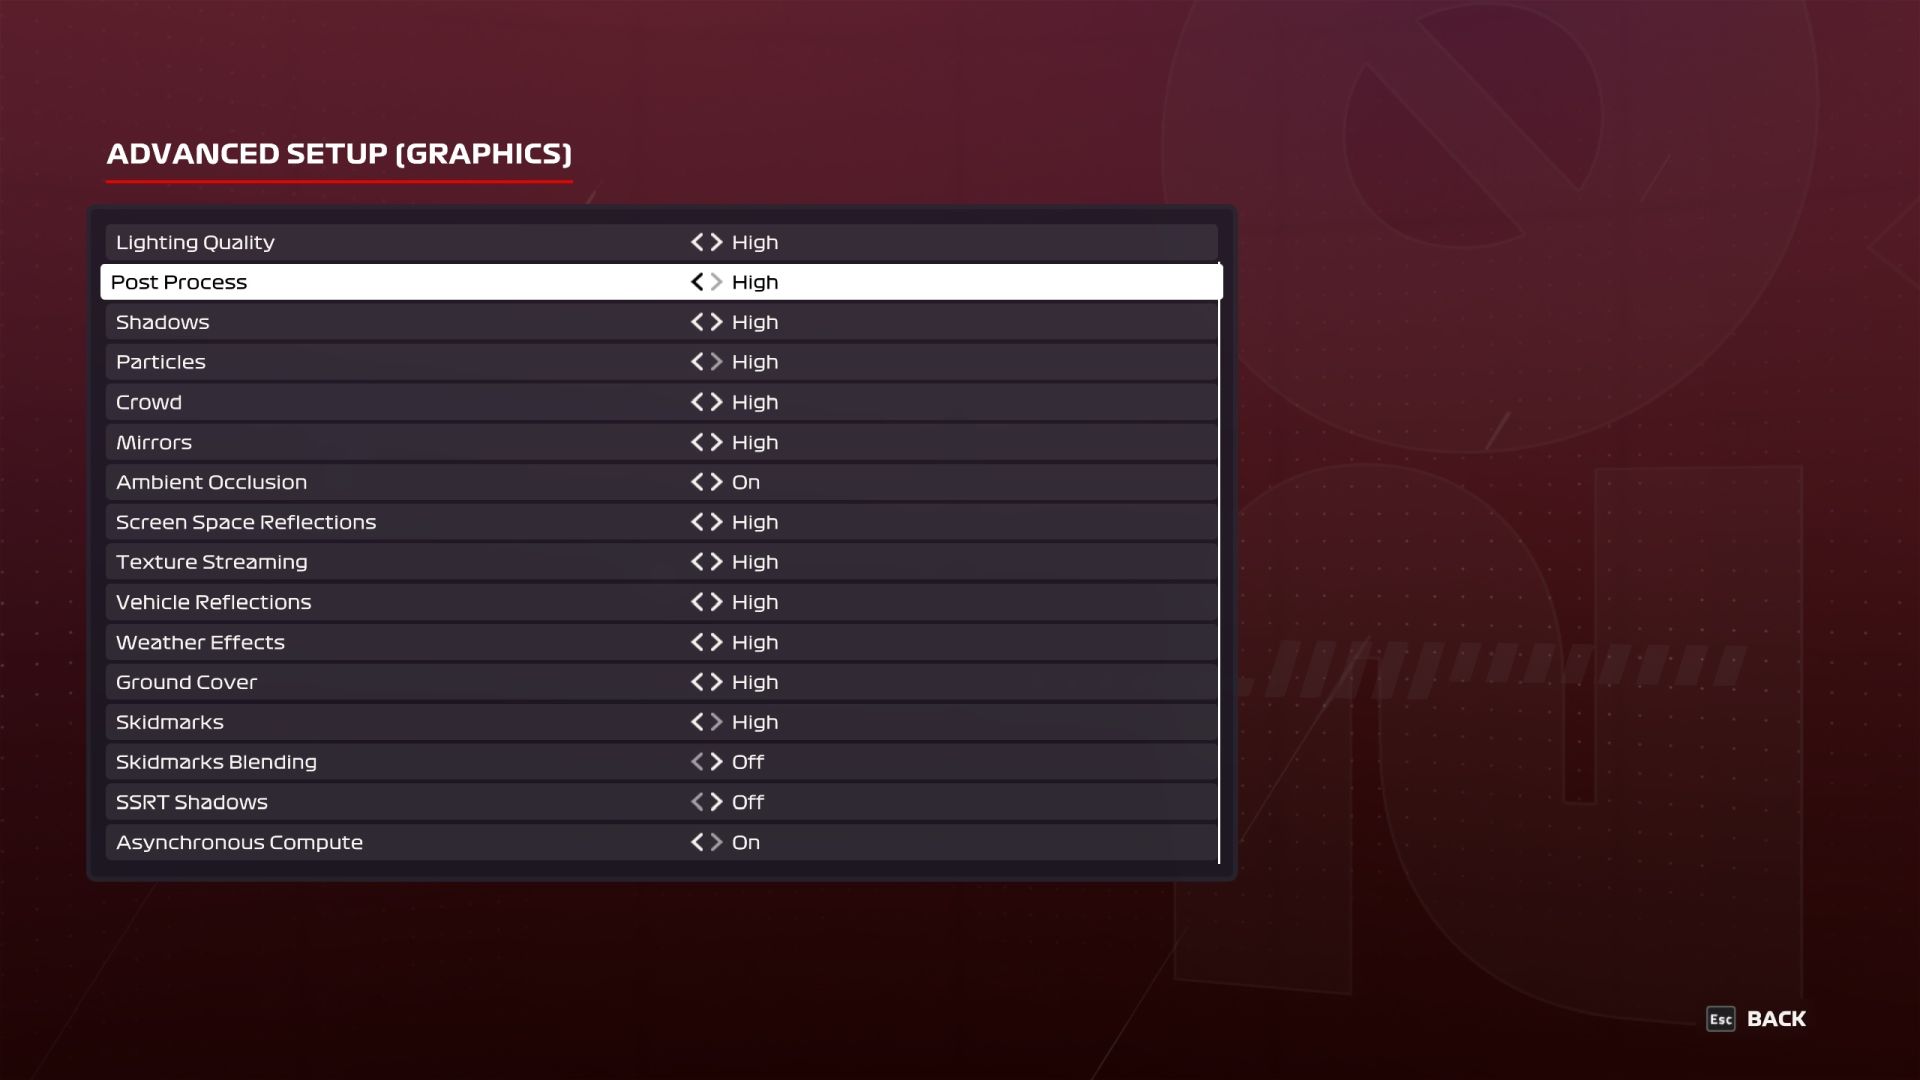
At higher resolutions, high settings (for FHD and QHD) and highest (for UHD) are used. In Full HD it’s usually with Anti-Aliasing turned off, but overall, these are relatively practical settings that are commonly used.

The selection of games was made considering the diversity of genres, player popularity and processor performance requirements. For a complete list, see Chapters 7–16. A built-in benchmark is used when a game has one, otherwise we have created our own scenes, which we always repeat with each processor in the same way. We use OCAT to record fps, or the times of individual frames, from which fps are then calculated, and FLAT to analyze CSV. Both were developed by the author of articles (and videos) from GPUreport.cz. For the highest possible accuracy, all runs are repeated three times and the average values of average and minimum fps are drawn in the graphs. These multiple repetitions also apply to non-gaming tests.
Computing tests
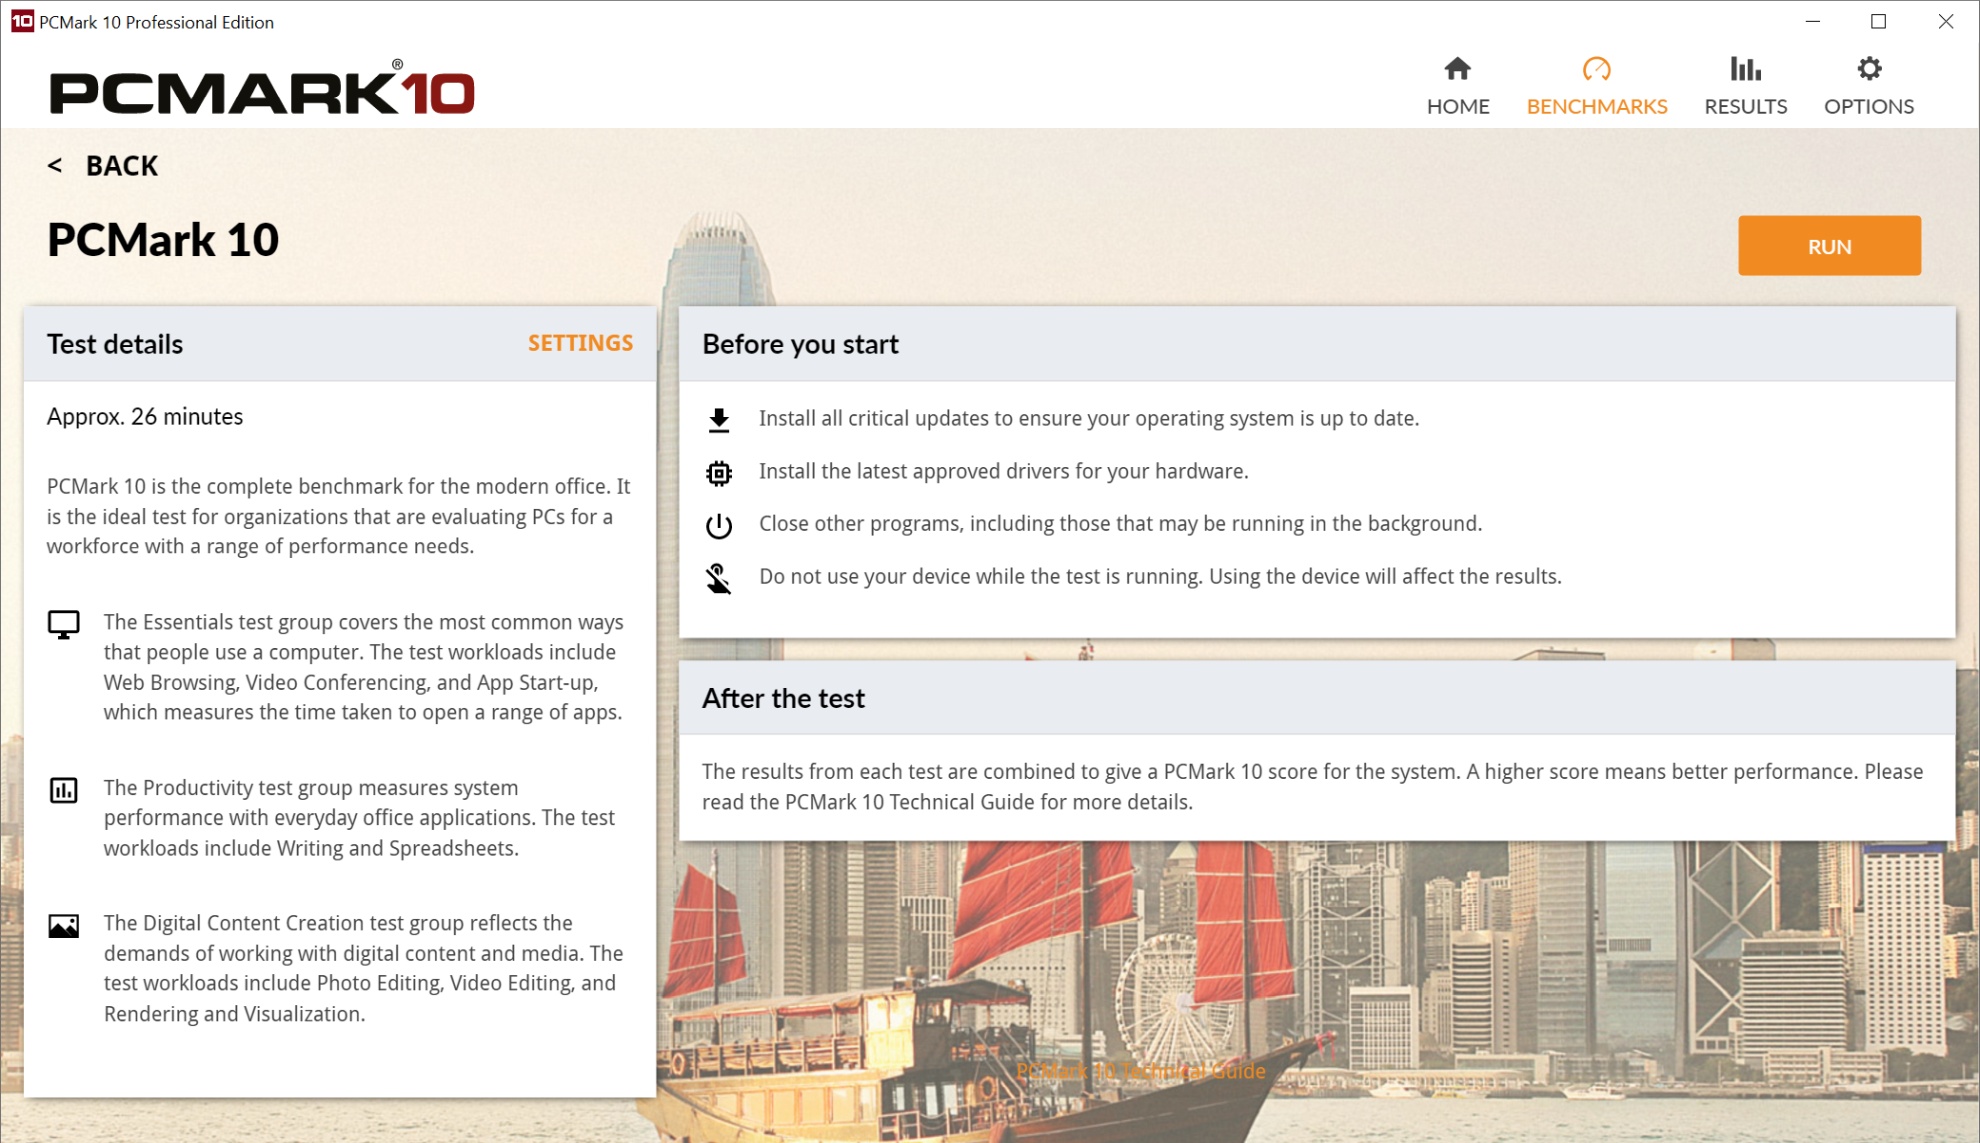
Let’s start lightly with PCMark 10, which tests more than sixty sub-tasks in various applications as part of a complete set of “benchmarks for a modern office”. It then sorts them into fewer thematic categories and for the best possible overview we include the gained points from them in the graphs. Lighter test tasks are also represented by tests in a web browser – Speedometer and Octane. Other tests usually represent higher load or are aimed at advanced users.
We test the 3D rendering performance in Cinebench. In R20, where the results are more widespread, but mainly in R23. Rendering in this version takes longer with each processor, cycles of at least ten minutes. We also test 3D rendering in Blender, with the Cycles render in the BMW and Classroom projects. You can also compare the latter with the test results of graphics cards (contains the same number of tiles).
We test how processors perform in video editing in Adobe Premiere Pro and DaVinci Resolve Studio 17. We use a PugetBench plugin, which deals with all the tasks you may encounter when editing videos. We also use PugetBench services in Adobe After Effects, where the performance of creating graphic effects is tested. Some subtasks use GPU acceleration, but we never turn it off, as no one will do it in practice. Some things don’t even work without GPU acceleration, but on the contrary, it’s interesting to see that the performance in the tasks accelerated by the graphics card also varies as some operations are still serviced by the CPU.

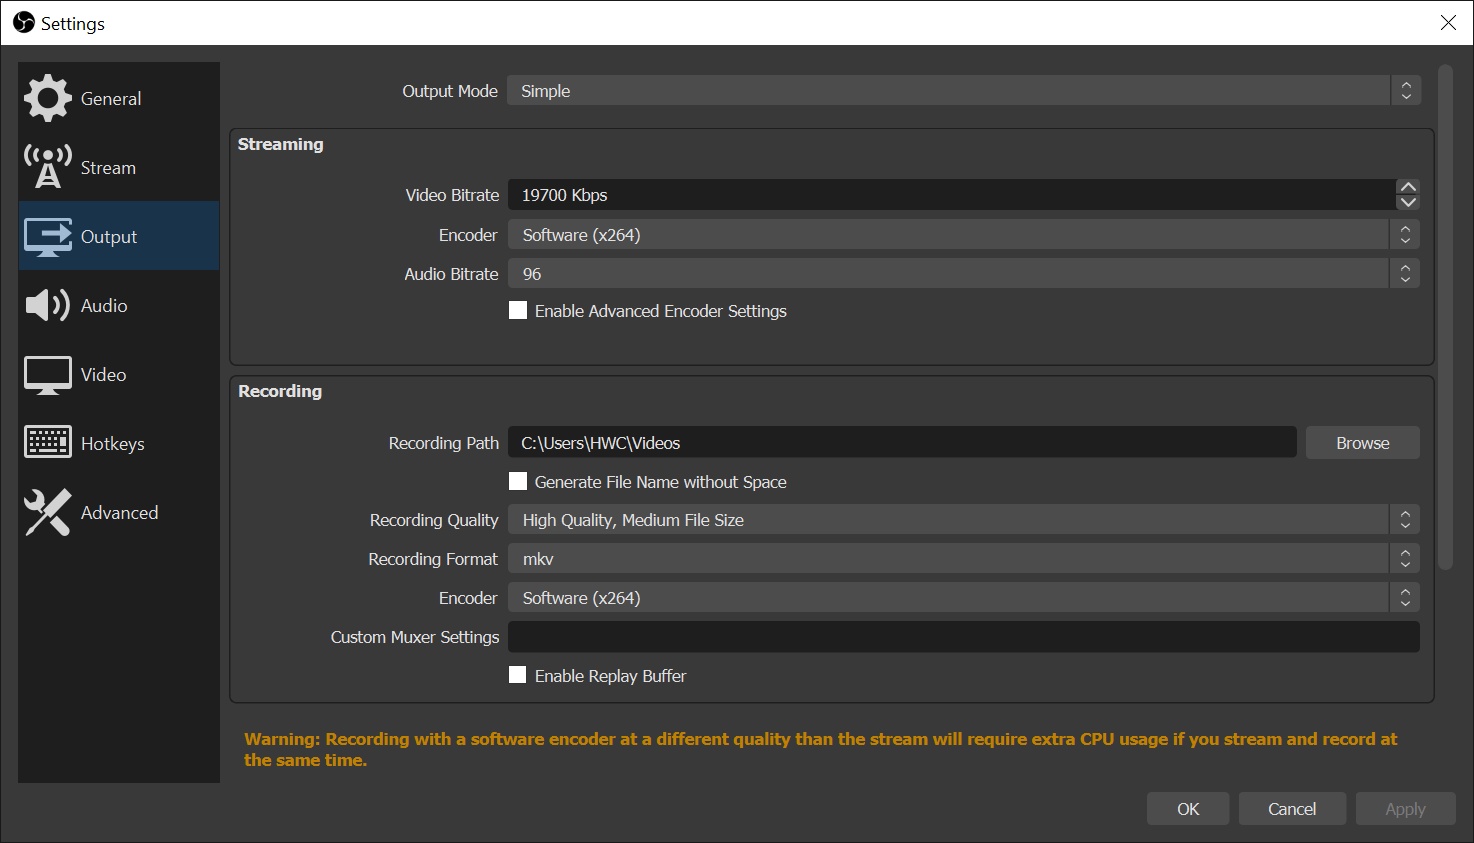
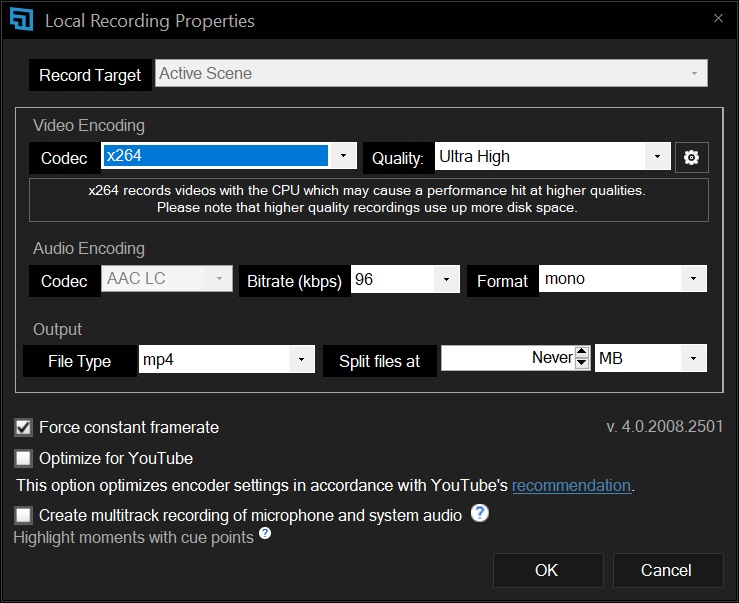
We test video encoding under SVT-AV1, in HandBrake and benchmarks (x264 HD and HWBot x265). x264 HD benchmark works in 32-bit mode (we did not manage to run 64-bit consistently on W10 and in general on newer OS’s it may be unstable and show errors in video). In HandBrake we use the x264 processor encoder for AVC and x265 for HEVC. Detailed settings of individual profiles can be found in the corresponding chapter 25. In addition to video, we also encode audio, where all the details are also stated in the chapter of these tests. Gamers who record their gameplay on video can also have to do with the performance of processor encoders. Therefore, we also test the performance of “processor broadcasting” in two popular applications OBS Studio and Xsplit.
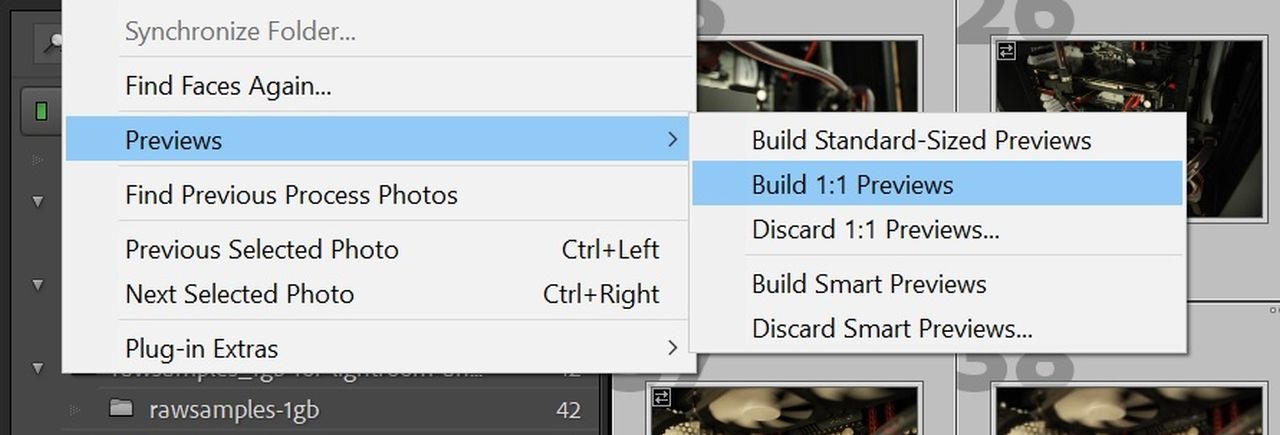
We also have two chapters dedicated to photo editing performance. Adobe has a separate one, where we test Photoshop via PugetBench. However, we do not use PugetBench in Lightroom, because it requires various OS modifications for stable operation, and overall we rather avoided it (due to the higher risk of complications) and create our own test scenes. Both are CPU intensive, whether it’s exporting RAW files to 16-bit TIFF with ProPhotoRGB color space or generating 1:1 thumbnails of 42 lossless CR2 photos.
However, we also have several alternative photo editing applications in which we test CPU performance. These include Affinity Photo, in which we use a built-in benchmark, or XnViewMP for batch photo editing or ZPS X. Of the truly modern ones, there are three Topaz Labz applications that use AI algorithms. DeNoise AI, Gigapixel AI and Sharpen AI. Topaz Labs often and happily compares its results with Adobe applications (Photoshop and Lightroom) and boasts of better results. So we’ll see, maybe we’ll get into it from the image point of view sometime. In processor tests, however, we are primarily focused on performance.

We test compression and decompression performance in WinRAR, 7-Zip and Aida64 (Zlib) benchmarks, decryption in TrueCrypt and Aida64, where in addition to AES there are also SHA3 tests. In Aida64, we also test FPU in the chapter of mathematical calculations. From this category you may also be interested in the results of Stockfish 13 and the number of chess combinations achieved per unit time. We perform many tests that can be included in the category of mathematics in SPECworkstation 3.1. It is a set of professional applications extending to various simulations, such as LAMMPS or NAMD, which are molecular simulators. A detailed description of the tests from SPECworkstation 3.1 can be found at spec.org. We do not test 7-zip, Blender and HandBrake from the list for redundancy, because we test performance in them separately in applications. A detailed listing of SPECWS results usually represents times or fps, but we graph “SPEC ratio”, which represents gained points—higher means better.
Processor settings…
We test processors in the default settings, without active PBO2 (AMD) or ABT (Intel) technologies, but naturally with active XMP 2.0.
… and app updates
The tests should also take into account that, over time, individual updates may affect performance comparisons. Some applications are used in portable versions, which are not updated or can be kept on a stable version, but this is not the case for some others. Typically, games update over time. On the other hand, even intentional obsolescence (and testing something out of date that already behaves differently) would not be entirely the way to go.
In short, just take into account that the accuracy of the results you are comparing decreases a bit over time. To make this analysis easier for you, we indicate when each processor was tested. You can find this in the dialog box, where there is information about the test date of each processor. This dialog box appears in interactive graphs, just hover the mouse cursor over any bar.
For completeness of Intel Core i5-14400F processor tests we add the results of its second stepping. We’ve already tested the B0 variant, now it’s time for the C0. Its availability in stores is, at least at the moment, considerably worse and the question arises whether it is worth it at all. Is there any point in aiming for stepping C0 or is B0 also “okay”? Or does it “not matter” (what you get in the shopping lottery)?
Methodology: how we measure power draw
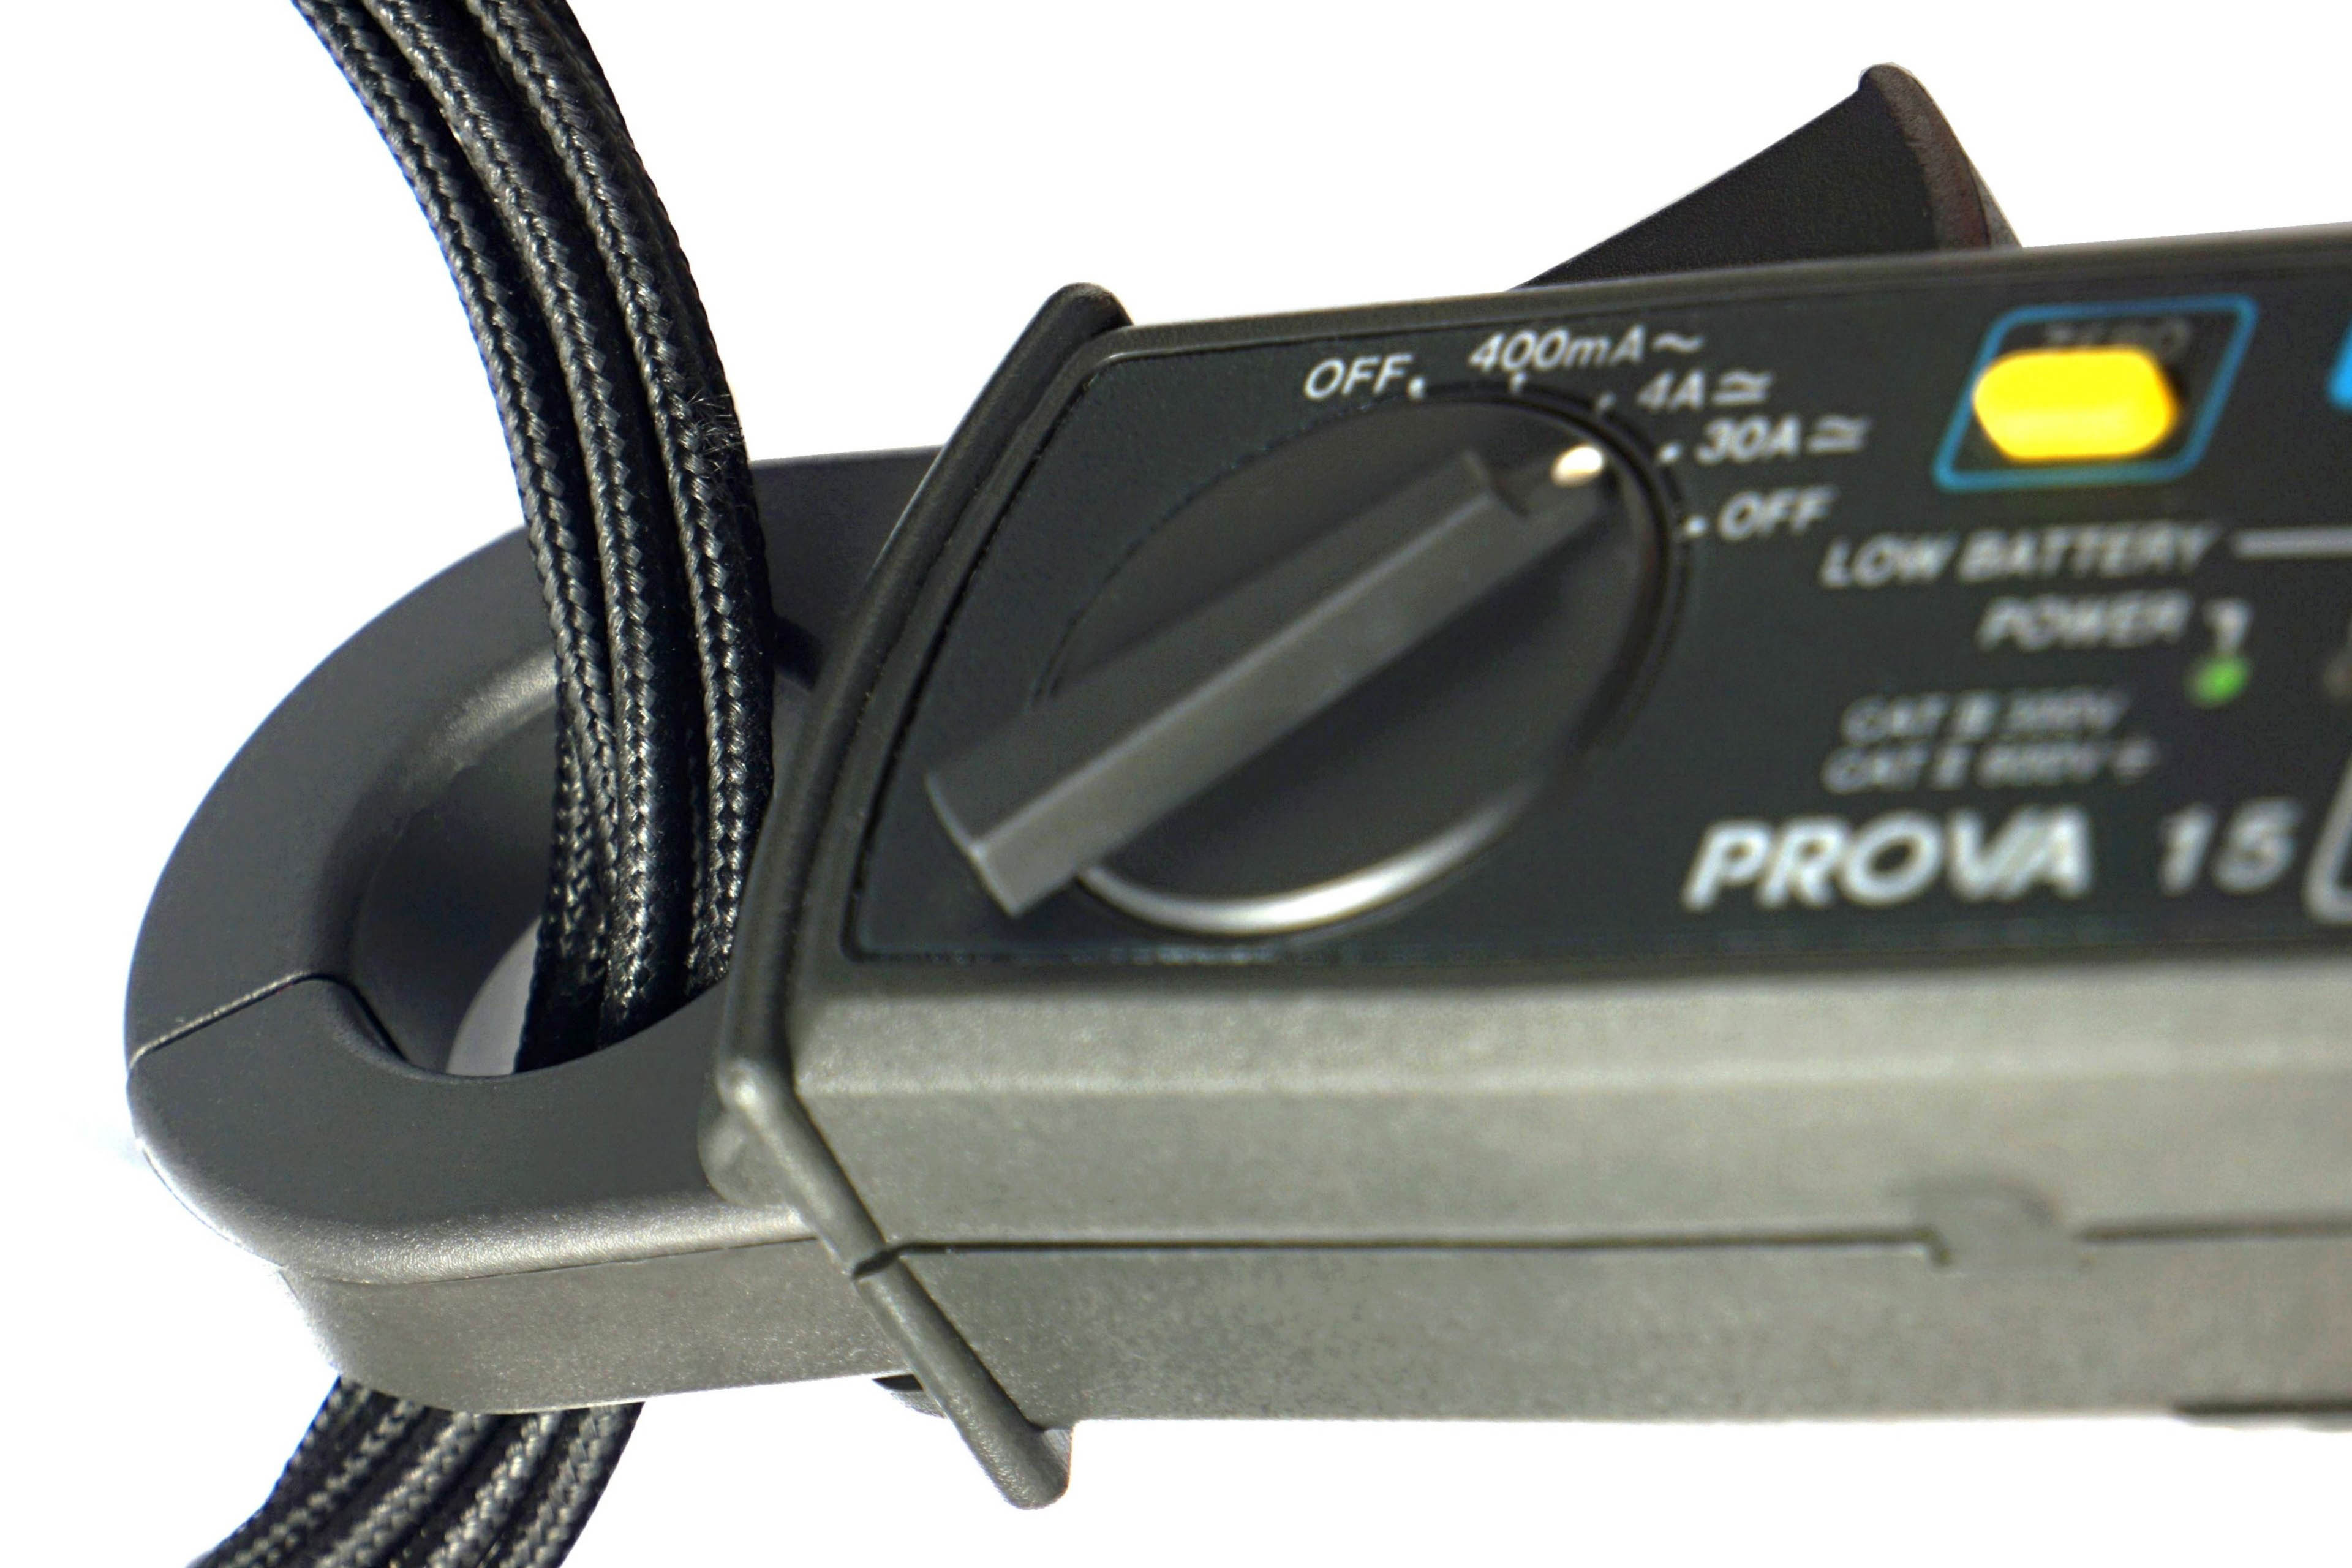
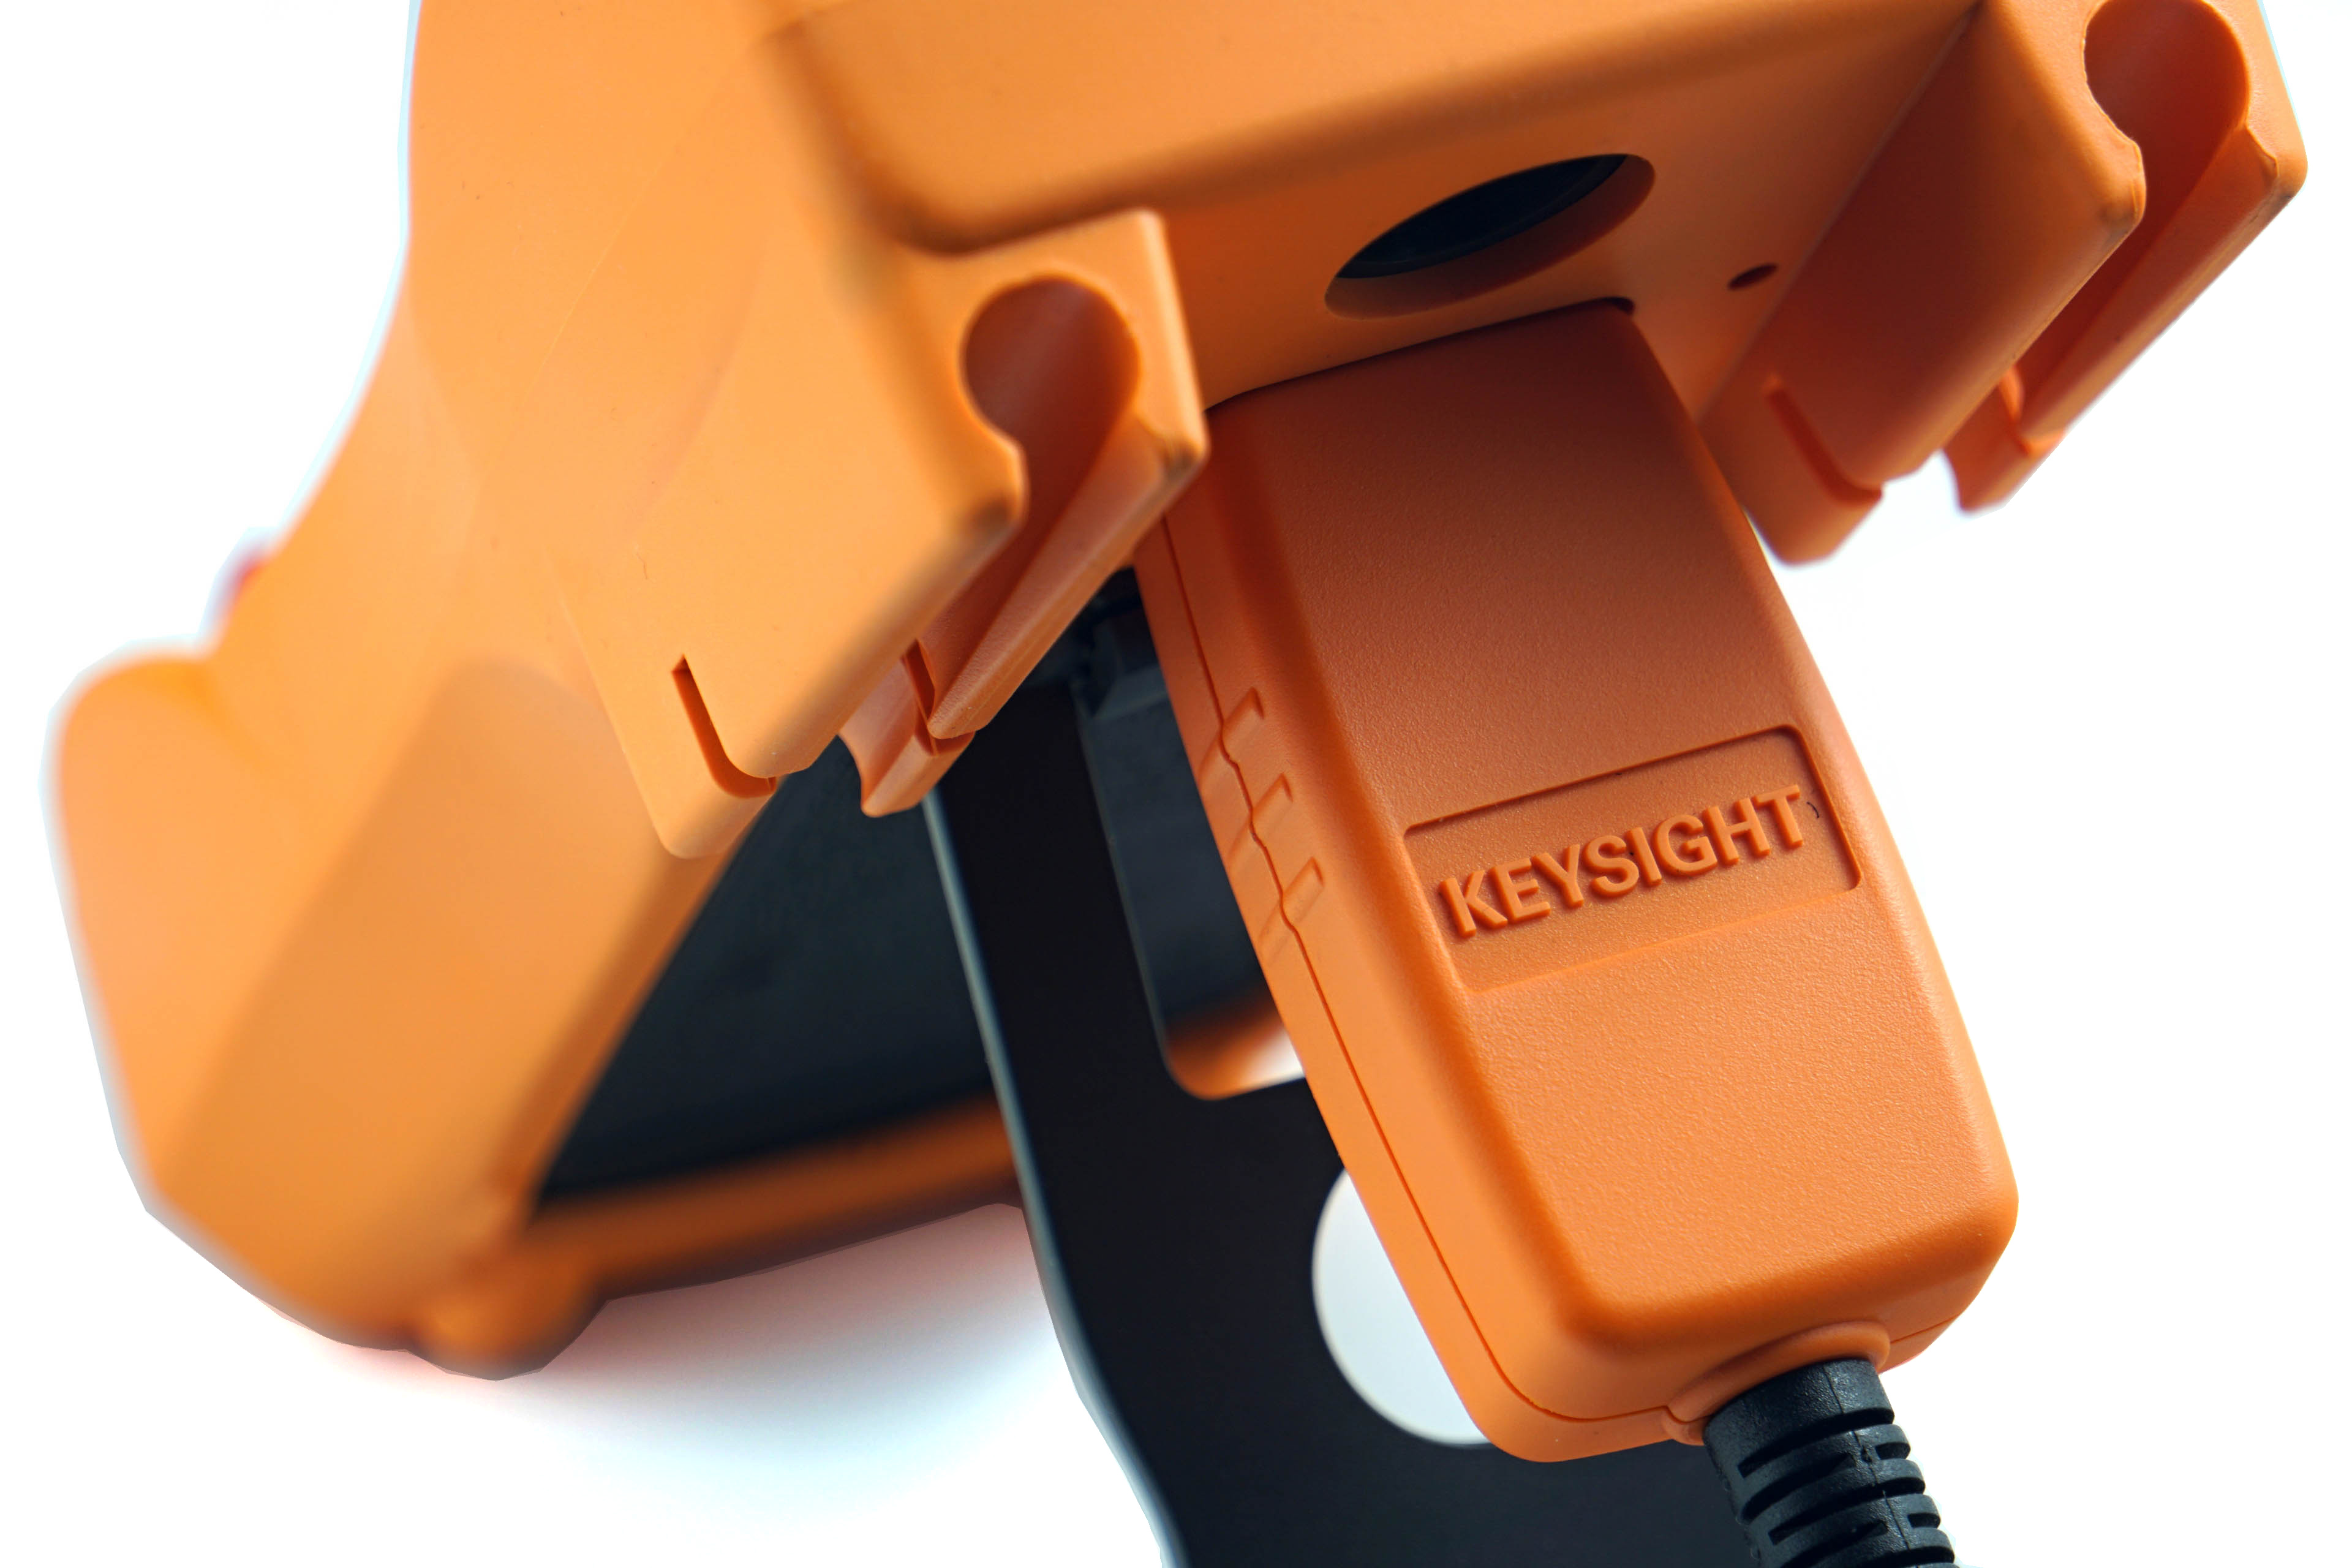
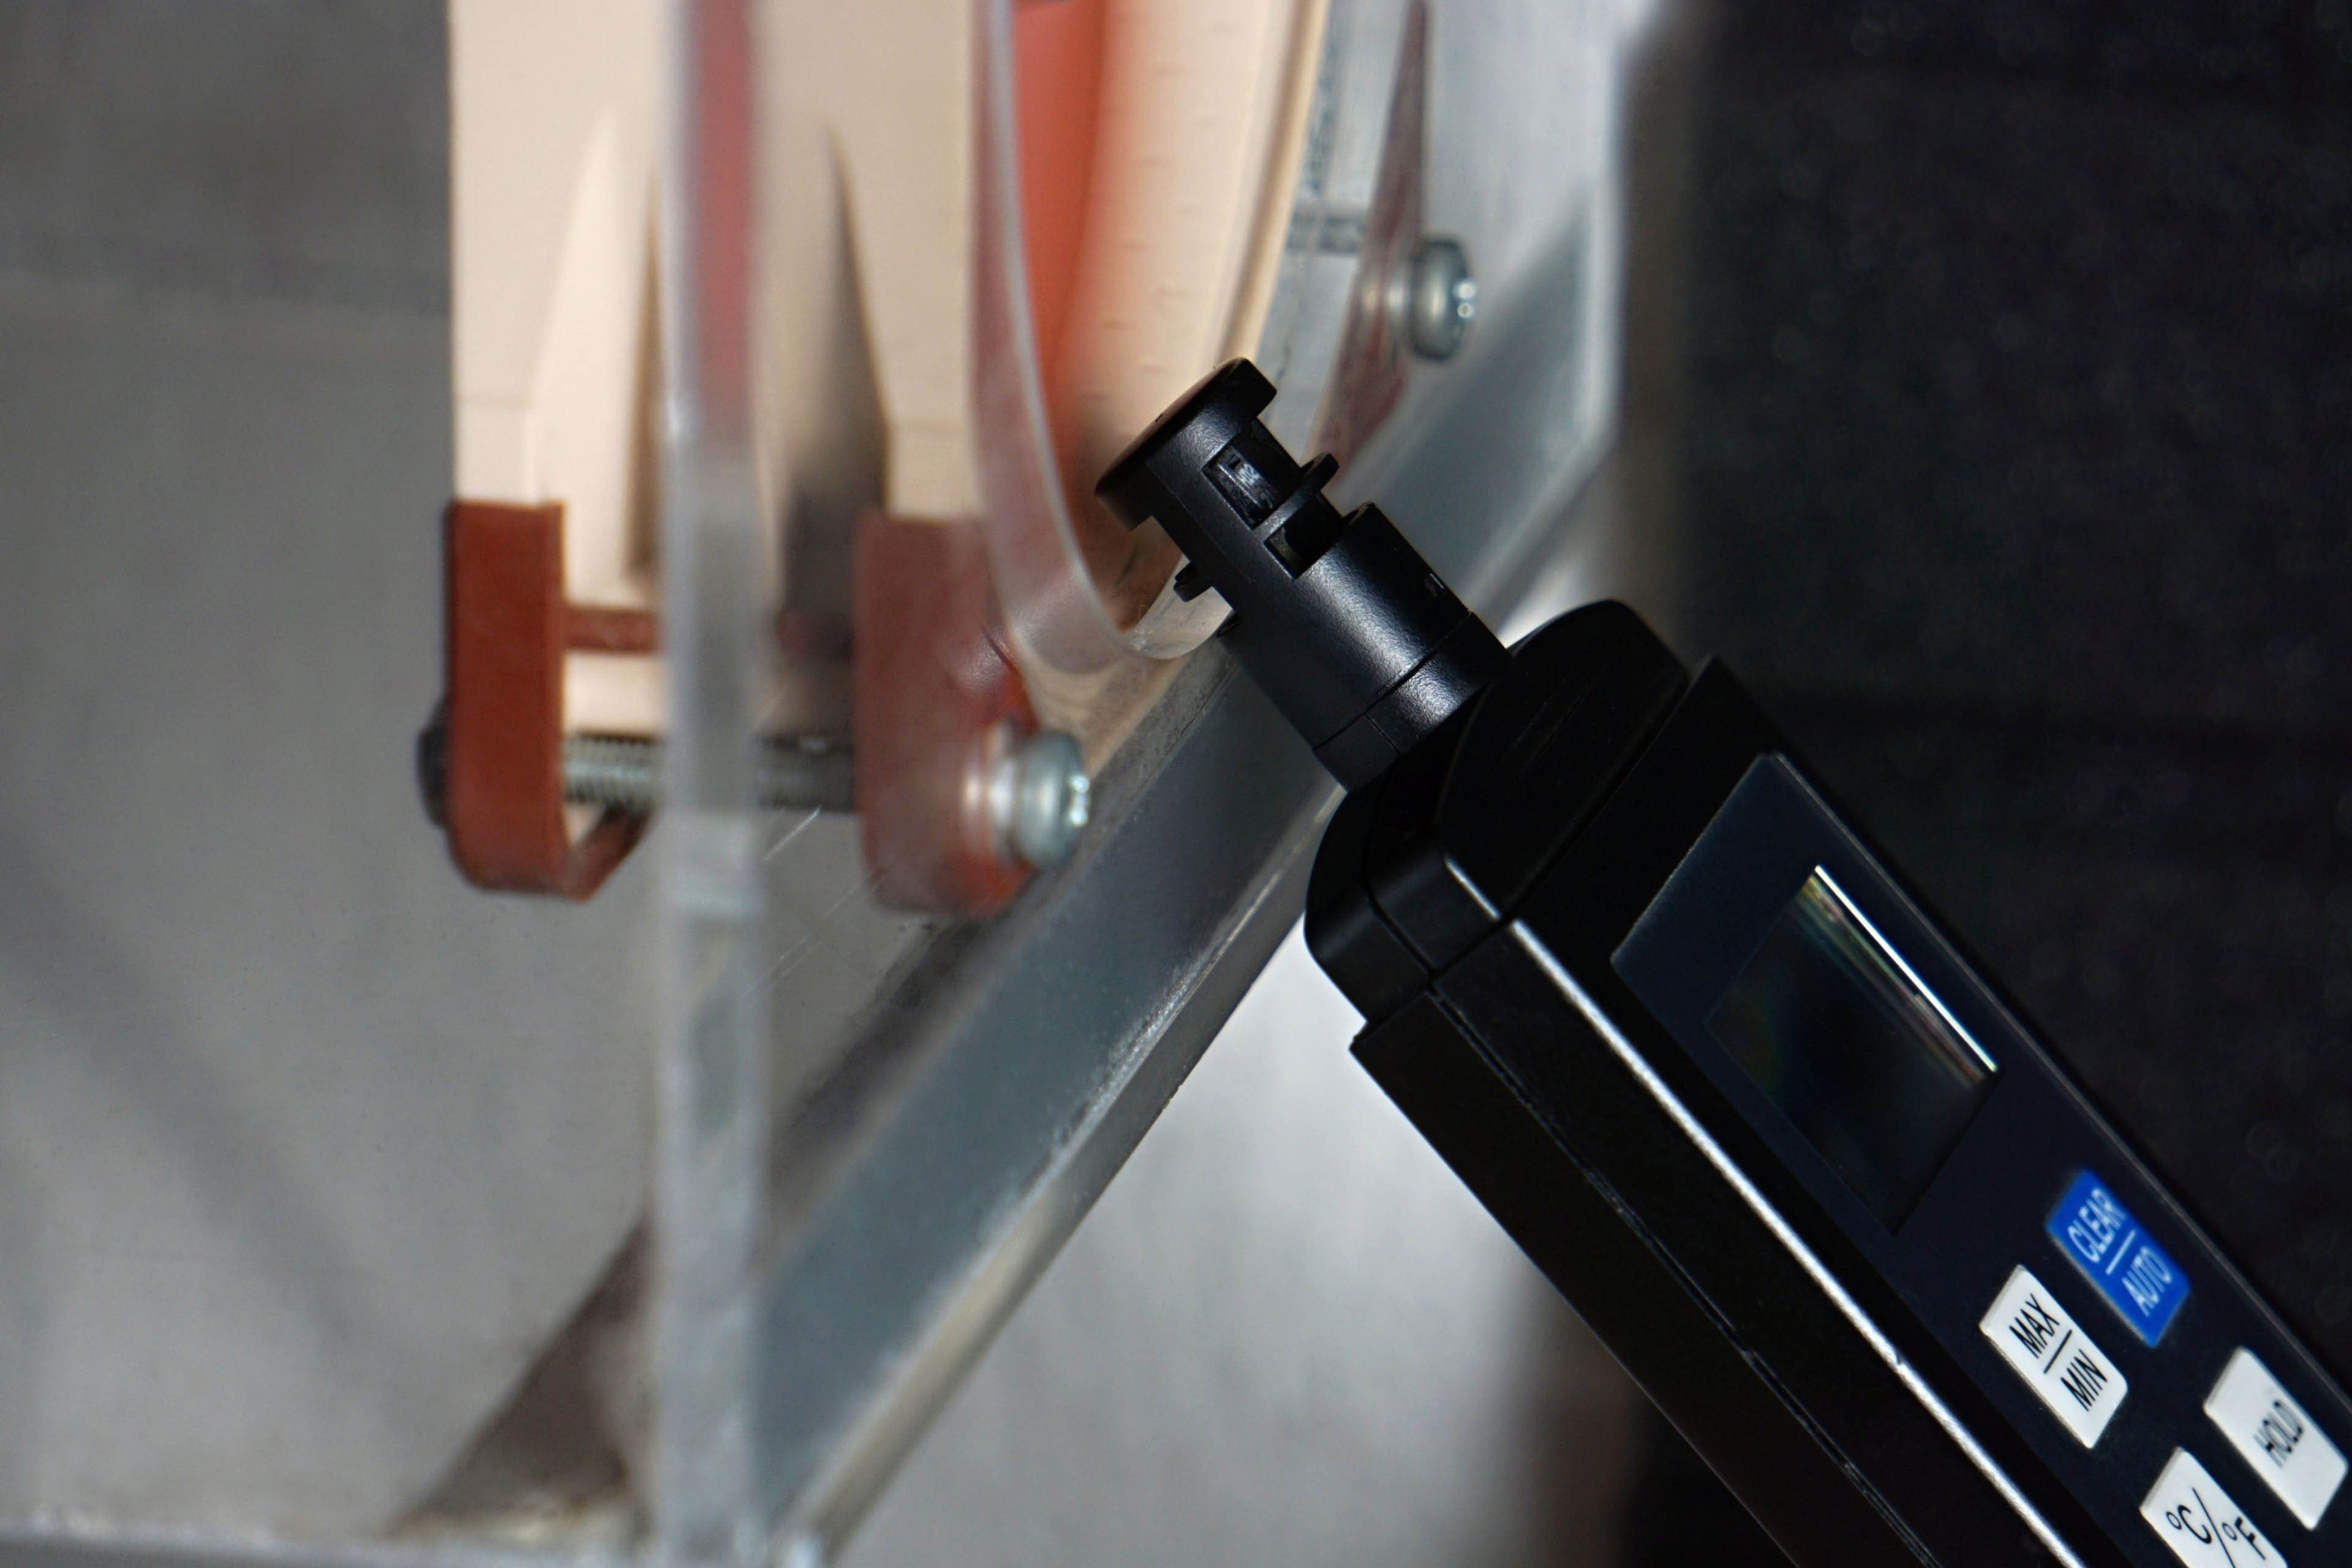
Measuring CPU power consumption is relatively simple, much easier than with graphics cards. All power goes through one or two EPS cables. We also use two to increase the cross-section, which is suitable for high performance AMD processors up to sTR(X)4 or for Intel HEDT, and in fact almost for mainstream processors as well. We have Prova 15 current probes to measure current directly on the wires. This is a much more accurate and reliable way of measuring than relying on internal sensors.
The only limitation of our current probes may be when testing the most powerful processors. These already exceed the maximum range of 30 A, at which high accuracy is guaranteed. For most processors, the range is optimal (even for measuring a lower load, when the probes can be switched to a lower and more accurate range of 4 A), but we will test models with power consumption over 360 W on our own device, a prototype of which we have already built. Its measuring range will no longer be limiting, but for the time being we will be using the Prova probes in the near future.
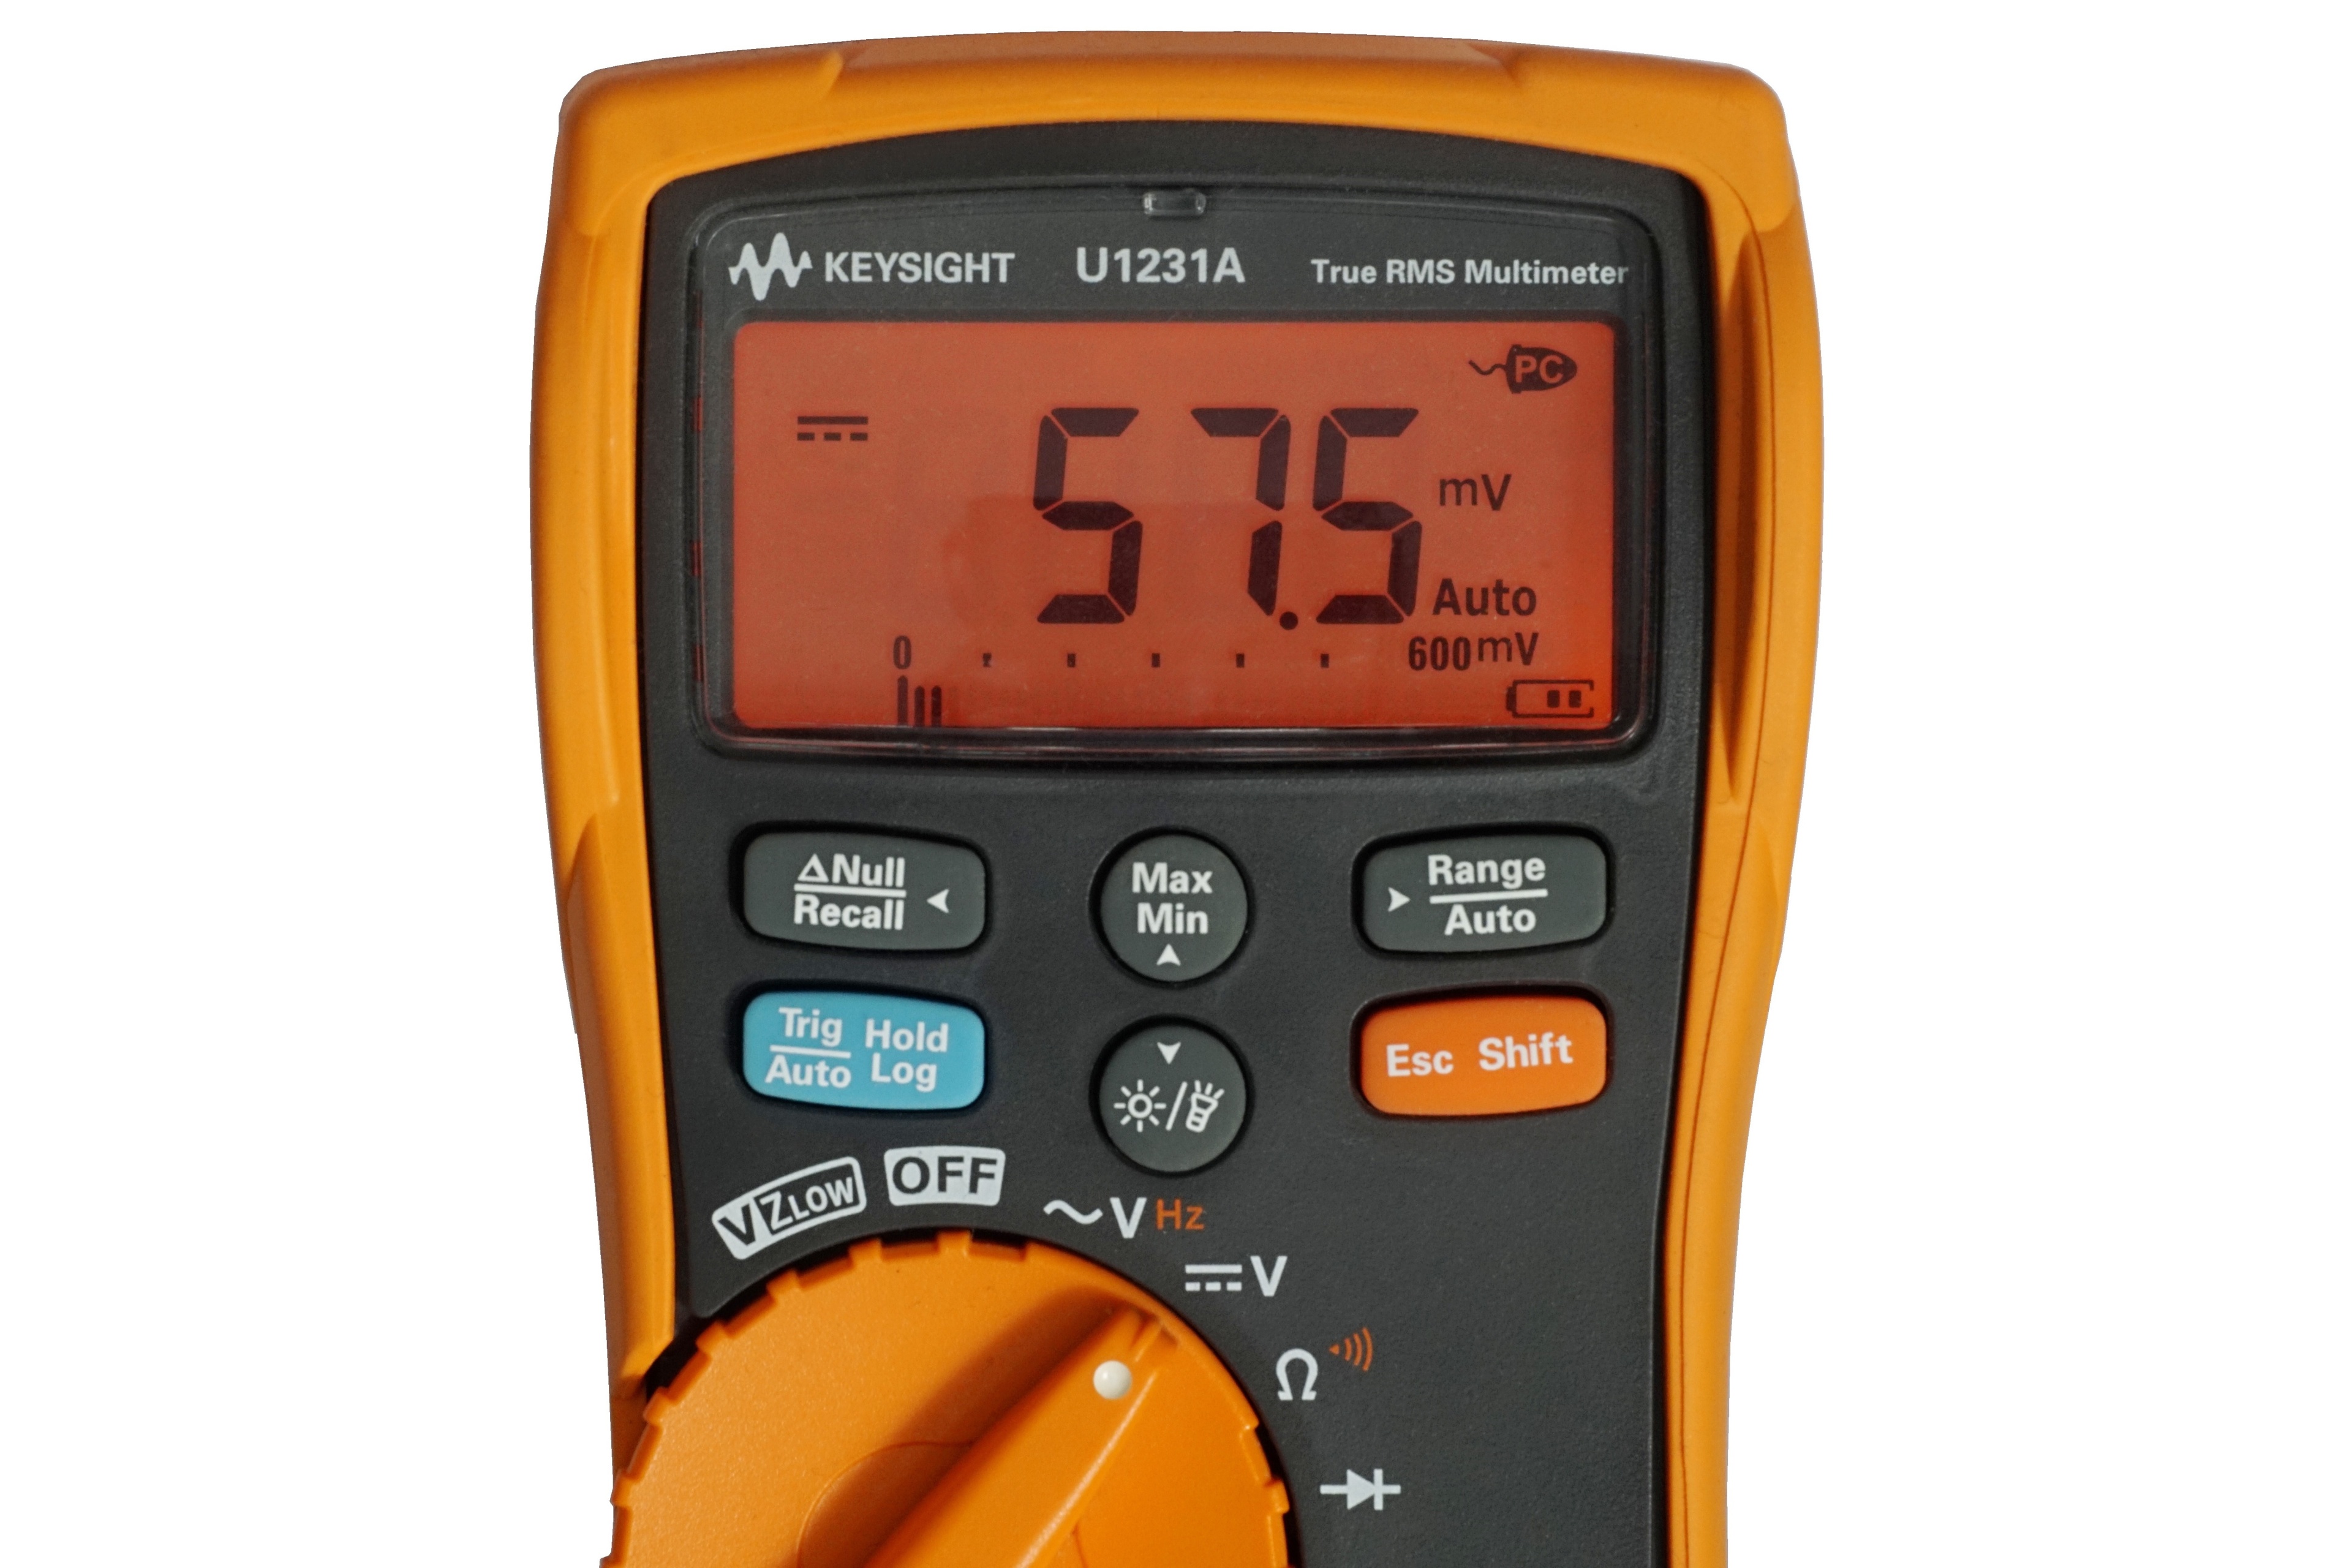
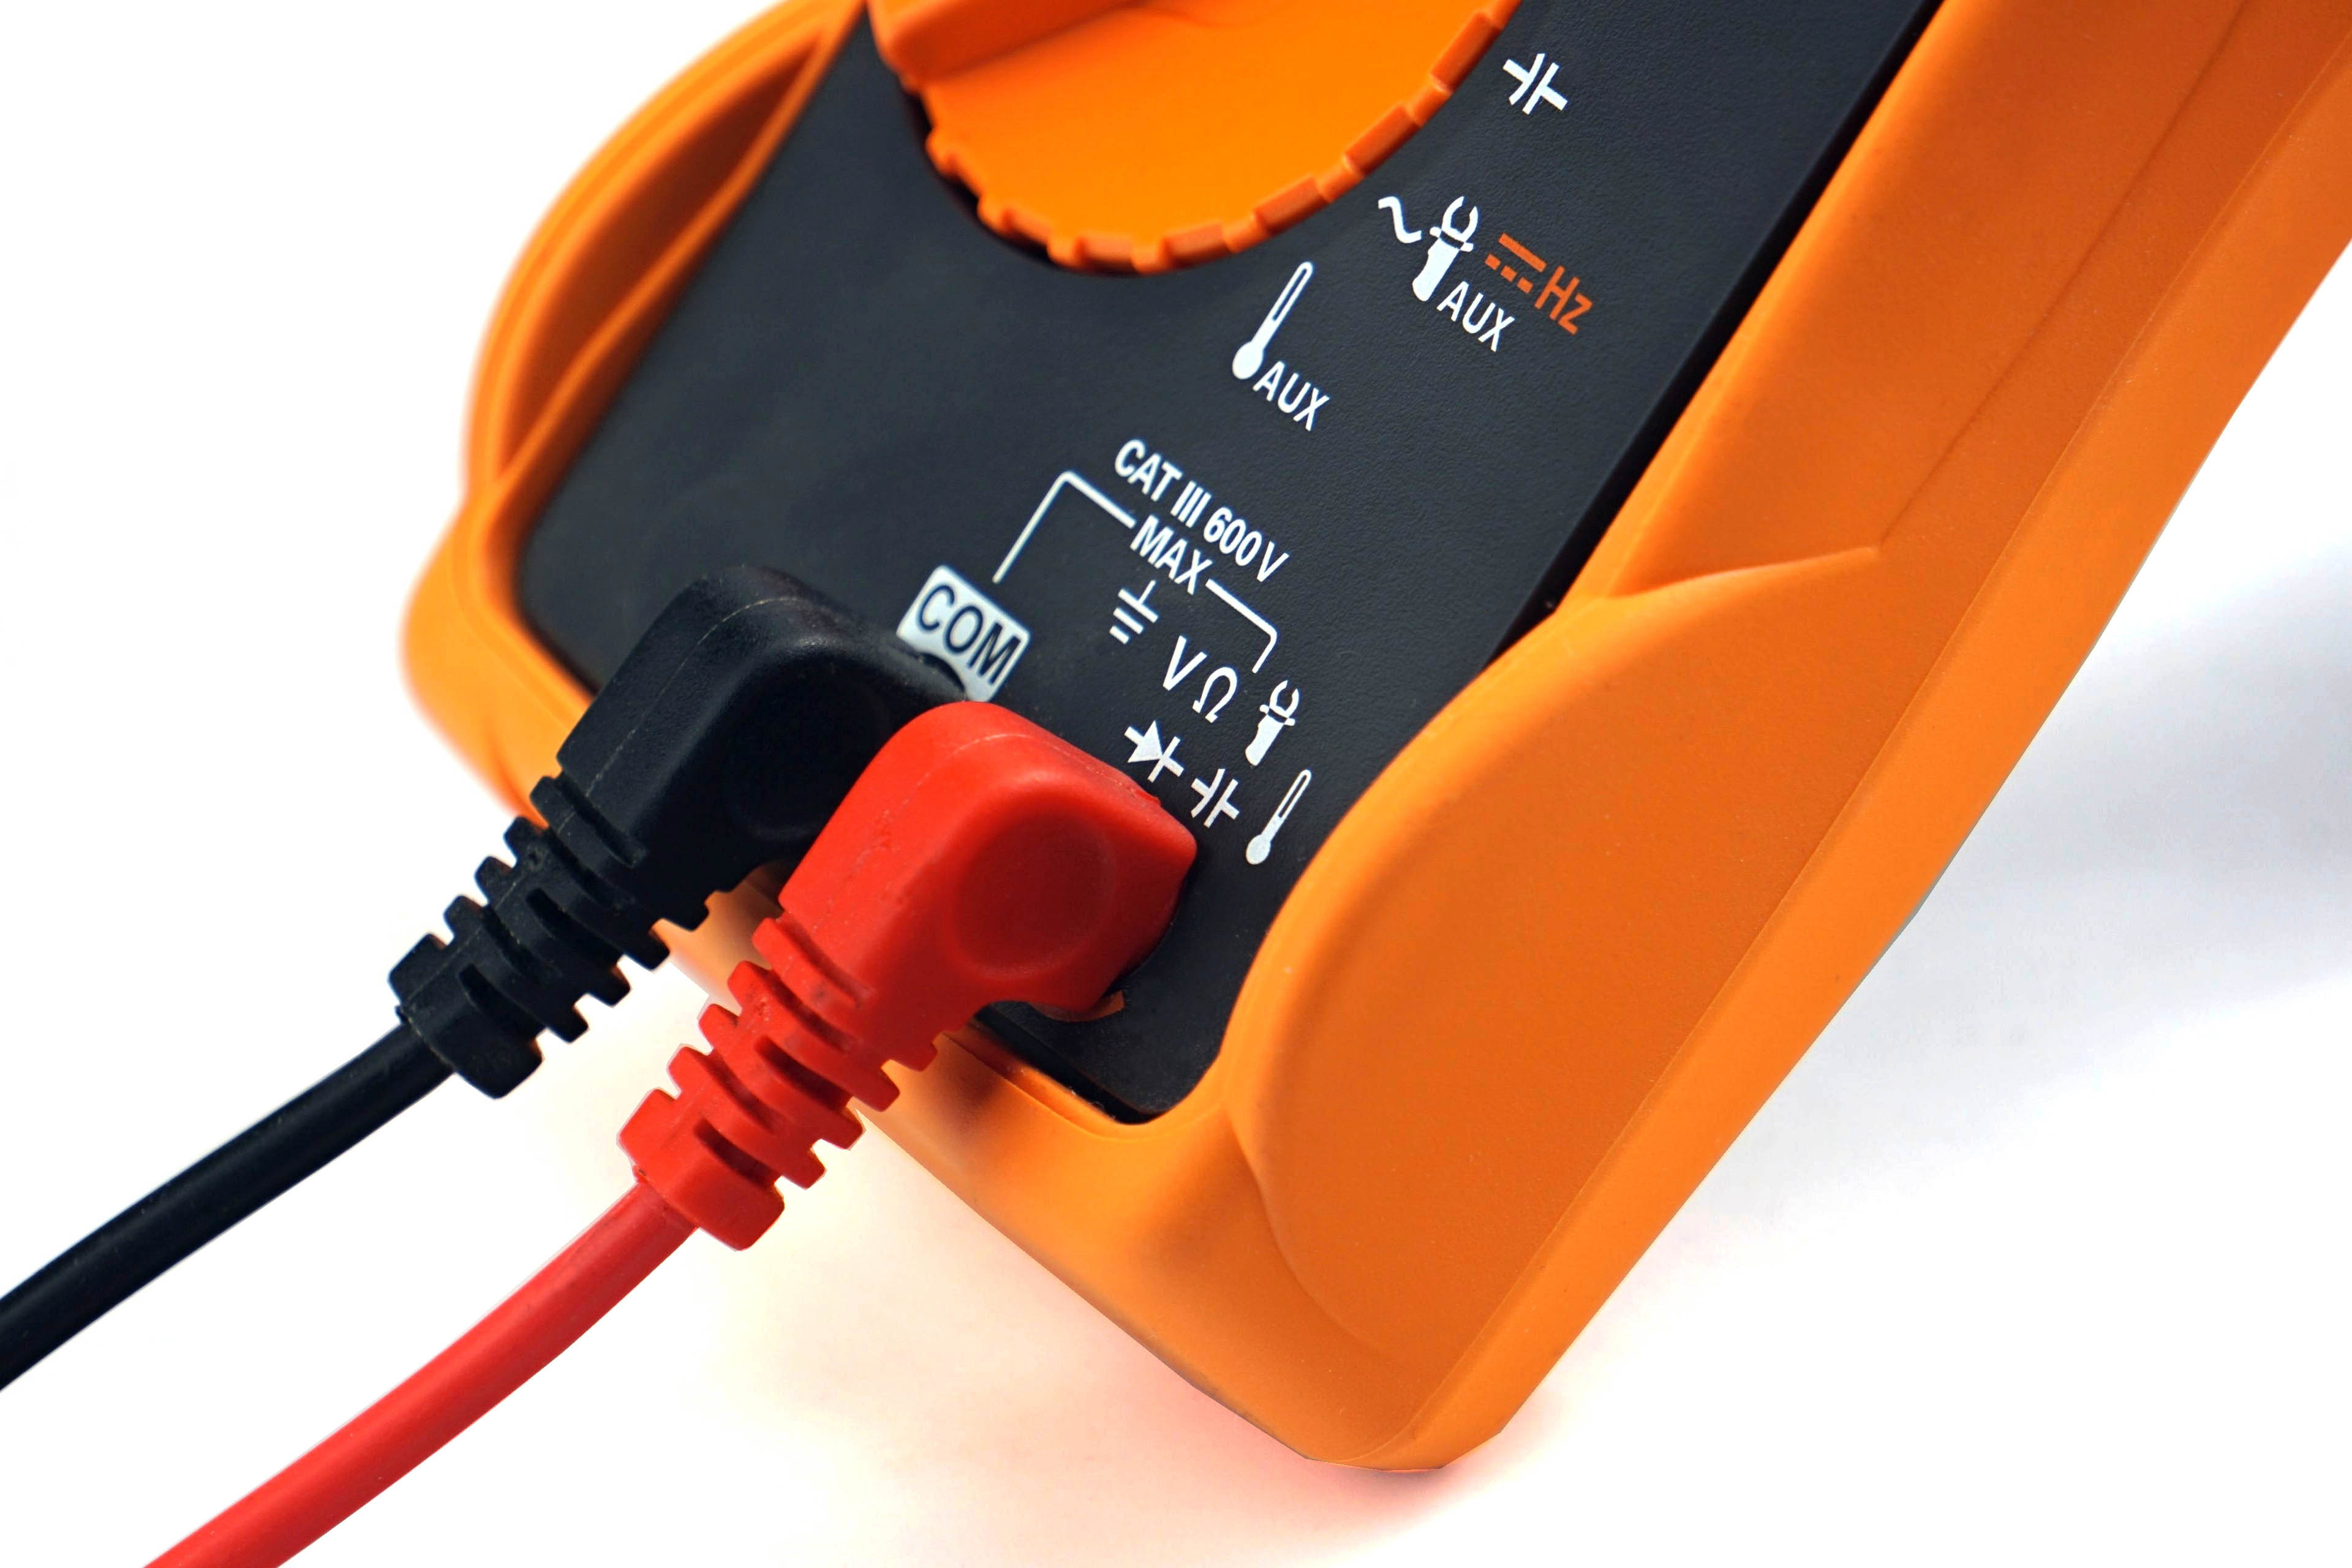
The probes are properly set to zero and connected to a Keysight U1231A multimeter before each measurement. It records samples of current values during the tests via the IR-USB interface and writes them in a table at one-second intervals. We can then create bar graphs with power consumption patterns. But we always write average values in bar graphs. Measurements take place in various load modes. The lowest represents an idle Windows 10 desktop. This measurement takes place on a system that had been idle for quite some time.
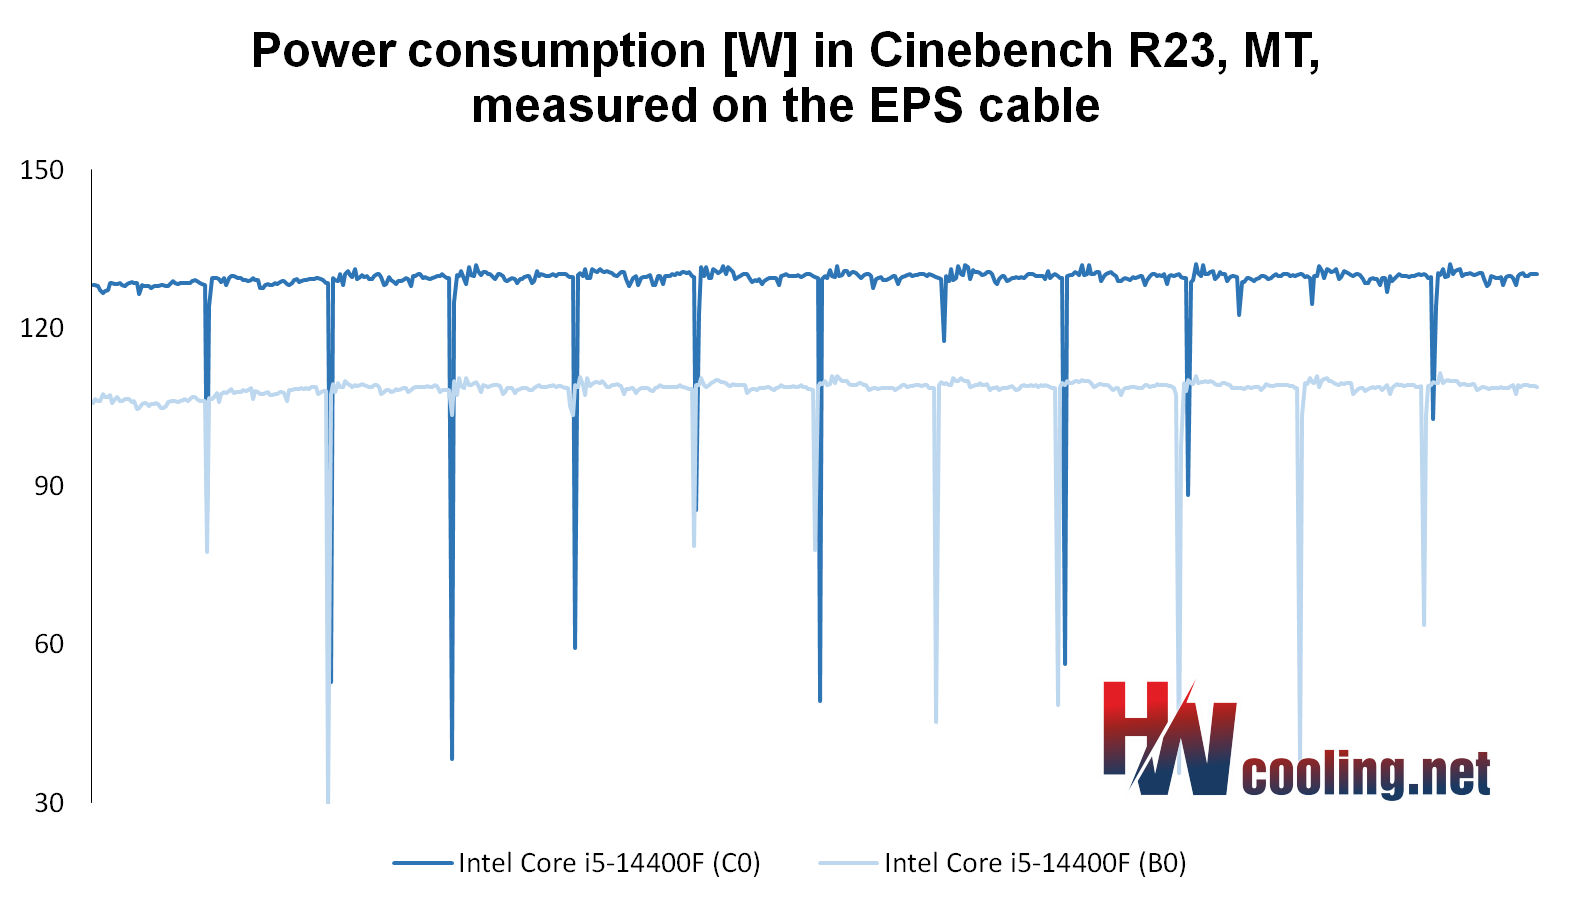
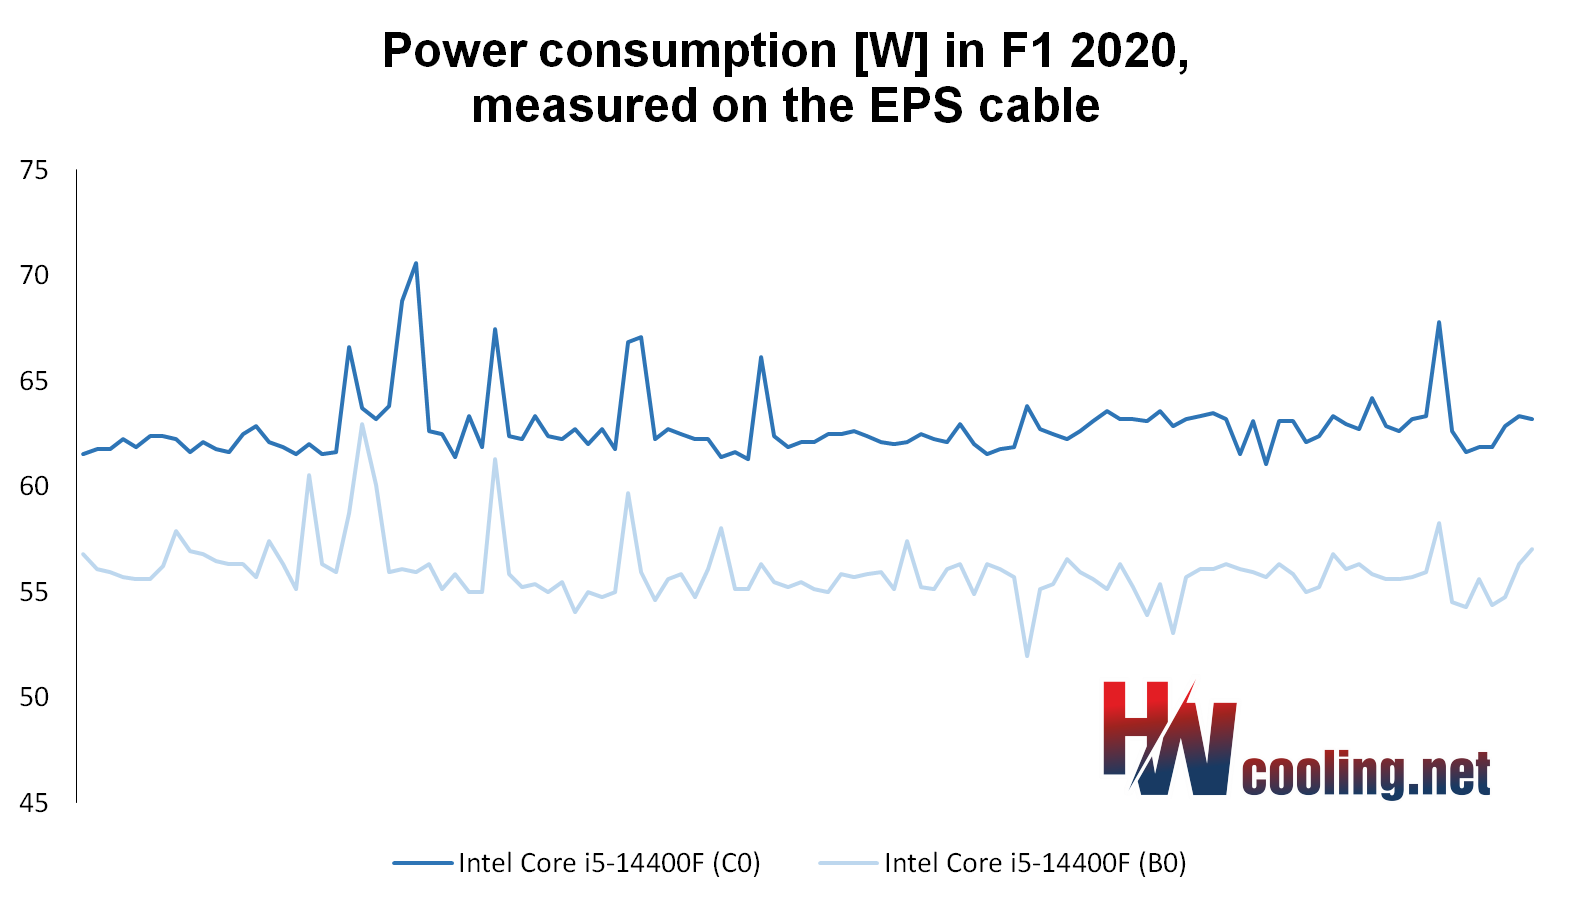
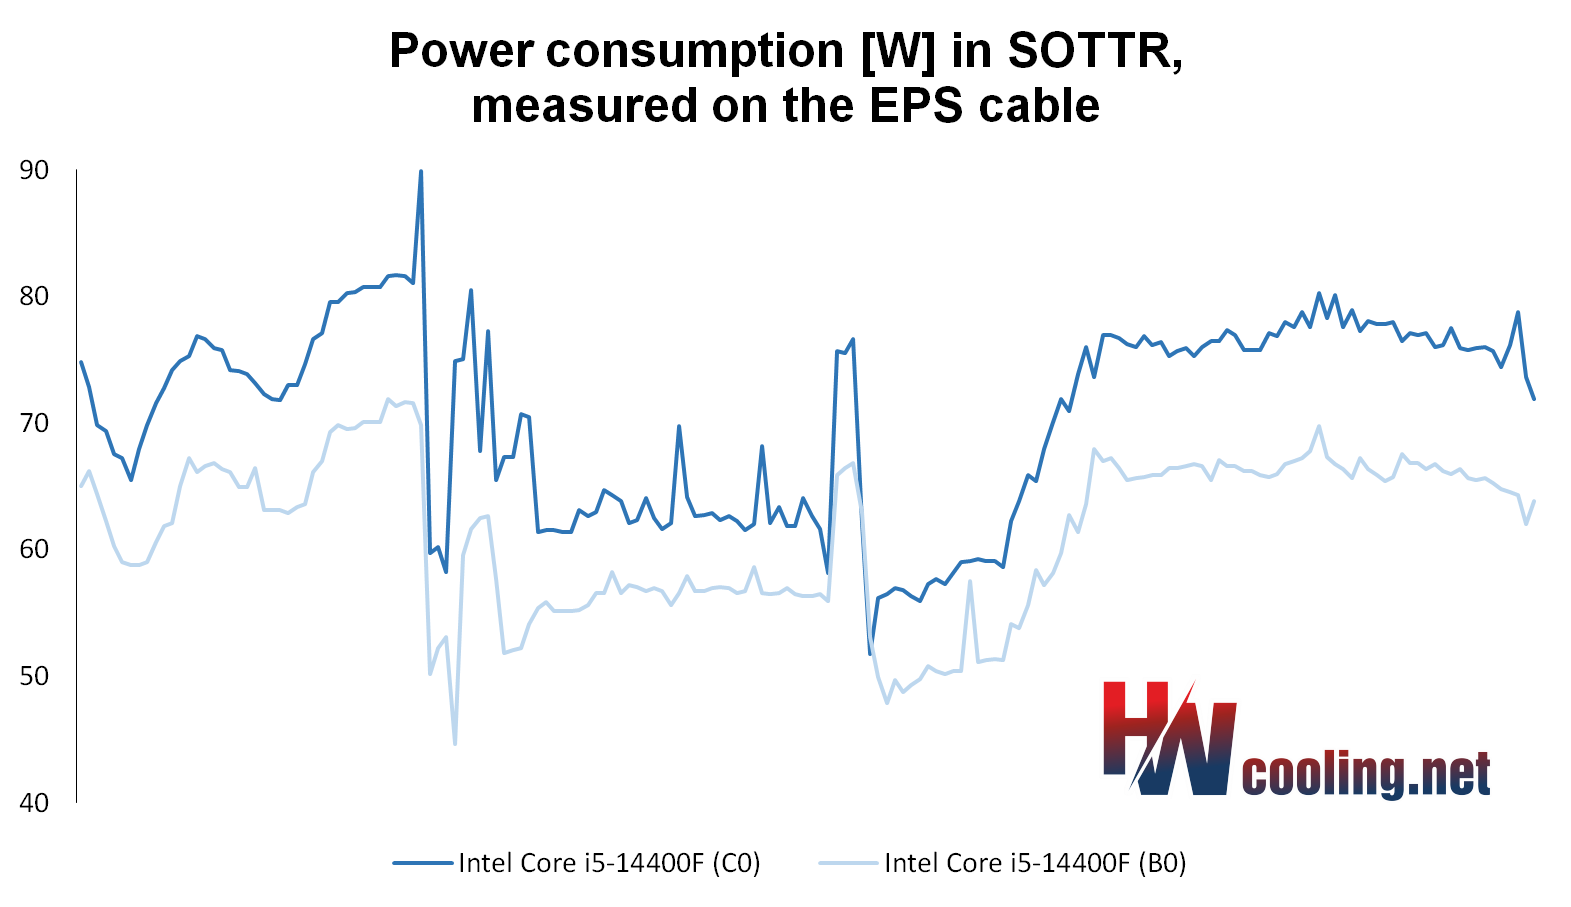
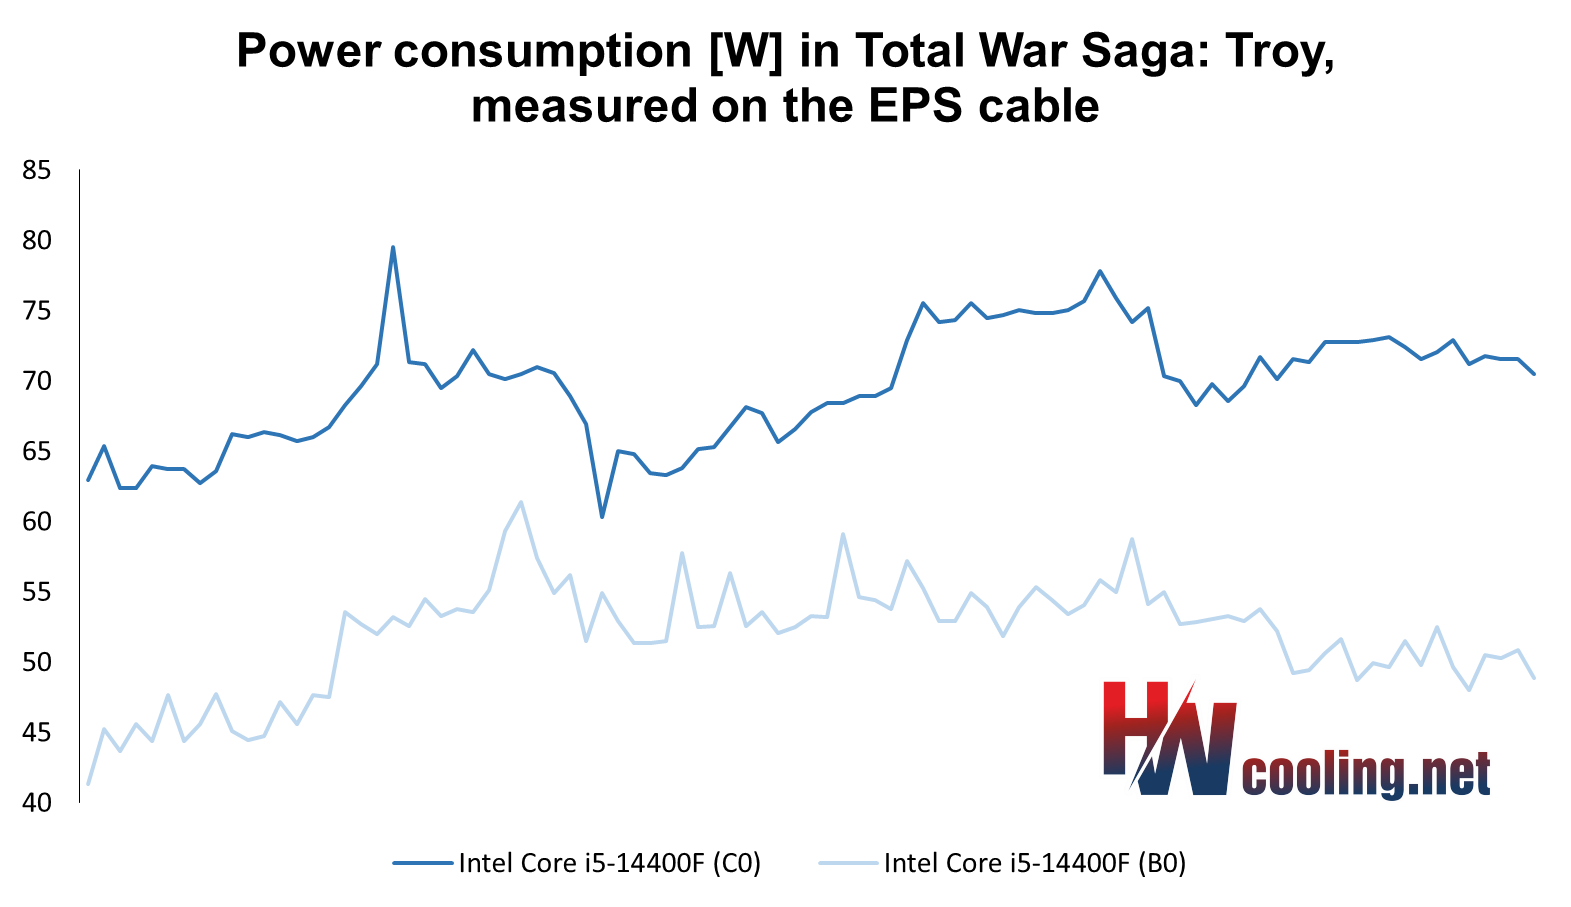
Audio encoding (FLAC) represents a higher load, but processors use only one core or one thread for this. Higher loads, where more cores are involved, are games. We test power consumption in F1 2020, Shadow of the Tomb Raider and Total War Saga: Troy in 1920 × 1080 px. In this resolution, the power consumption is usually the highest or at least similar to that in lower or higher resolutions, where in most cases the CPU power draw rather decreases due to its lower utilization.
Power limits are disabled for both Intel and AMD processors, unlocked at the PL2/PPT level. This is also the default setting for most motherboards. This means that the “Tau” timeout after 56 seconds does not reduce power consumption and clock speeds even under higher load, and performance is stable. We considered whether or not to accept the lower-power settings. In the end, we won’t, on the grounds that the vast majority of users don’t do it either and thus the results and comparisons would be rather uninteresting. The solution would indeed be to test with and without power limits, but this is already impossible time-wise in the context of processor tests. However, we won’t ignore this issue and it will be given space in motherboard tests where it makes more sense to us.
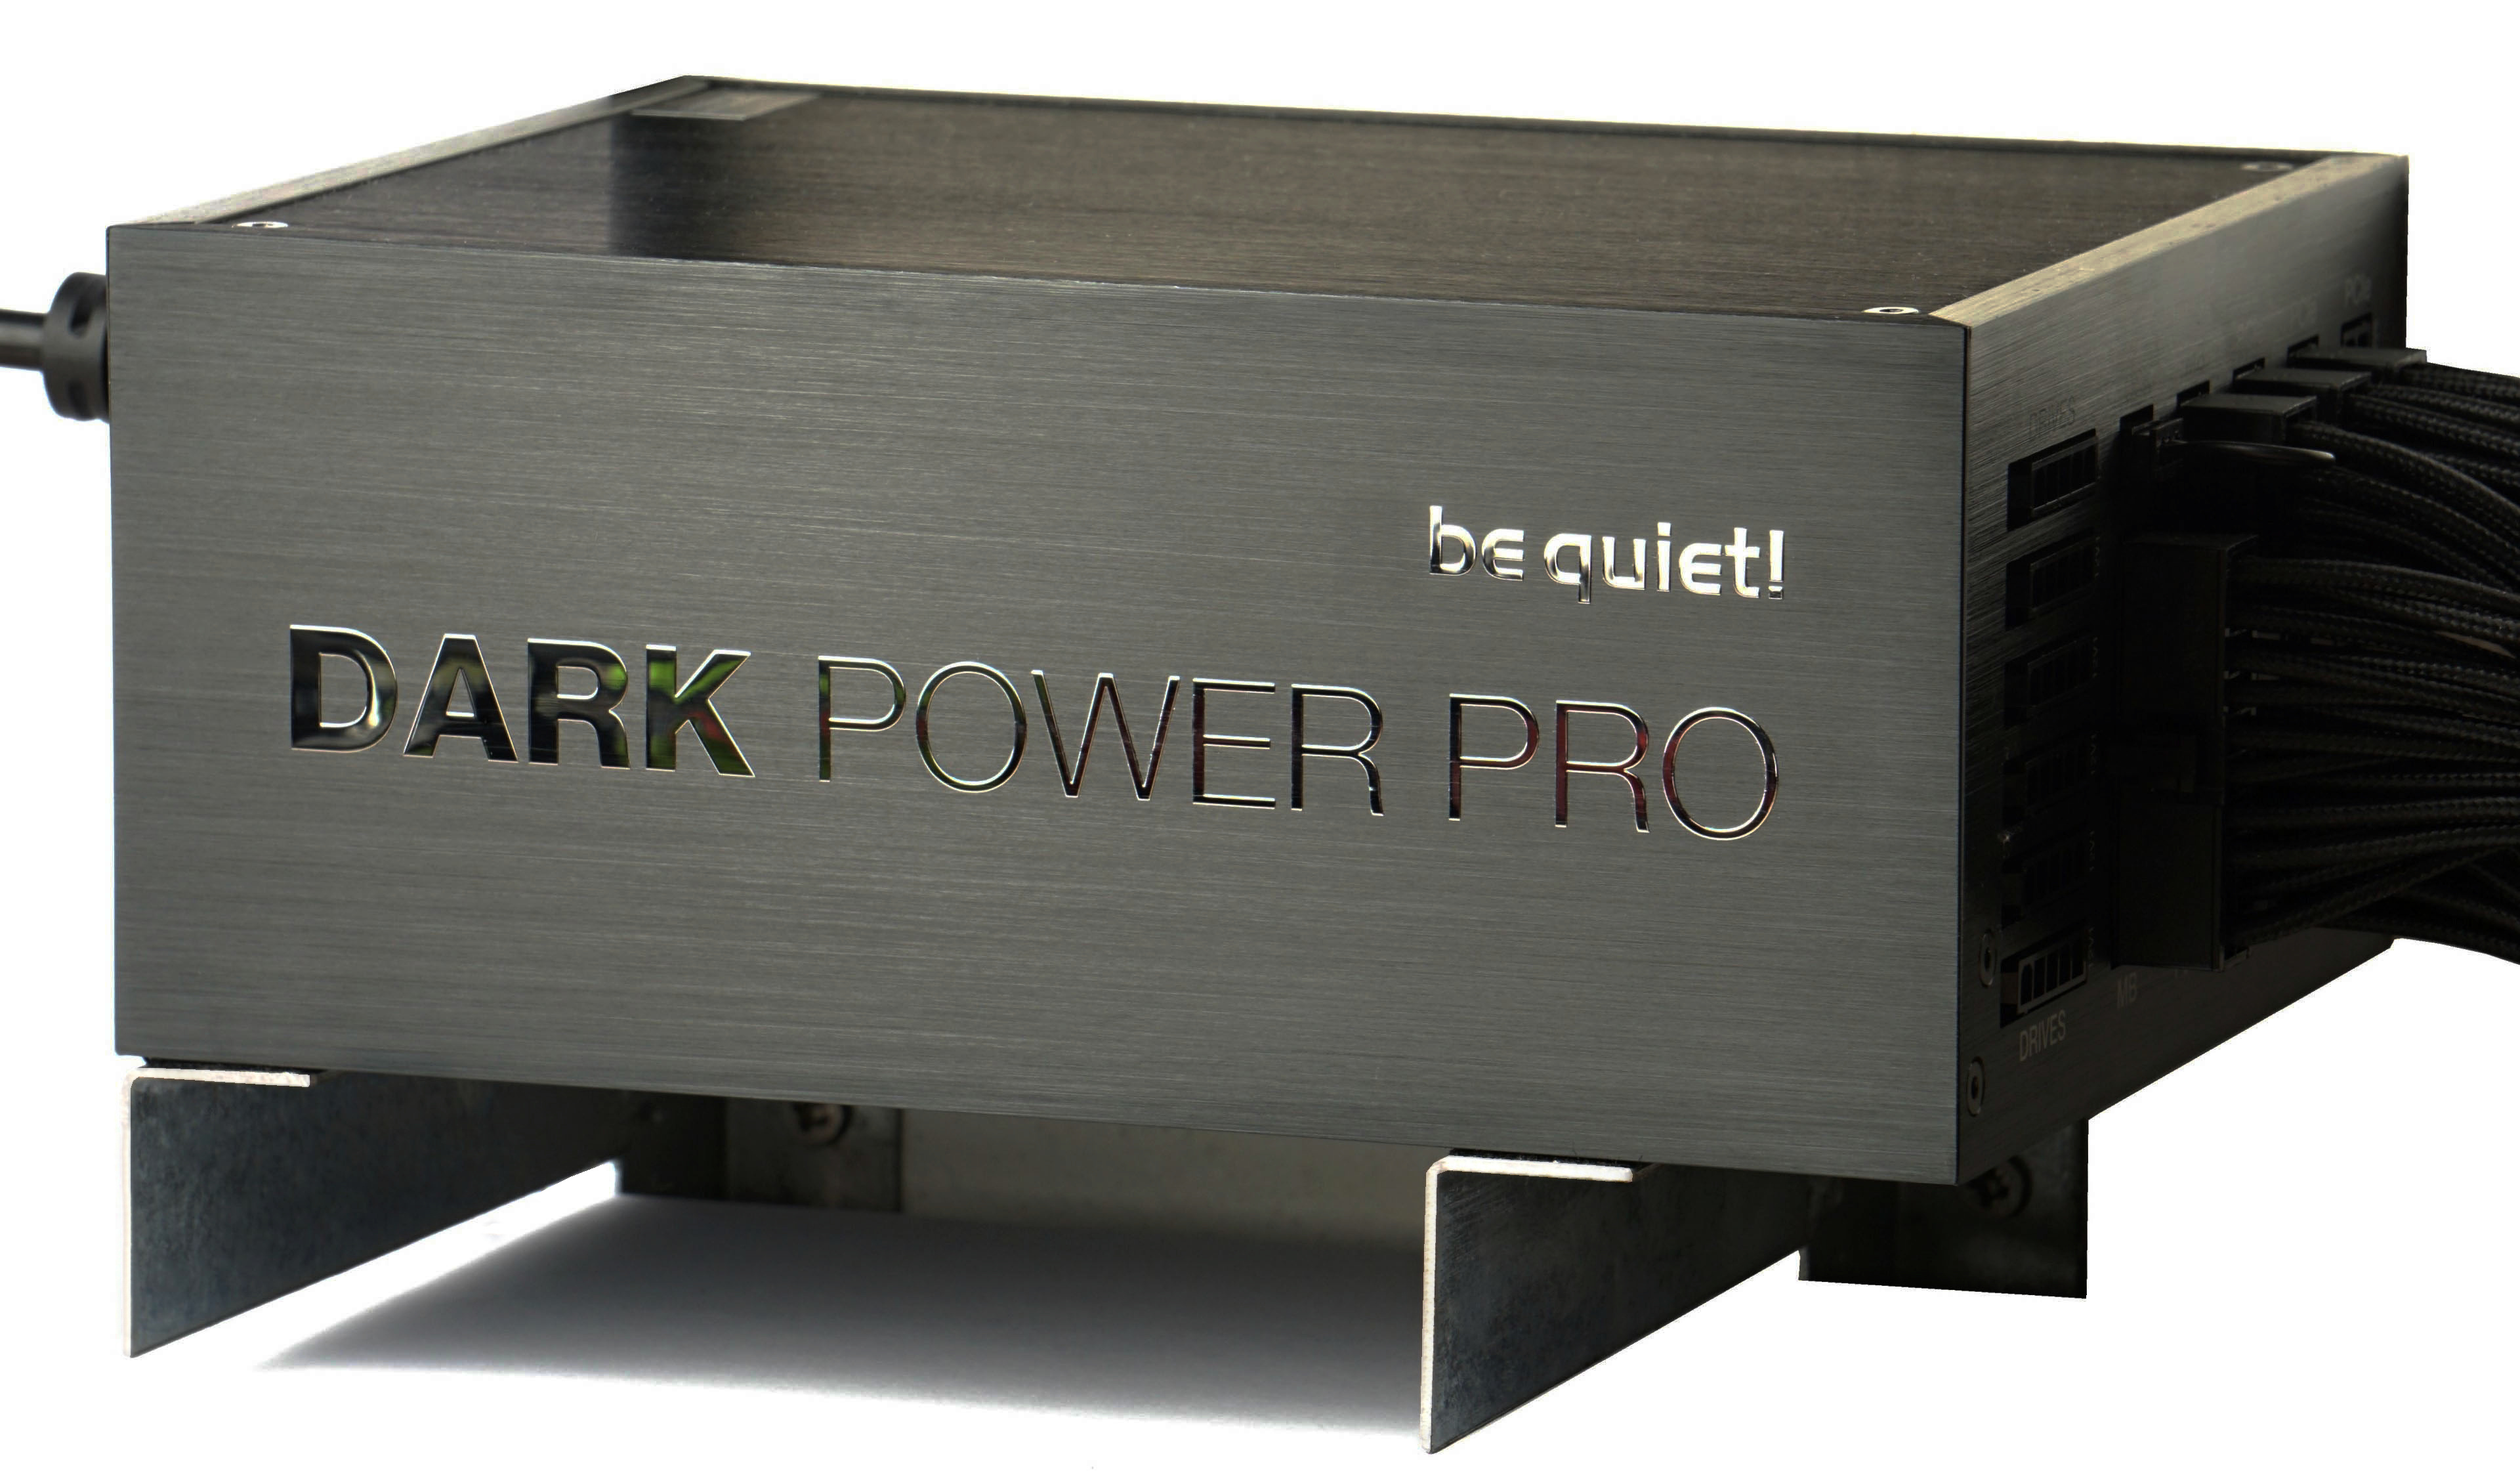
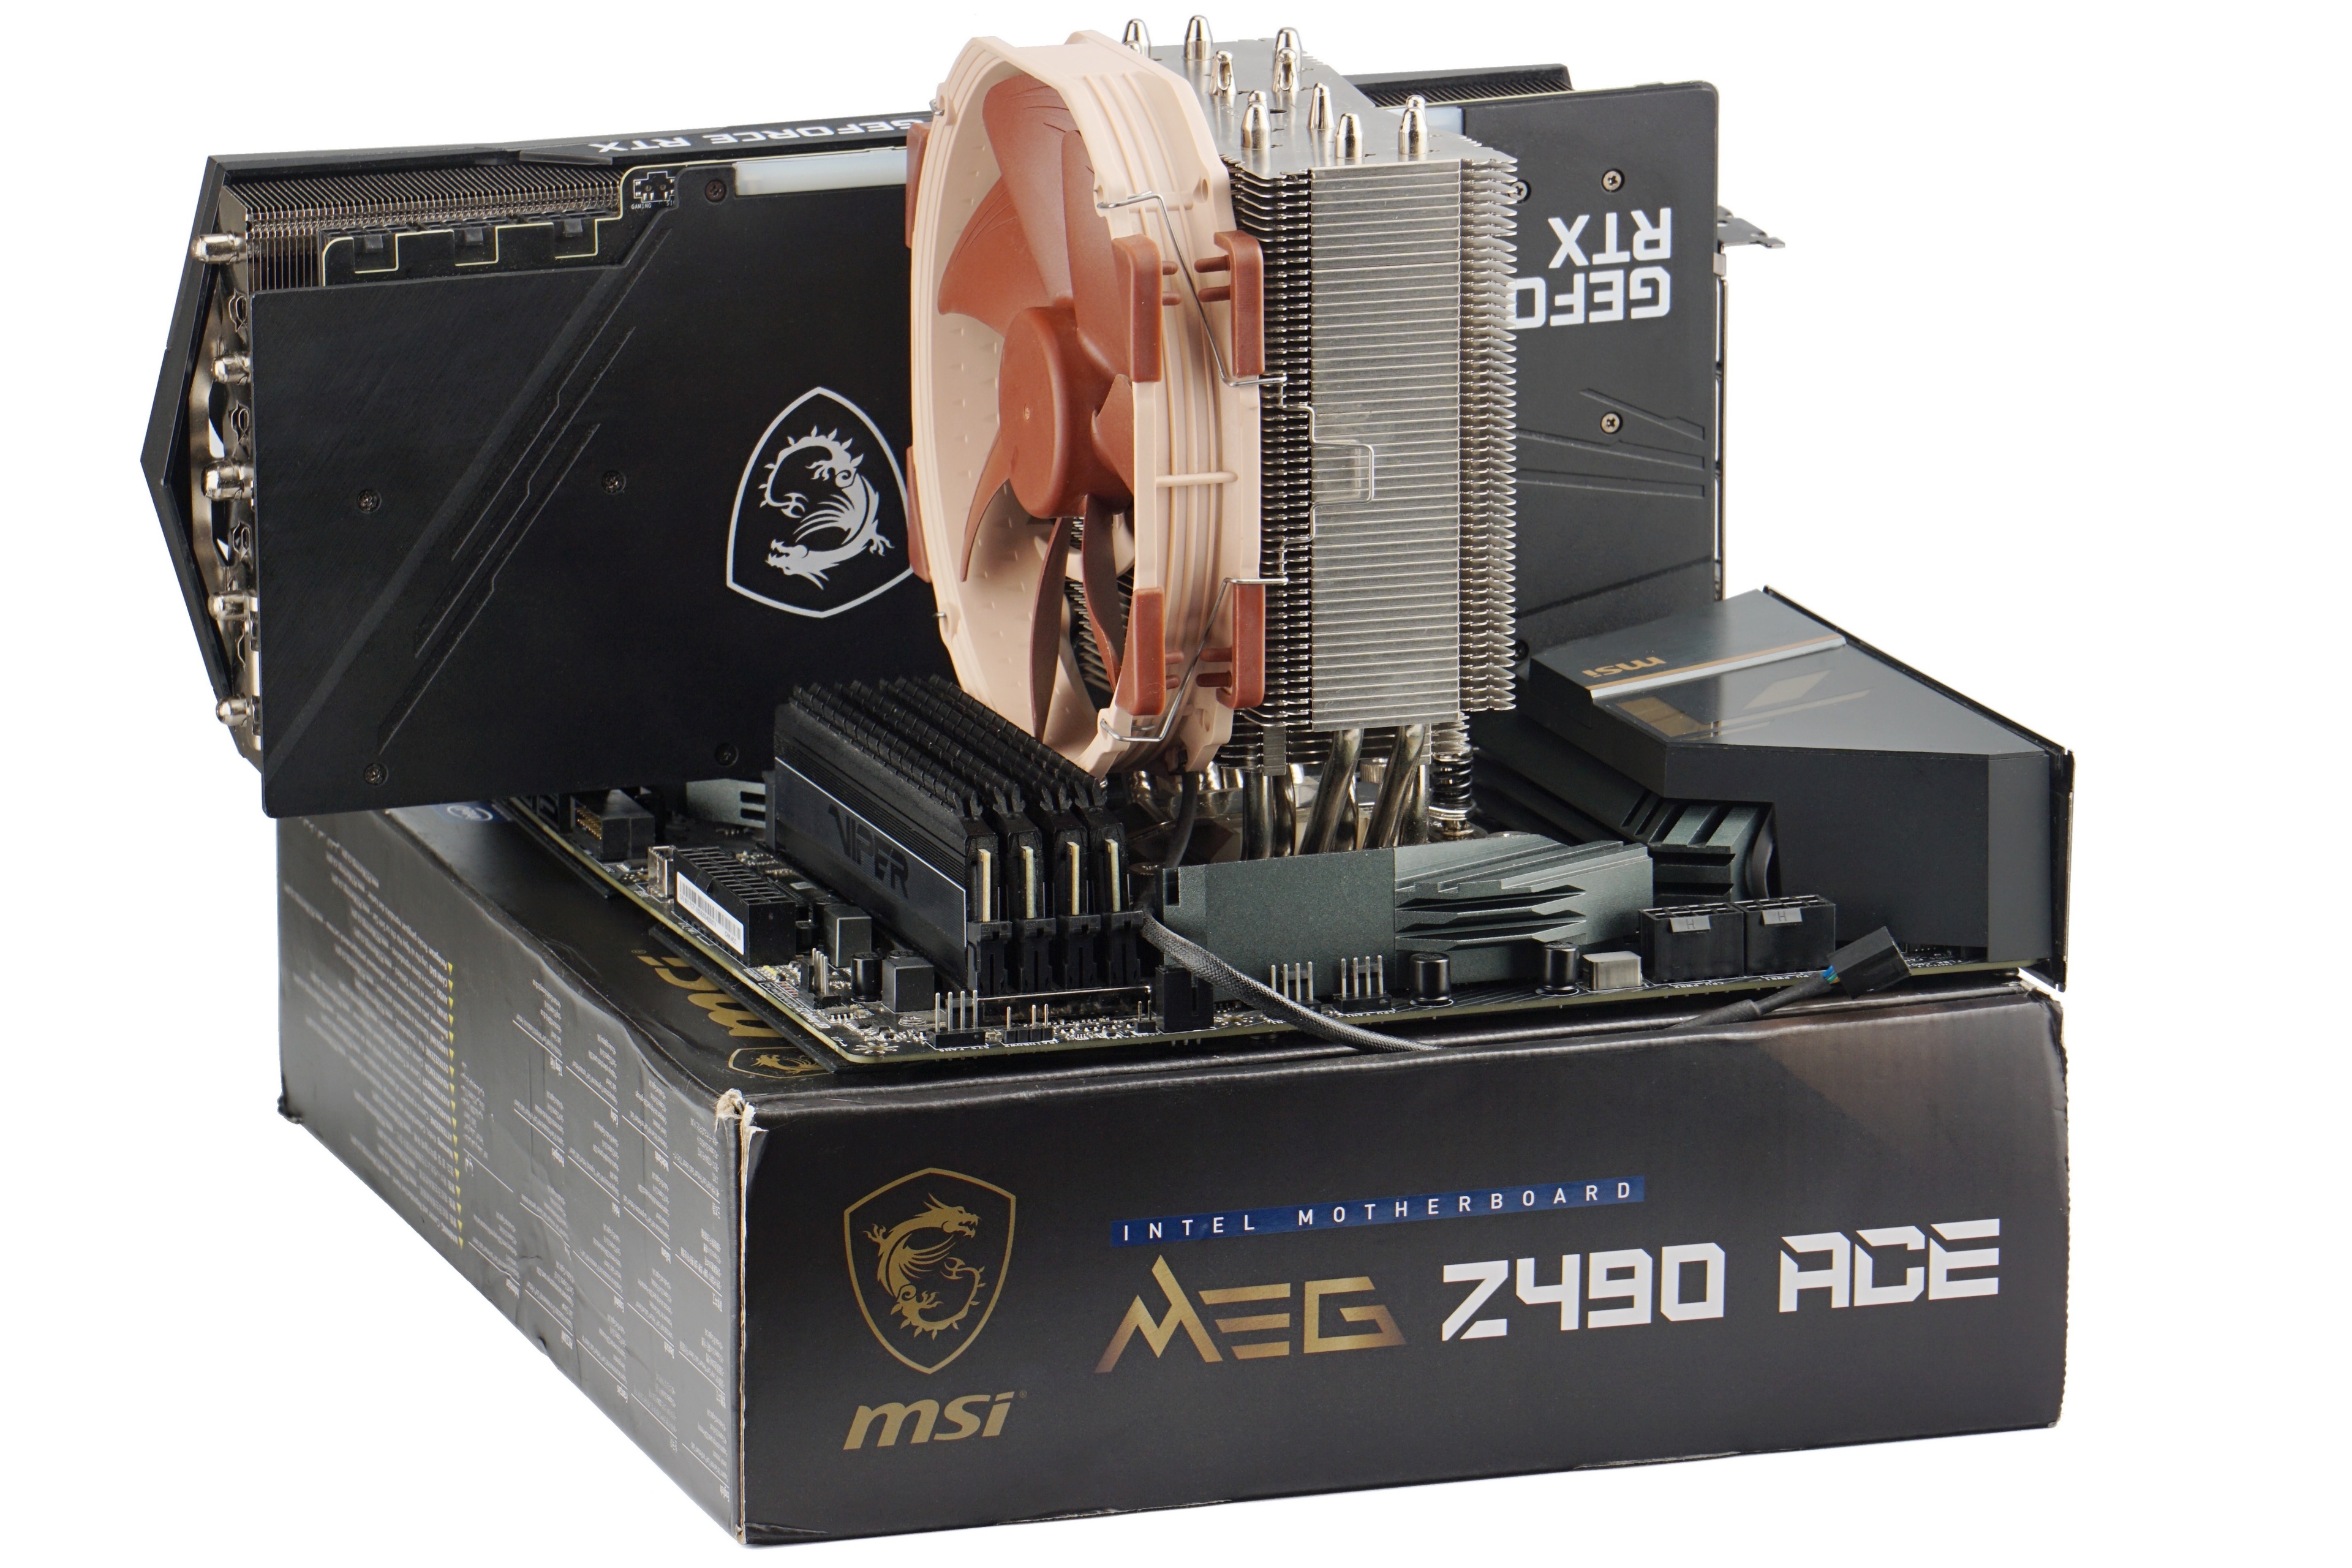
We always use motherboards with extremely robust, efficient VRM, so that the losses on MOSFETs distort the measured results as little as possible and the test setups are powered by a high-end 1200 W BeQuiet! Dark Power Pro 12 power supply. It is strong enough to supply every processor, even with a fully loaded GeForce RTX 3080, and at the same time achieves above-standard efficiency even at lower load. For a complete overview of test setup components, see Chapter 5 of this article.
For completeness of Intel Core i5-14400F processor tests we add the results of its second stepping. We’ve already tested the B0 variant, now it’s time for the C0. Its availability in stores is, at least at the moment, considerably worse and the question arises whether it is worth it at all. Is there any point in aiming for stepping C0 or is B0 also “okay”? Or does it “not matter” (what you get in the shopping lottery)?
Methodology: temperature and clock speed tests
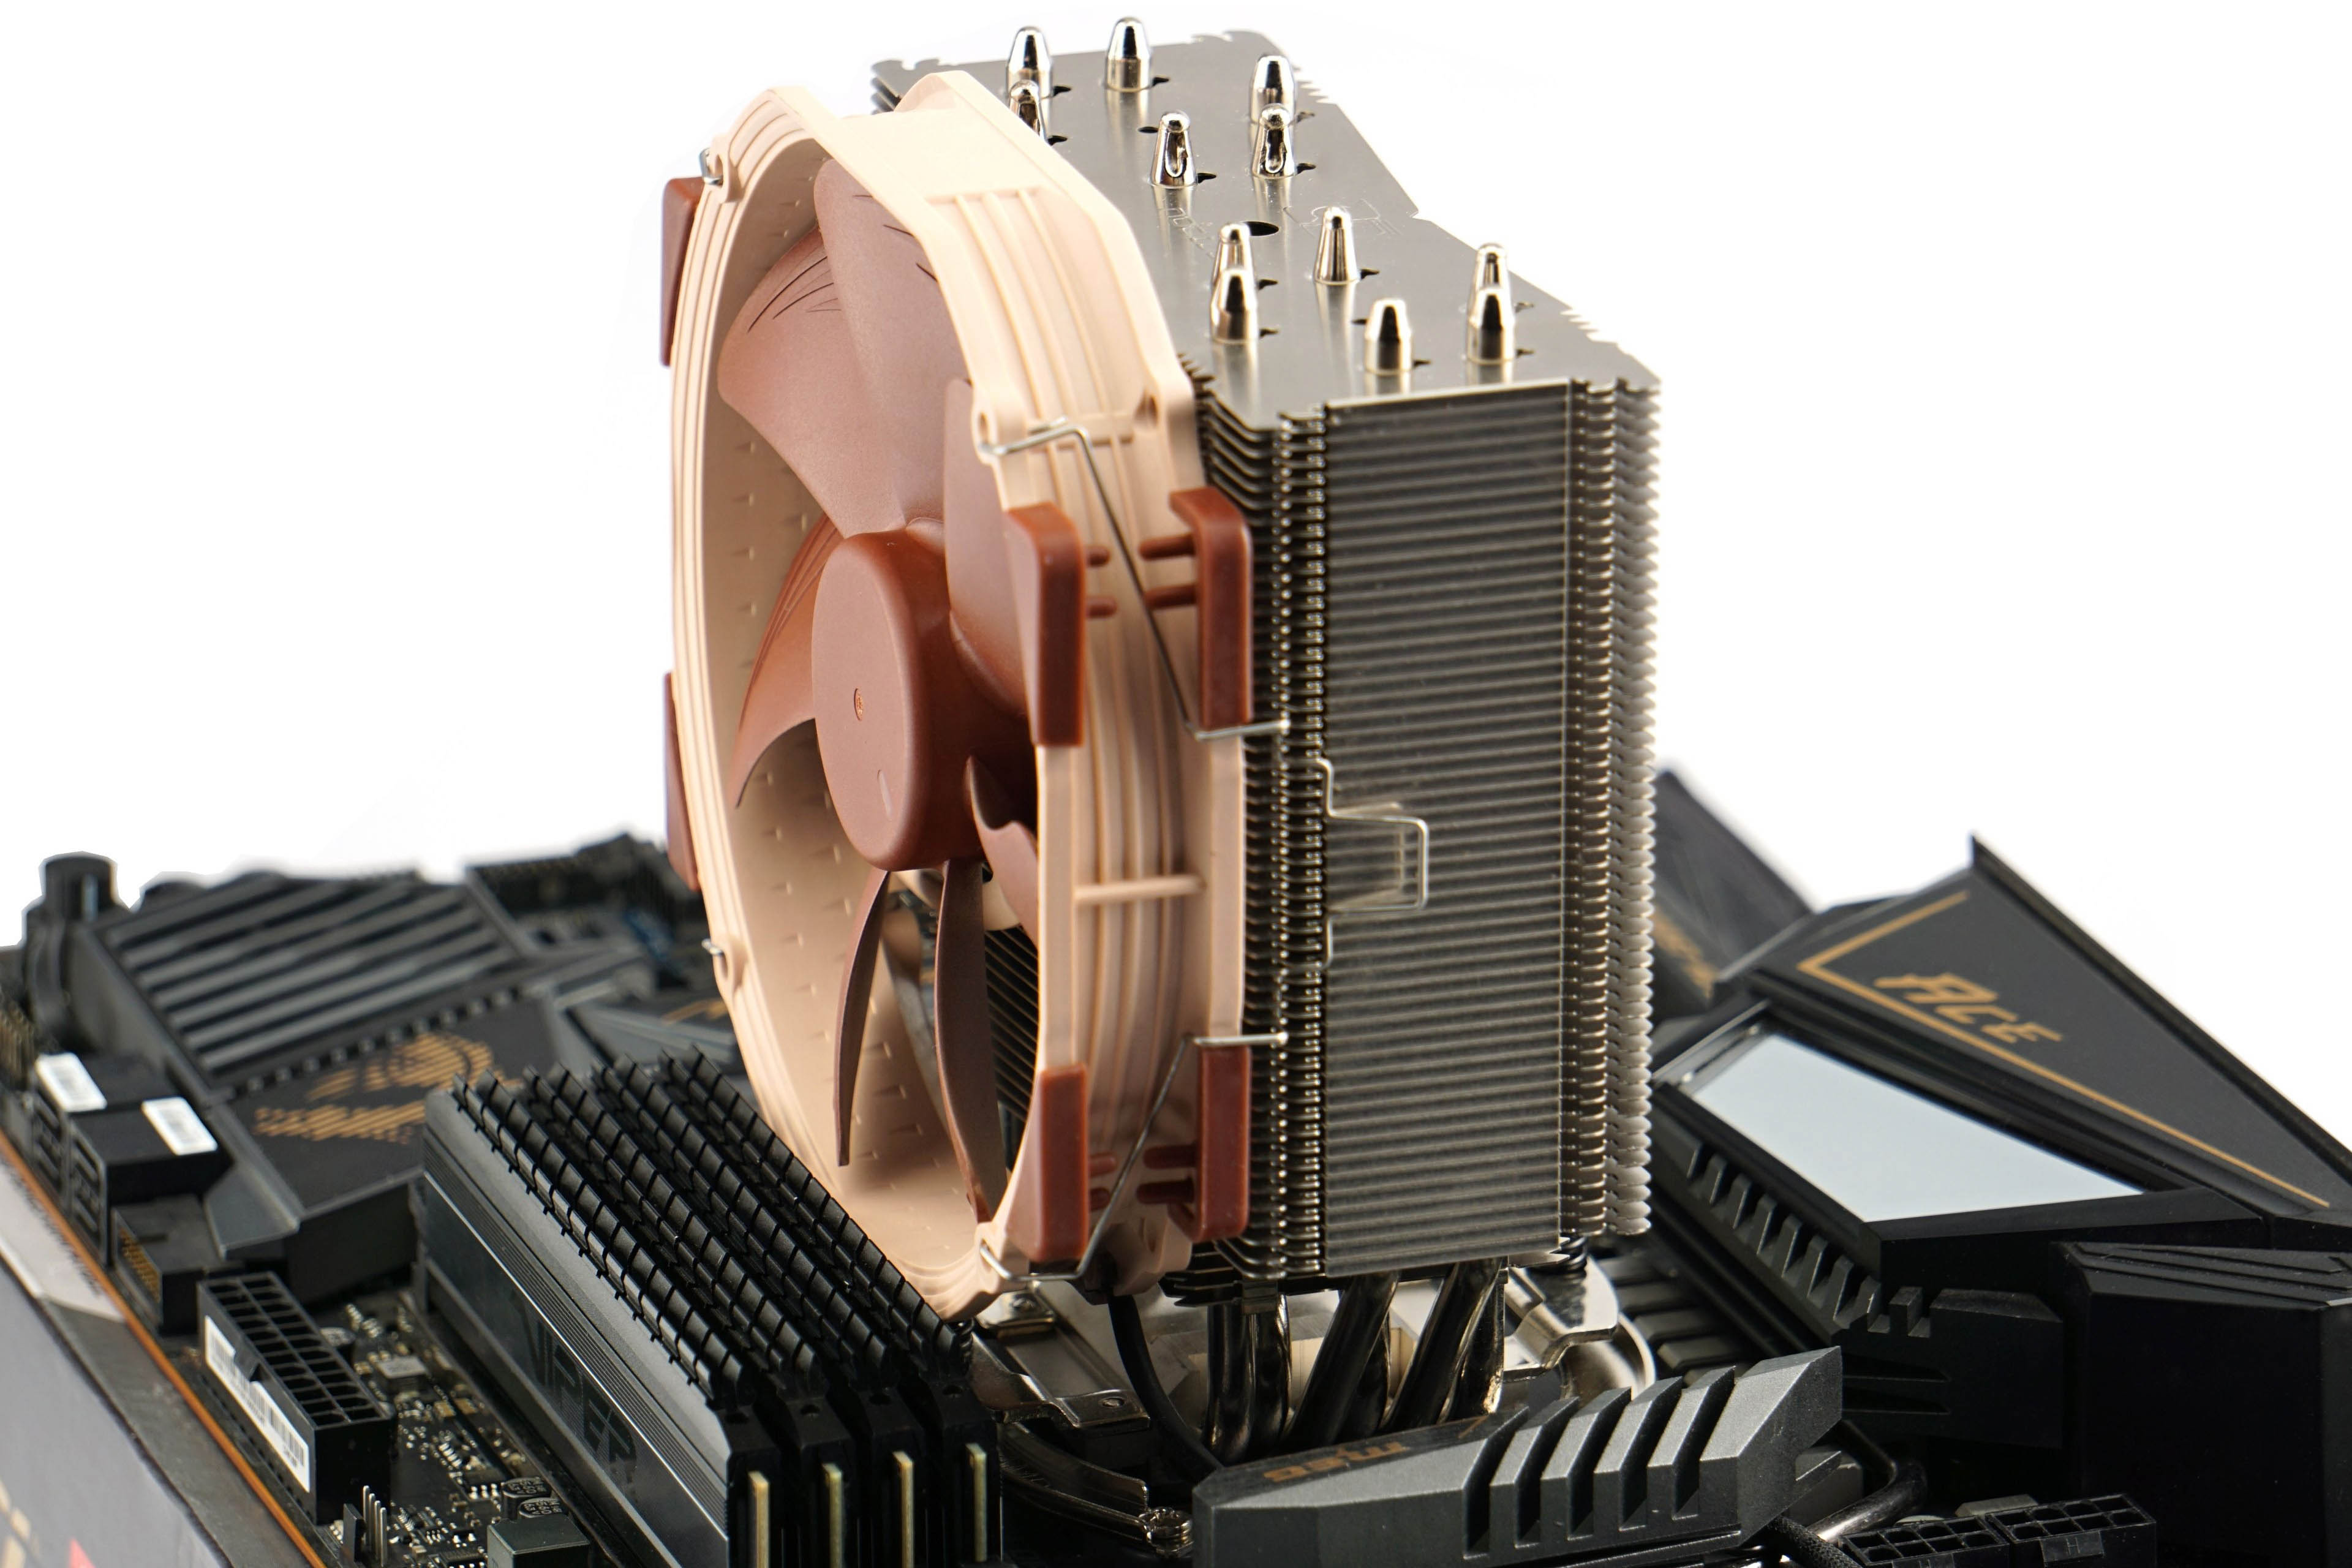
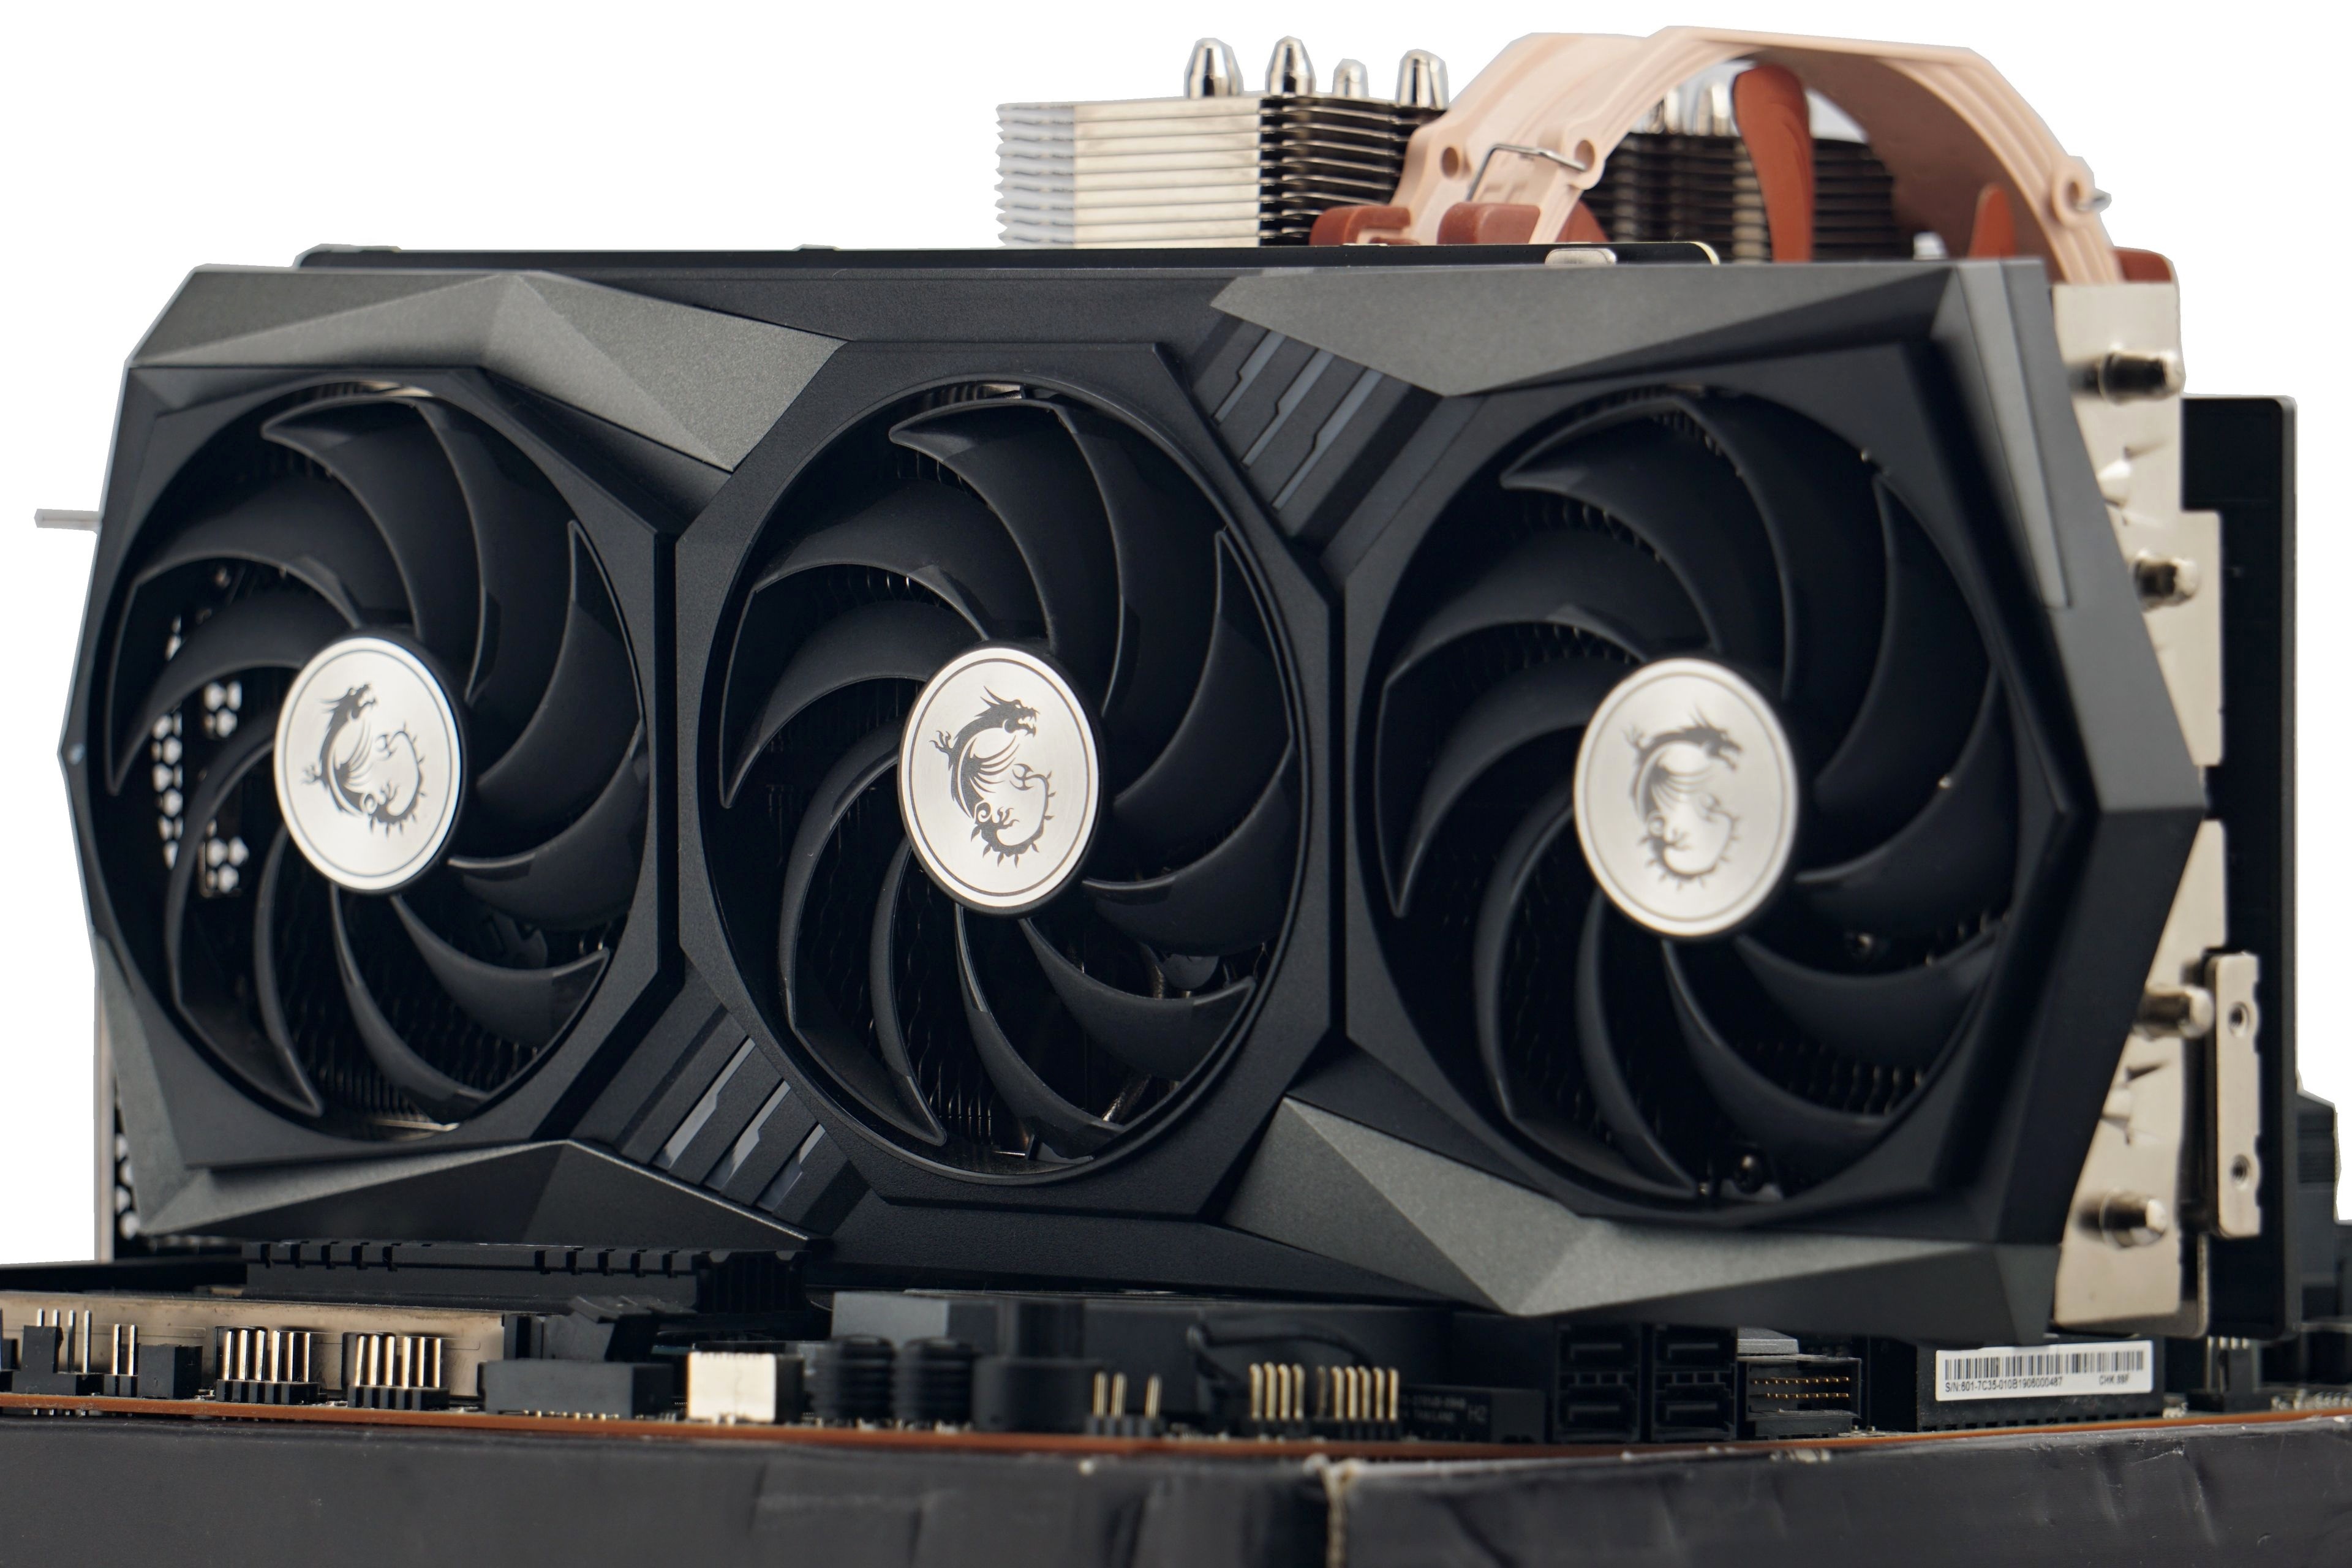
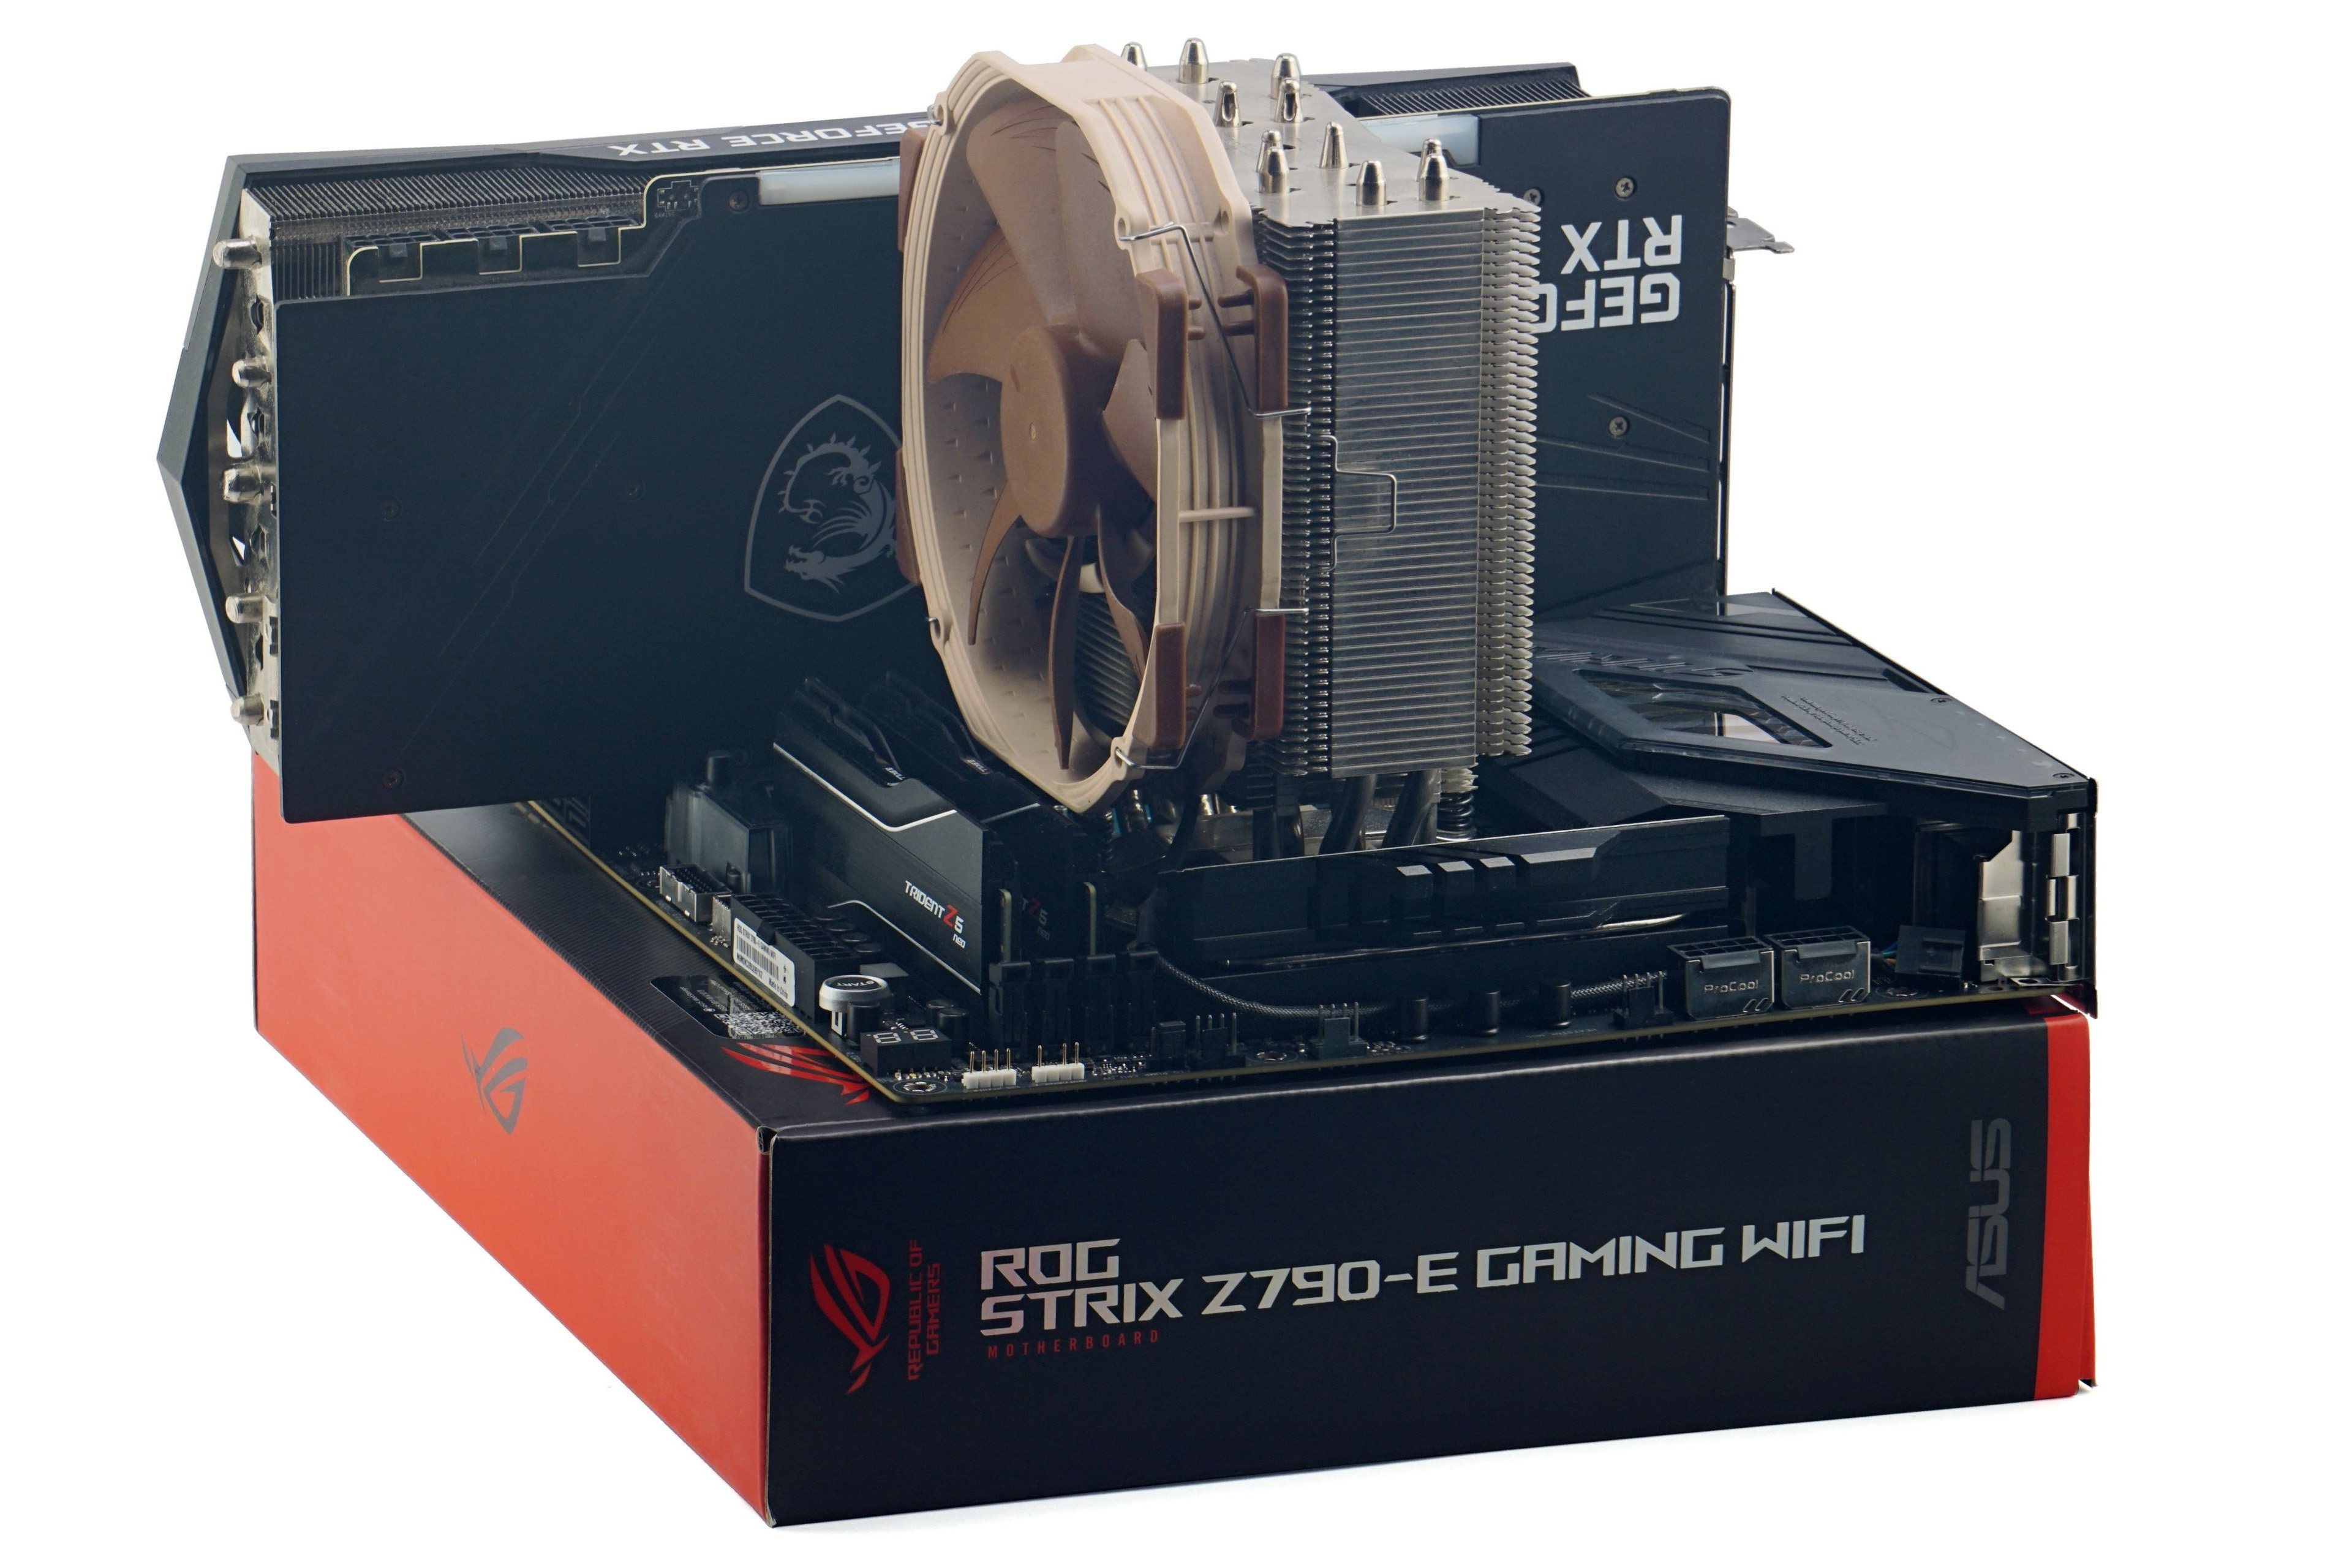
When choosing a cooler, we eventually opted for Noctua NH-U14S. It has a high performance and at the same time there is also the TR4-SP3 variant designed for Threadripper processors. It differs only by the base, the radiator is otherwise the same, so it will be possible to test and compare all processors under the same conditions. The fan on the NH-U14S cooler is set to a maximum speed of 1,535 rpm during all tests.
Measurements always take place on a bench-wall in a wind tunnel which simulates a computer case, with the difference that we have more control over it.
System cooling consists of four Noctua NF-S12A PWM fans, which are in an equilibrium ratio of two at the inlet and two at the outlet. Their speed is set at a fixed 535 rpm, which is a relatively practical speed that is not needed to be exceeded. In short, this should be the optimal configuration based on our tests of various system cooling settings.

It is also important to maintain the same air temperature around the processors. Of course, this also changes with regard to how much heat a particular processor produces, but at the inlet of the tunnel it must always be the same for accurate comparisons. In our air-conditioned test lab, it is currently in the range of 21–21.3 °C.
Maintaining a constant inlet temperature is necessary not only for a proper comparison of processor temperatures, but especially for unbiased performance comparisons. Trend of clock speed and especially single-core boost depends on the temperature. In the summer at higher temperatures, processors may be slower in living spaces than in the winter.
For Intel processors, we register the maximum core temperature for each test, usually of all cores. These maximum values are then averaged and the result is represented by the final value in the graph. From the outputs of single-threaded load, we only pick the registered values from active cores (these are usually two and alternate during the test). It’s a little different with AMD processors. They don’t have temperature sensors for every core. In order for the procedure to be as methodically as possible similar to that applied on Intel processors, the average temperature of all cores is defined by the highest value reported by the CPU Tdie sensor (average). For single-threaded load, however, we already use a CPU sensor (Tctl/Tdie), which usually reports a slightly higher value, which better corresponds to the hotspots of one or two cores. But these values as well as the values from all internal sensors must be taken with a grain of salt, the accuracy of the sensors varies across processors.
Clock speed evaluation is more accurate, each core has its own sensor even on AMD processors. Unlike temperatures, we plot average clock speed values during tests in graphs. We monitor the temperature and clock speed of the processor cores in the same tests, in which we also measure the power consumption. And thus, gradually from the lowest load level on the desktop of idle Windows 10, through audio encoding (single-threaded load), gaming load in three games (F1 2020, Shadow of the Tomb Raider and Total War Saga: Troy), to a 10-minute load in Cinebench R23 and the most demanding video encoding with the x264 encoder in HandBrake.
To record the temperatures and clock speed of the processor cores, we use HWiNFO, in which sampling is set to two seconds. With the exception of audio encoding, the graphs always show the averages of all processor cores in terms of temperatures and clock speed. During audio encoding, the values from the loaded core are given.
For completeness of Intel Core i5-14400F processor tests we add the results of its second stepping. We’ve already tested the B0 variant, now it’s time for the C0. Its availability in stores is, at least at the moment, considerably worse and the question arises whether it is worth it at all. Is there any point in aiming for stepping C0 or is B0 also “okay”? Or does it “not matter” (what you get in the shopping lottery)?
Test setup
| Test configuration | |
| CPU cooler | Noctua NH-U14S@12 V |
| Thermal compound | Noctua NT-H2 |
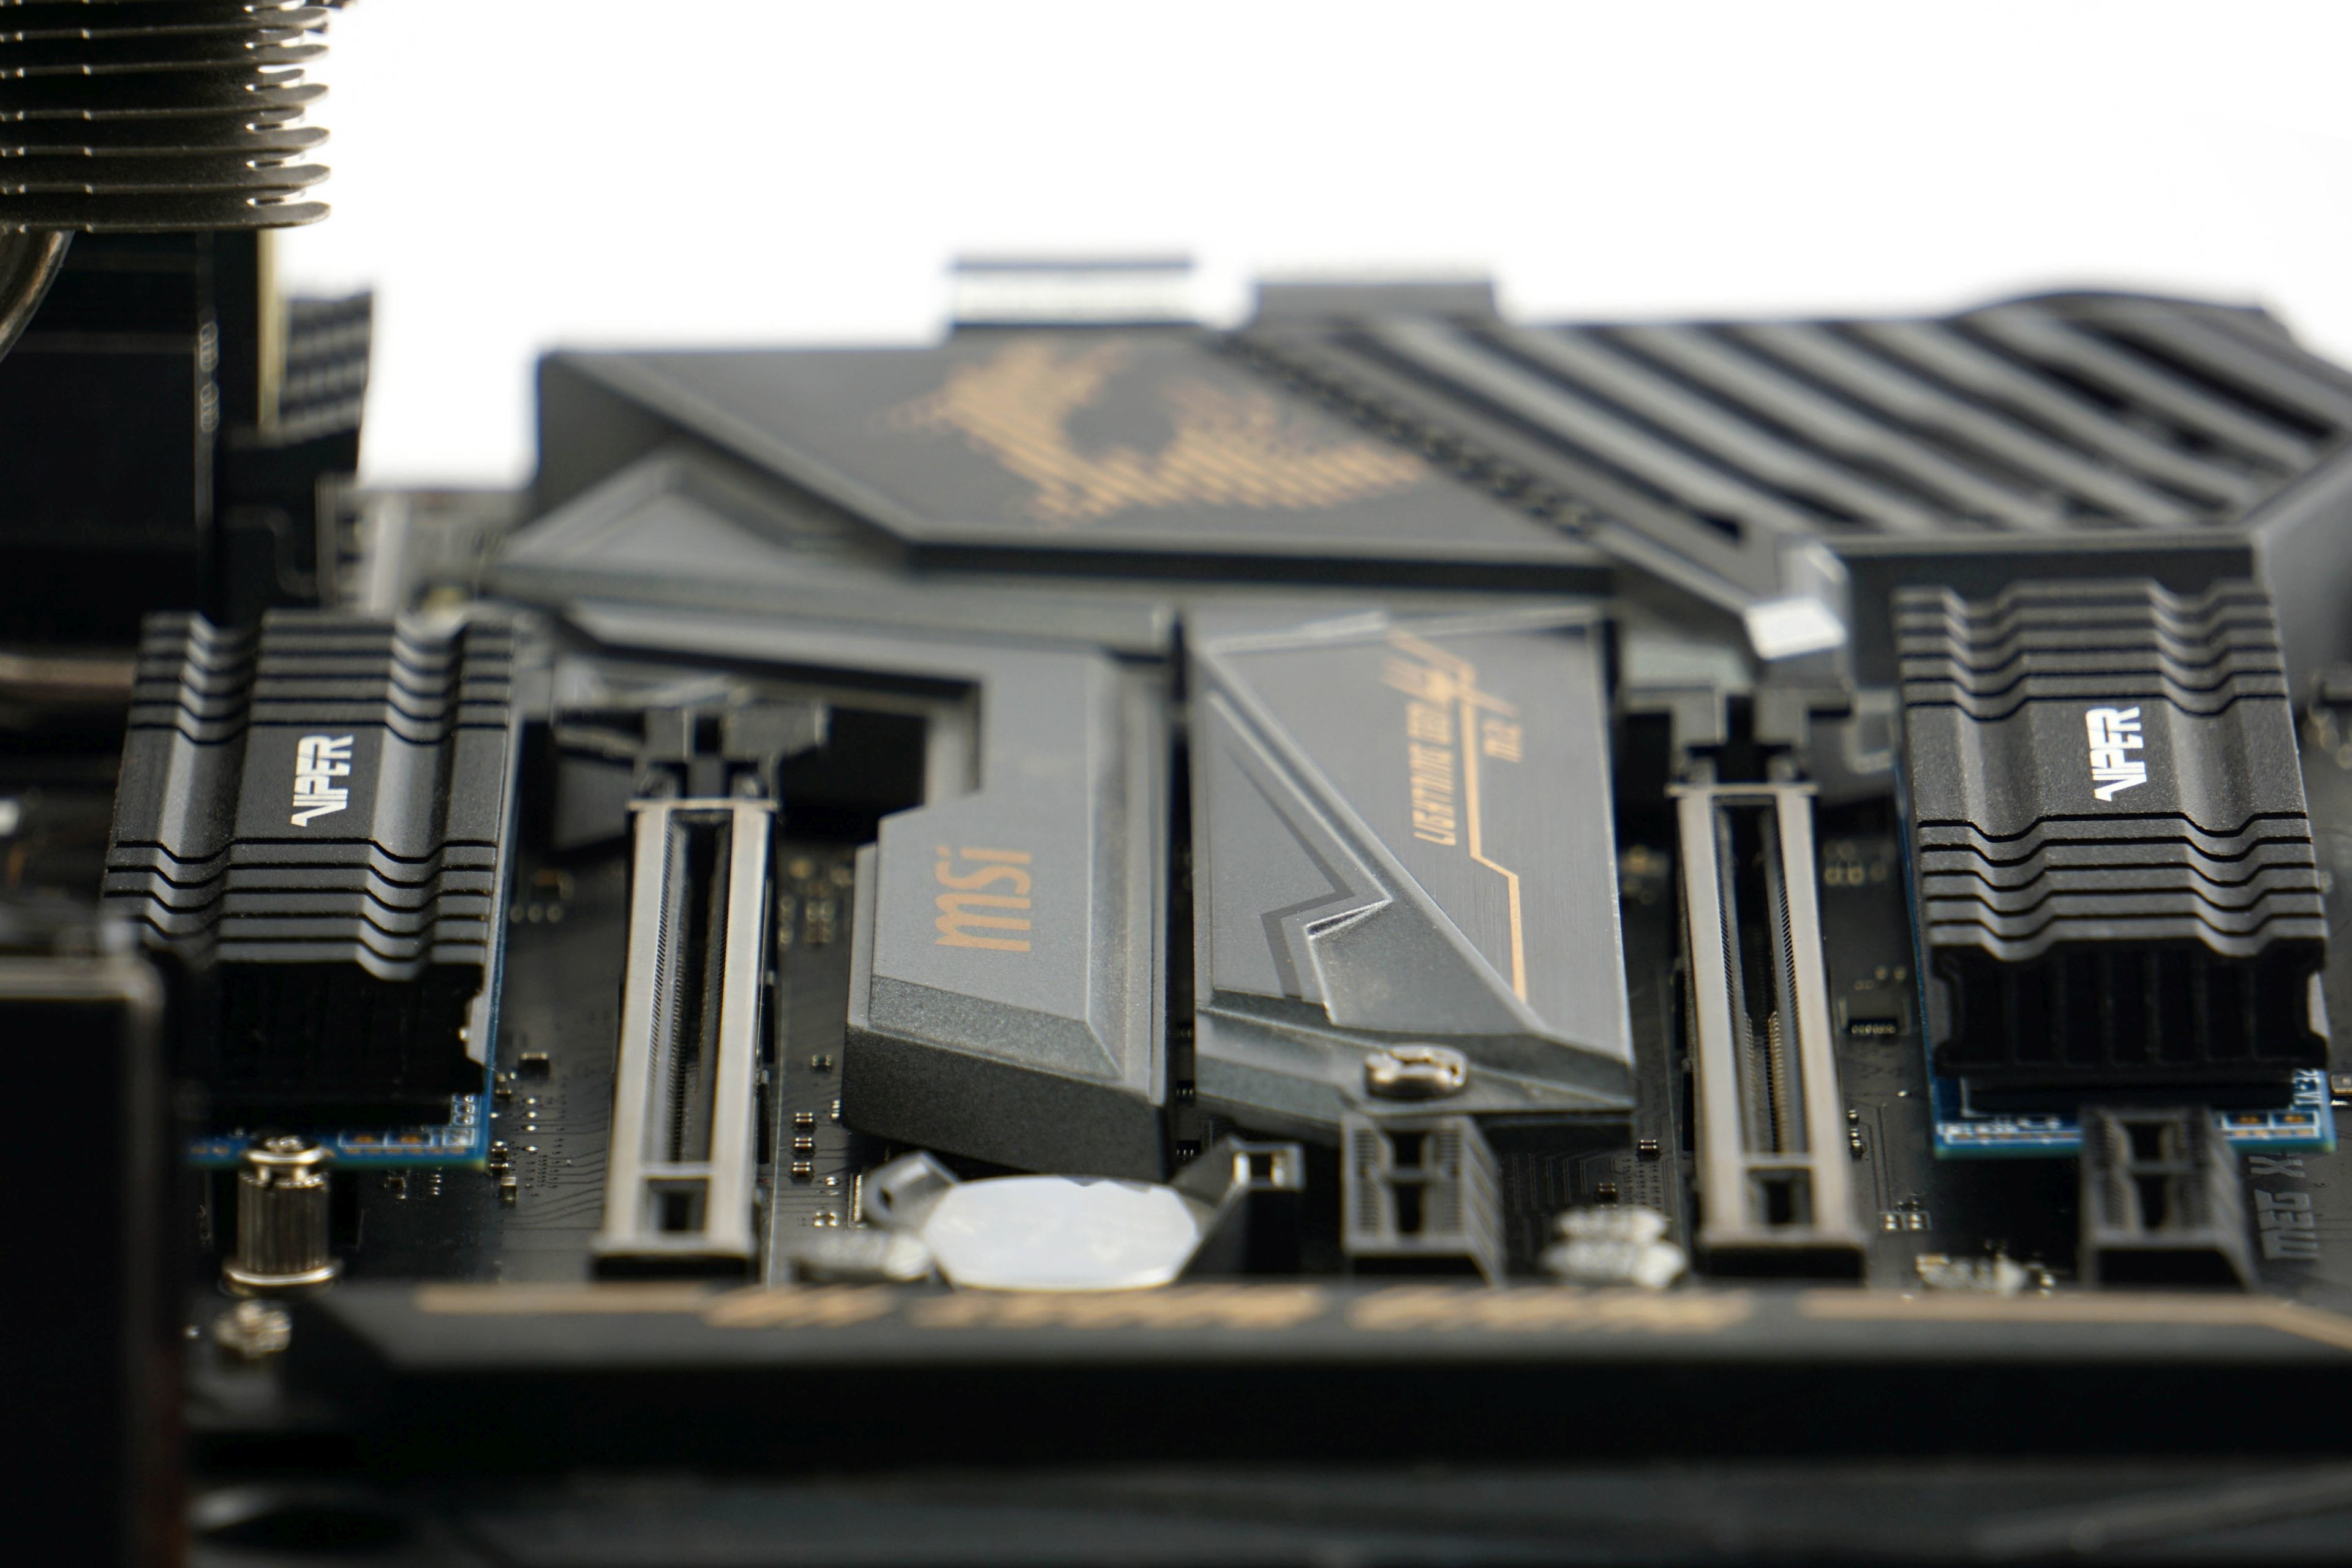
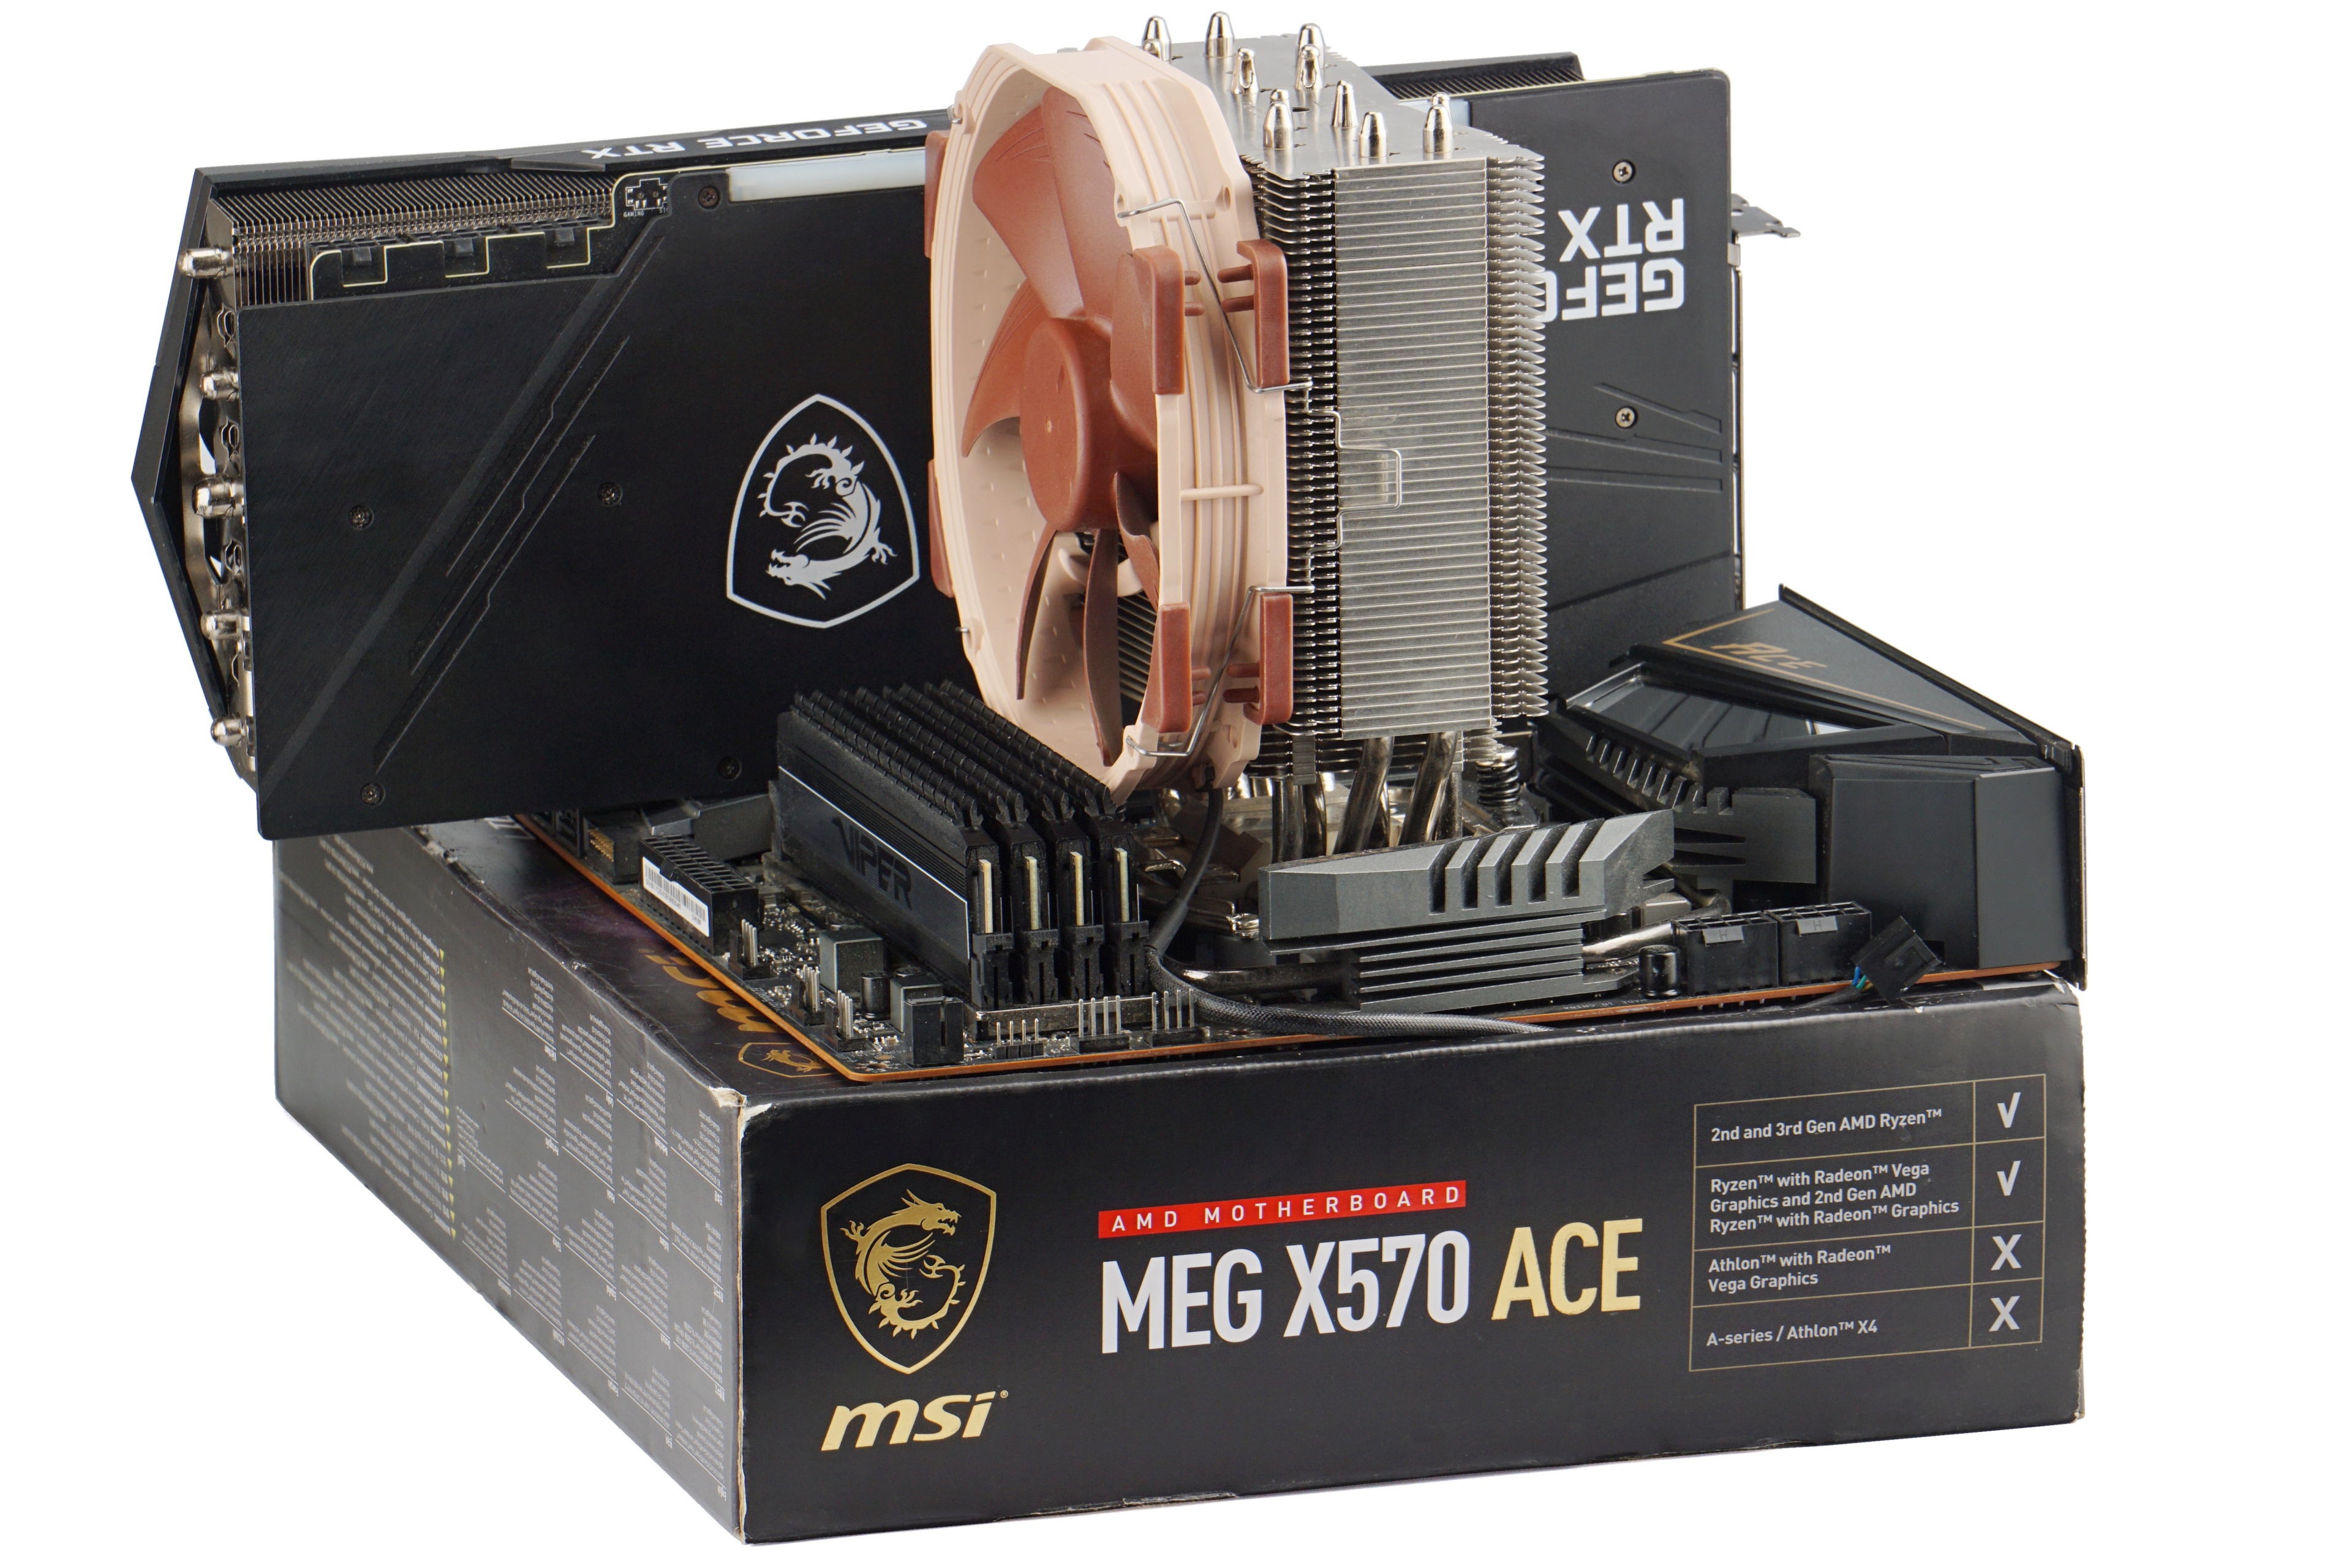
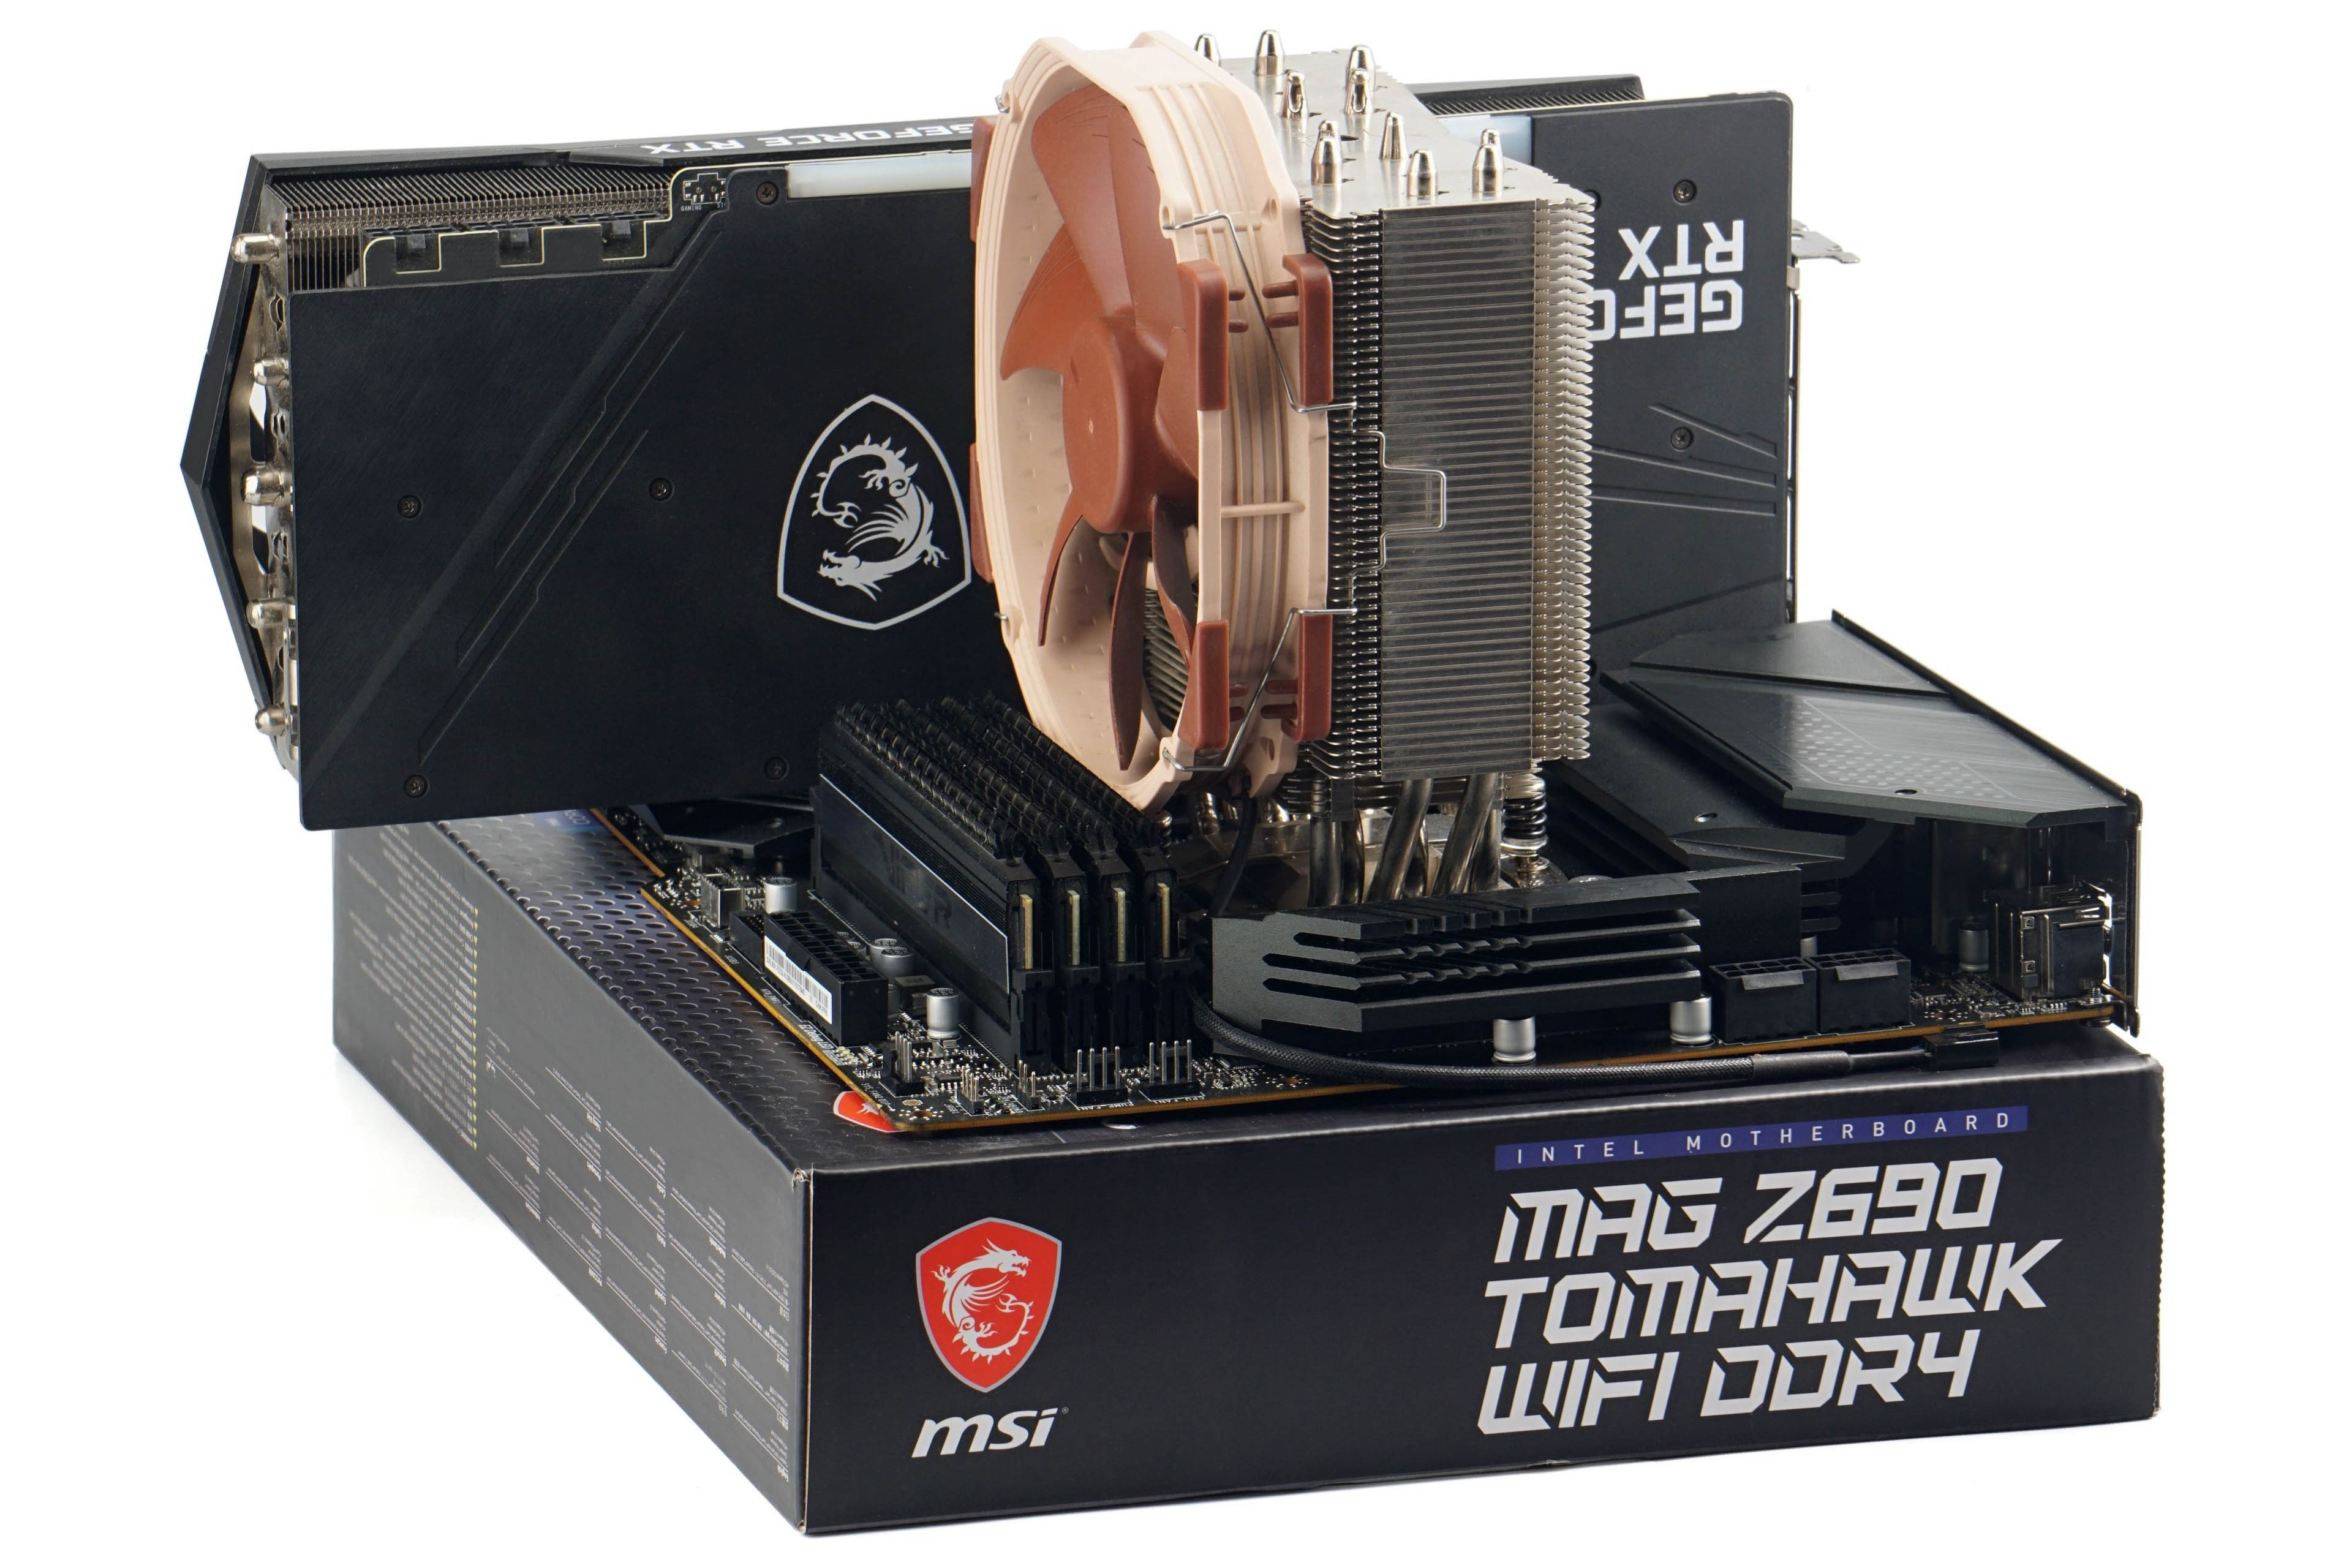
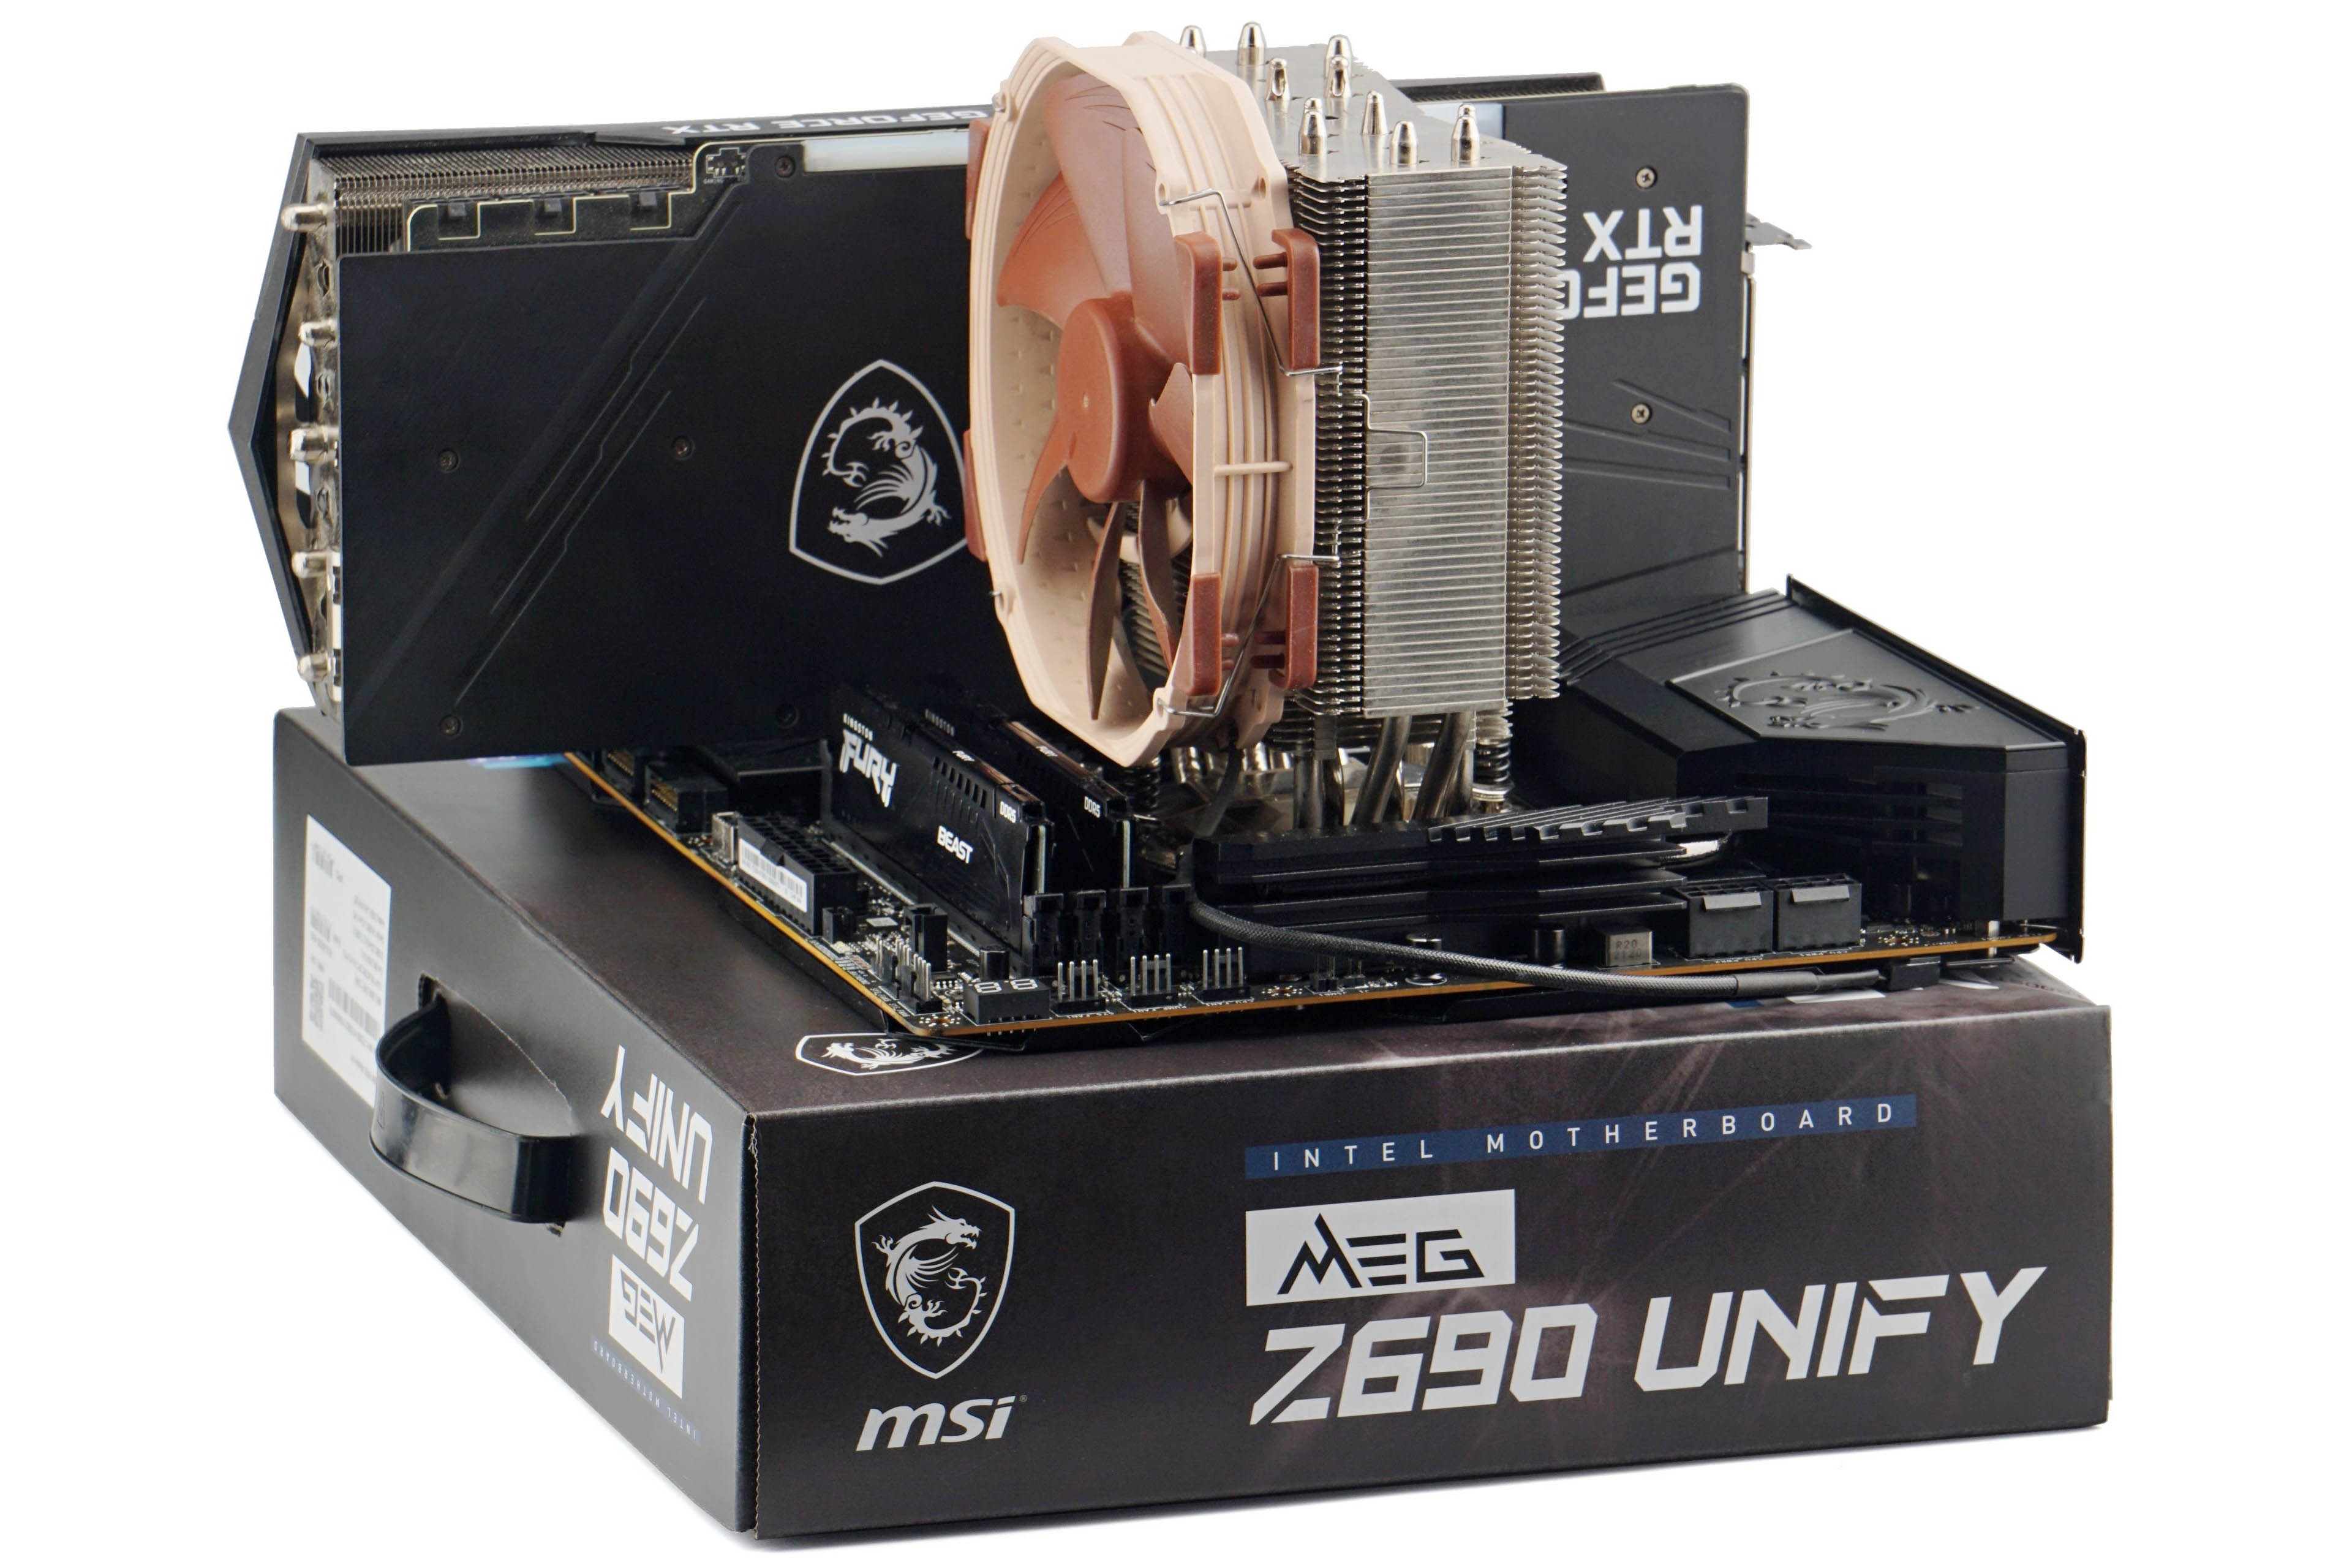
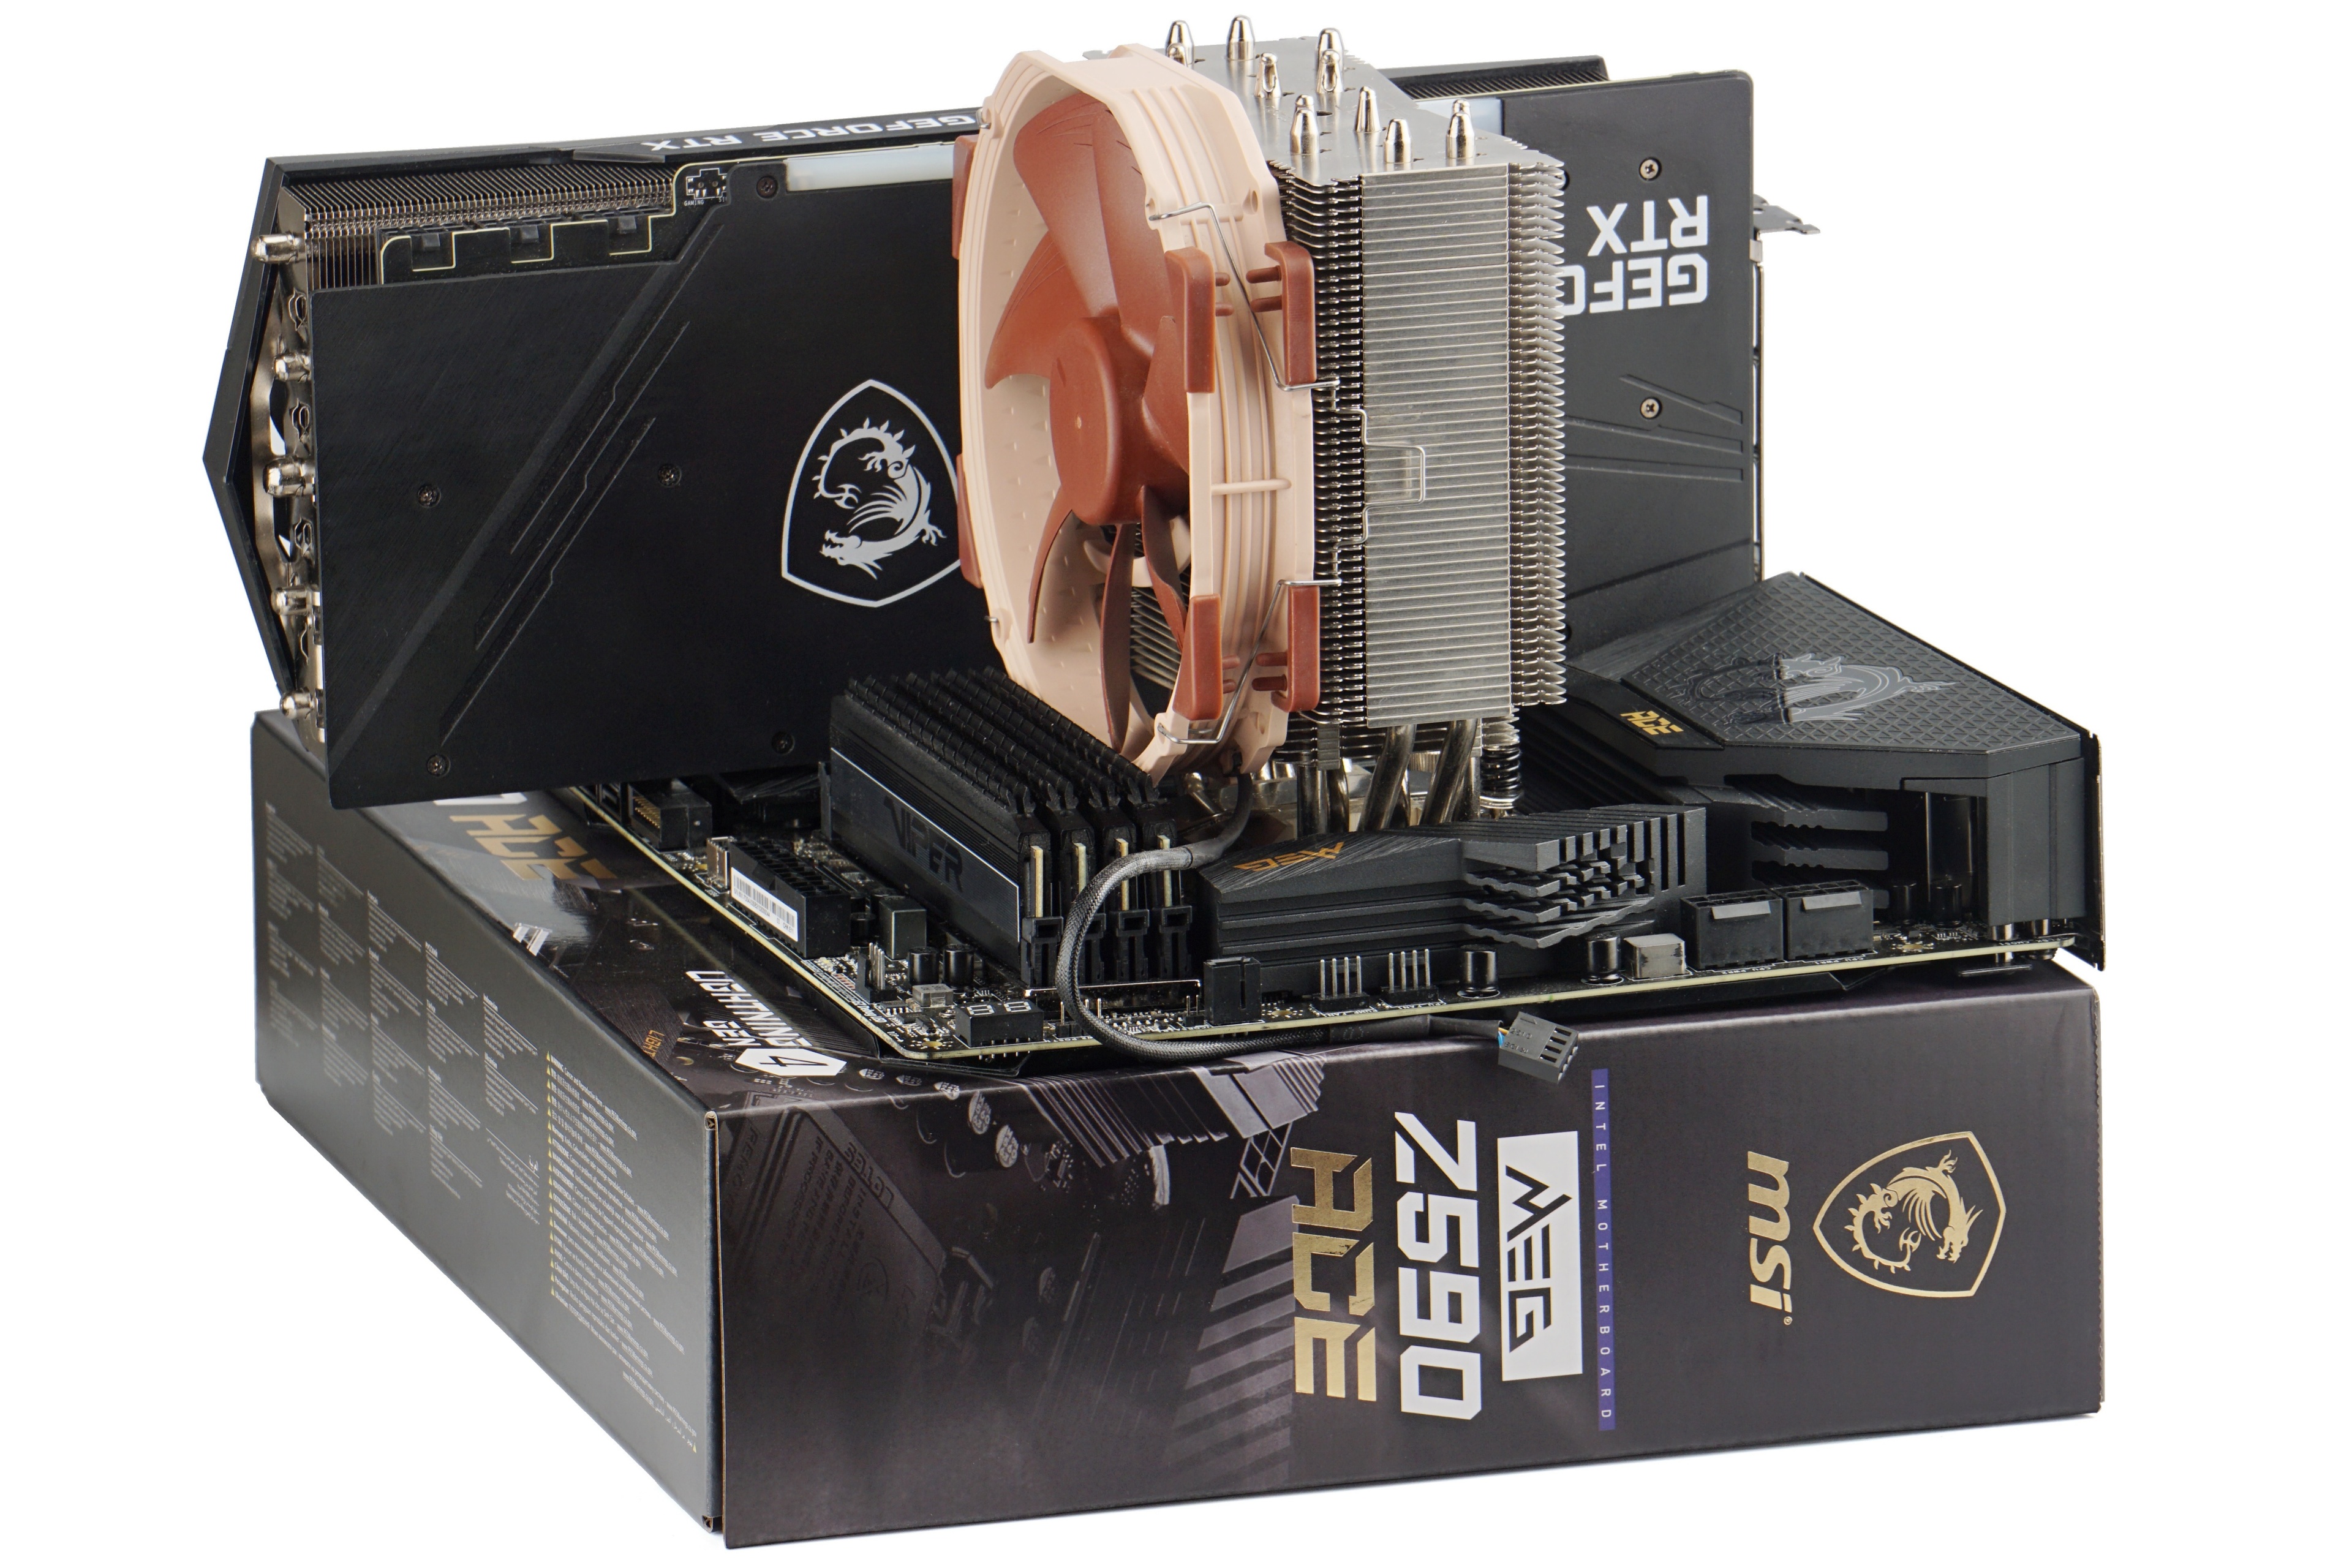
| Motherboard * | Acc. to processor: ASRock B650E Taichi, MSI MEG X670E Ace, Asus ROG Strix Z790-E Gaming WiFi, MEG X570 Ace, MEG Z690 Unify, MAG Z690 Tomahawk WiFi DDR4, Z590 Ace, MSI MEG X570 Ace alebo MSI MEG Z490 Ace |
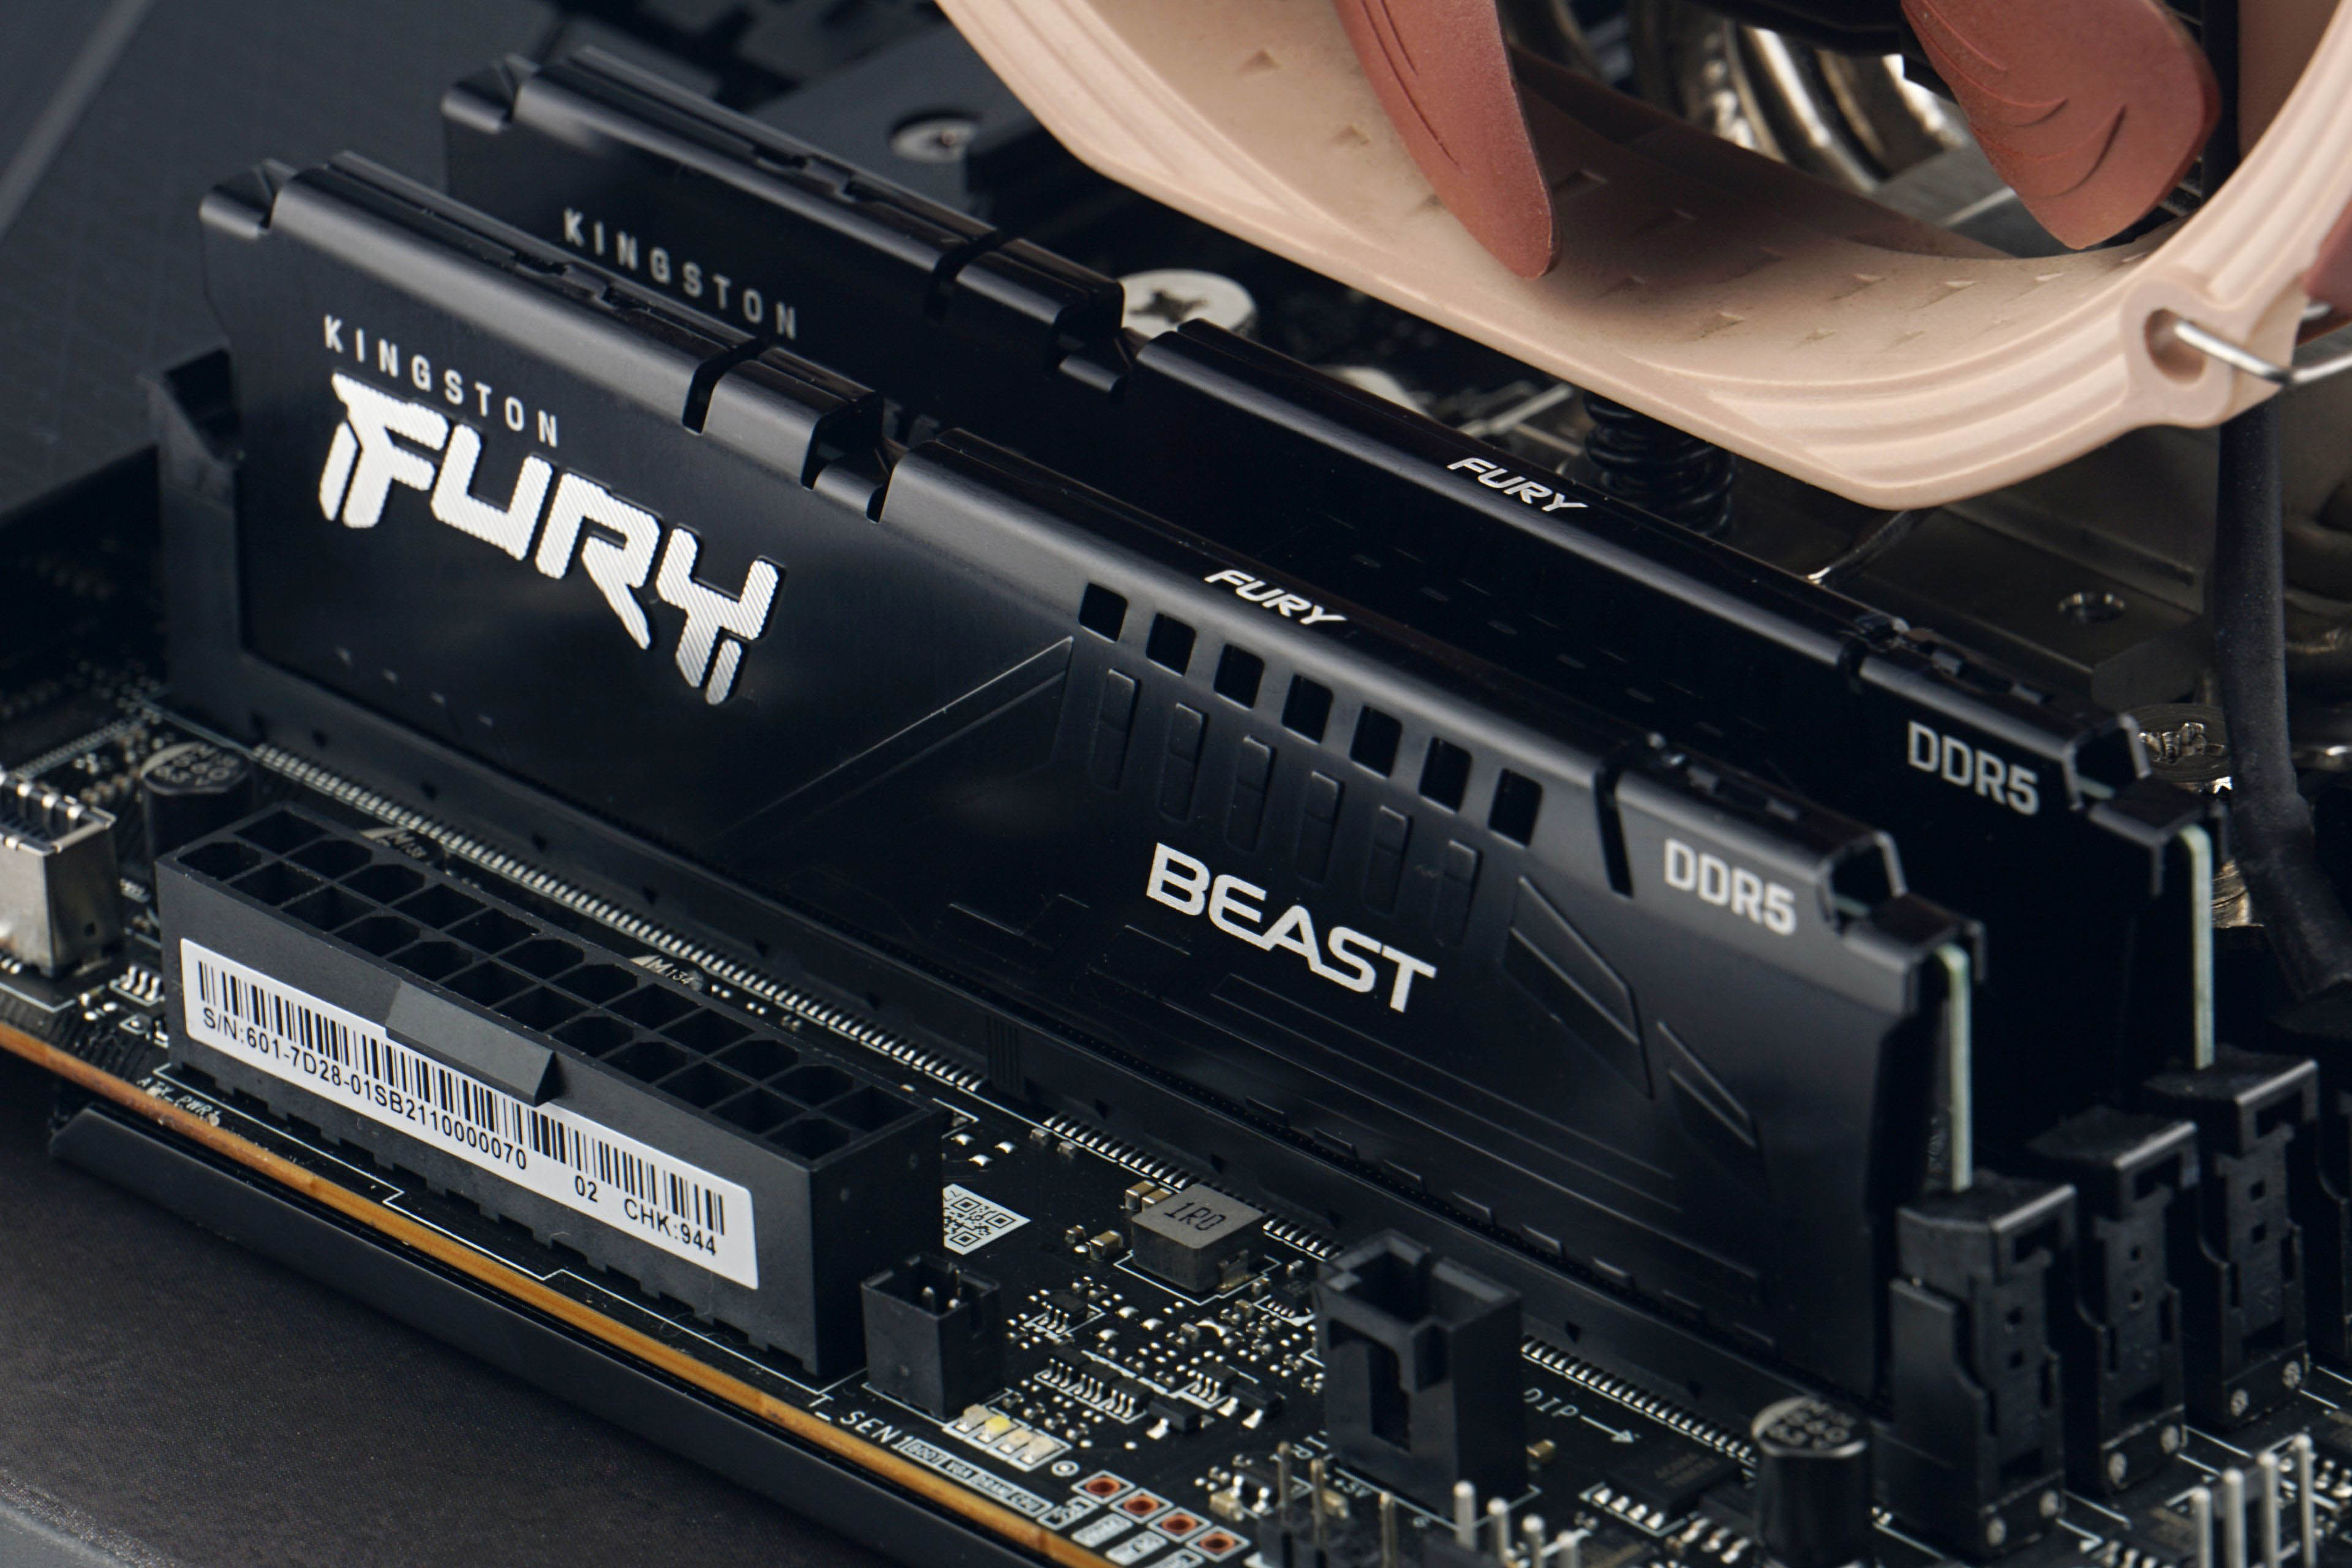
| Memory (RAM) | Acc. to platform: z DDR5 G.Skill Trident Z5 Neo (2× 16 GB, 6000 MHz/CL30) a Kingston Fury Beast (2× 16 GB, 5200 MHz/CL40) a DDR4 Patriot Blackout, (4× 8 GB, 3600 MHz/CL18) |
| Graphics card | MSI RTX 3080 Gaming X Trio w/o Resizable BAR |
| SSD | 2× Patriot Viper VPN100 (512 GB + 2 TB) |
| PSU | BeQuiet! Dark Power Pro 12 (1200 W) |
* We use the following BIOSes on motherboards. For the Asus ROG Strix Z790-E Gaming WiFi, it’s v0502, for the MSI MEG X670E Ace, it’ v1.10NPRP, for the MEG X570 Ace, it’s v1E, for the MEG Z690 Unify, it’s v10, for the MAG Z690 Tomahawk WiFi DDR4, it’s v11, for the MEG Z590 Ace, it’s v1.14 and for the MEG Z490 Ace, it’s v17.
Note: The graphics drivers we use are Nvidia GeForce 466.77 and the Windows 10 OS build is 19045 at the time of testing.
Processors of other platforms are tested on MSI MEG Z690 Unify, MAG Z490 Tomahawk WiFi DDR4, Z590 Ace and Z490 Ace motherboards, MEG Z690 Unify (all Intel) and MEG X570 Ace, MEG X670E Ace (AMD).

On platforms supporting DDR5 memory, we use two different sets of modules. For more powerful processors with an “X” (AMD) or “K” (Intel) in the name, we use the faster G.Skill Trident Z5 Neo memory (2×16 GB, 6000 MHz/CL30). In the case of cheaper processors (without X or K at the end of the name), the slower Kingston Fury Beast modules (2×16 GB, 5200 MHz/CL40). But this is more or less just symbolic, the bandwidth is very high for both kits, it is not a bottleneck, and the difference in processor performance is very small, practically negligible, across the differently fast memory kits.
For completeness of Intel Core i5-14400F processor tests we add the results of its second stepping. We’ve already tested the B0 variant, now it’s time for the C0. Its availability in stores is, at least at the moment, considerably worse and the question arises whether it is worth it at all. Is there any point in aiming for stepping C0 or is B0 also “okay”? Or does it “not matter” (what you get in the shopping lottery)?
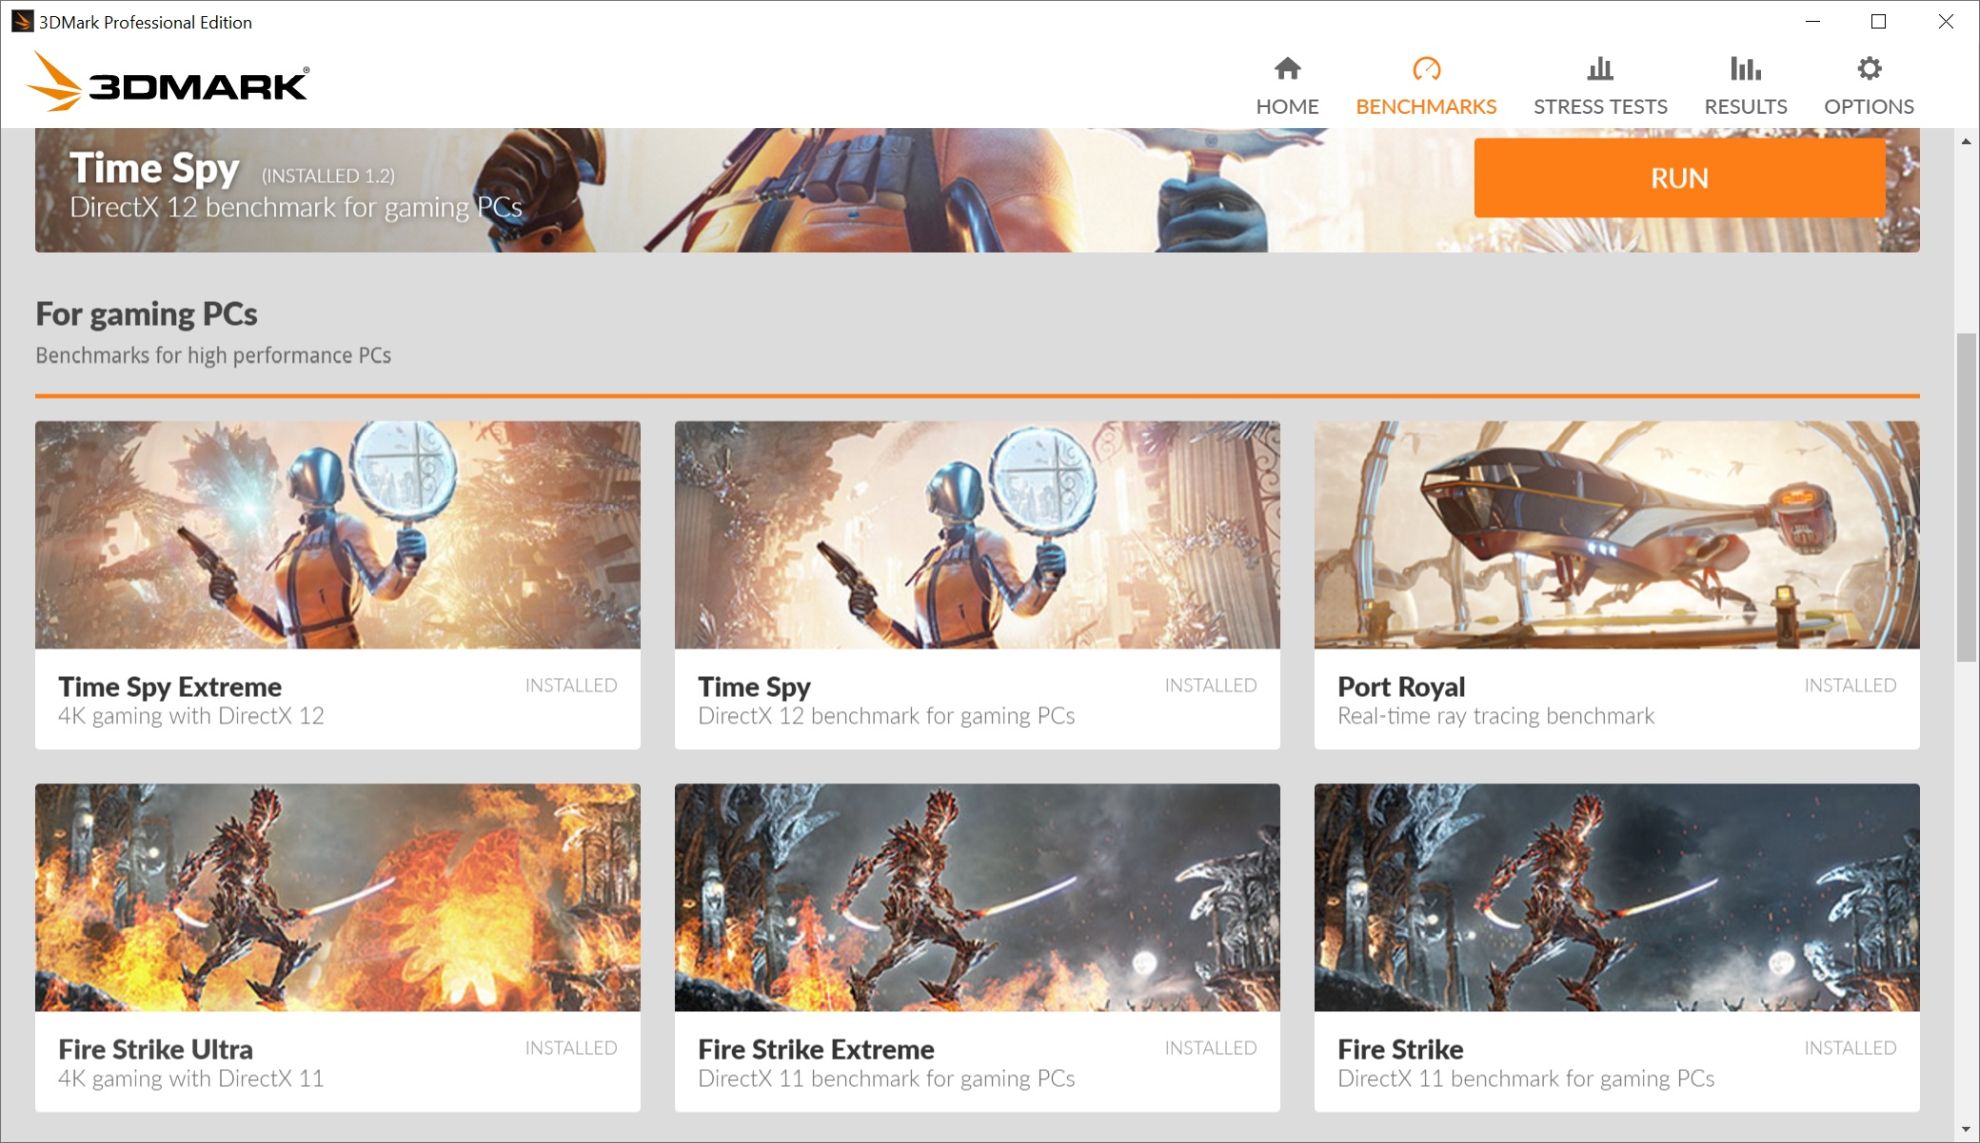
3DMark
We use 3DMark Professional for the tests and the following tests: Night Raid (DirectX 12), Fire Strike (DirectX 11) and Time Spy (DirectX 12). In the graphs you will find partial CPU scores, combined scores, but also graphics scores. You can find out to what extent the given processor limits the graphics card.

For completeness of Intel Core i5-14400F processor tests we add the results of its second stepping. We’ve already tested the B0 variant, now it’s time for the C0. Its availability in stores is, at least at the moment, considerably worse and the question arises whether it is worth it at all. Is there any point in aiming for stepping C0 or is B0 also “okay”? Or does it “not matter” (what you get in the shopping lottery)?
Assassin’s Creed: Valhalla

Test environment: resolution 1280 × 720 px; graphics settings preset Low; API DirectX 12; no extra settings; test scene: built-in benchmark.

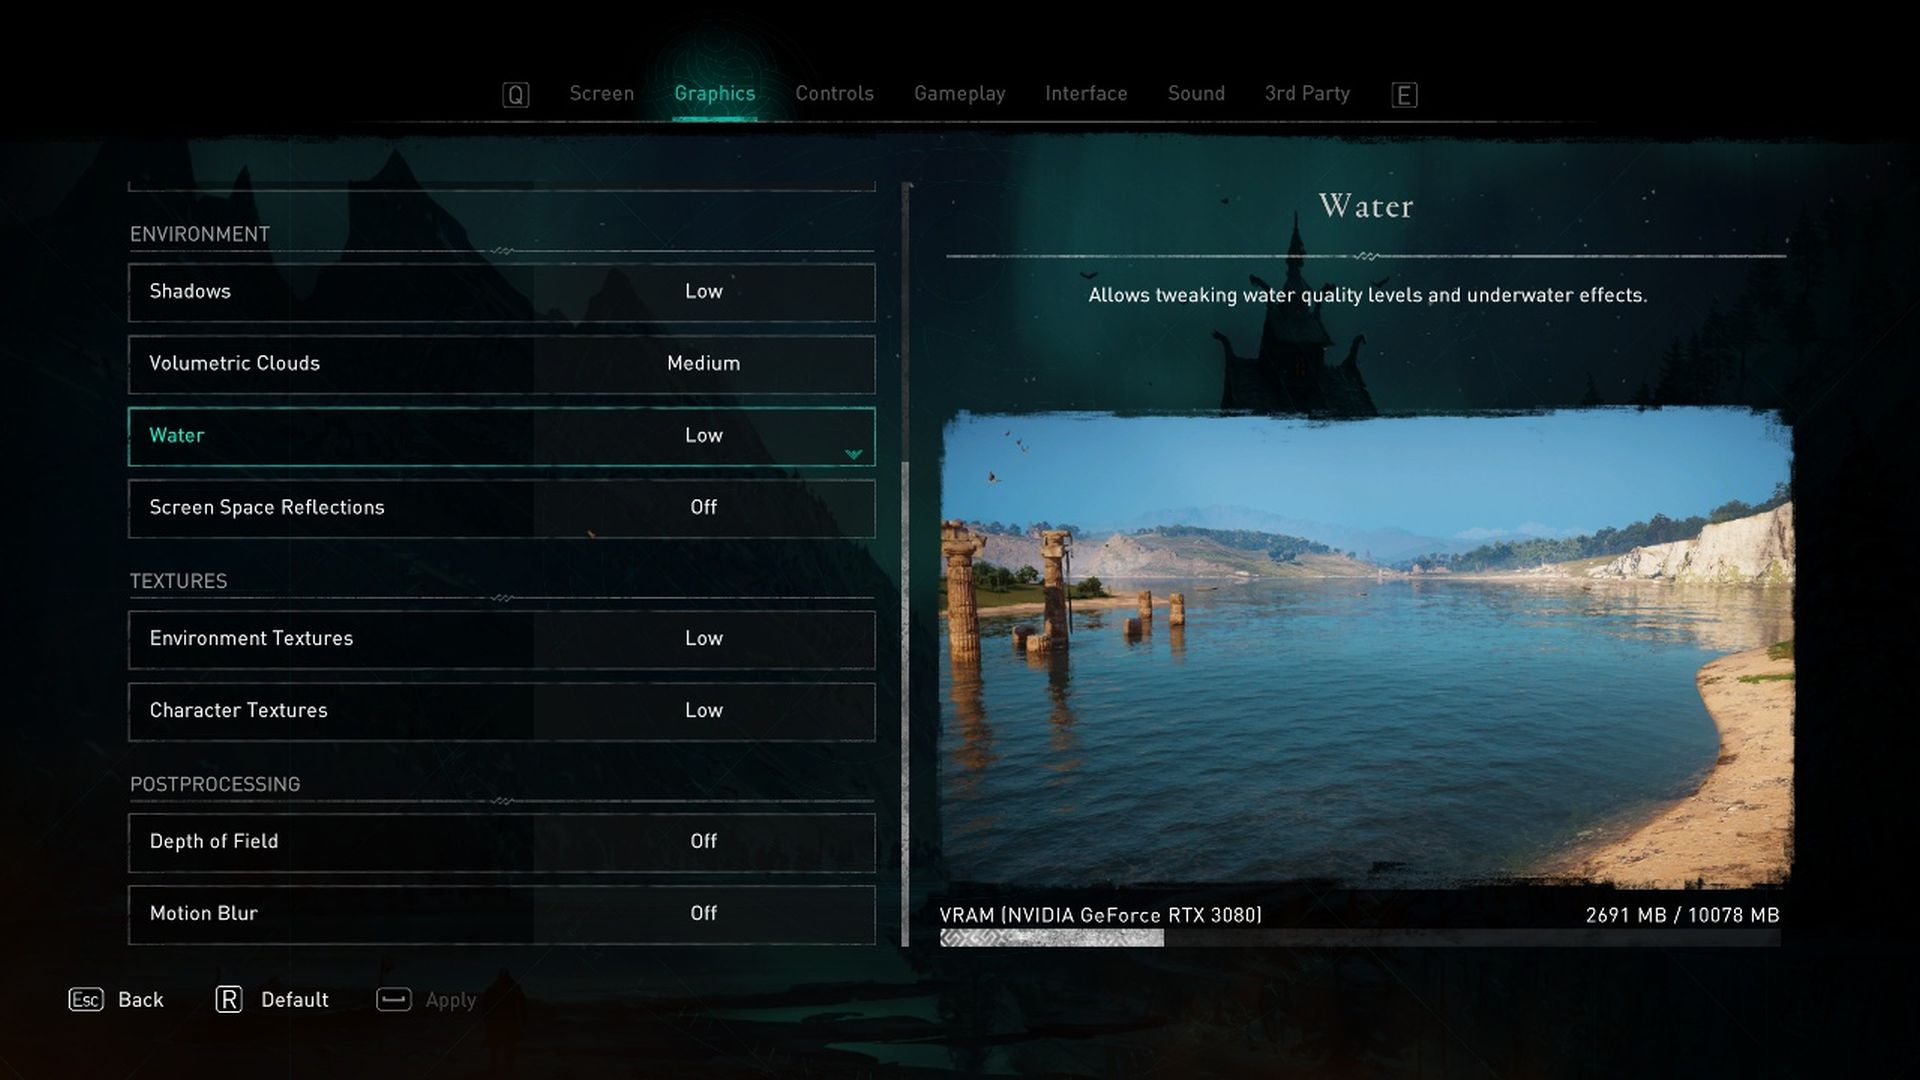
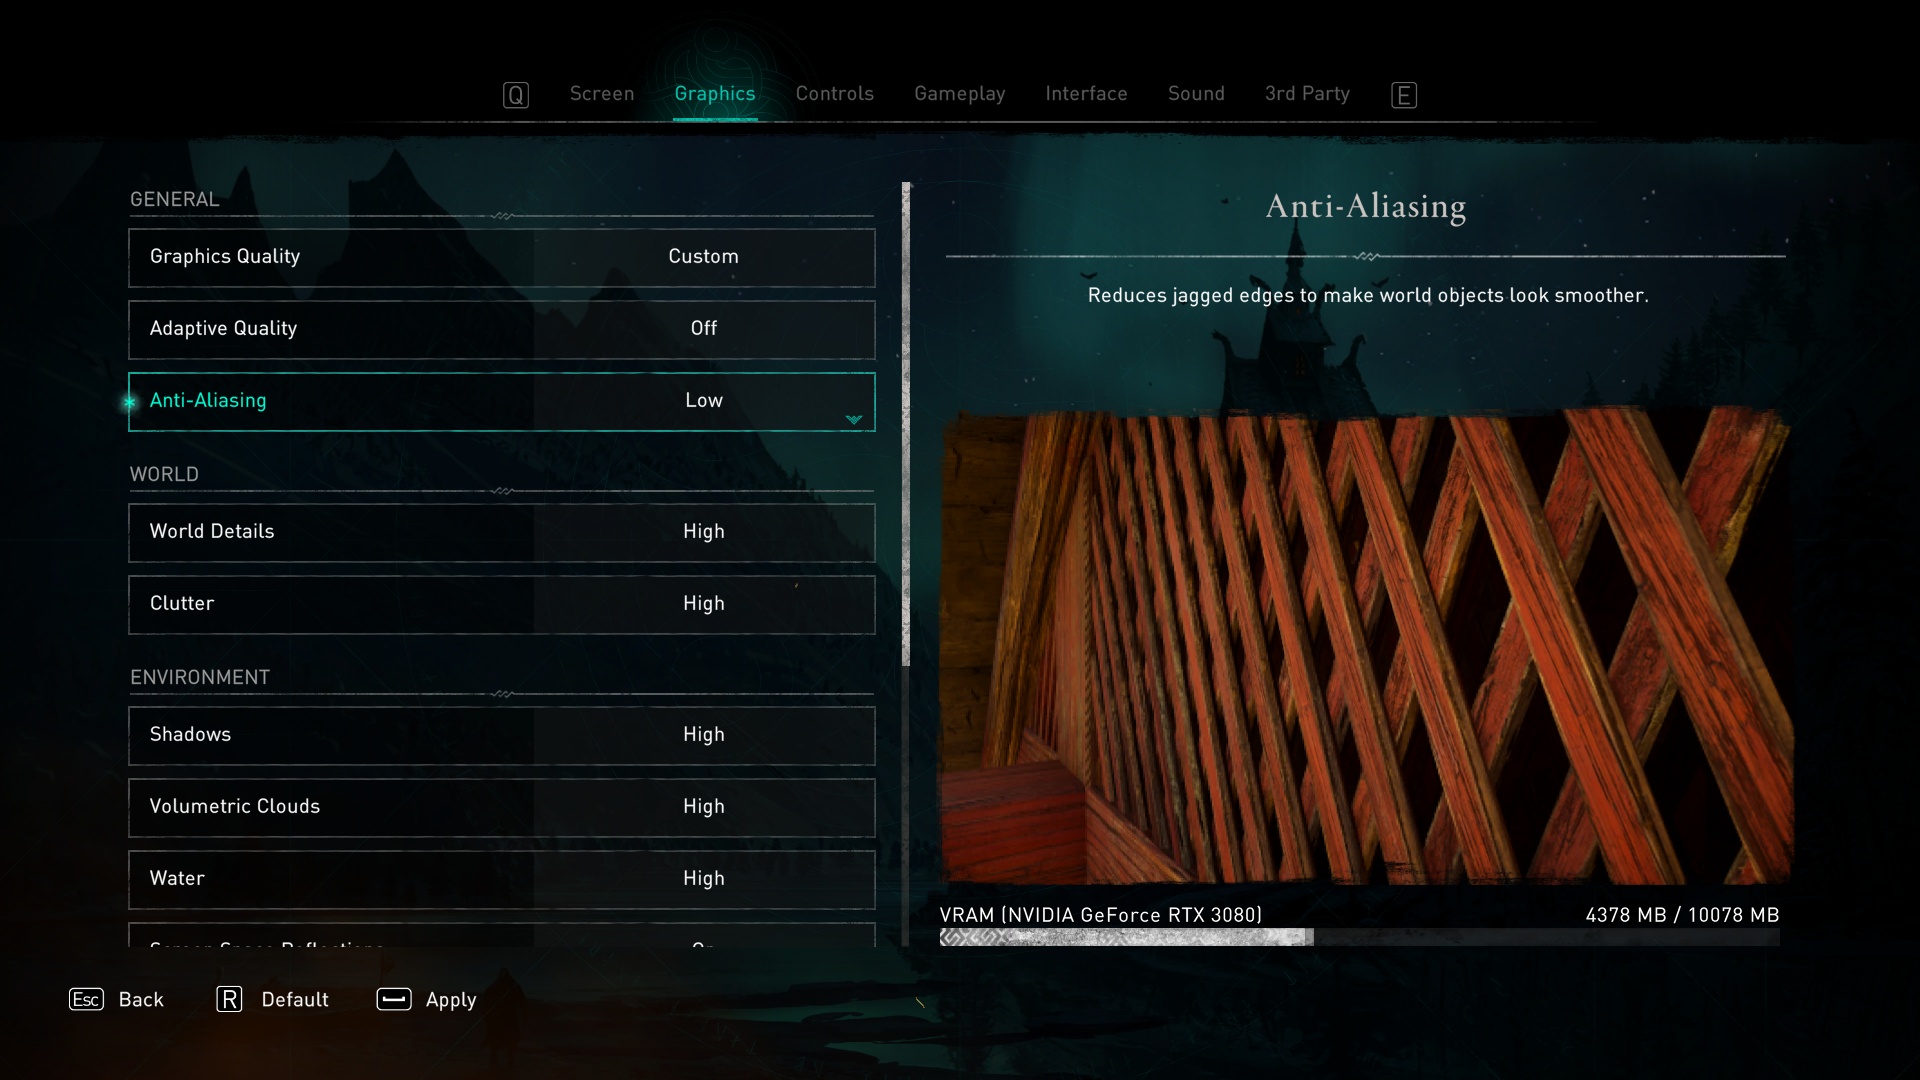
Test environment: resolution 1920 × 1080 px; graphics settings preset Low; API DirectX 12; extra settings Anti-Aliasing: low; test scene: built-in benchmark.
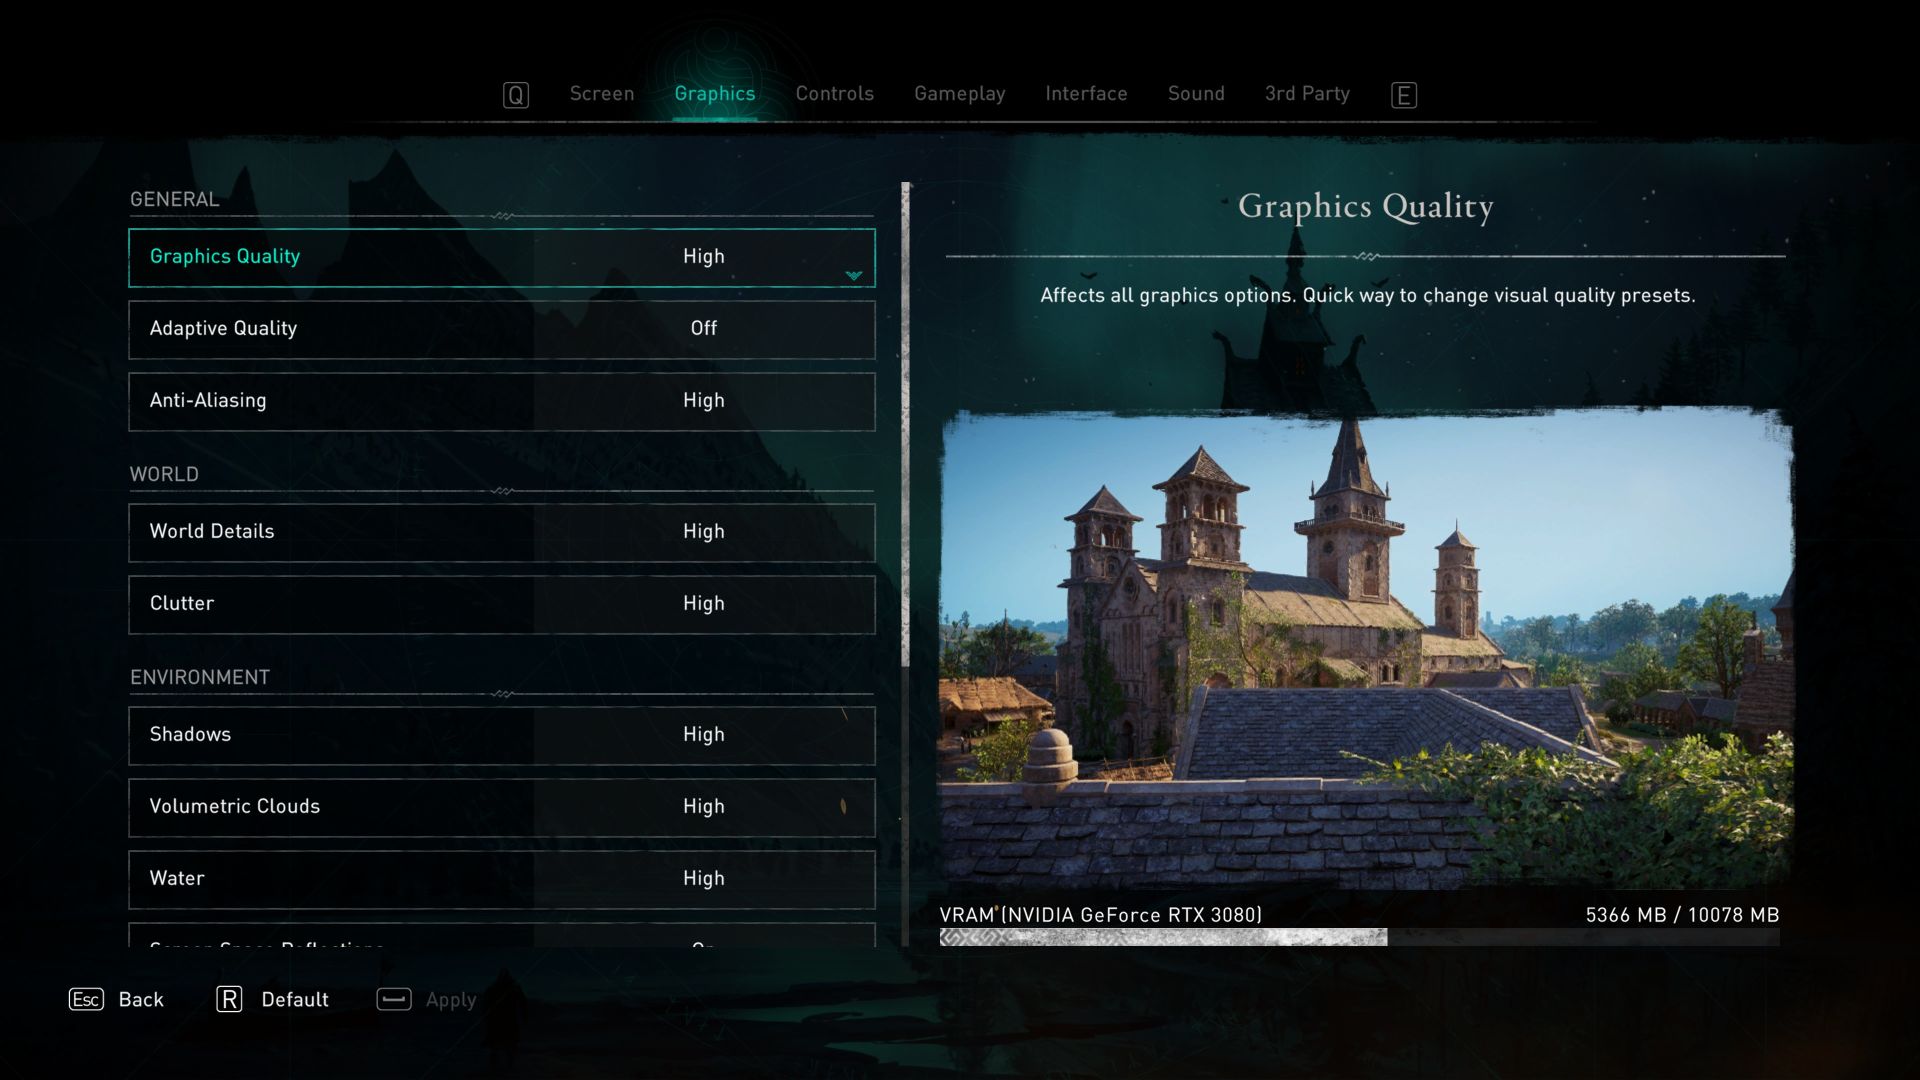
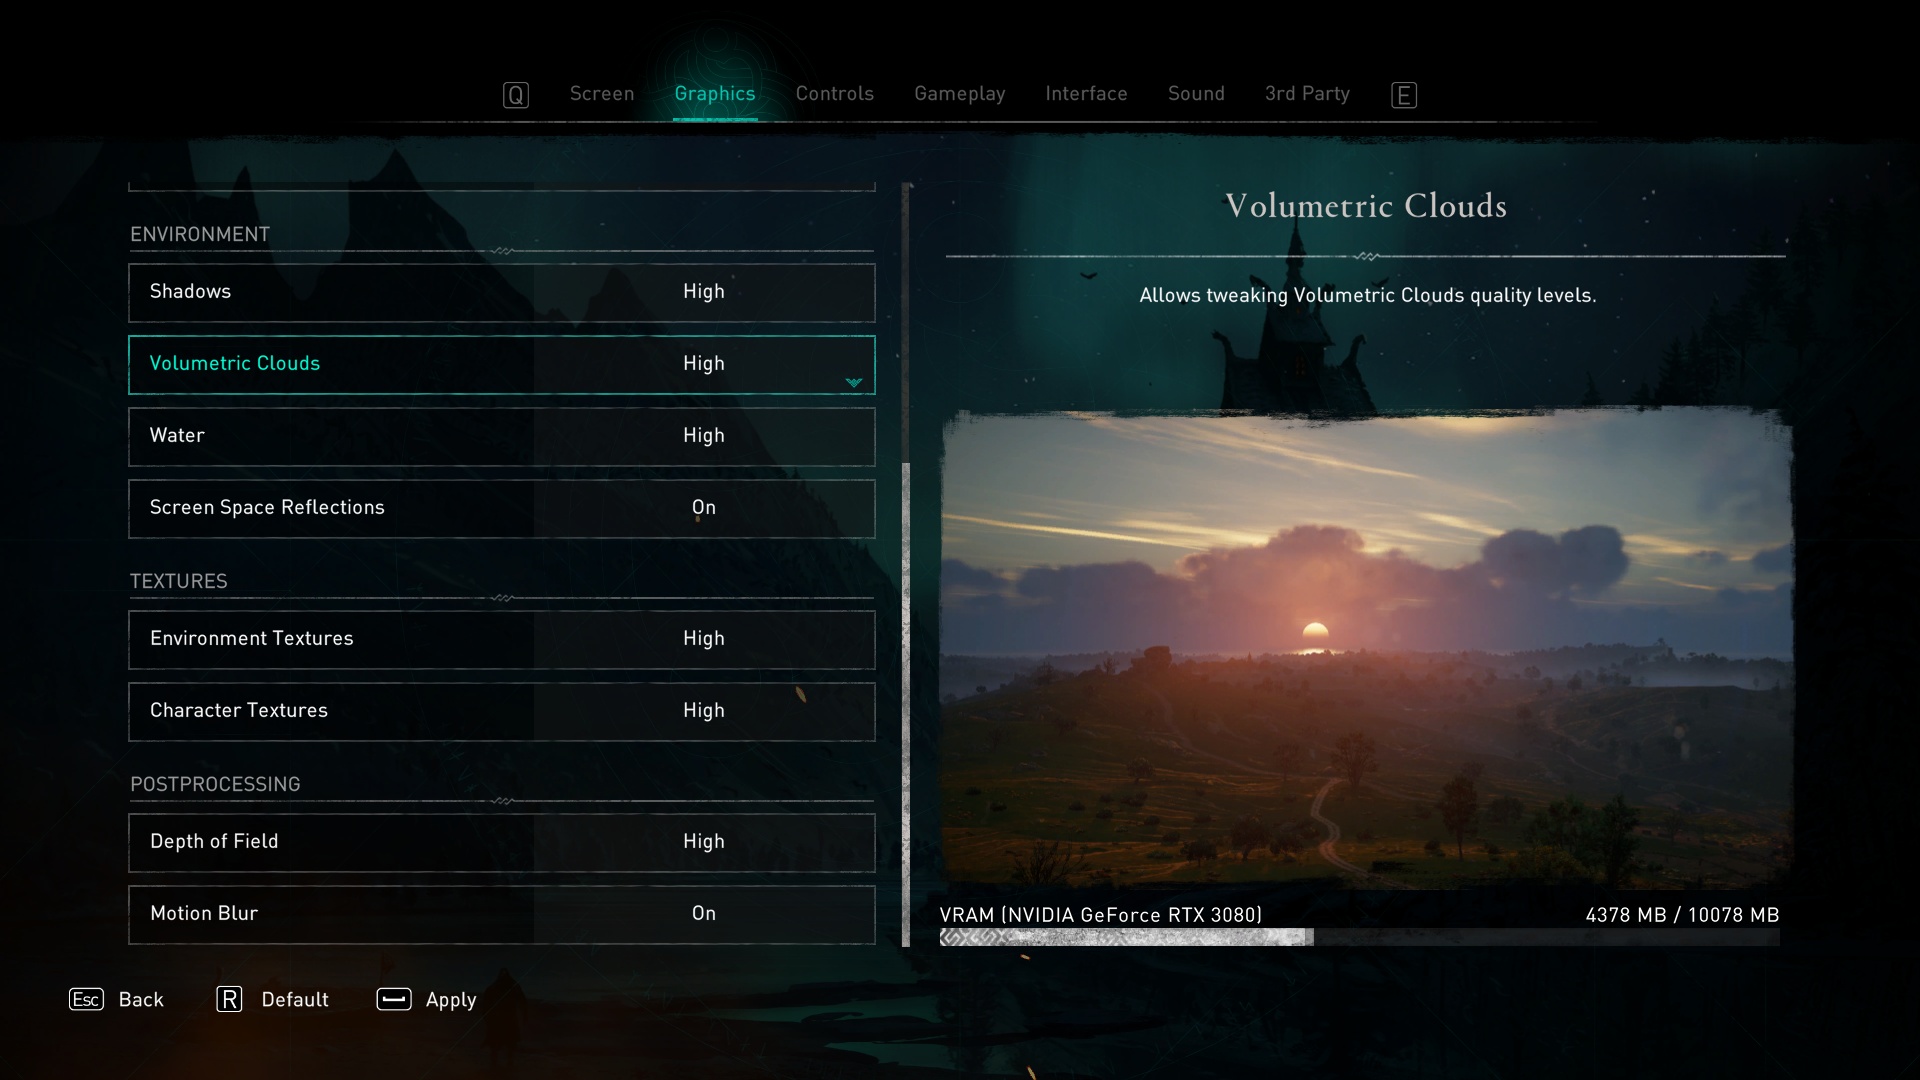
Test environment: resolution 2560 × 1440 px; graphics settings preset High; API DirectX 12; no extra settings; test scene: built-in benchmark.
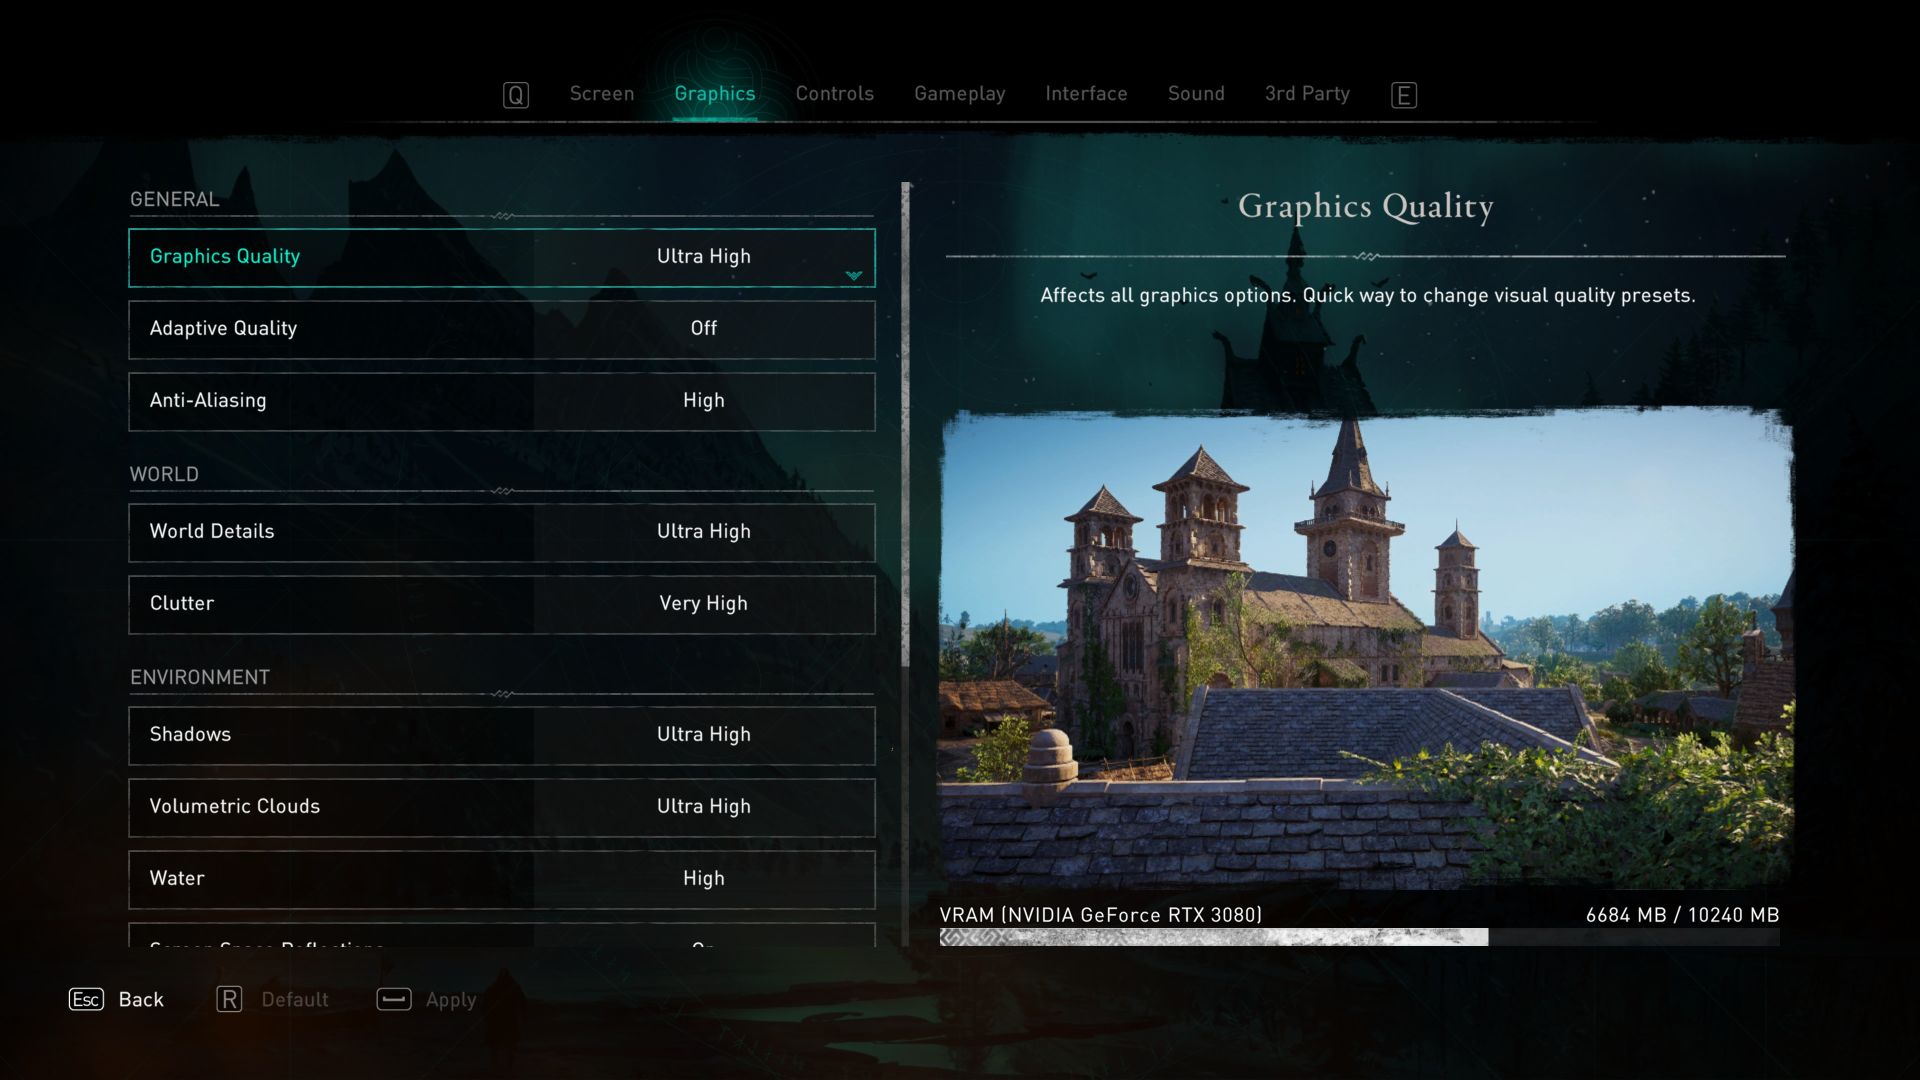
Test environment: resolution 3840 × 2160 px; graphics settings preset Ultra High; API DirectX 12; no extra settings; test scene: built-in benchmark.

For completeness of Intel Core i5-14400F processor tests we add the results of its second stepping. We’ve already tested the B0 variant, now it’s time for the C0. Its availability in stores is, at least at the moment, considerably worse and the question arises whether it is worth it at all. Is there any point in aiming for stepping C0 or is B0 also “okay”? Or does it “not matter” (what you get in the shopping lottery)?
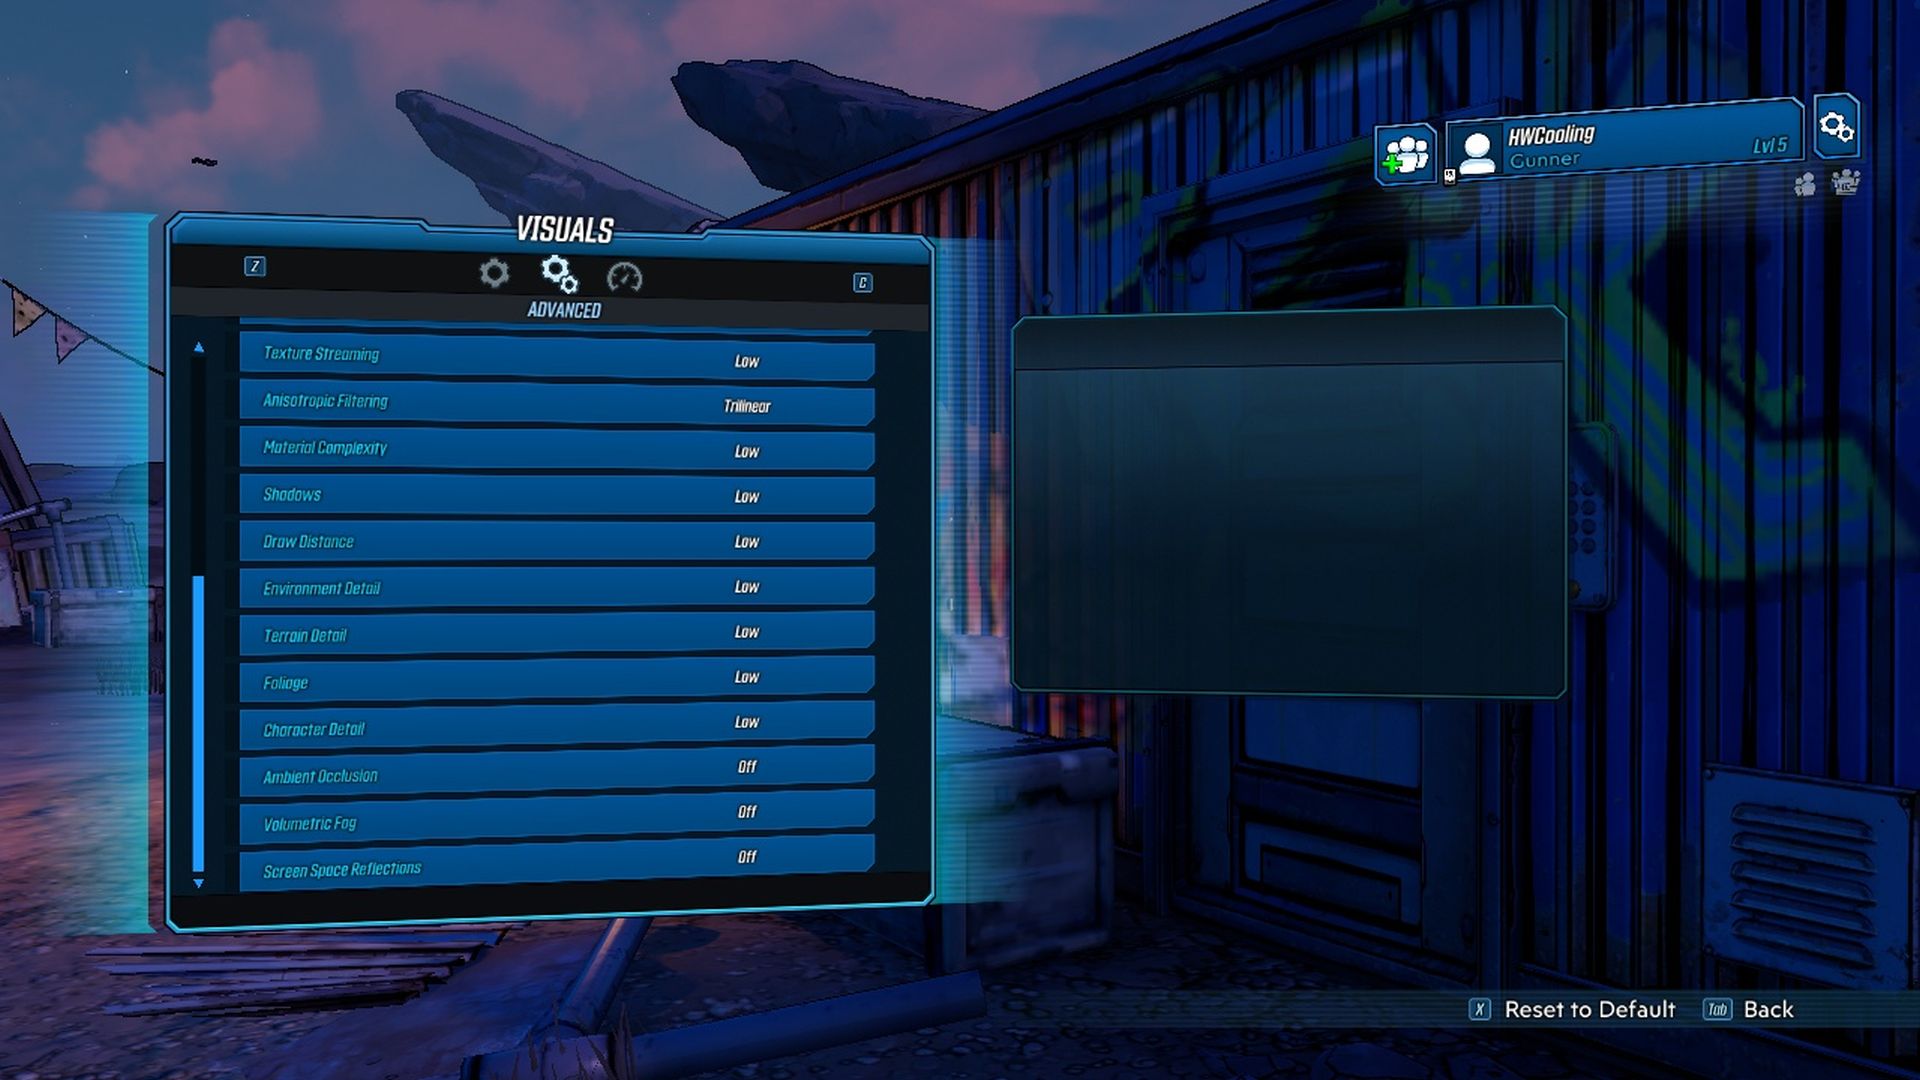
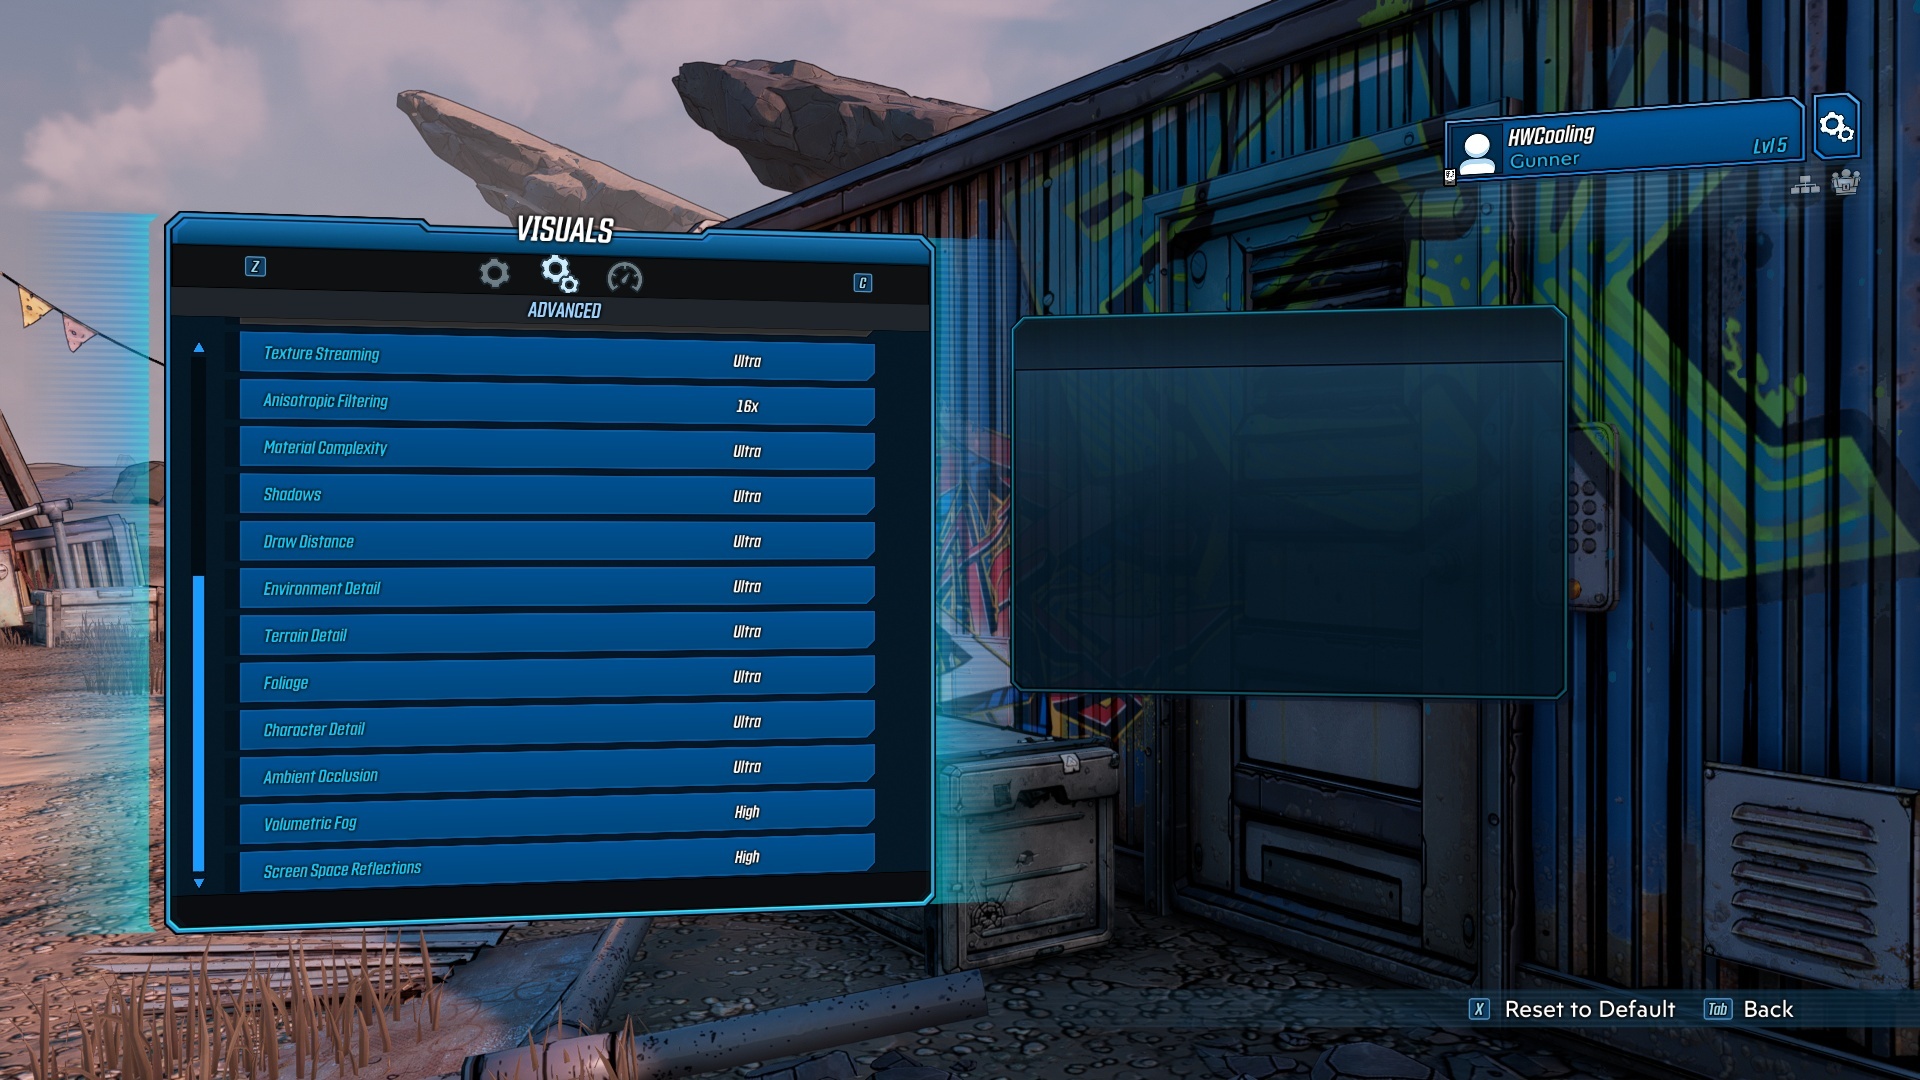
Borderlands 3

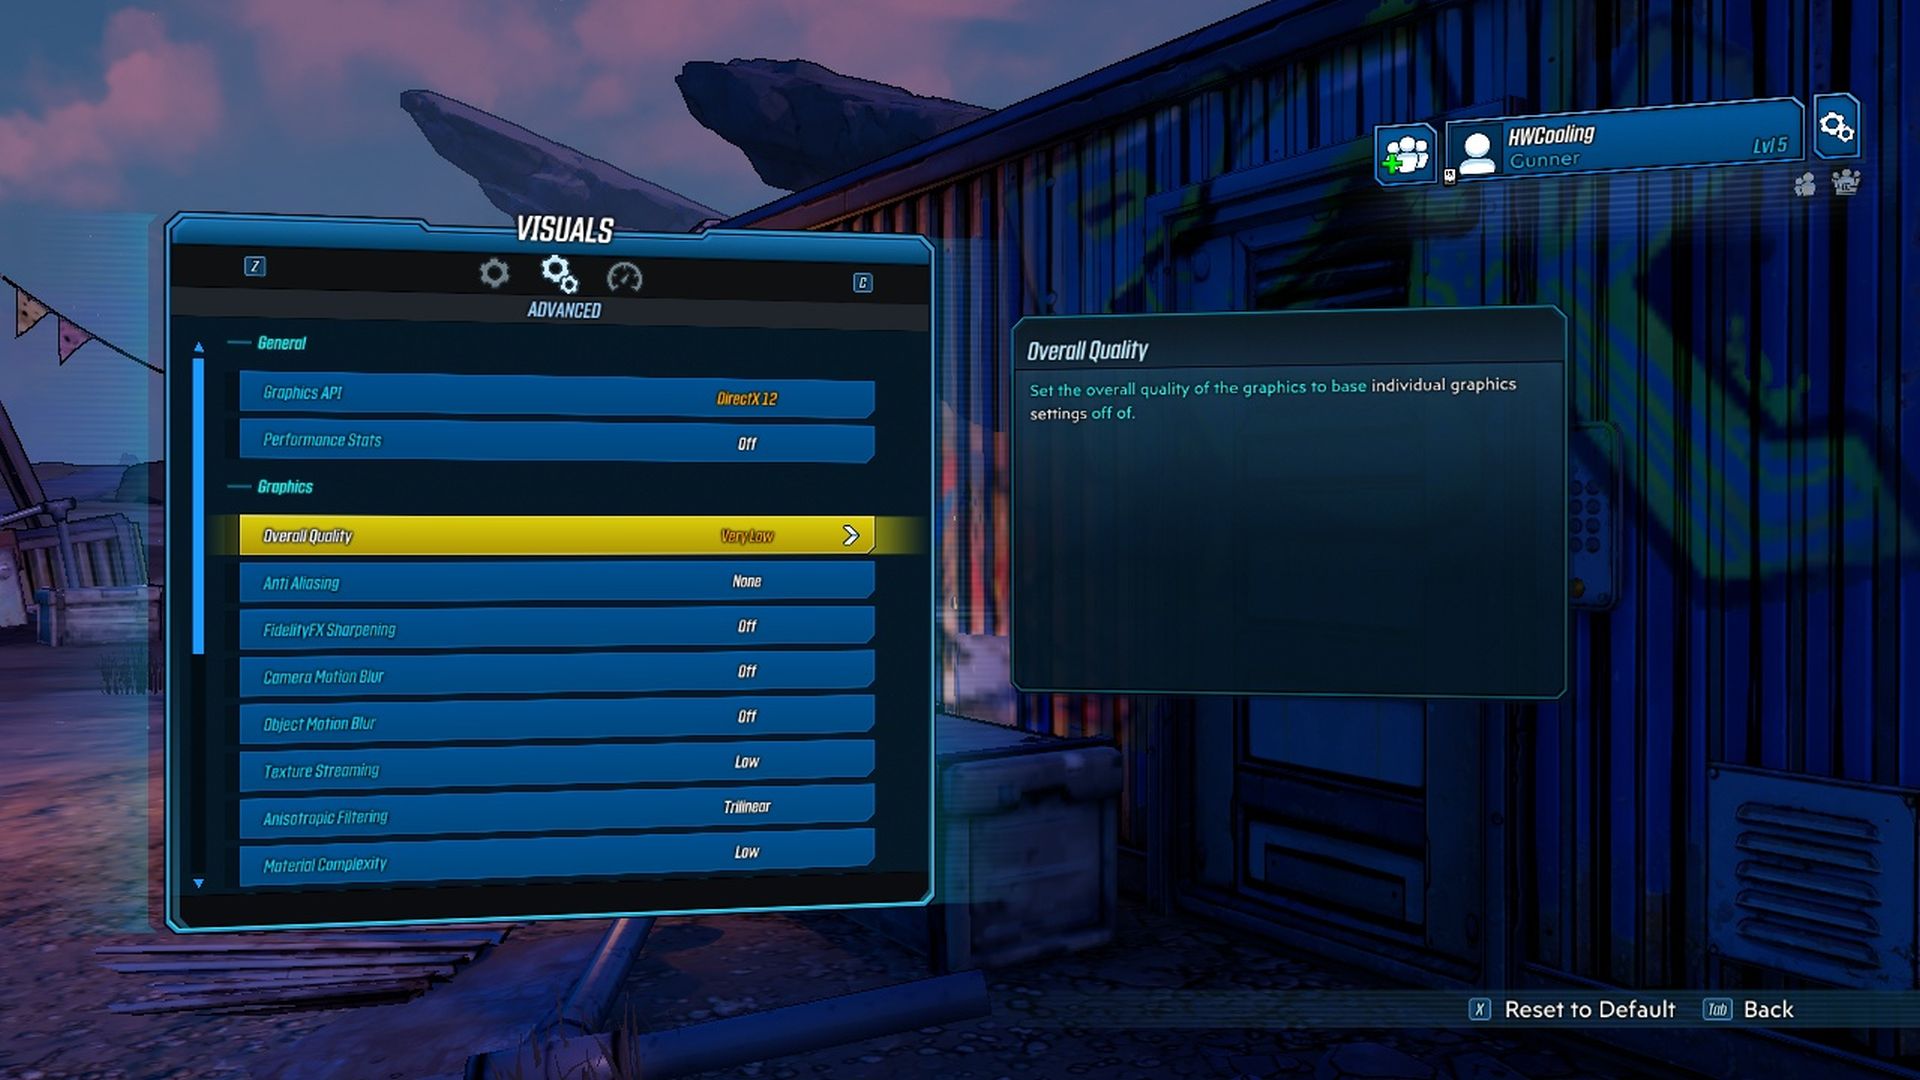
Test environment: resolution 1280 × 720 px; graphics settings preset Very Low; API DirectX 12; no extra settings; test scene: built-in benchmark.
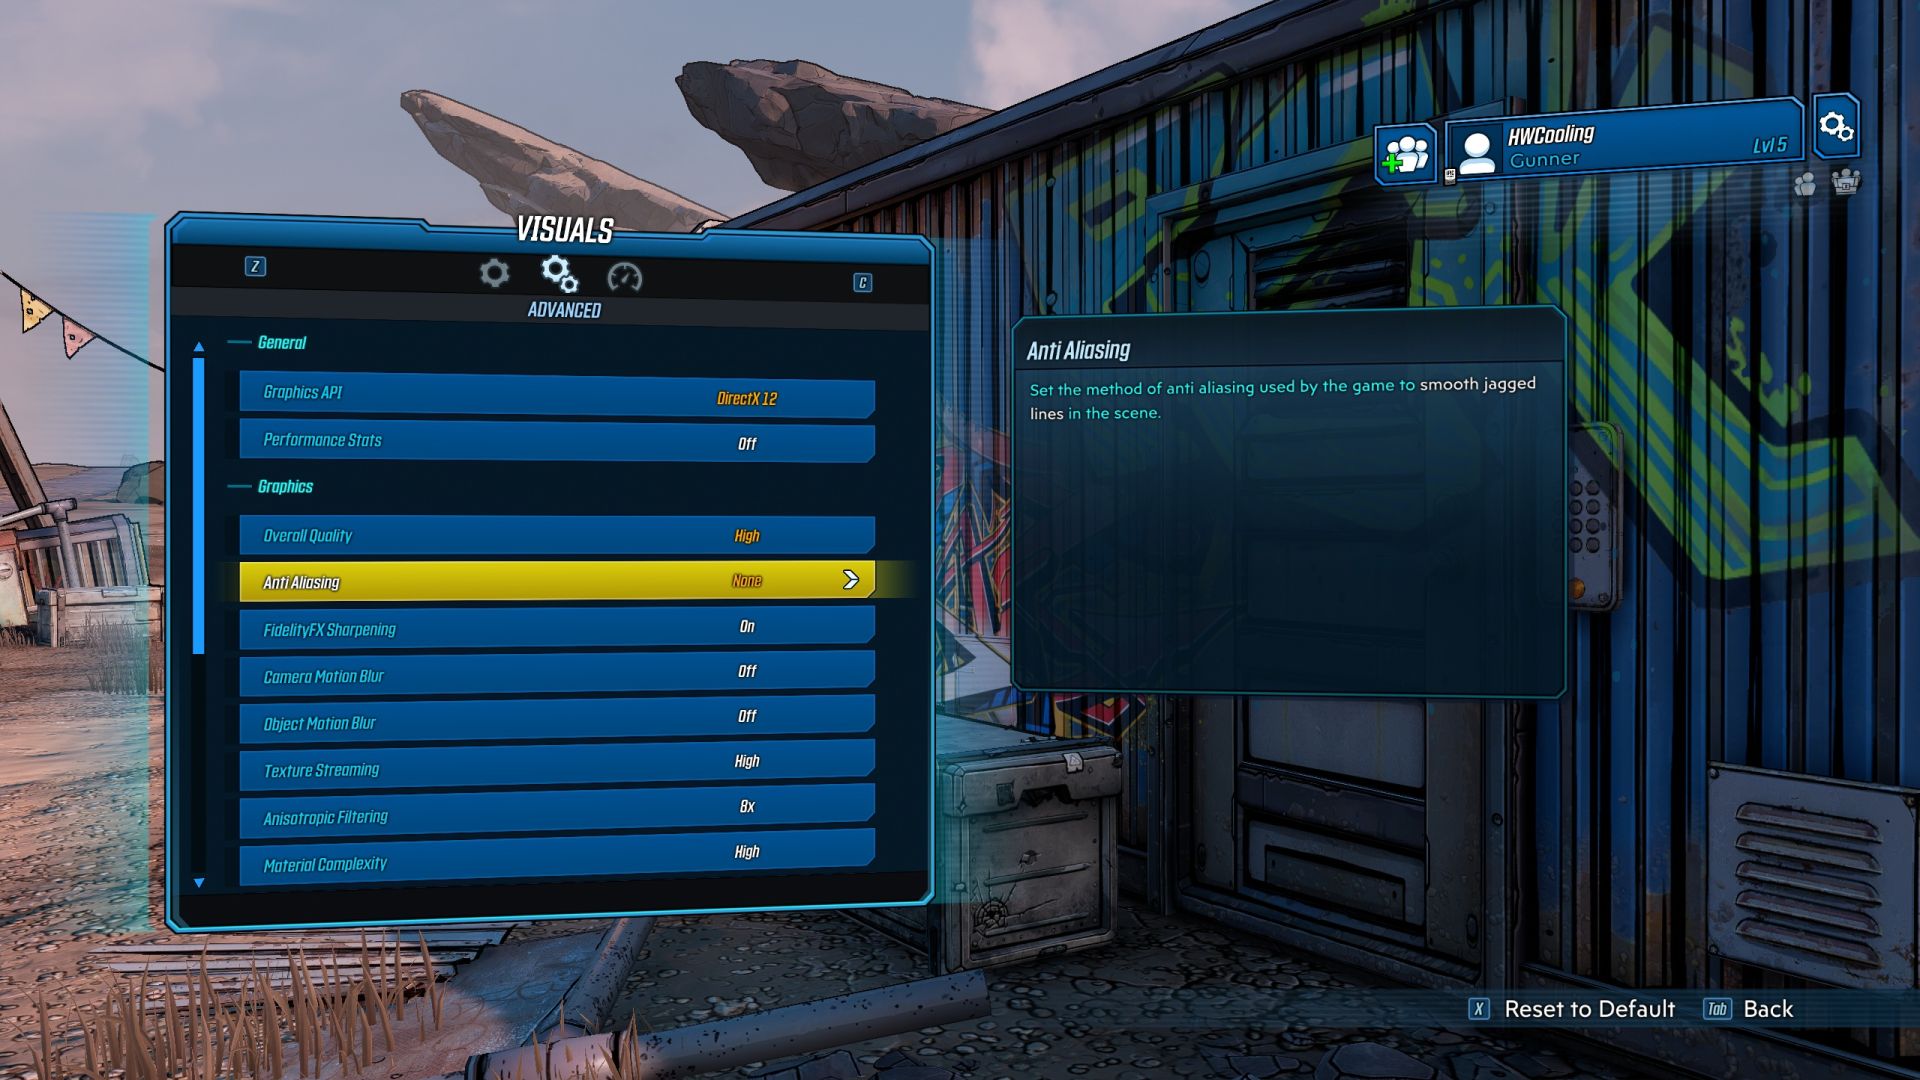
Test environment: resolution 1920 × 1080 px; graphics settings preset High; API DirectX 12; extra settings Anti-Aliasing: None; test scene: built-in benchmark.
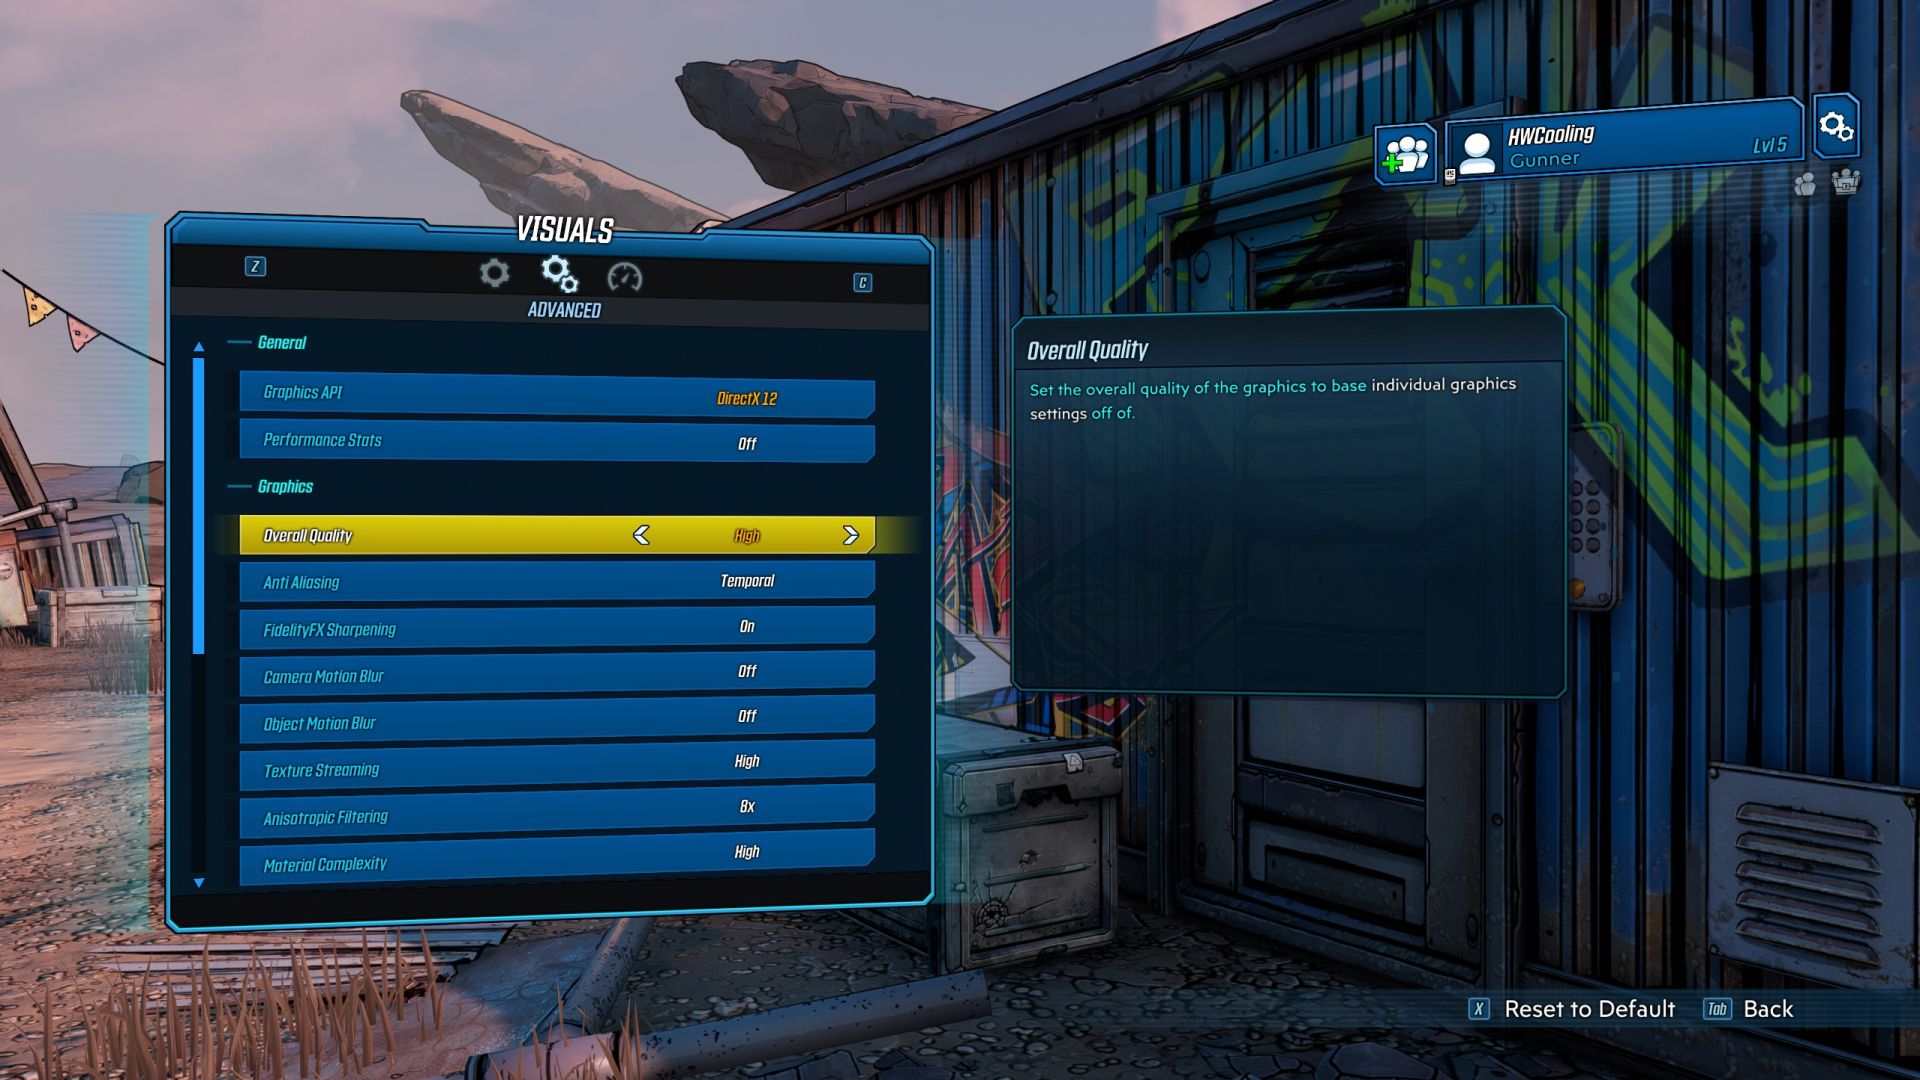
Test environment: resolution 2560 × 1440 px; graphics settings preset High; API DirectX 12; no extra settings; test scene: built-in benchmark.

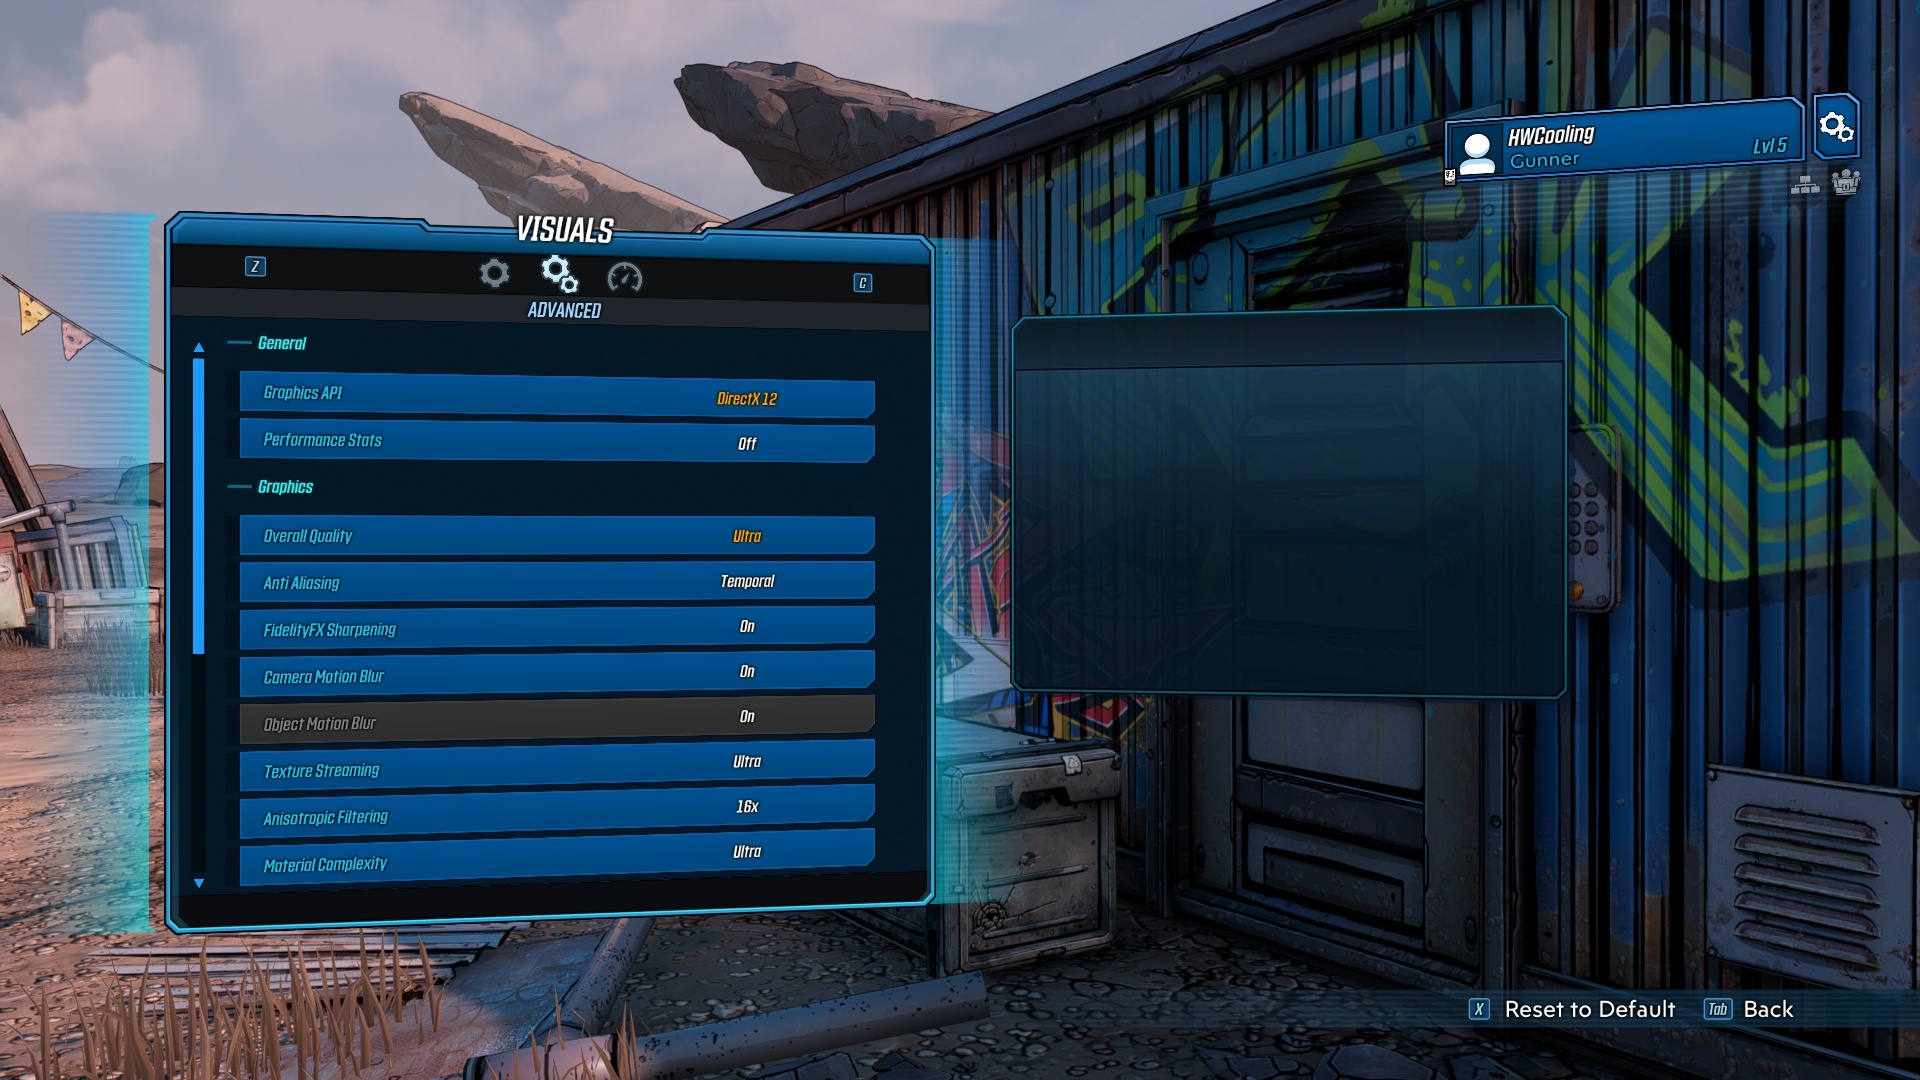
Test environment: resolution 3840 × 2160 px; graphics settings preset Ultra; API DirectX 12; no extra settings; test scene: built-in benchmark.
For completeness of Intel Core i5-14400F processor tests we add the results of its second stepping. We’ve already tested the B0 variant, now it’s time for the C0. Its availability in stores is, at least at the moment, considerably worse and the question arises whether it is worth it at all. Is there any point in aiming for stepping C0 or is B0 also “okay”? Or does it “not matter” (what you get in the shopping lottery)?
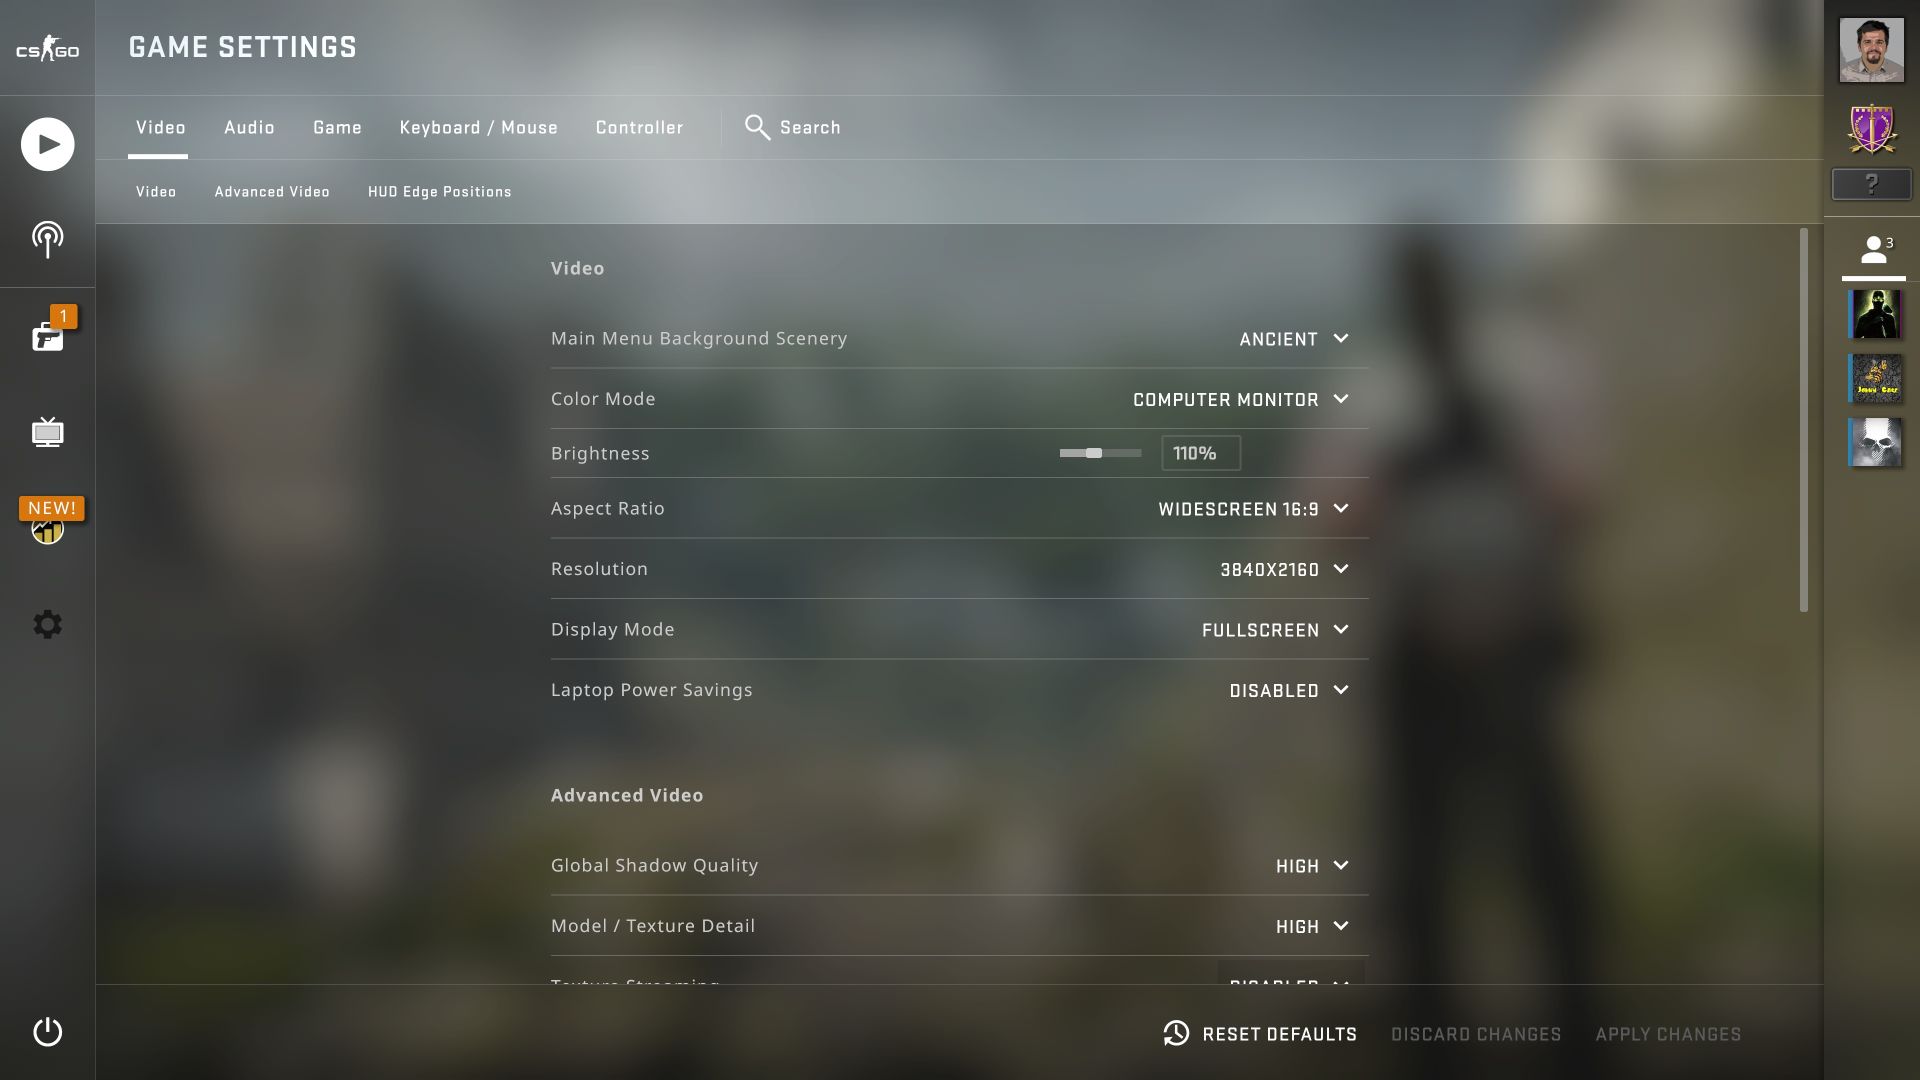
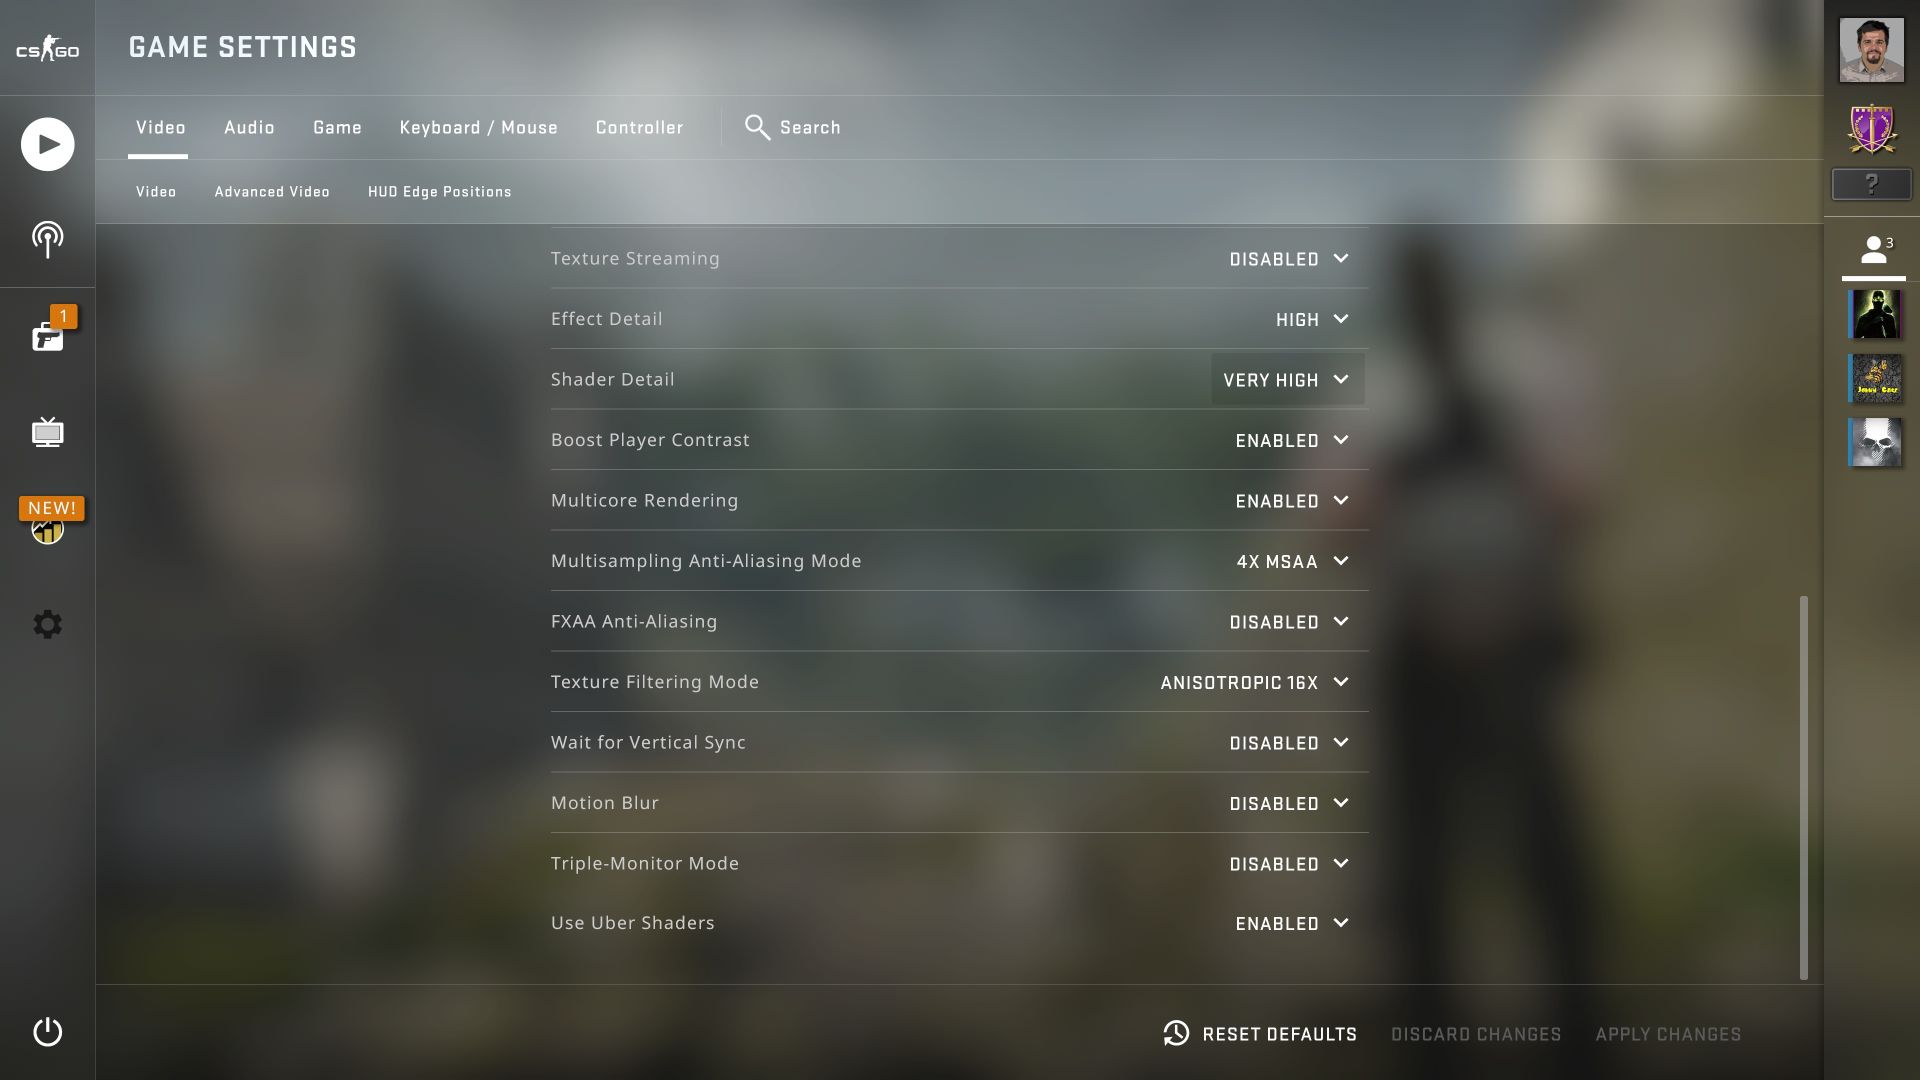
Counter-Strike: GO

Test environment: resolution 1280 × 720 px; lowest graphics settings and w/o Anti-Aliasing, API DirectX 9; Test platform script with Dust 2 map tour.
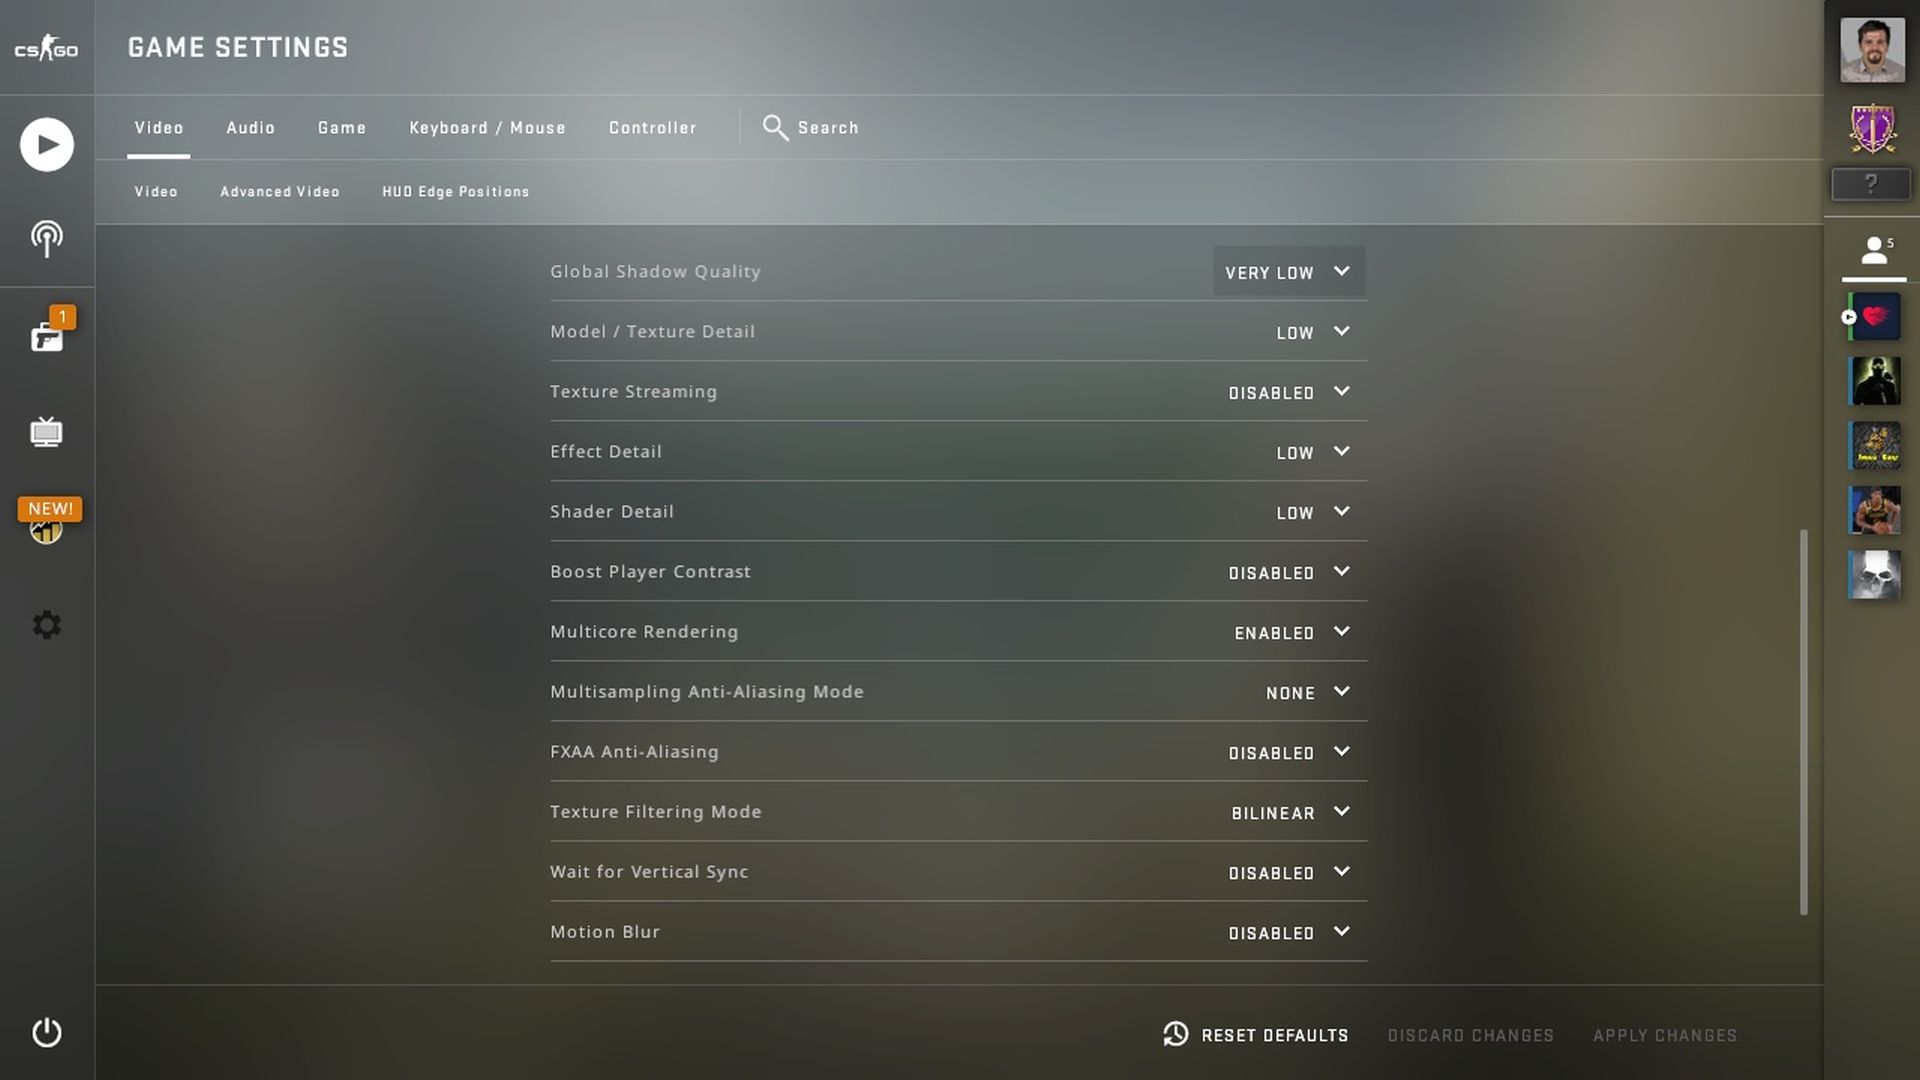

Test environment: resolution 1920 × 1080 px; high graphics settings and w/o Anti-Aliasingu, API DirectX 9; Test platform script with Dust 2 map tour.
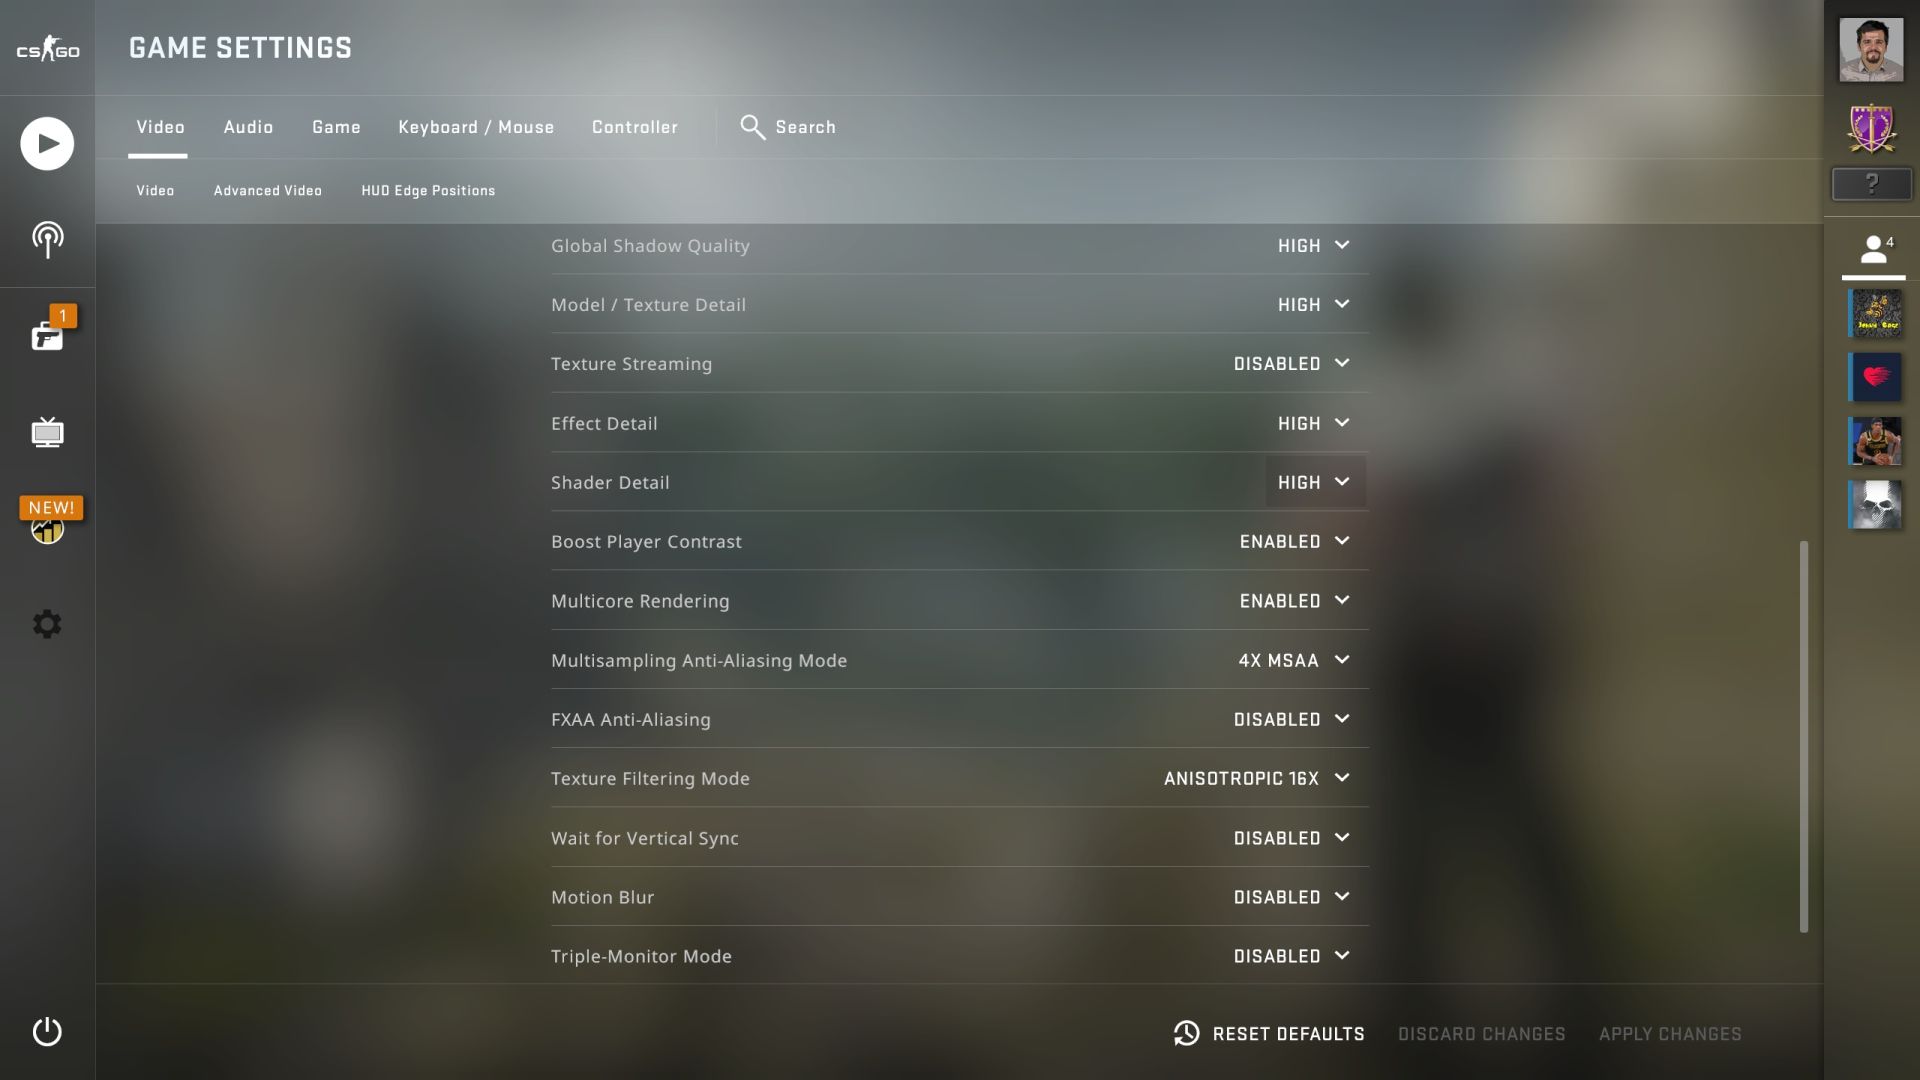
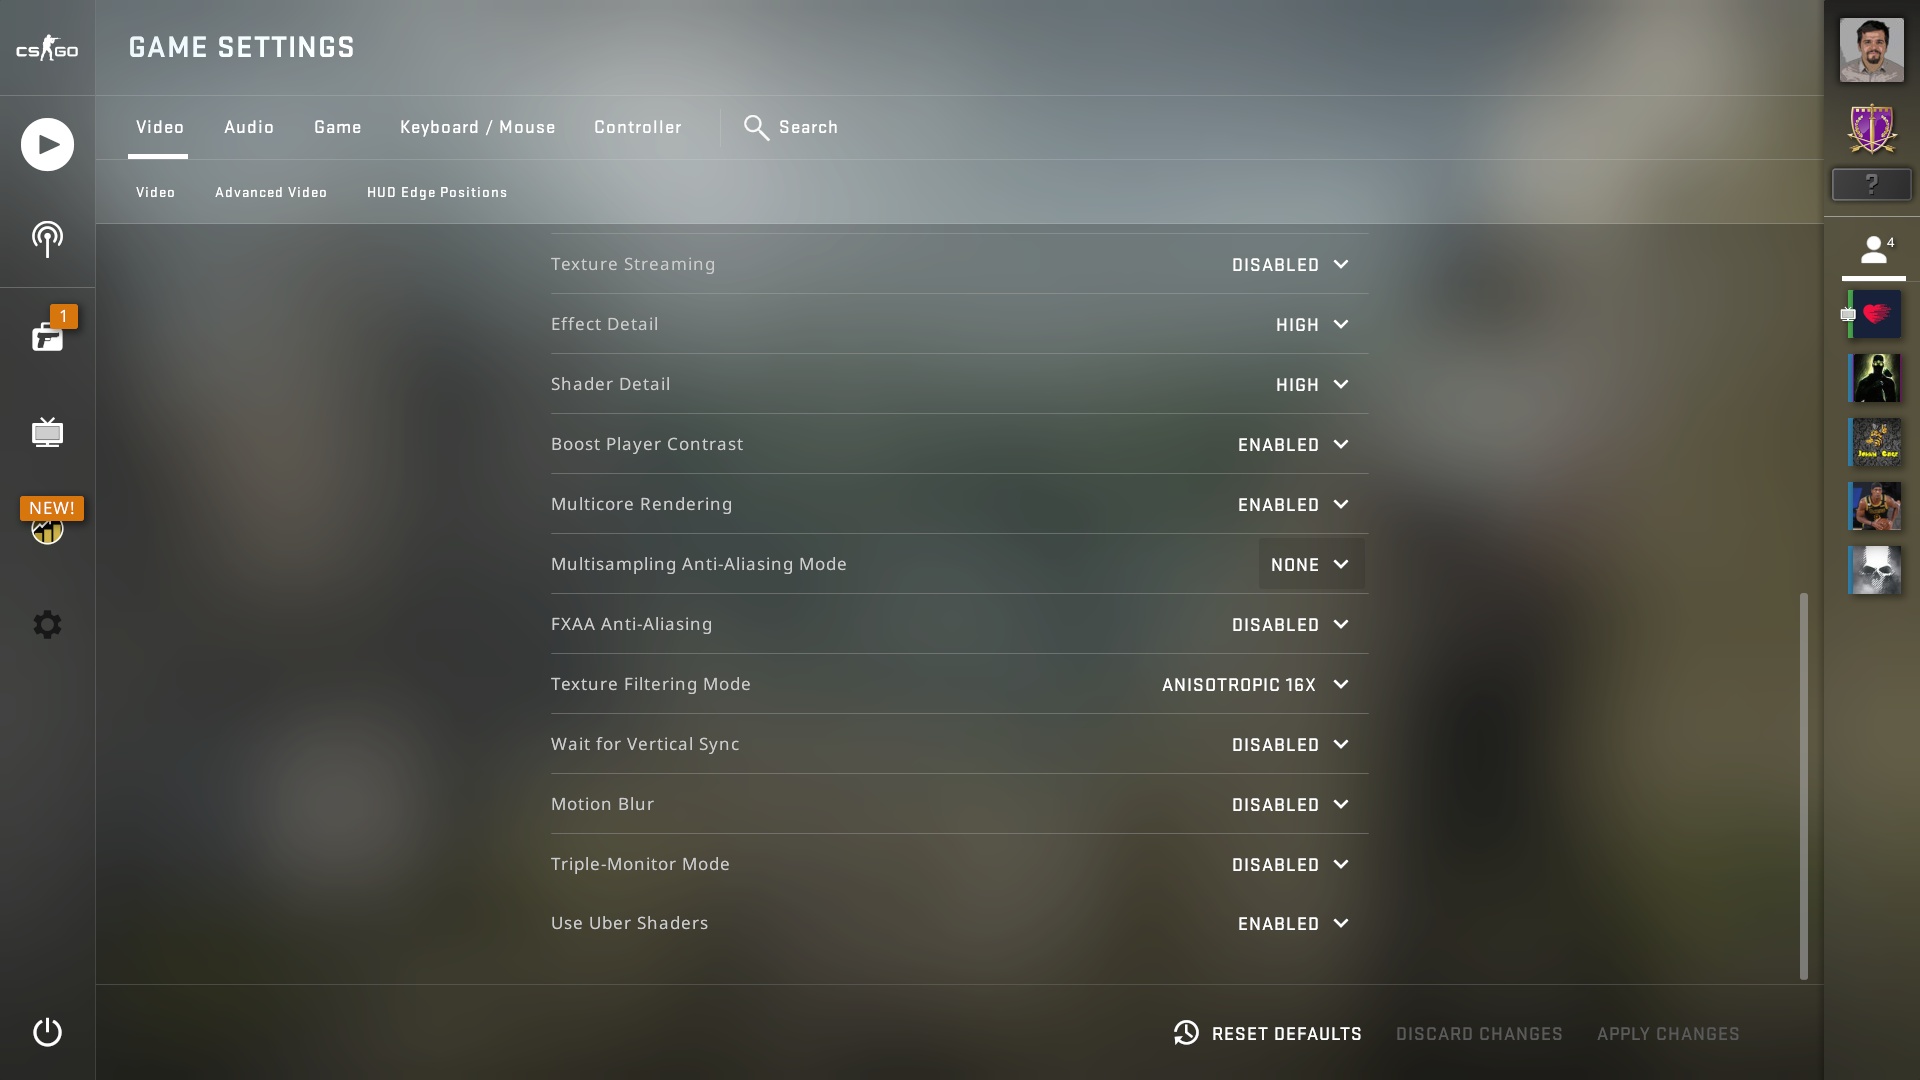
Test environment: resolution 2560 × 1440 px; high graphics settings; 4× MSAA, API DirectX 9; Test platform script with Dust 2 map tour.
Test environment: resolution 3840 × 2160 px; very high graphics settings; 4× MSAA, API DirectX 9; Test platform script with Dust 2 map tour.
For completeness of Intel Core i5-14400F processor tests we add the results of its second stepping. We’ve already tested the B0 variant, now it’s time for the C0. Its availability in stores is, at least at the moment, considerably worse and the question arises whether it is worth it at all. Is there any point in aiming for stepping C0 or is B0 also “okay”? Or does it “not matter” (what you get in the shopping lottery)?
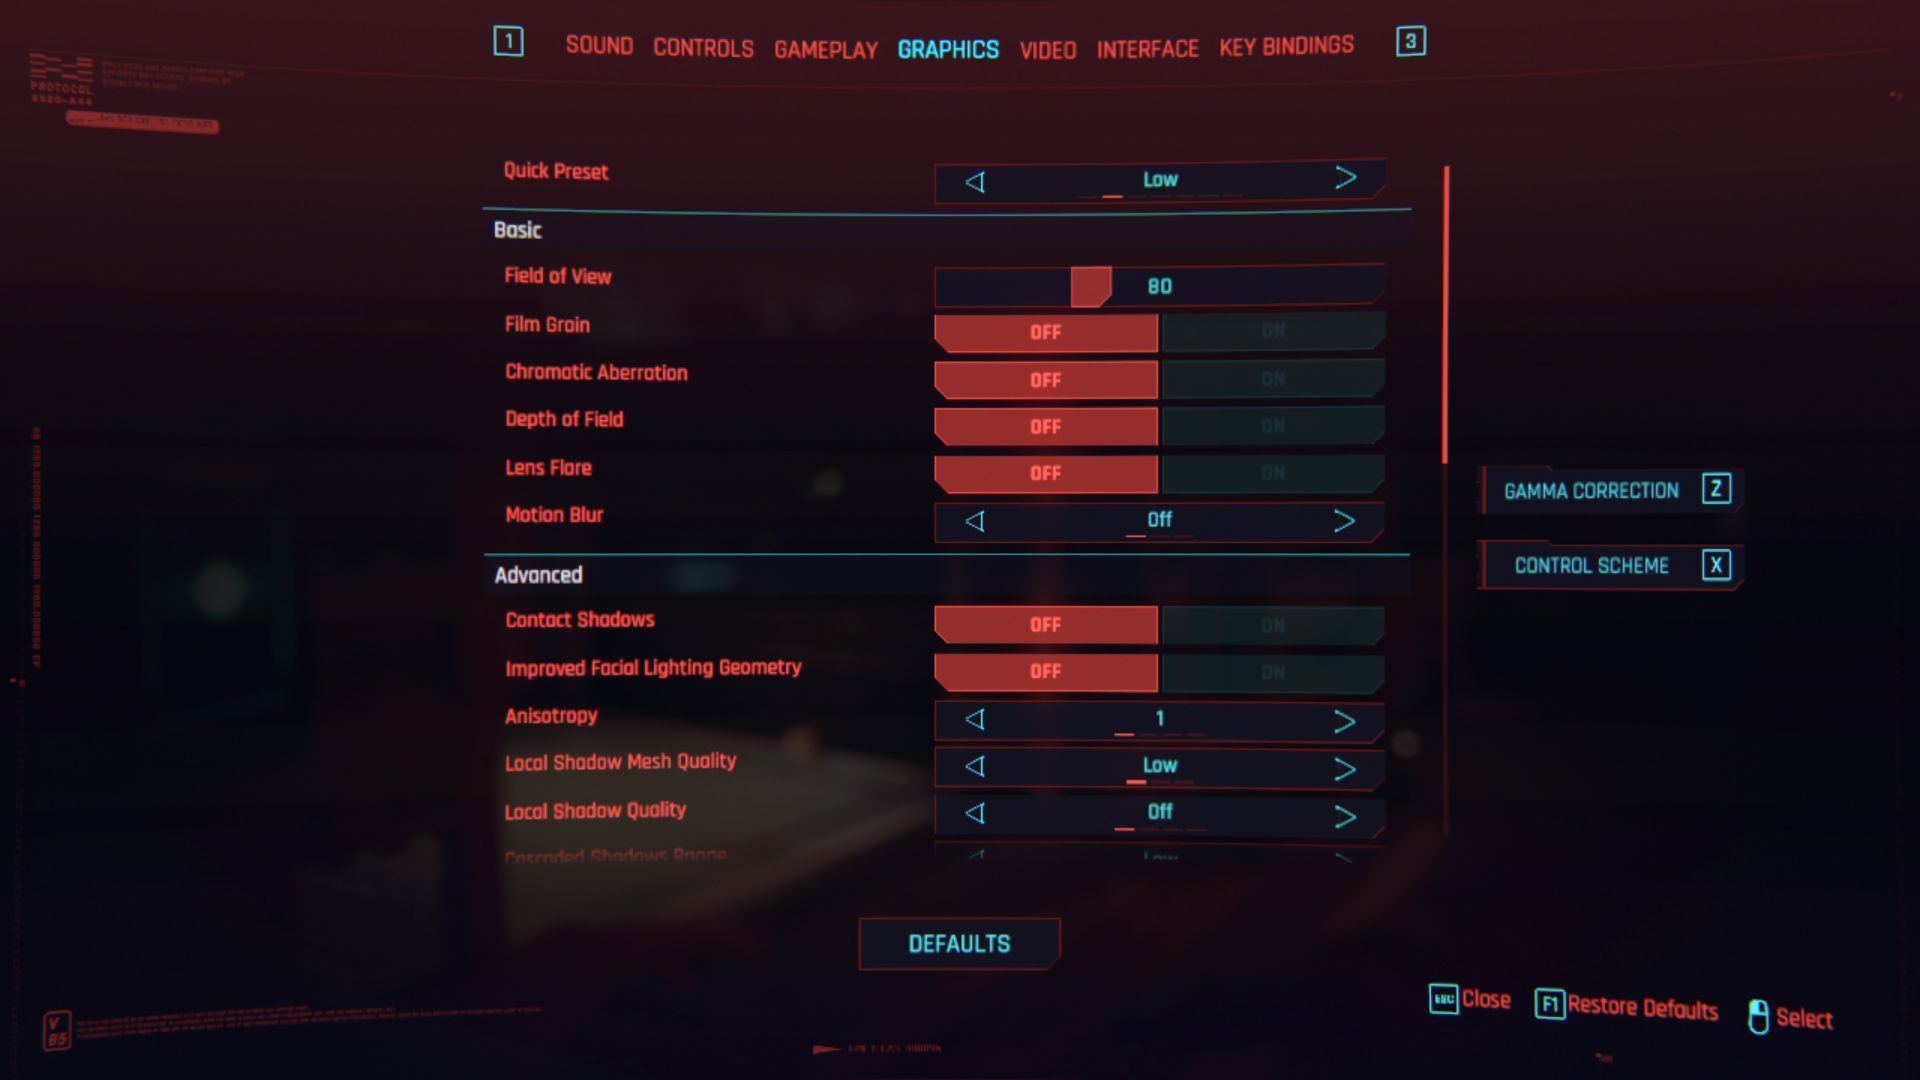
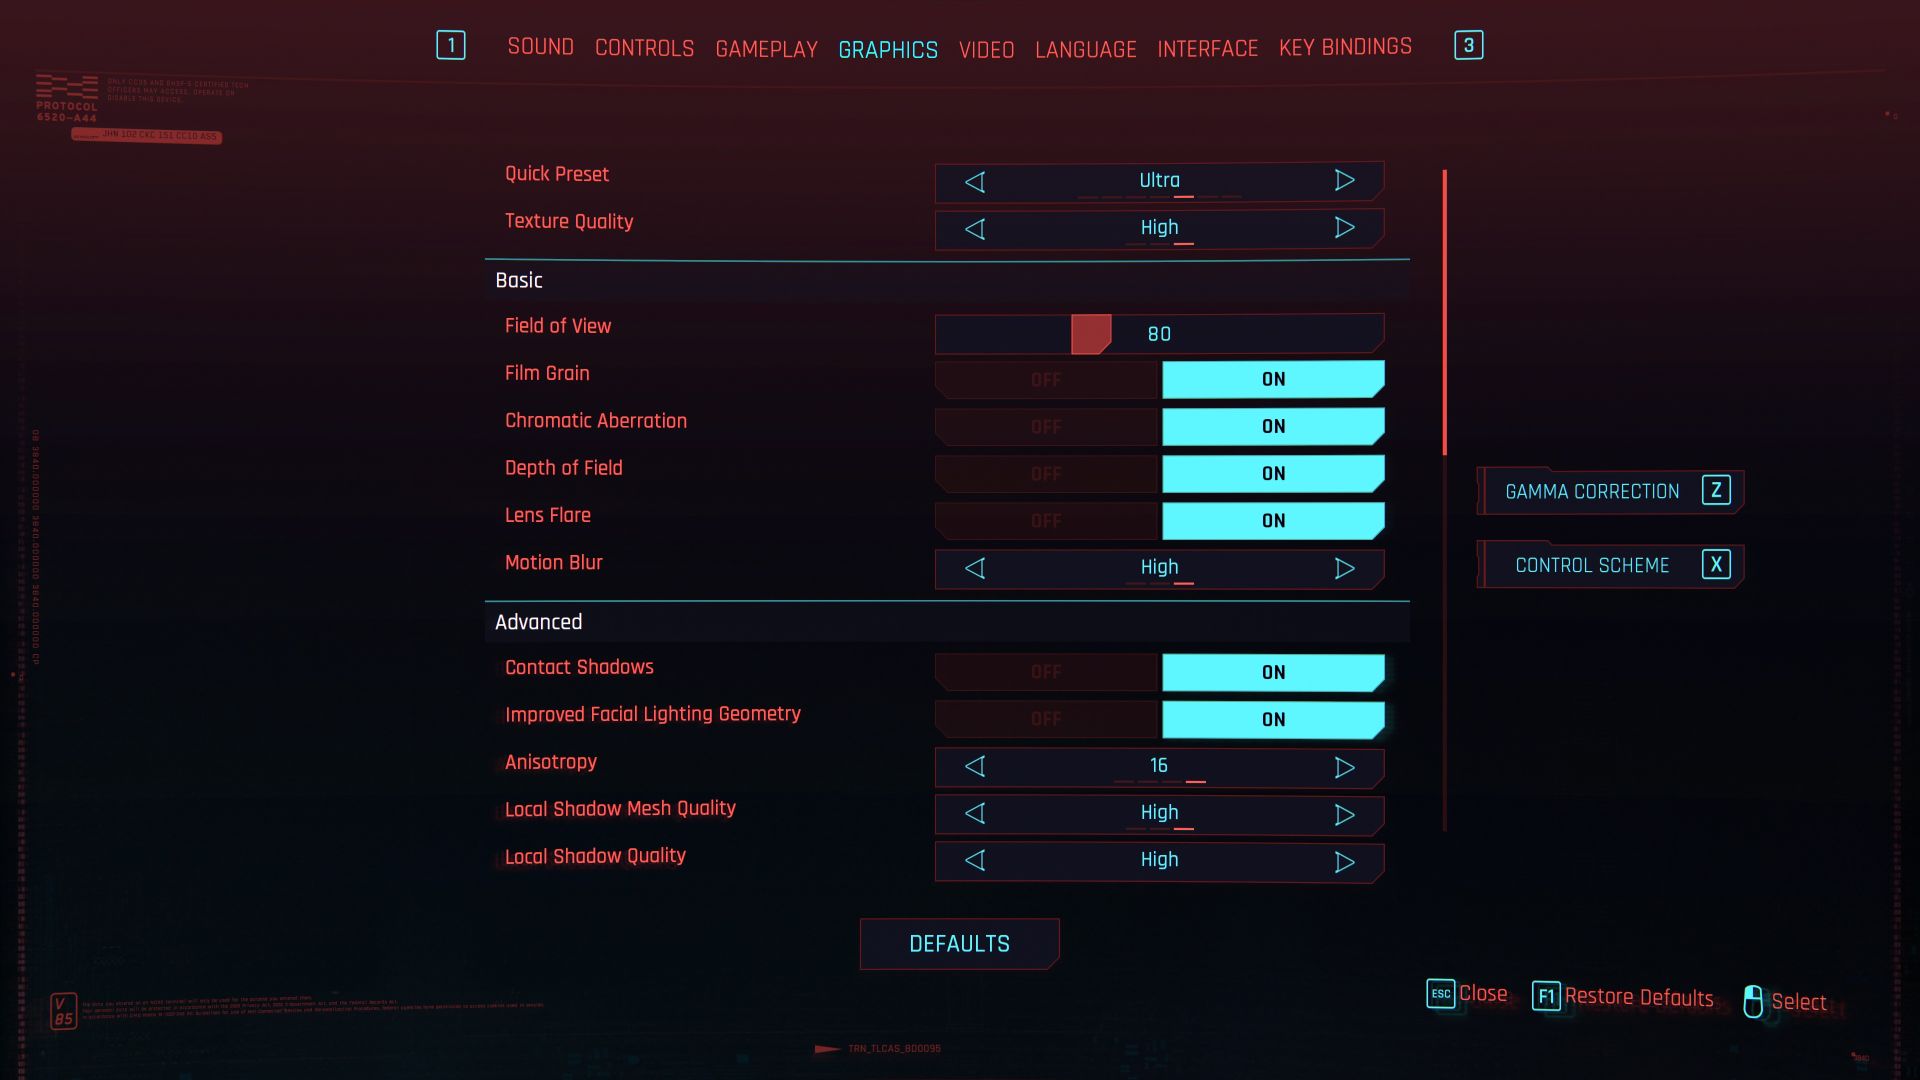
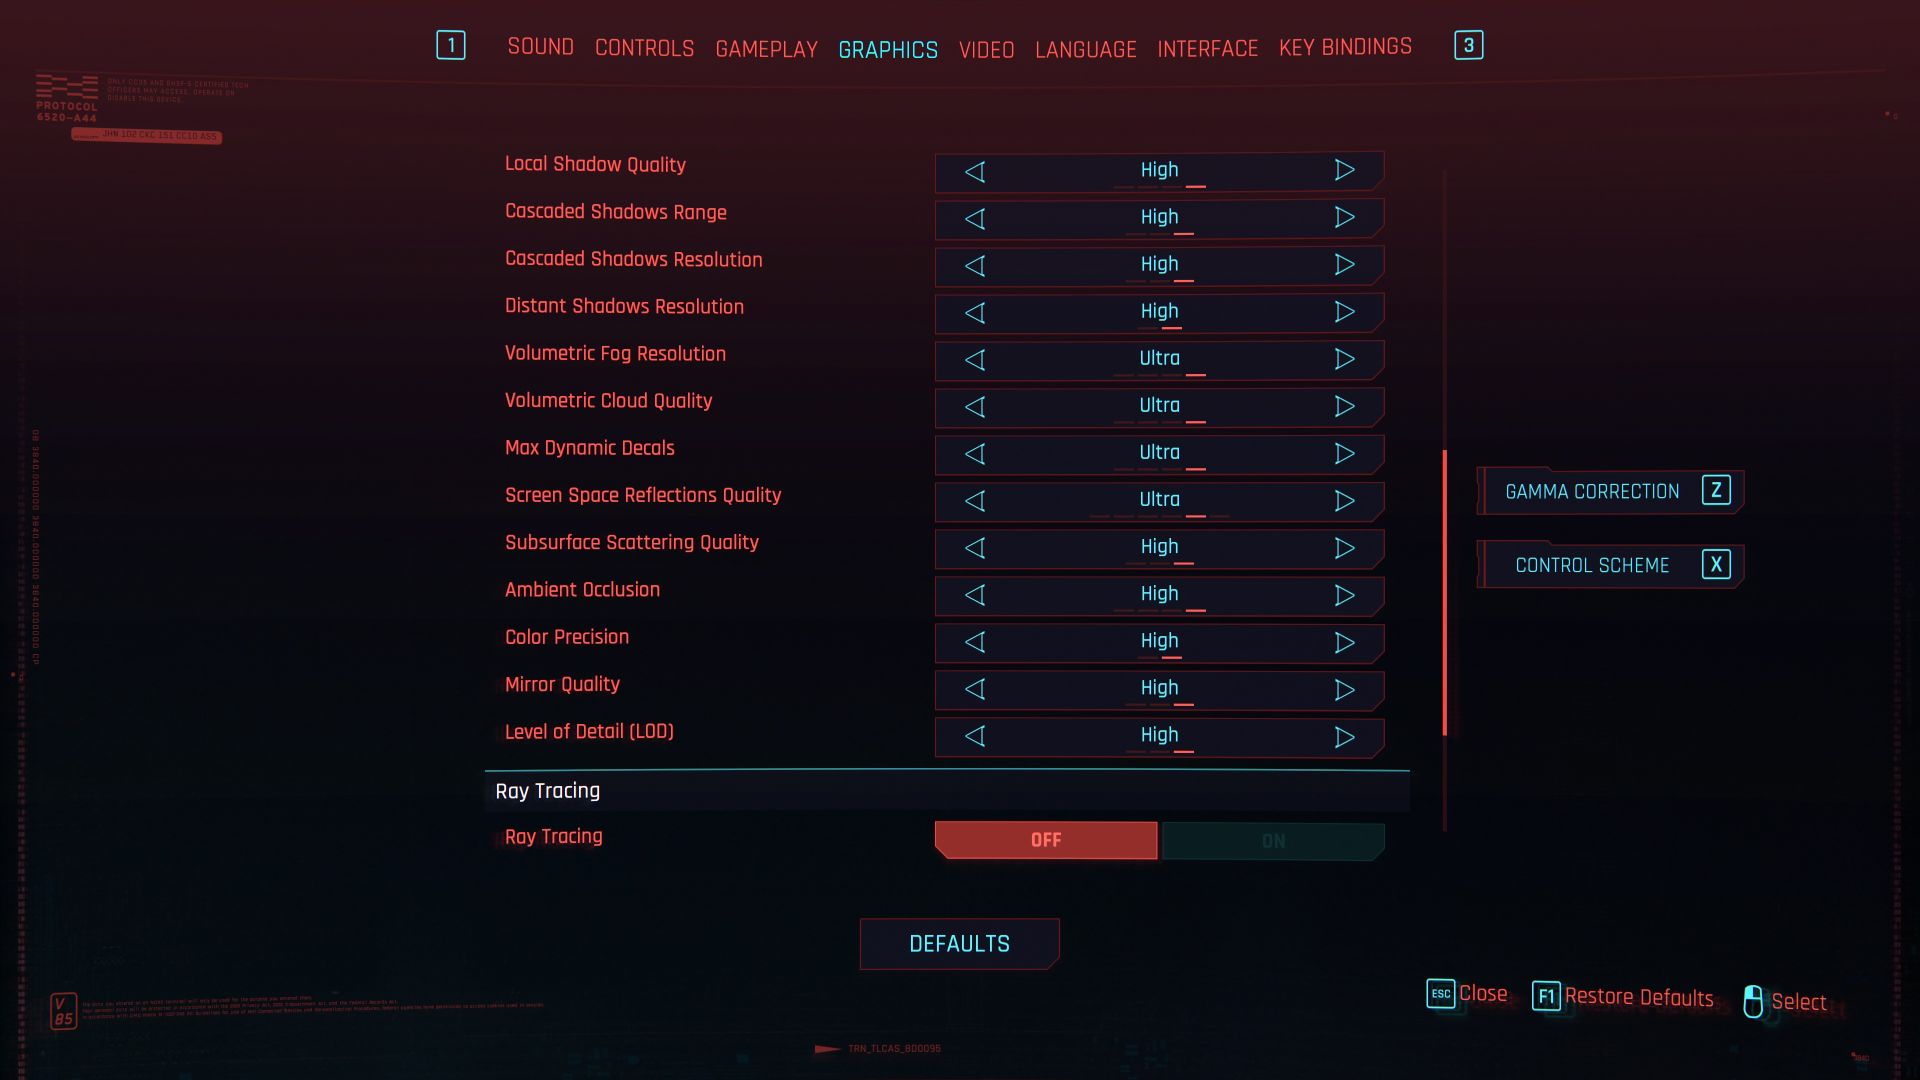
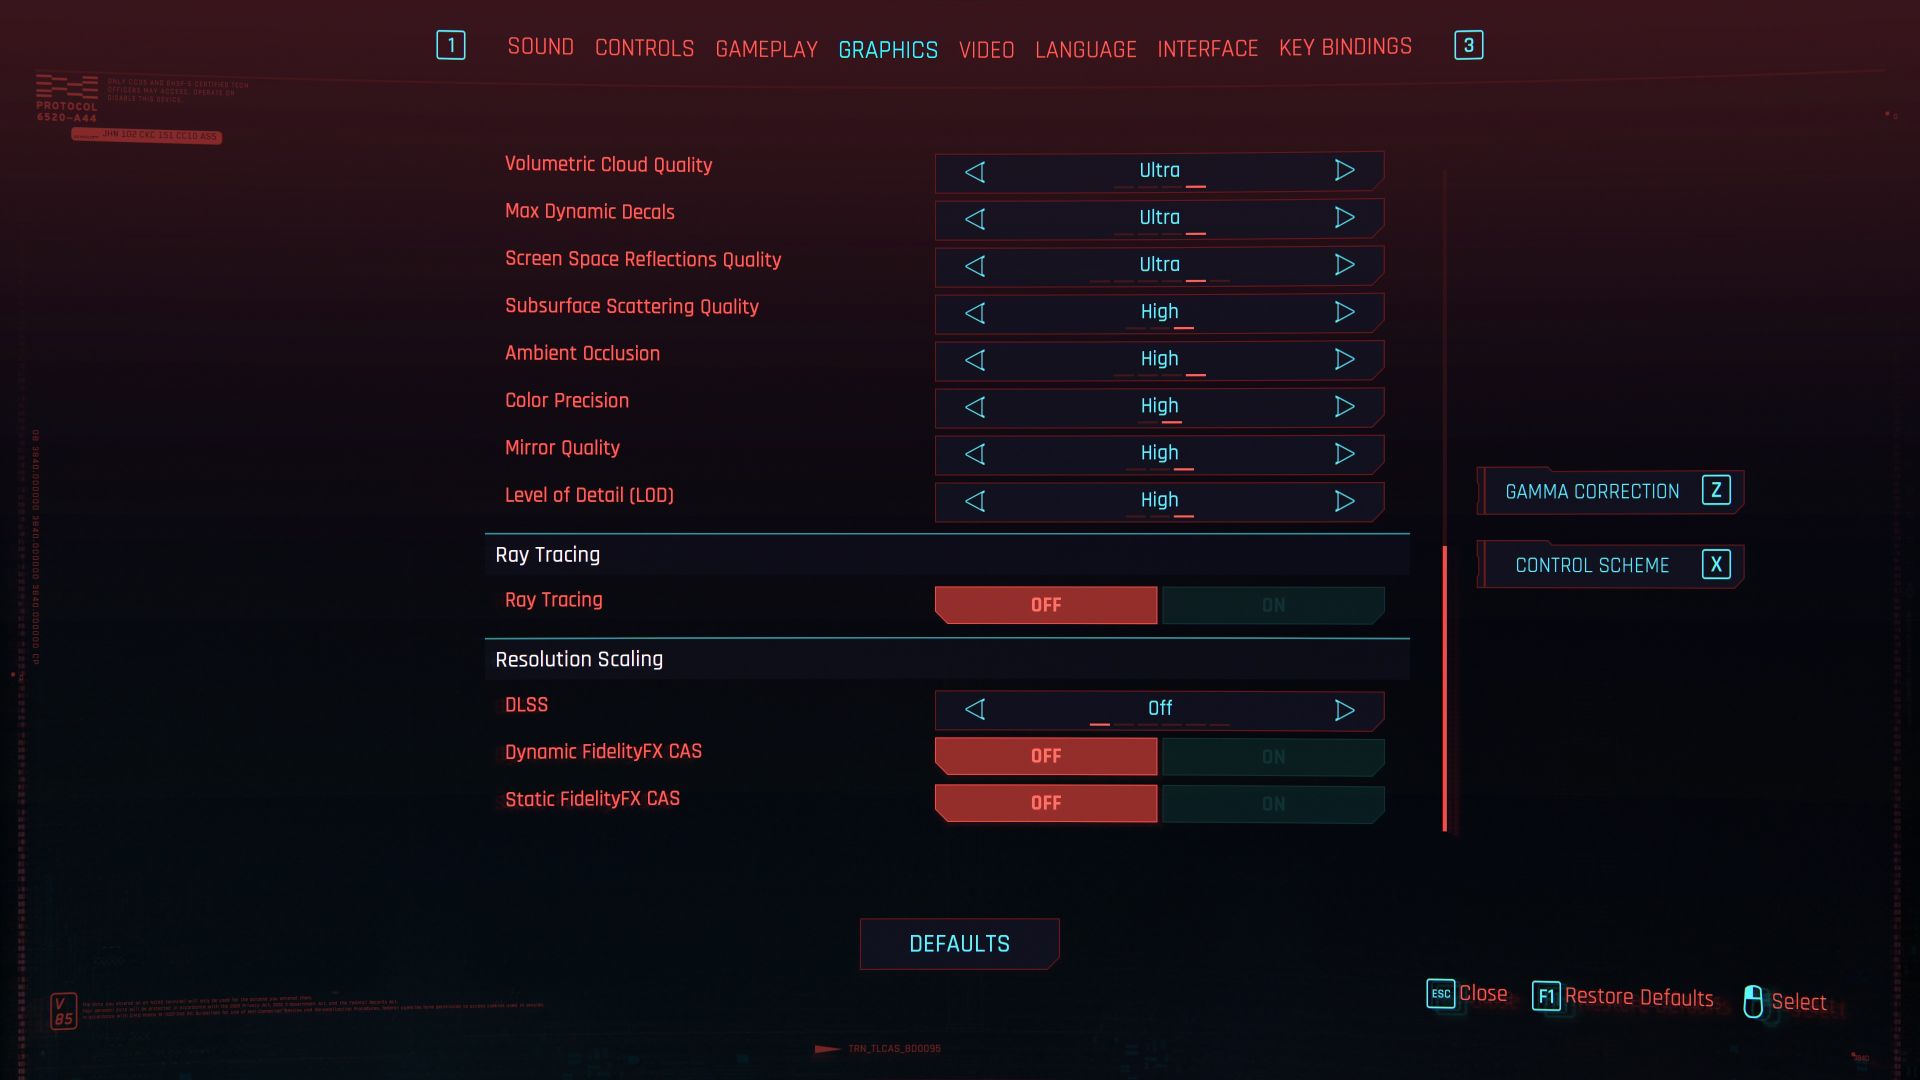
Cyberpunk 2077
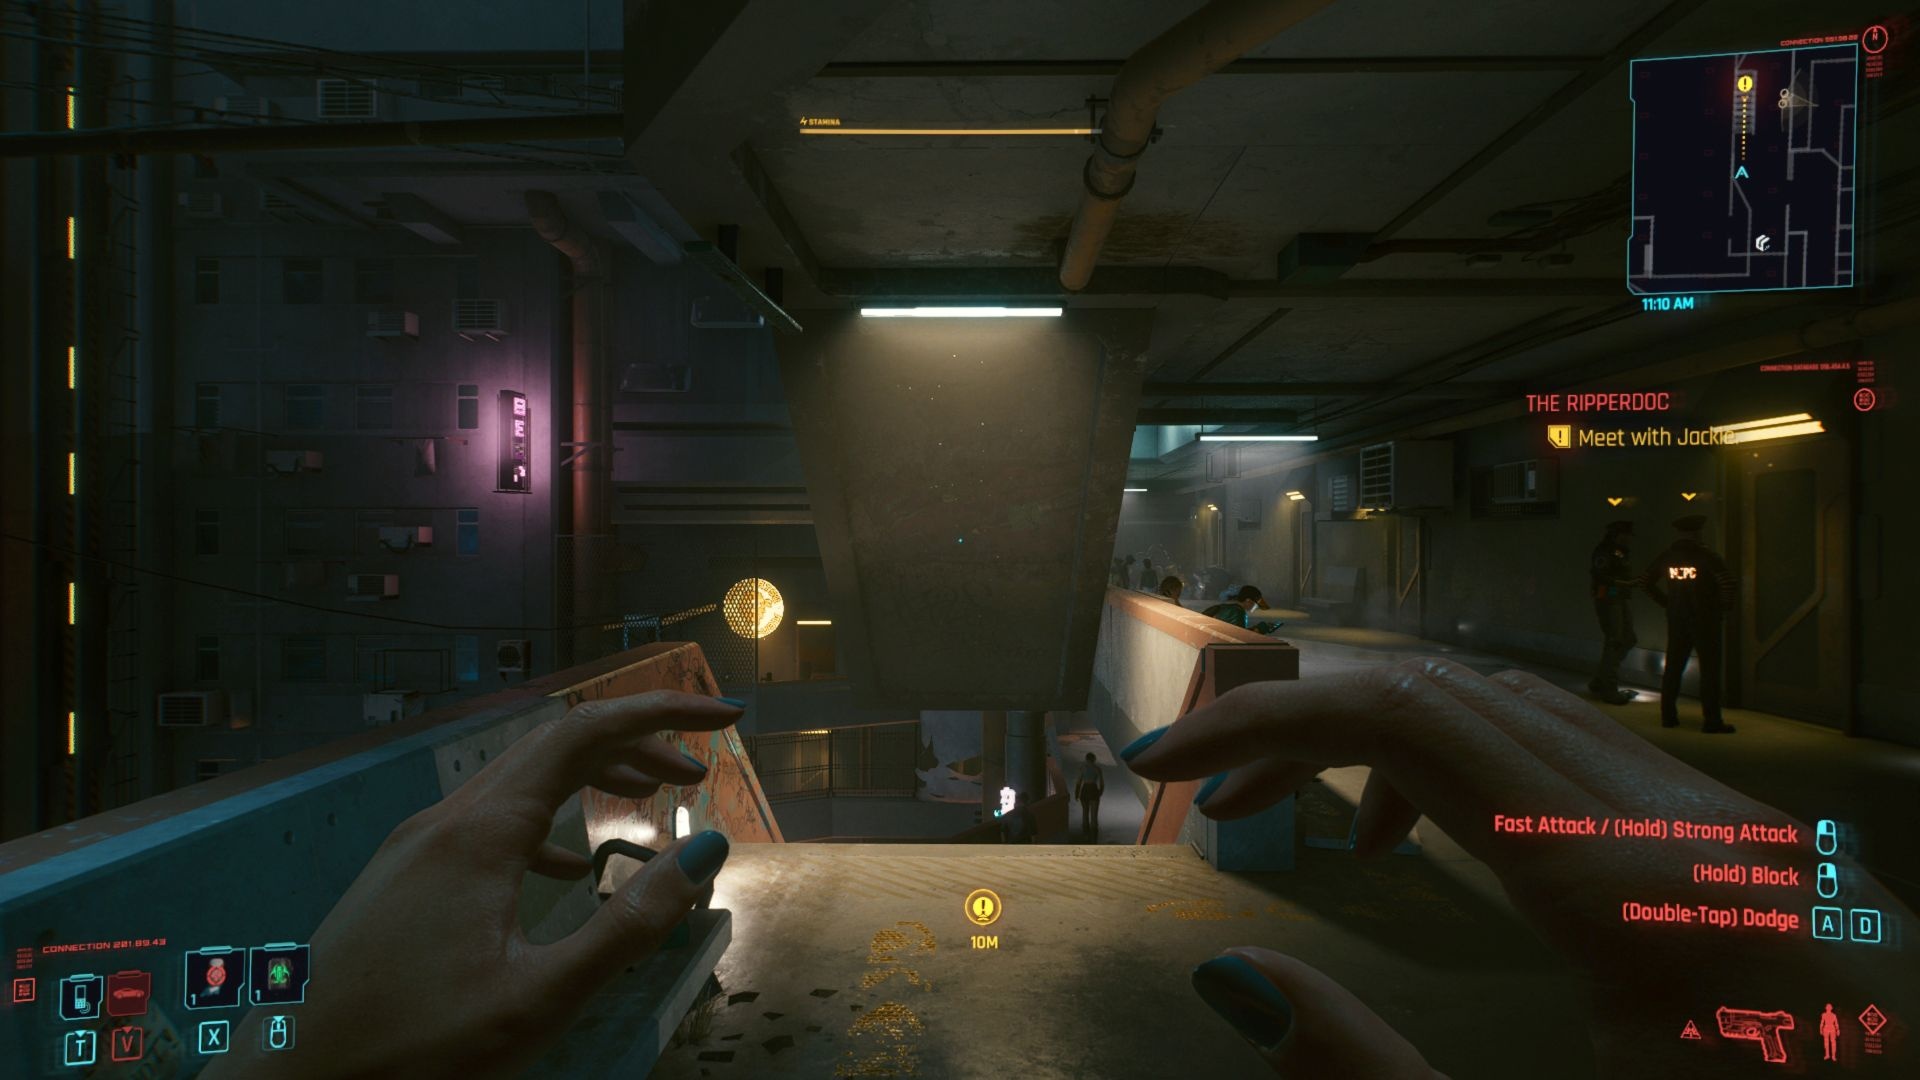
Test environment: resolution 1280 × 720 px; graphics settings preset Low; API DirectX 12; no extra settings; test scene: custom (Little China).
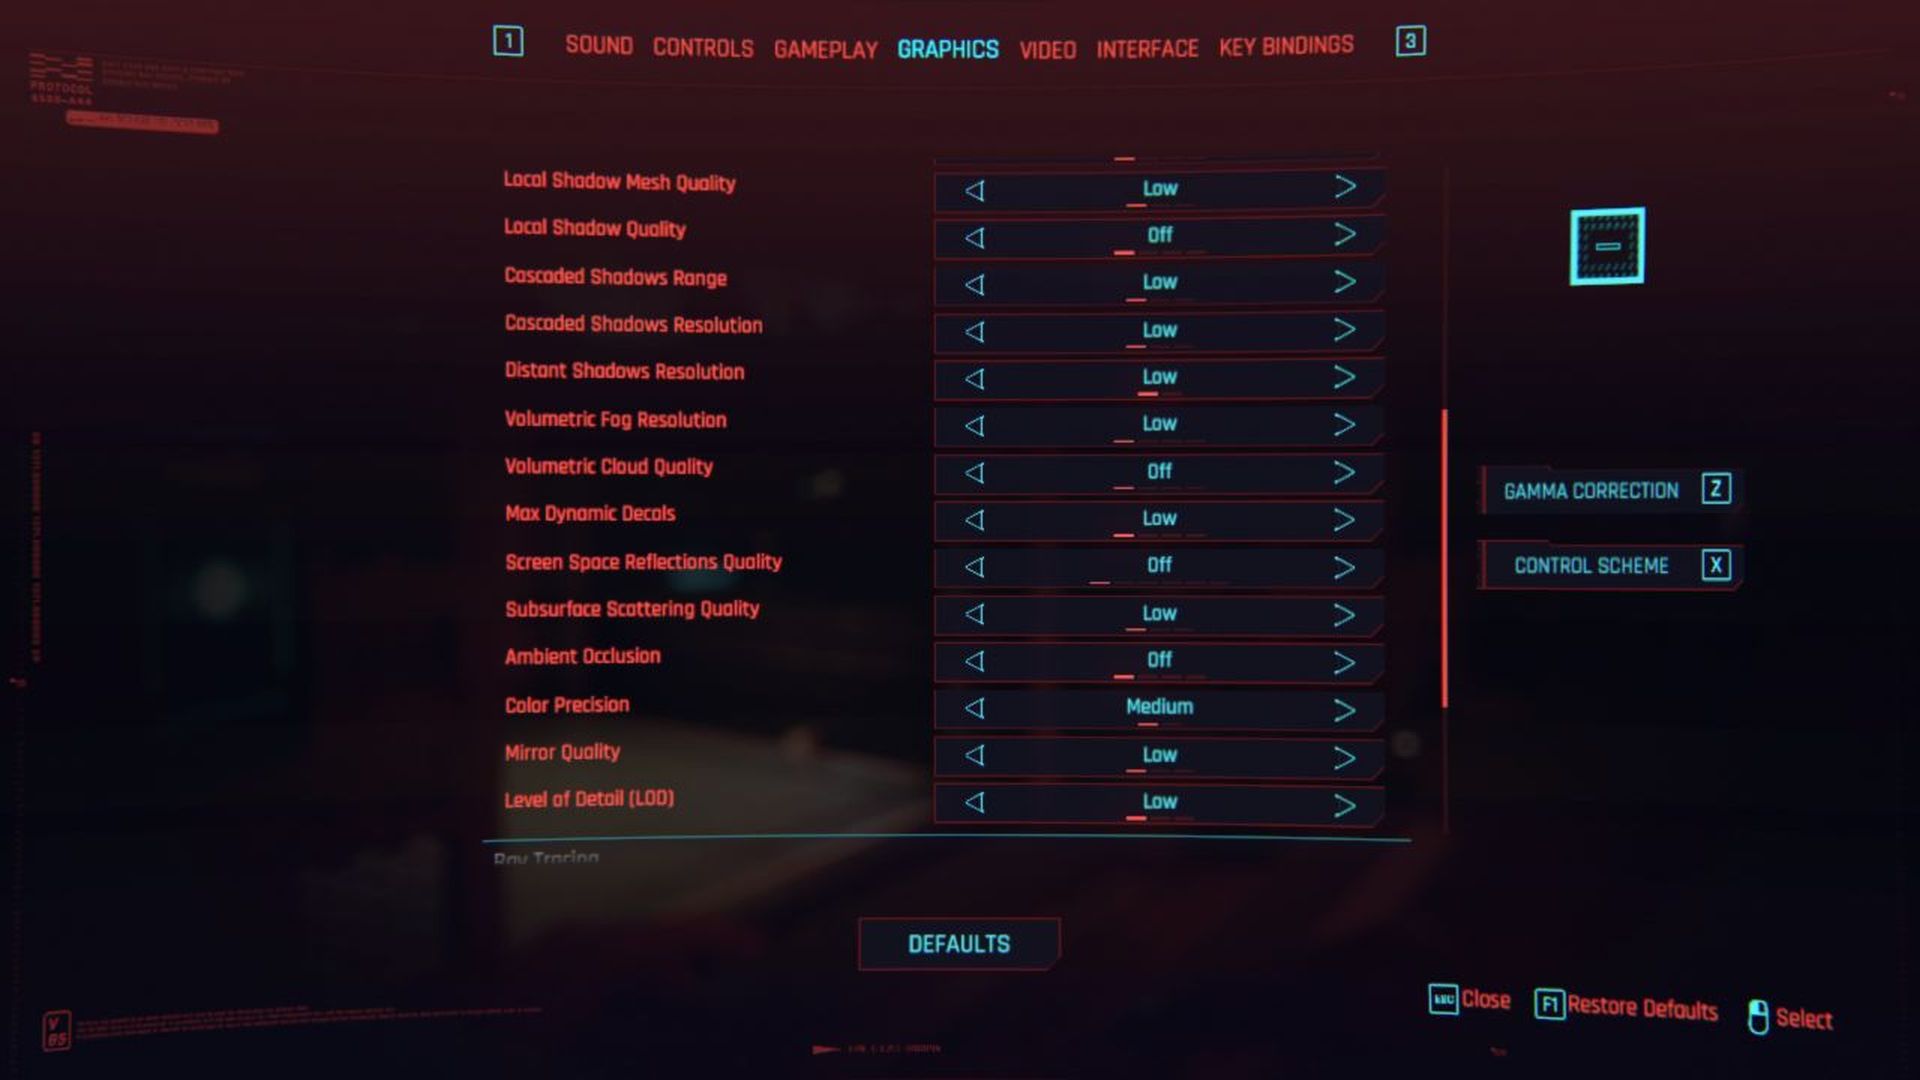

Test environment: resolution 1920 × 1080 px; graphics settings preset High; API DirectX 12; no extra settings; test scene: custom (Little China).
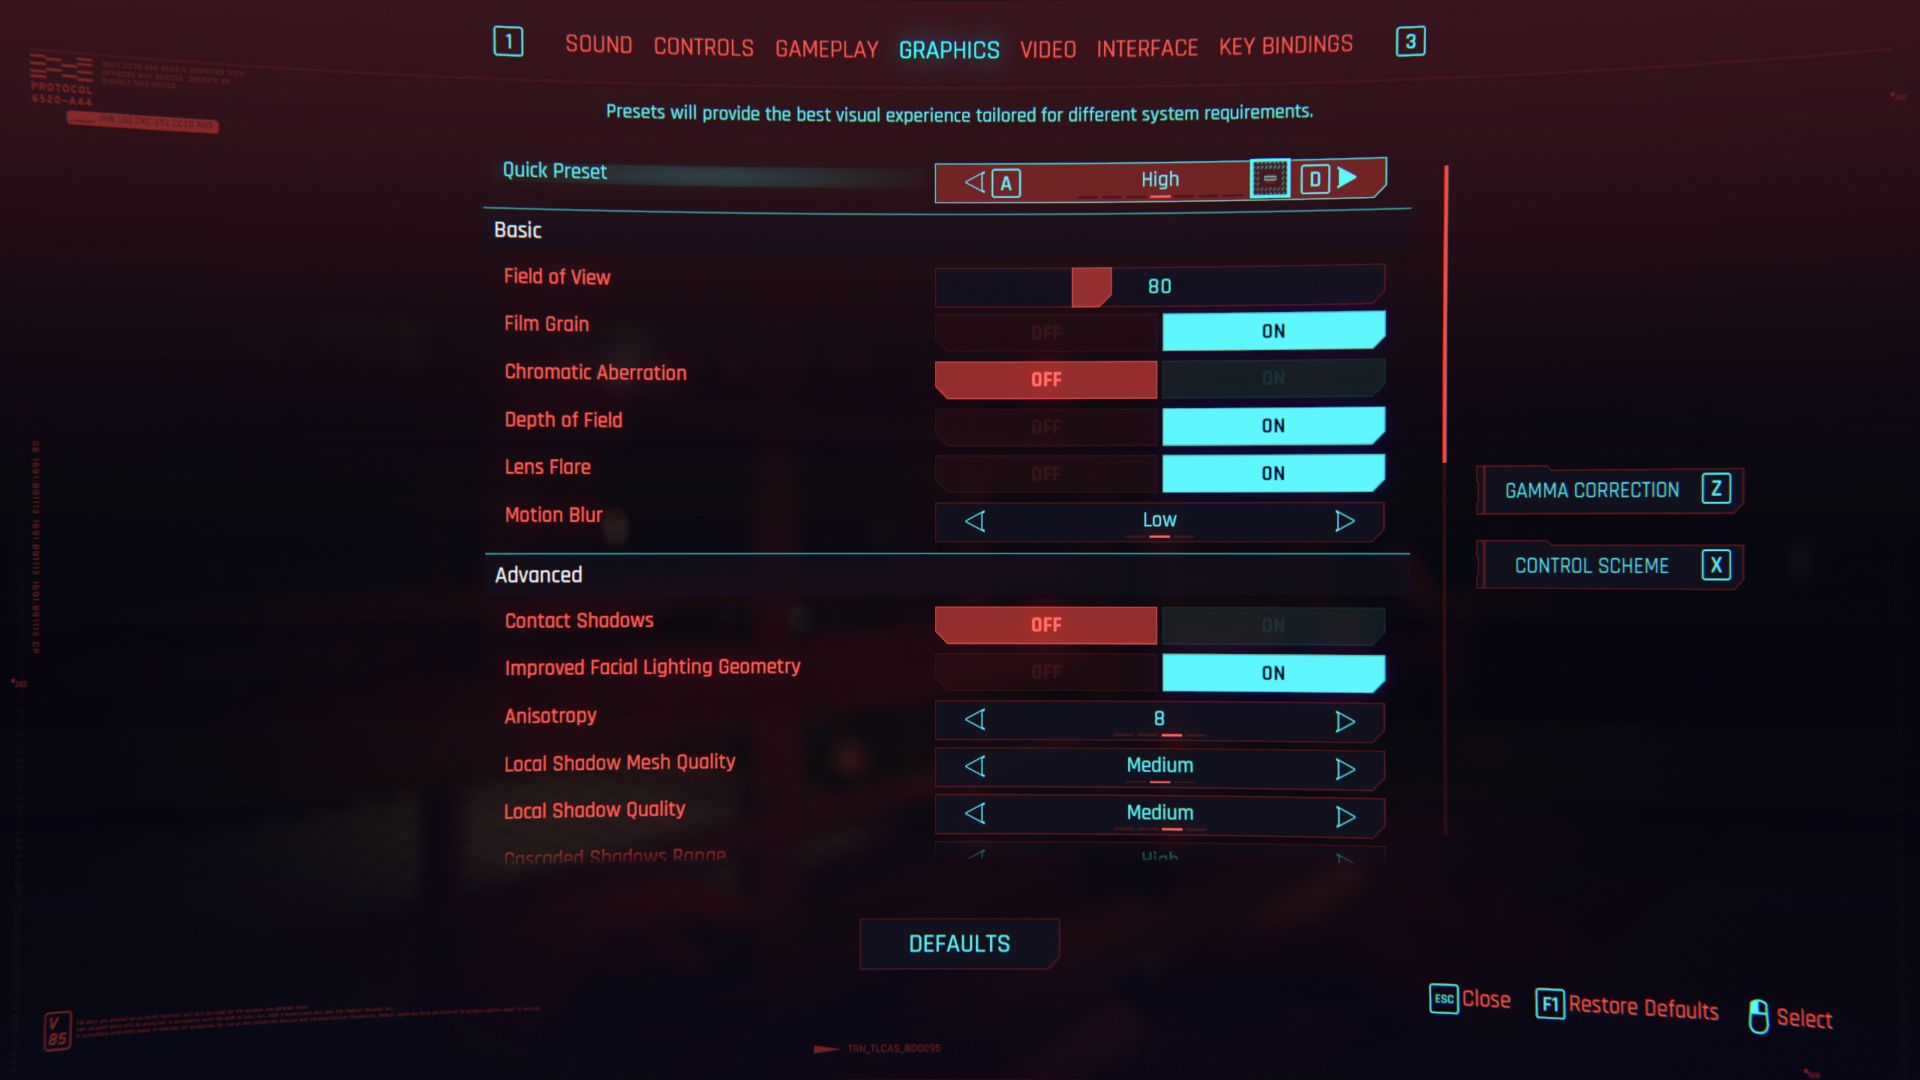

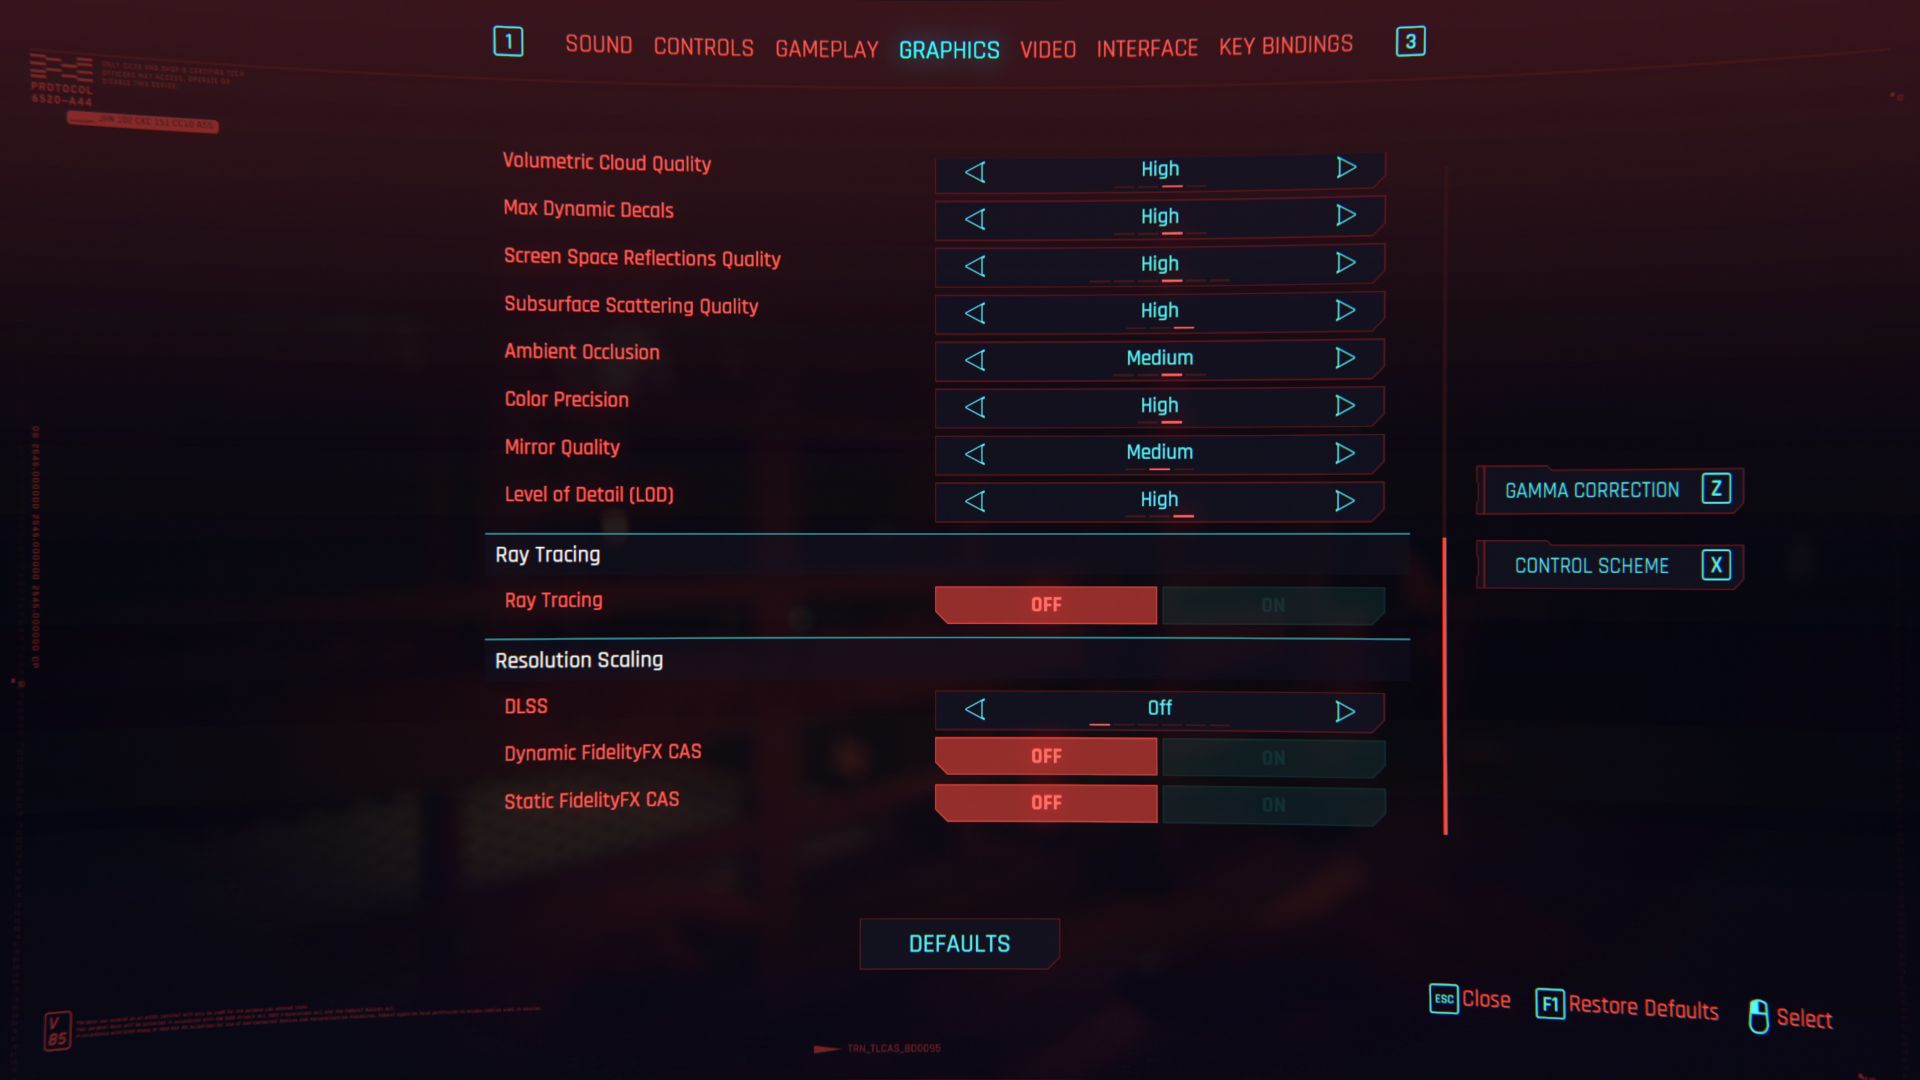
Test environment: resolution 2560 × 1440 px; graphics settings preset High; API DirectX 12; no extra settings; test scene: custom (Little China).
Test environment: resolution 3840 × 2160 px; graphics settings preset Ultra; API DirectX 12; no extra settings; test scene: custom (Little China).
For completeness of Intel Core i5-14400F processor tests we add the results of its second stepping. We’ve already tested the B0 variant, now it’s time for the C0. Its availability in stores is, at least at the moment, considerably worse and the question arises whether it is worth it at all. Is there any point in aiming for stepping C0 or is B0 also “okay”? Or does it “not matter” (what you get in the shopping lottery)?
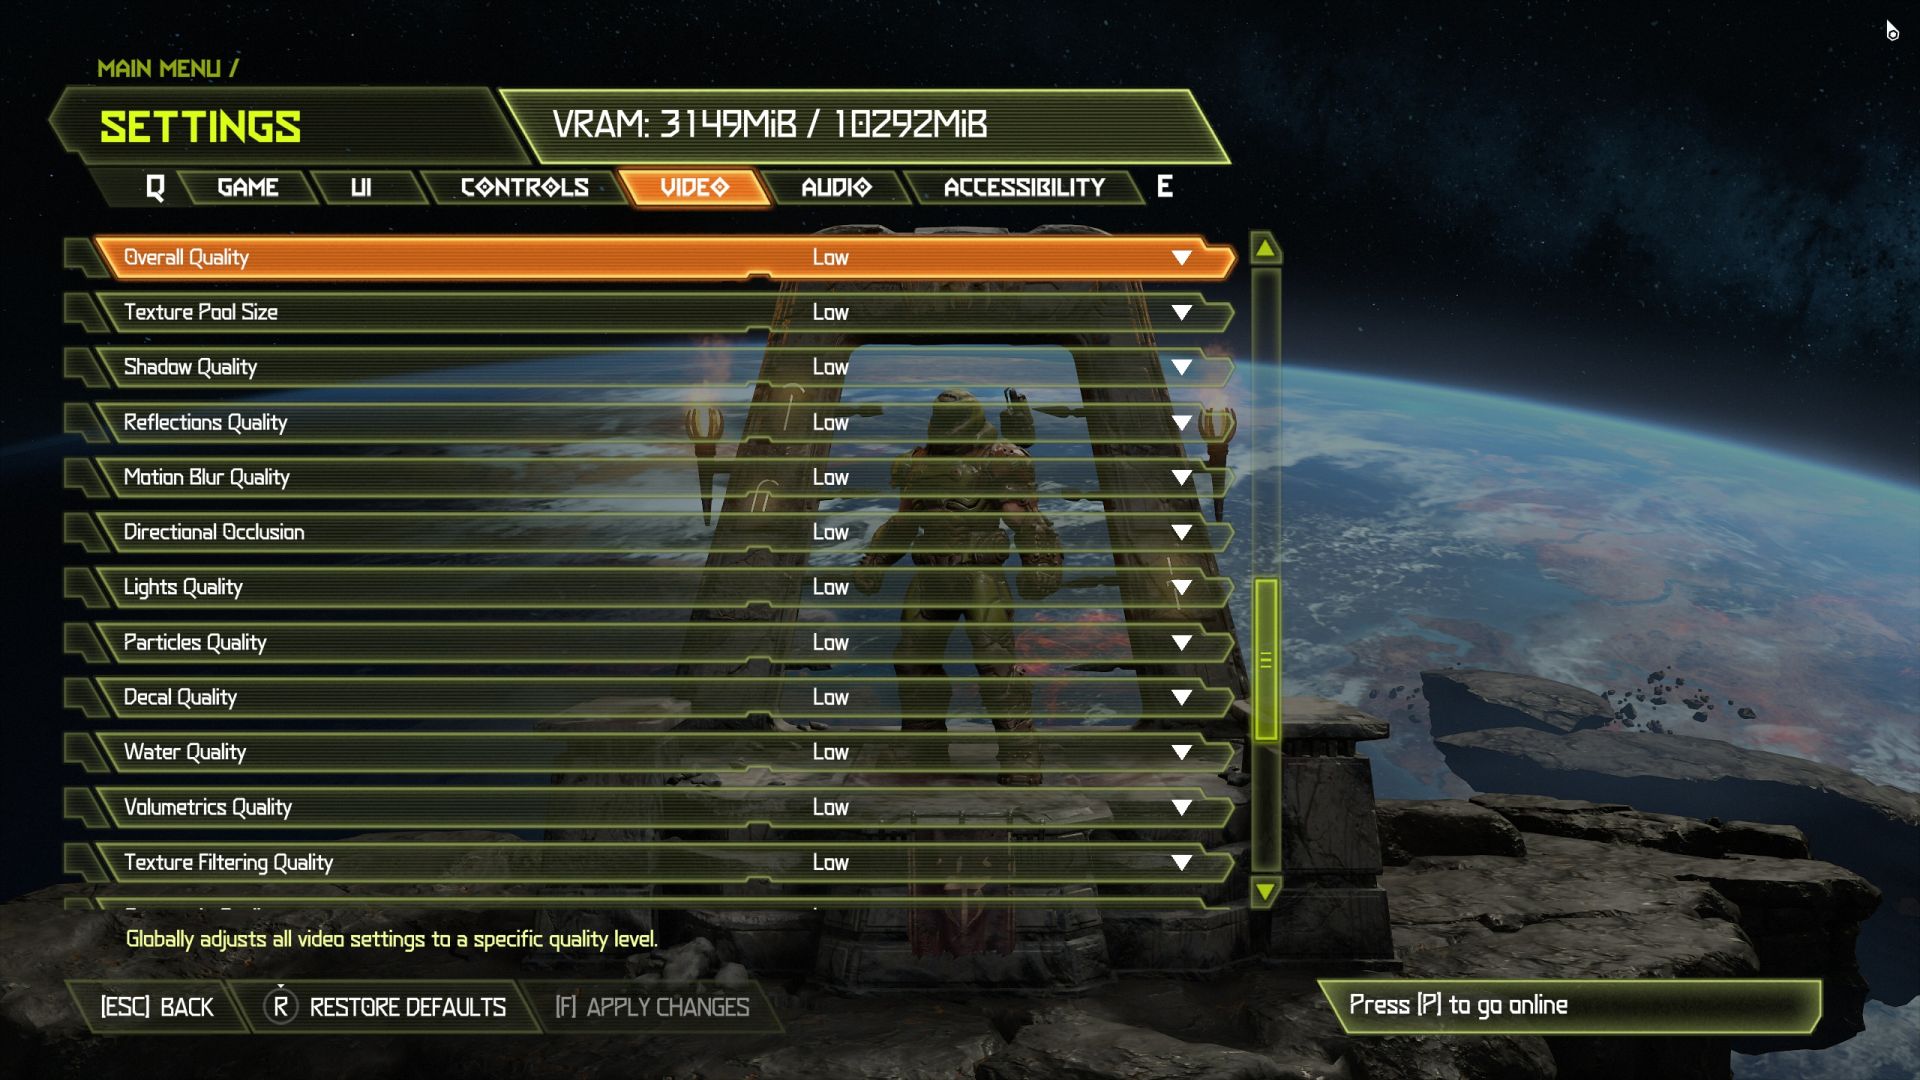
DOOM Eternal
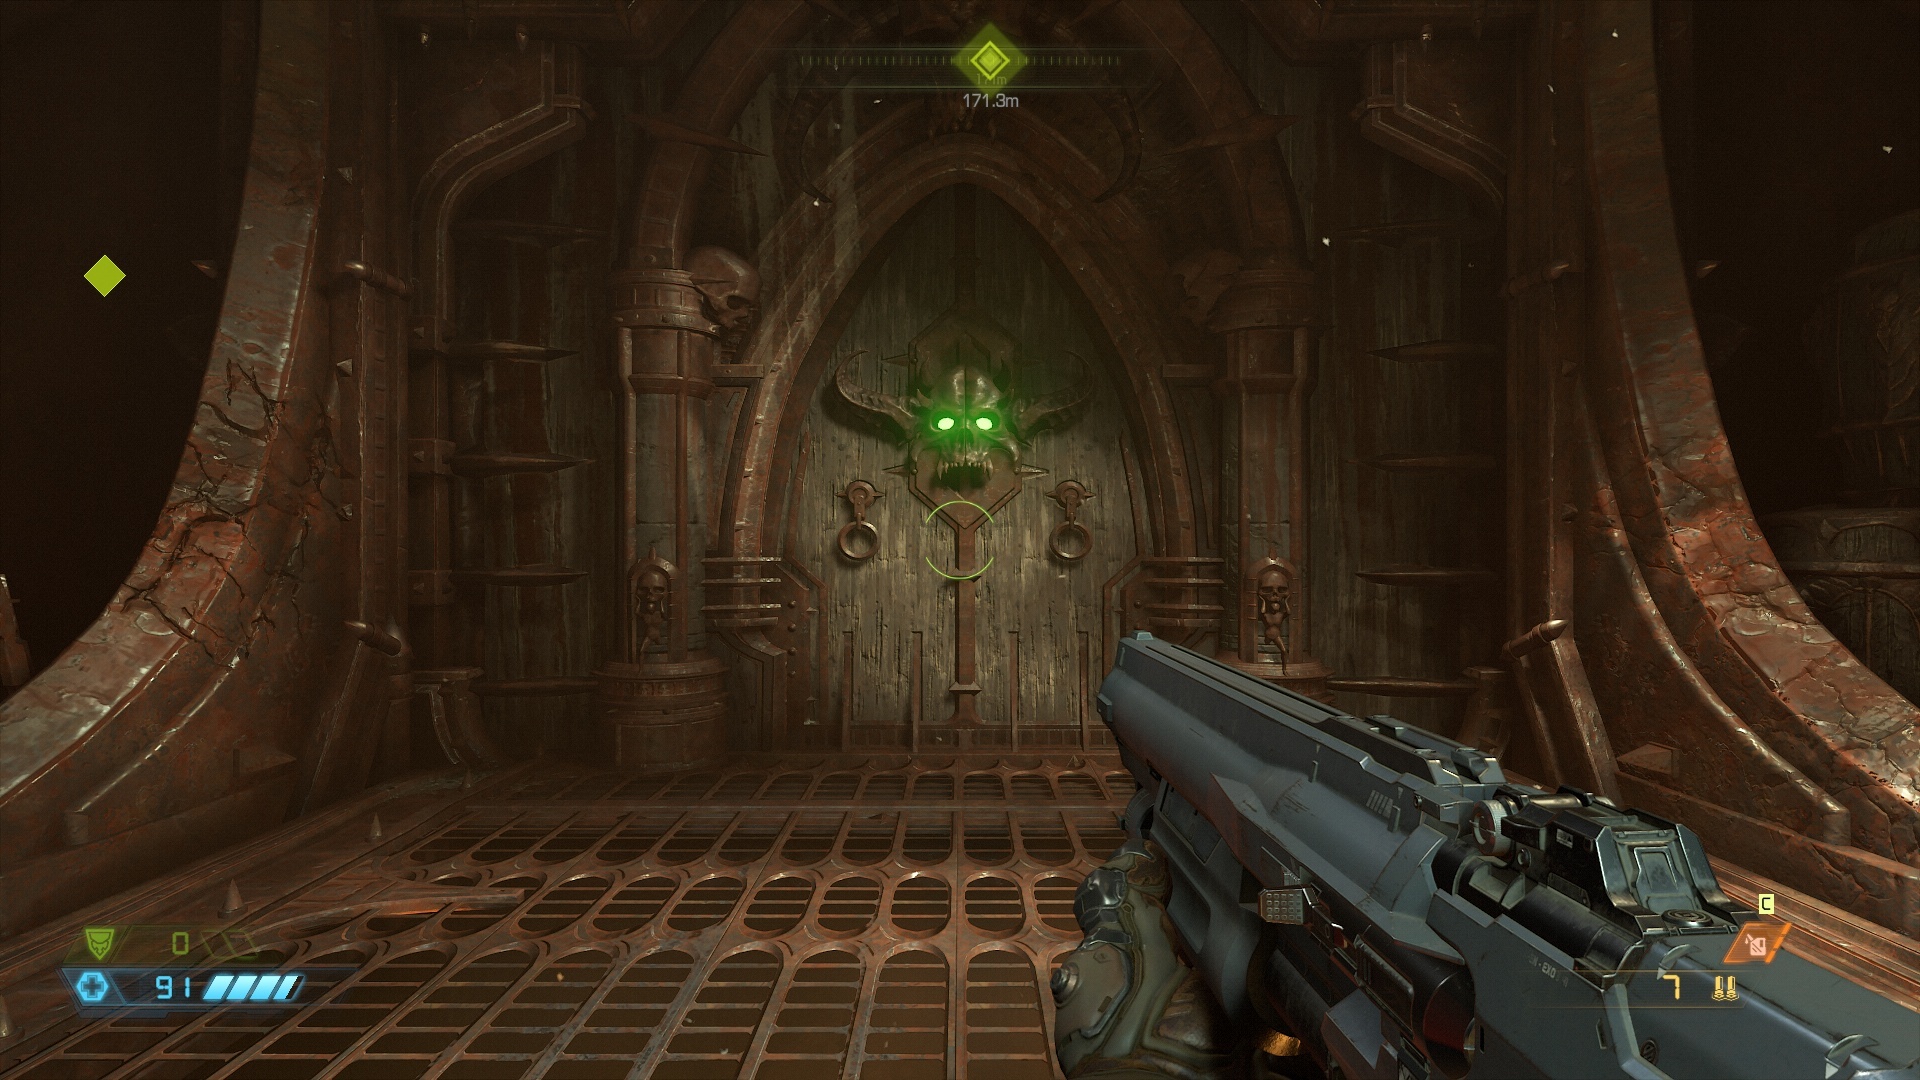
Test environment: resolution 1280 × 720 px; graphics settings preset Low; API Vulkan; extra settings Present From Compute: off, Motion Blur: Low, Depth of Field Anti-Aliasing: off; test scene: custom.
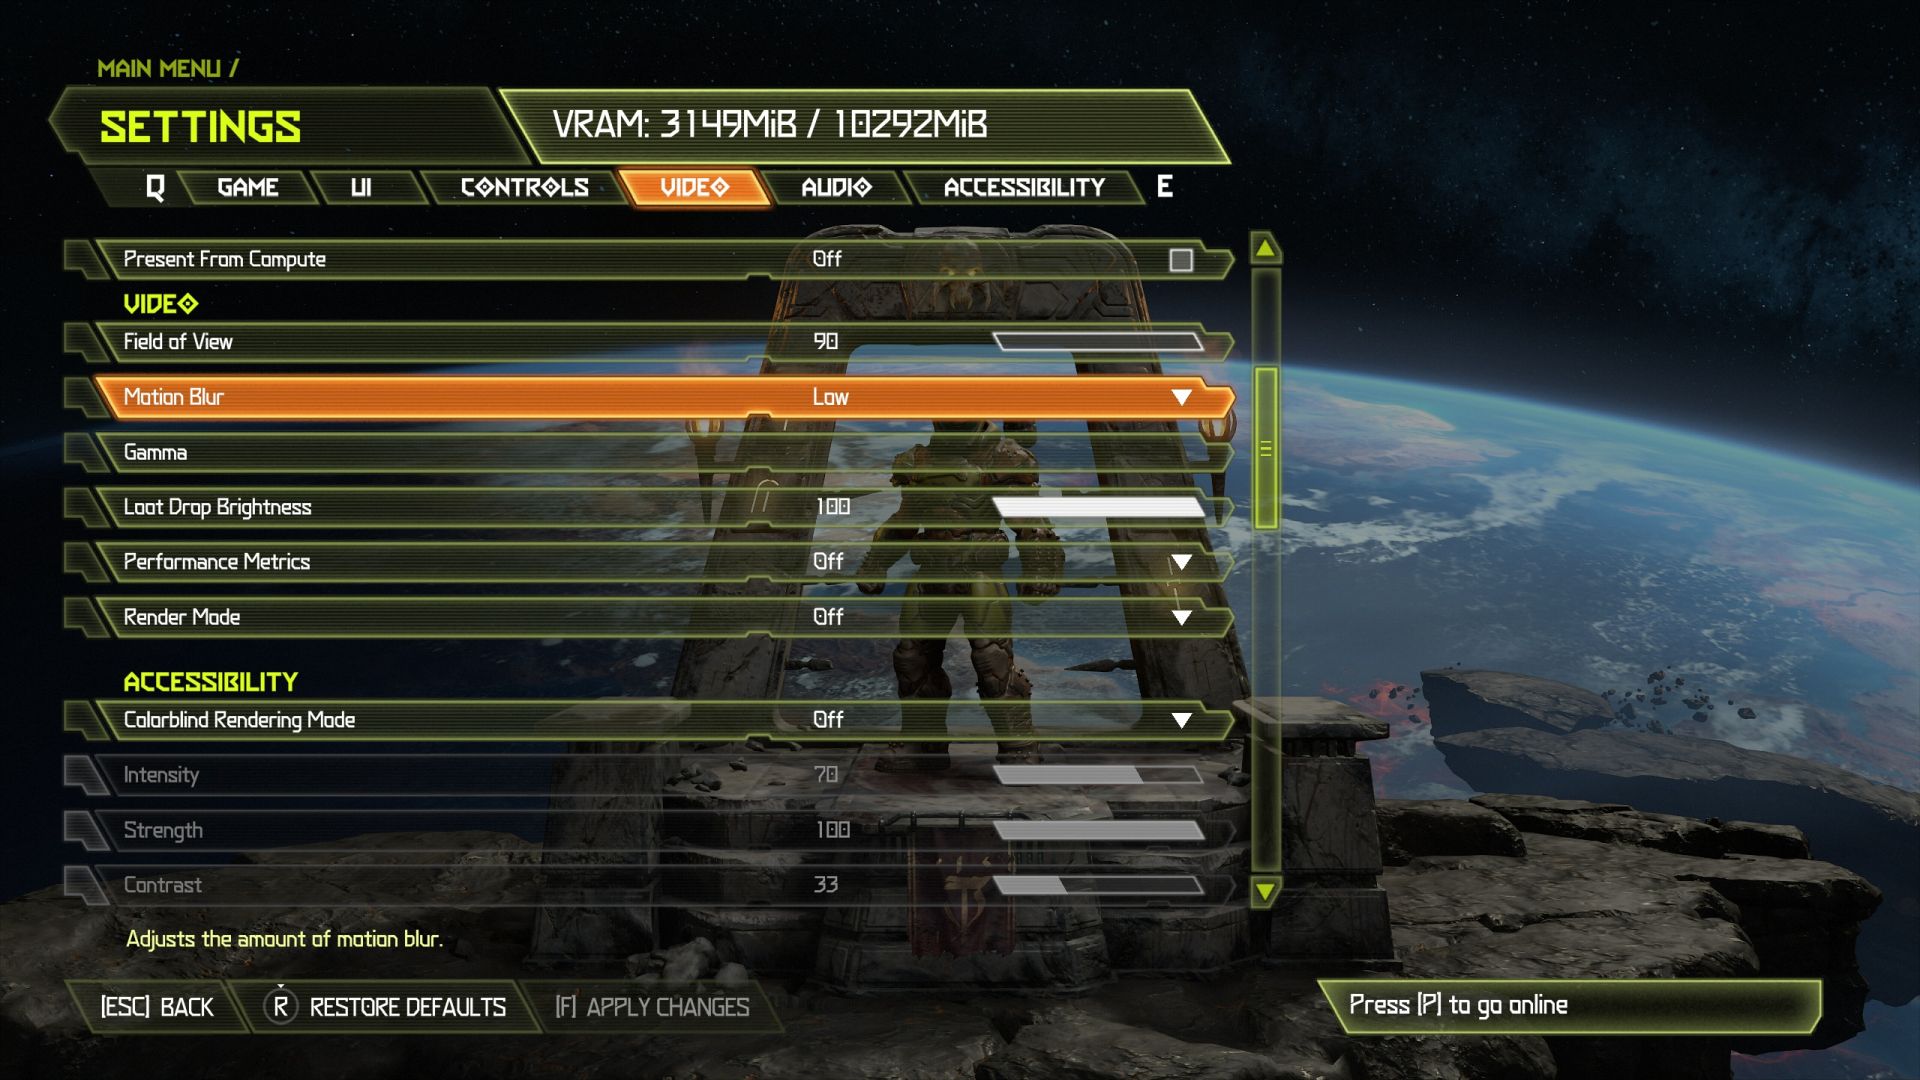
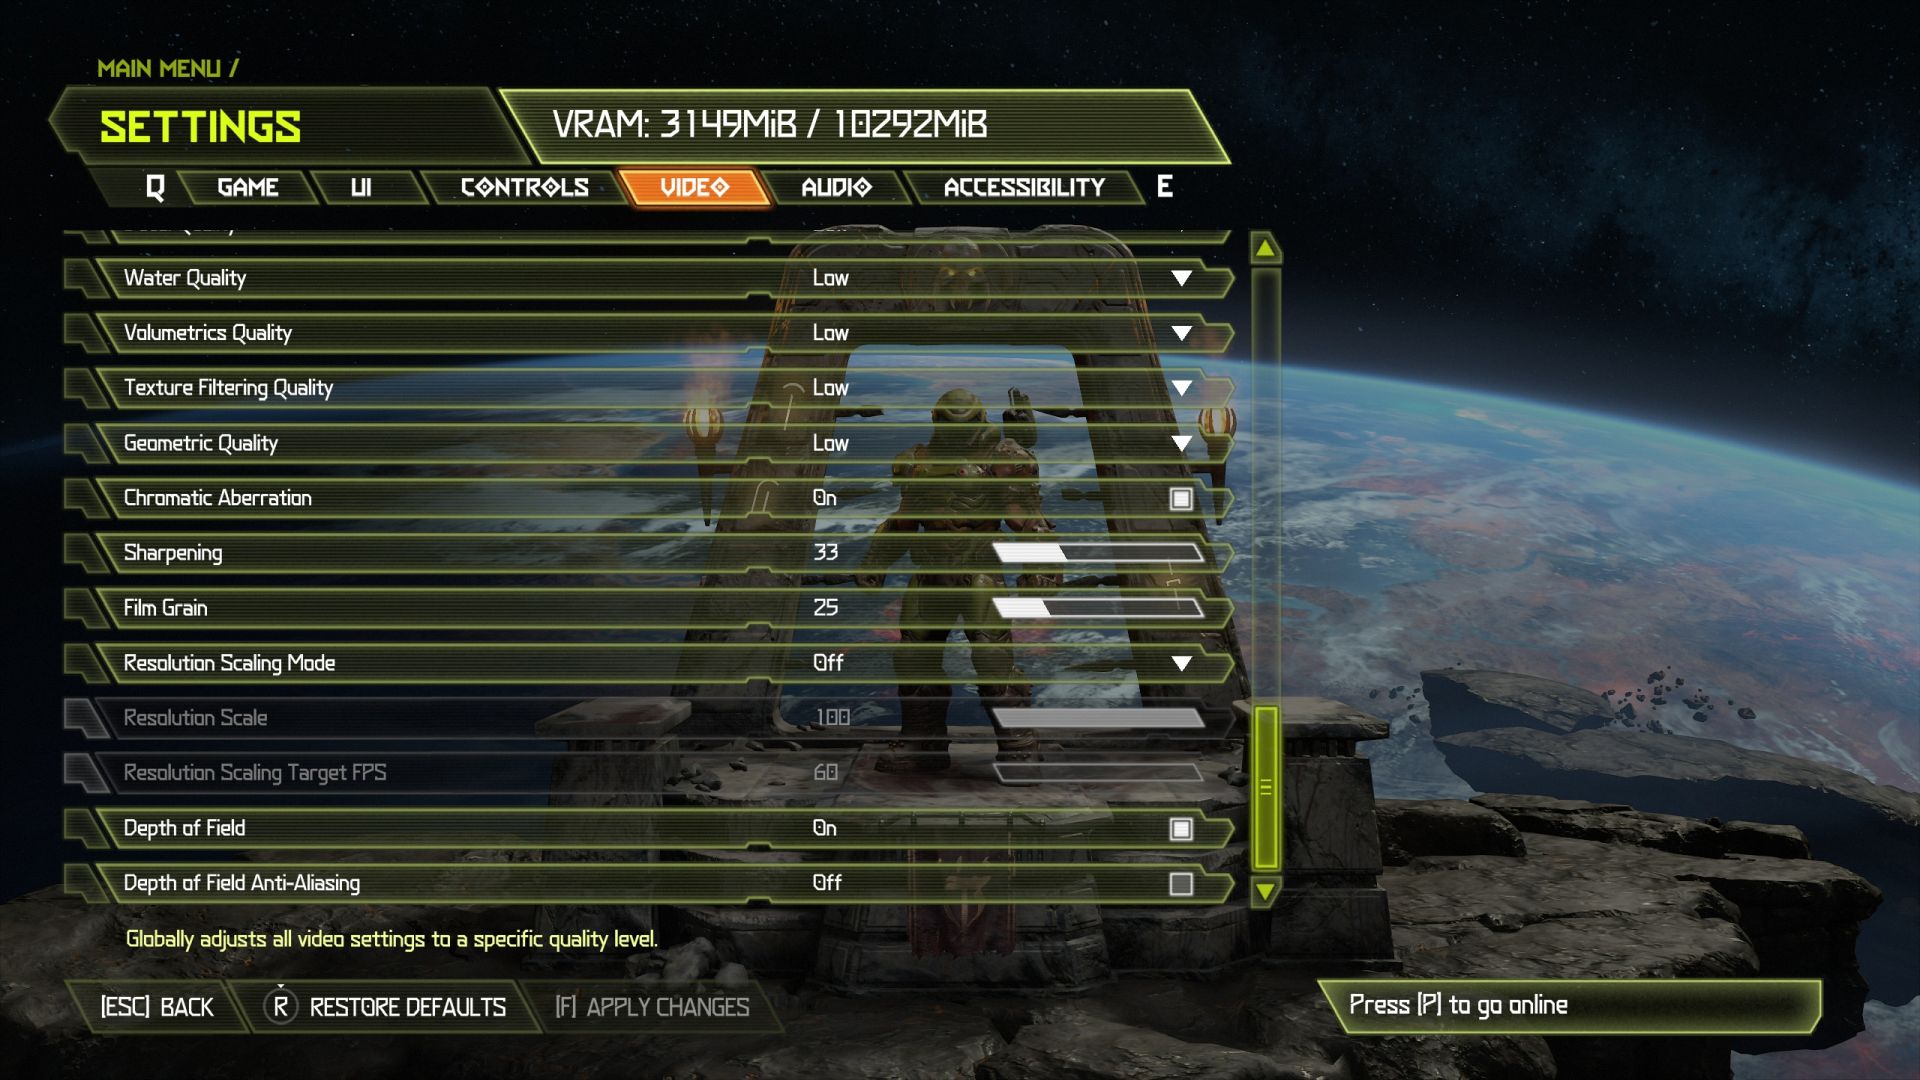
Test environment: resolution 1920 × 1080 px; graphics settings preset High; API Vulkan; extra settings Present From Compute: on, Motion Blur: High, Depth of Field Anti-Aliasing: off; test scene: custom.

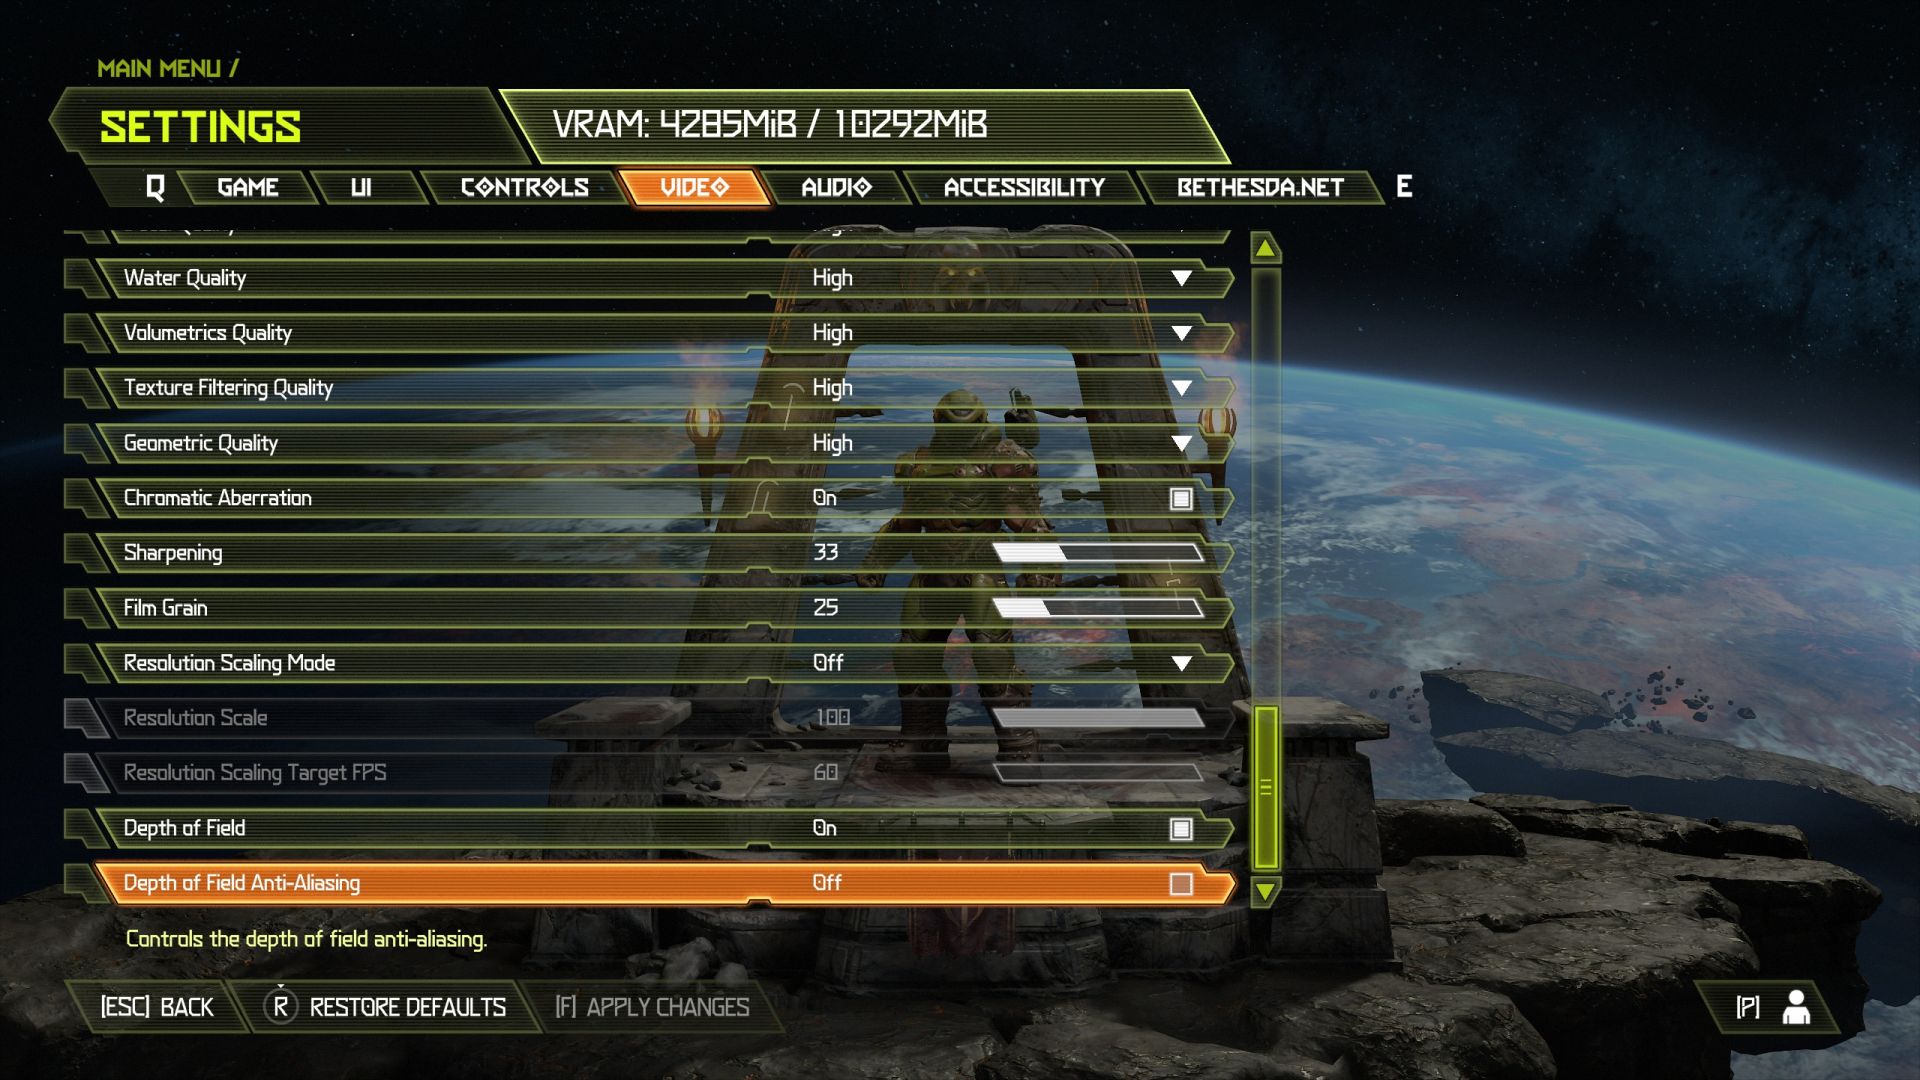
Test environment: resolution 2560 × 1440 px; graphics settings preset High; API Vulkan; extra settings Present From Compute: on, Motion Blur: High, Depth of Field Anti-Aliasing: on; test scene: custom.

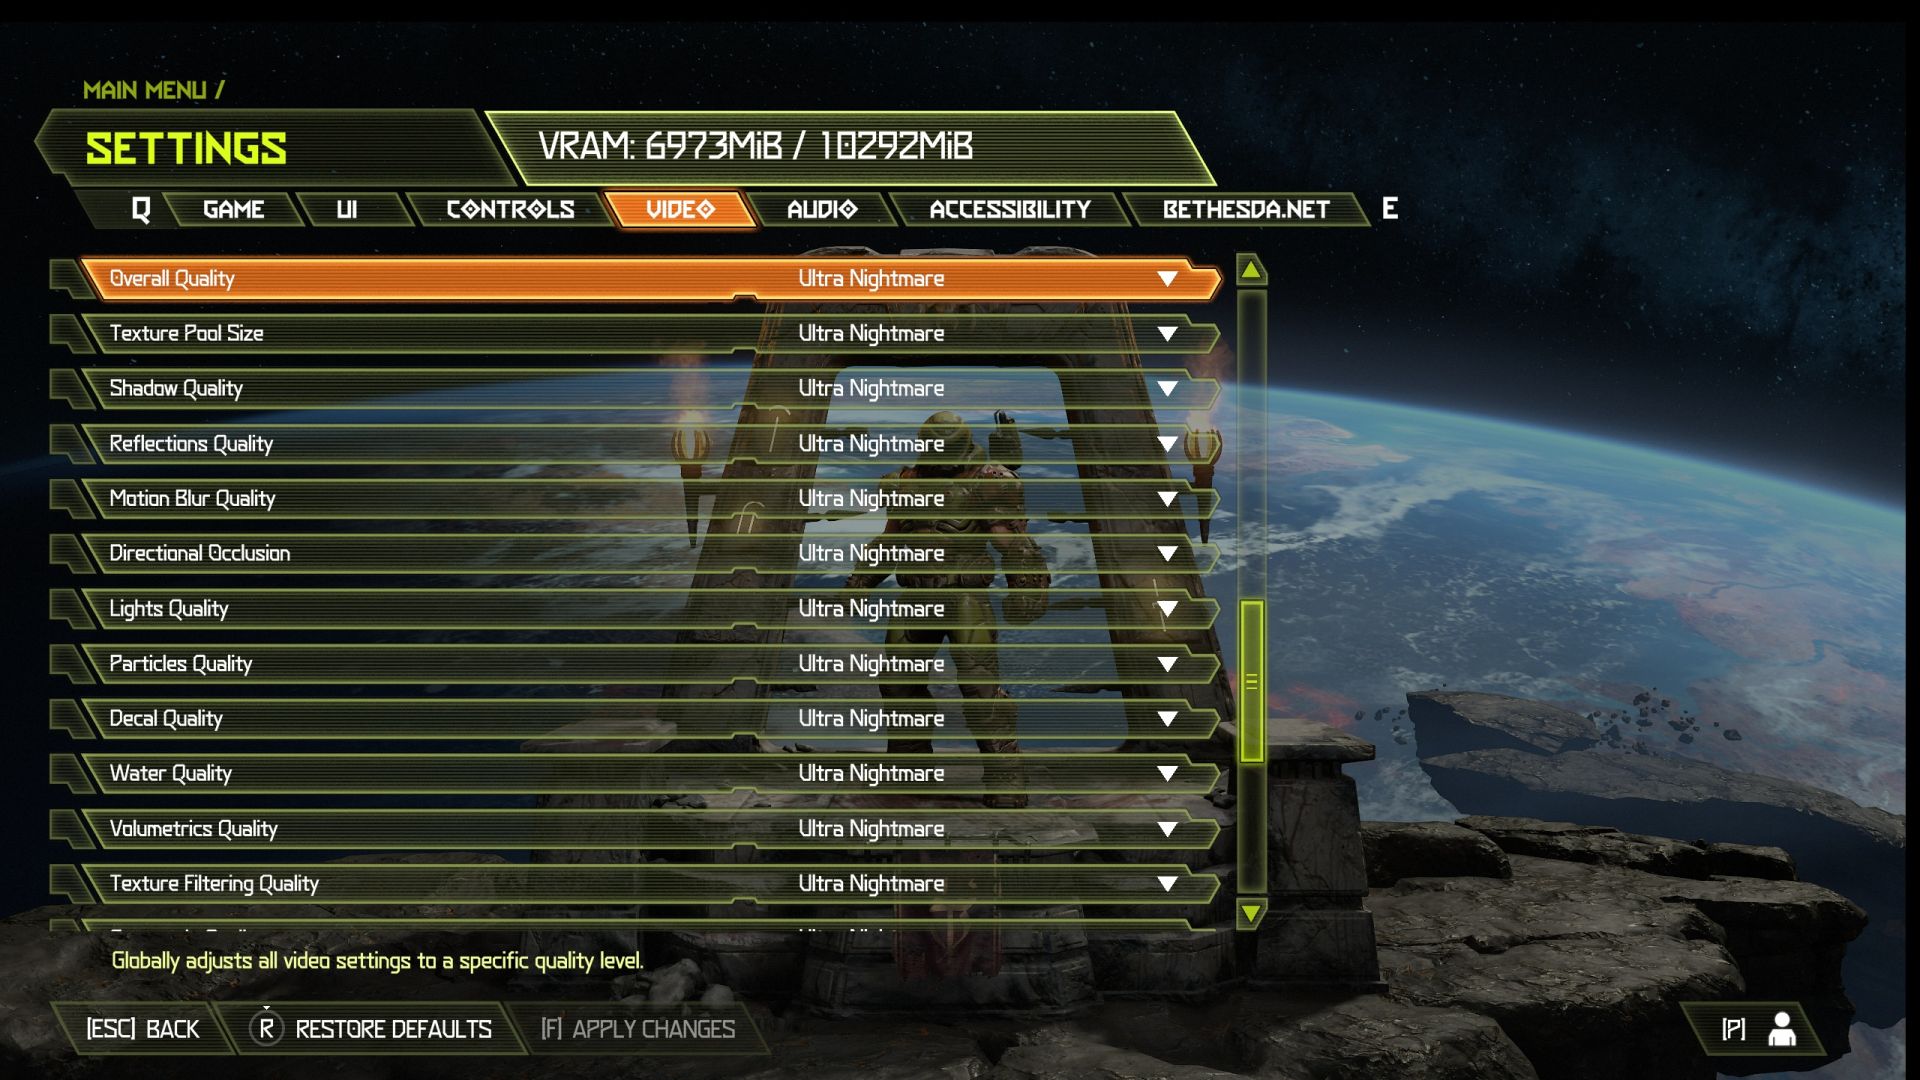
Test environment: resolution 3840 × 2160 px; graphics settings preset Ultra Nightmare; API Vulkan; extra settings Present From Compute: on, Motion Blur: High, Depth of Field Anti-Aliasing: on; test scene: custom.


For completeness of Intel Core i5-14400F processor tests we add the results of its second stepping. We’ve already tested the B0 variant, now it’s time for the C0. Its availability in stores is, at least at the moment, considerably worse and the question arises whether it is worth it at all. Is there any point in aiming for stepping C0 or is B0 also “okay”? Or does it “not matter” (what you get in the shopping lottery)?
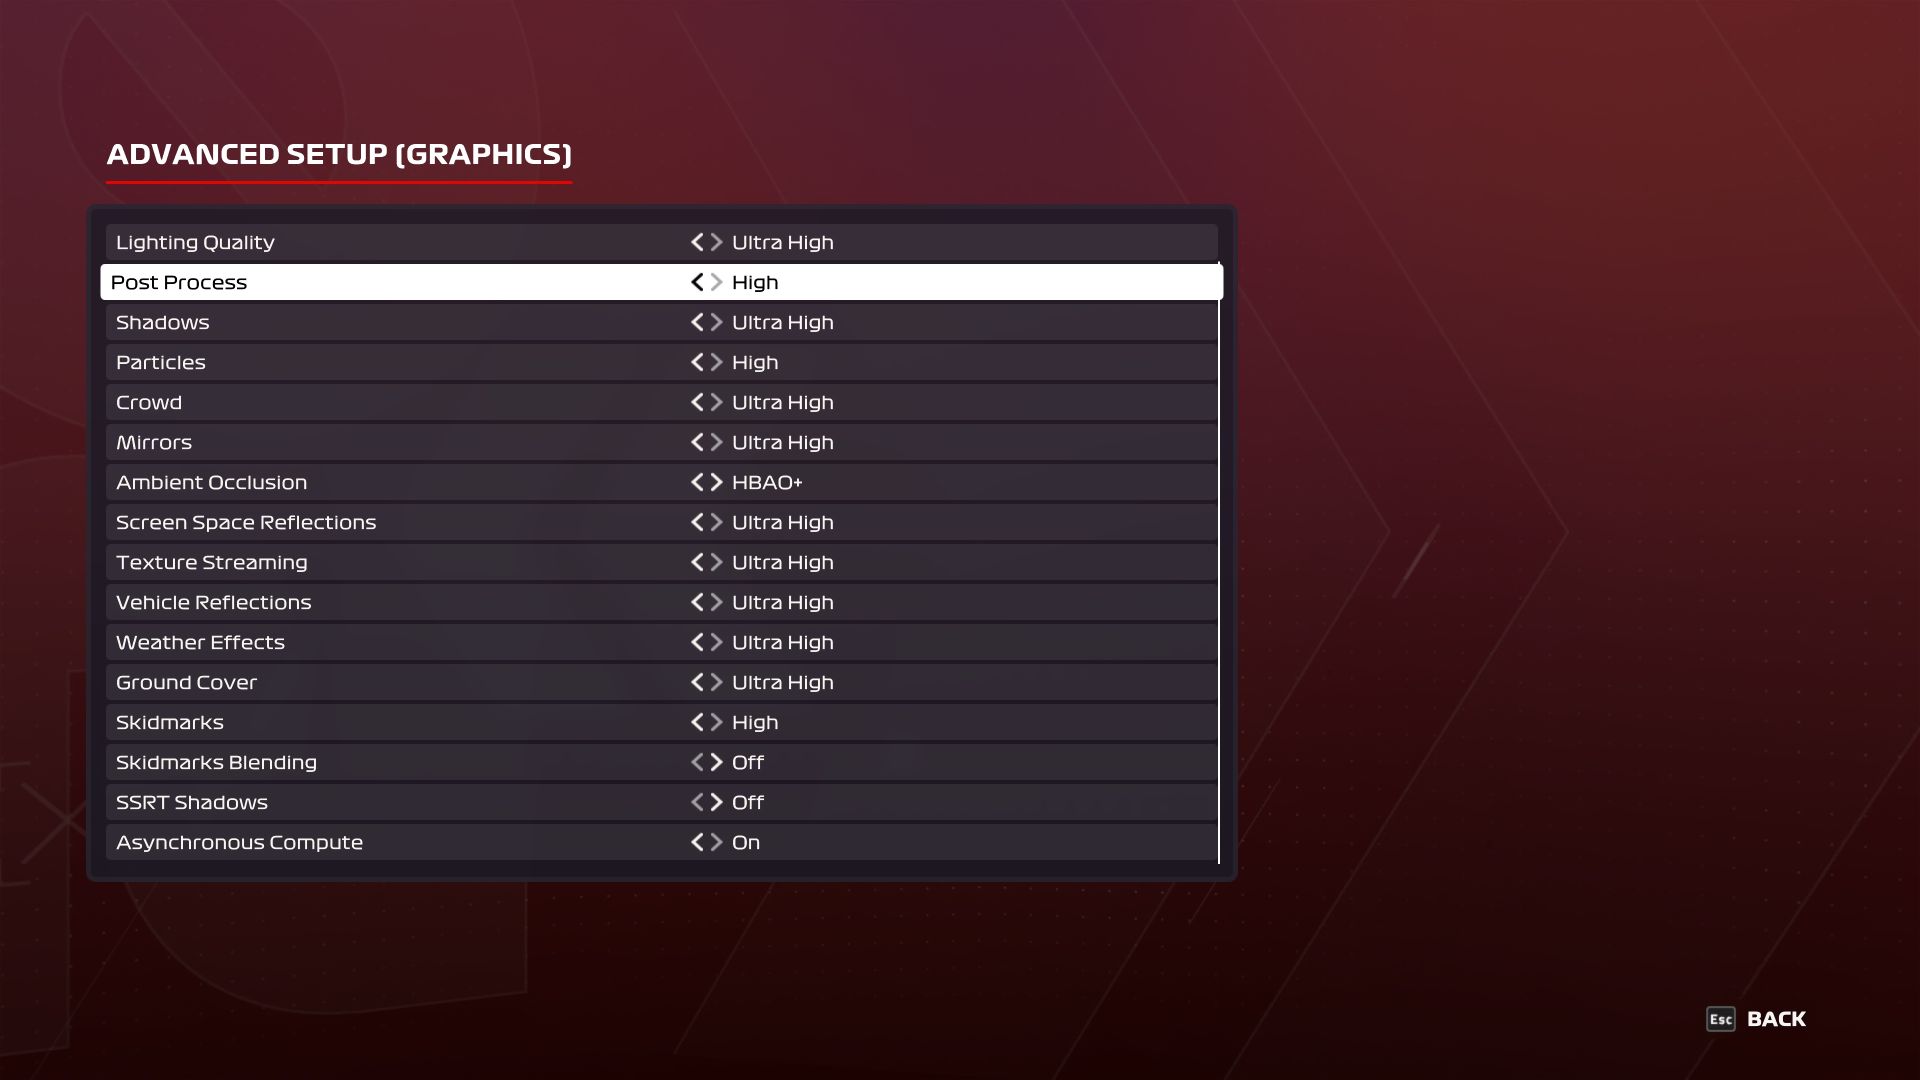
F1 2020
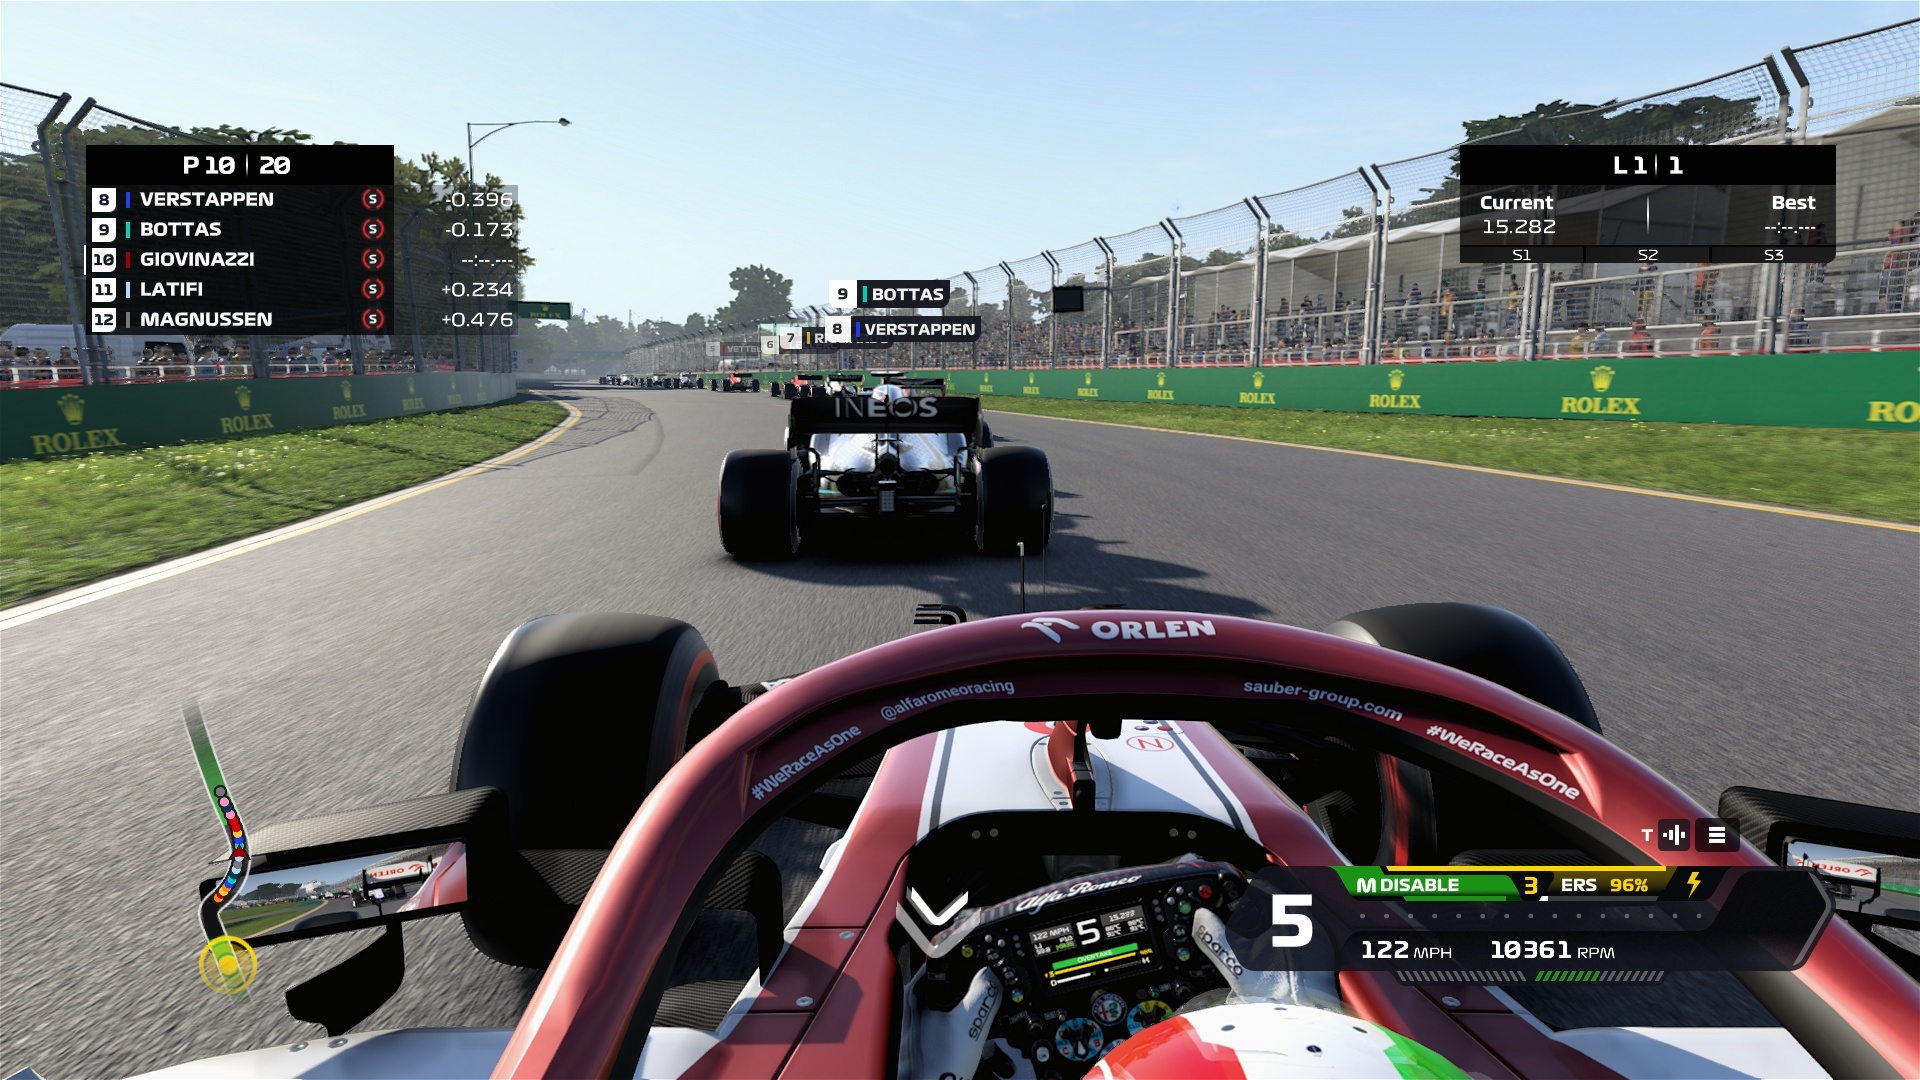
Test environment: resolution 1280 × 720 px; graphics settings preset Ultra Low; API DirectX 12; extra settings Anti-Aliasing: off, Anisotropic Filtering: off; test scene: built-in benchmark (Australia, Clear/Dry, Cycle).
Test environment: resolution 1920 × 1080 px; graphics settings preset High; API DirectX 12; extra settings Anti-Aliasing: off, Skidmarks Blending: off; test scene: built-in benchmark (Australia, Clear/Dry, Cycle).
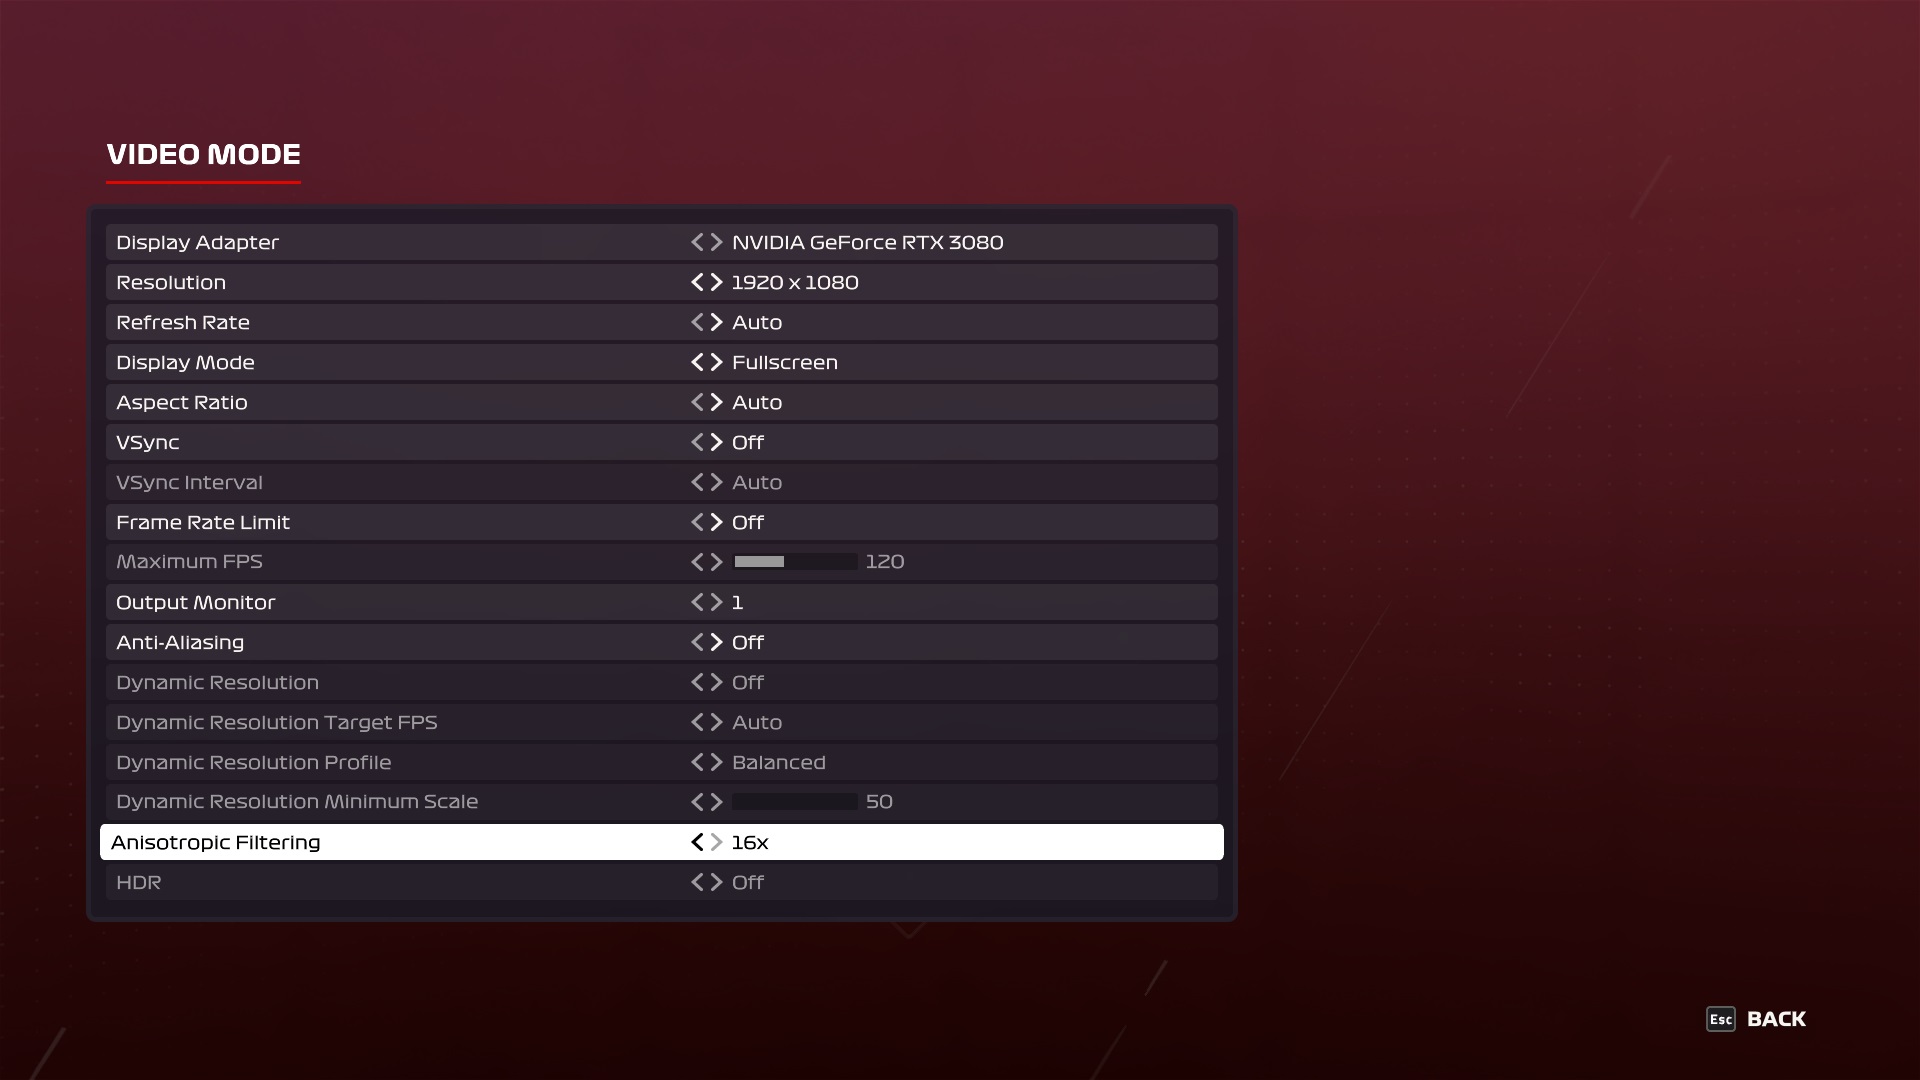
Test environment: resolution 2560 × 1440 px; graphics settings preset High; API DirectX 12; extra settings Anti-Aliasing: TAA, Skidmarks Blending: off; test scene: built-in benchmark (Australia, Clear/Dry, Cycle).
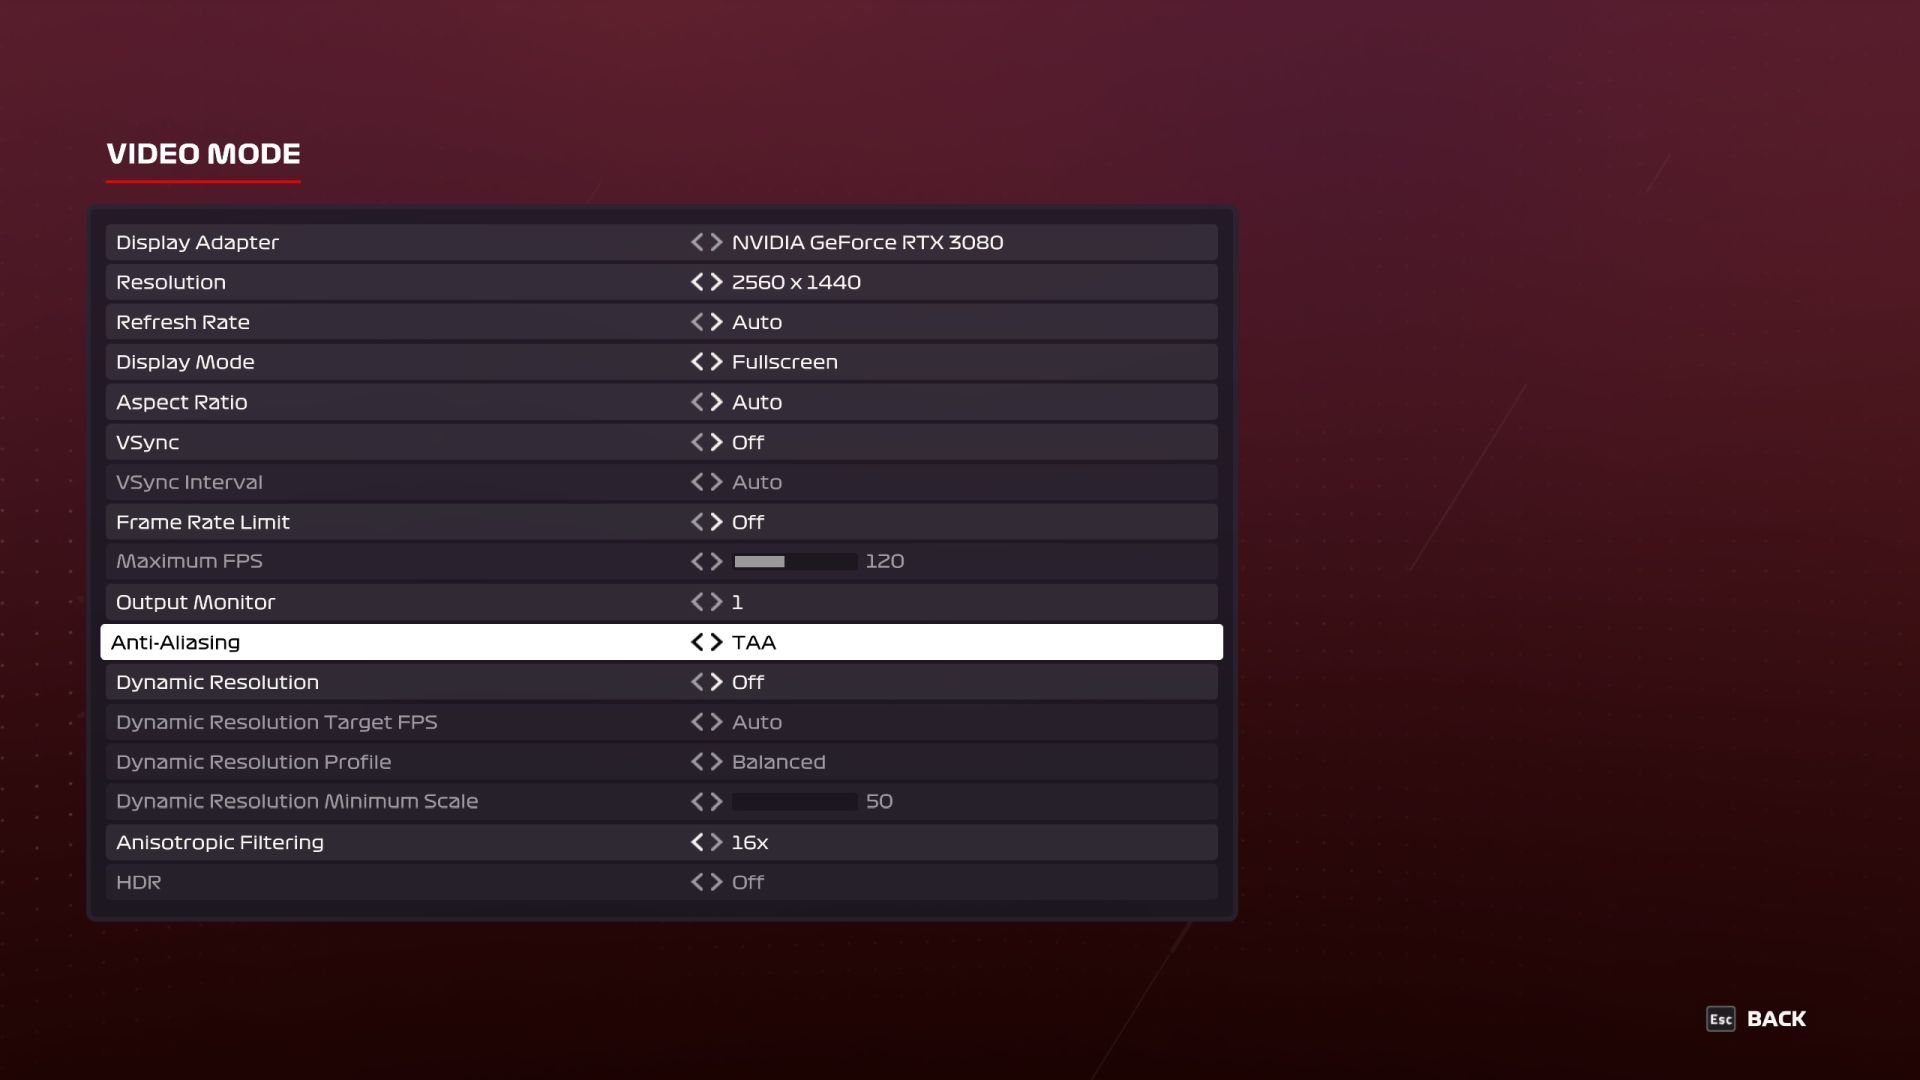
Test environment: resolution 3840 × 2160 px; graphics settings preset Ultra High; API DirectX 12; extra settings Anti-Aliasing: TAA, Skidmarks Blending: off; test scene: built-in benchmark (Australia, Clear/Dry, Cycle).
For completeness of Intel Core i5-14400F processor tests we add the results of its second stepping. We’ve already tested the B0 variant, now it’s time for the C0. Its availability in stores is, at least at the moment, considerably worse and the question arises whether it is worth it at all. Is there any point in aiming for stepping C0 or is B0 also “okay”? Or does it “not matter” (what you get in the shopping lottery)?
Metro Exodus

Test environment: resolution 1280 × 720 px; graphics settings preset Low; API DirectX 12; no extra settings test scene: built-in benchmark.

Test environment: resolution 1920 × 1080 px; graphics settings preset High; API DirectX 12; no extra settings; test scene: built-in benchmark.

Test environment: resolution 2560 × 1440 px; graphics settings preset High; API DirectX 12; no extra settings; test scene: built-in benchmark.
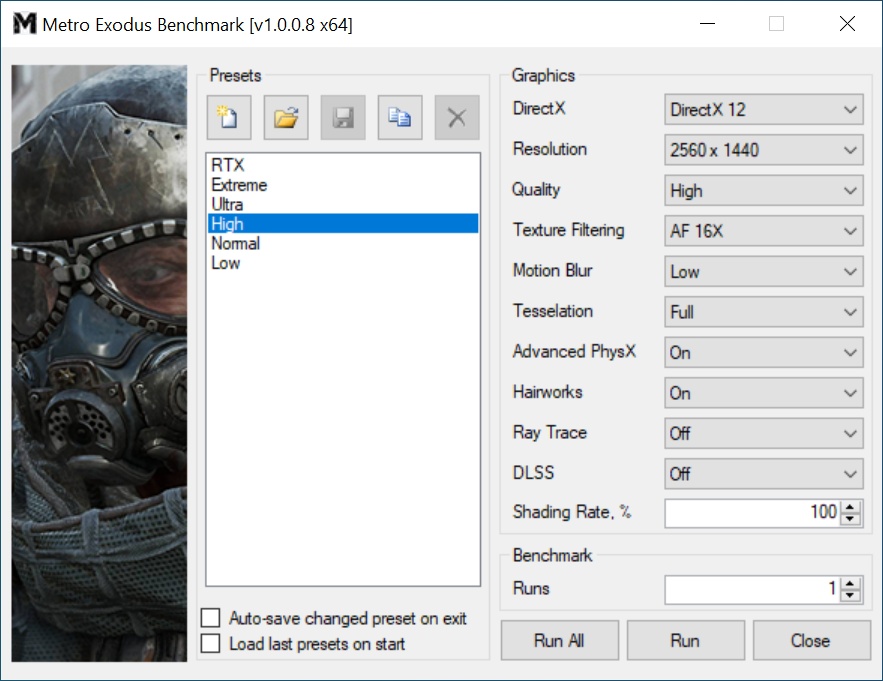
Test environment: resolution 3840 × 2160 px; graphics settings preset Extreme; API DirectX 12; no extra settings; test scene: built-in benchmark.

For completeness of Intel Core i5-14400F processor tests we add the results of its second stepping. We’ve already tested the B0 variant, now it’s time for the C0. Its availability in stores is, at least at the moment, considerably worse and the question arises whether it is worth it at all. Is there any point in aiming for stepping C0 or is B0 also “okay”? Or does it “not matter” (what you get in the shopping lottery)?
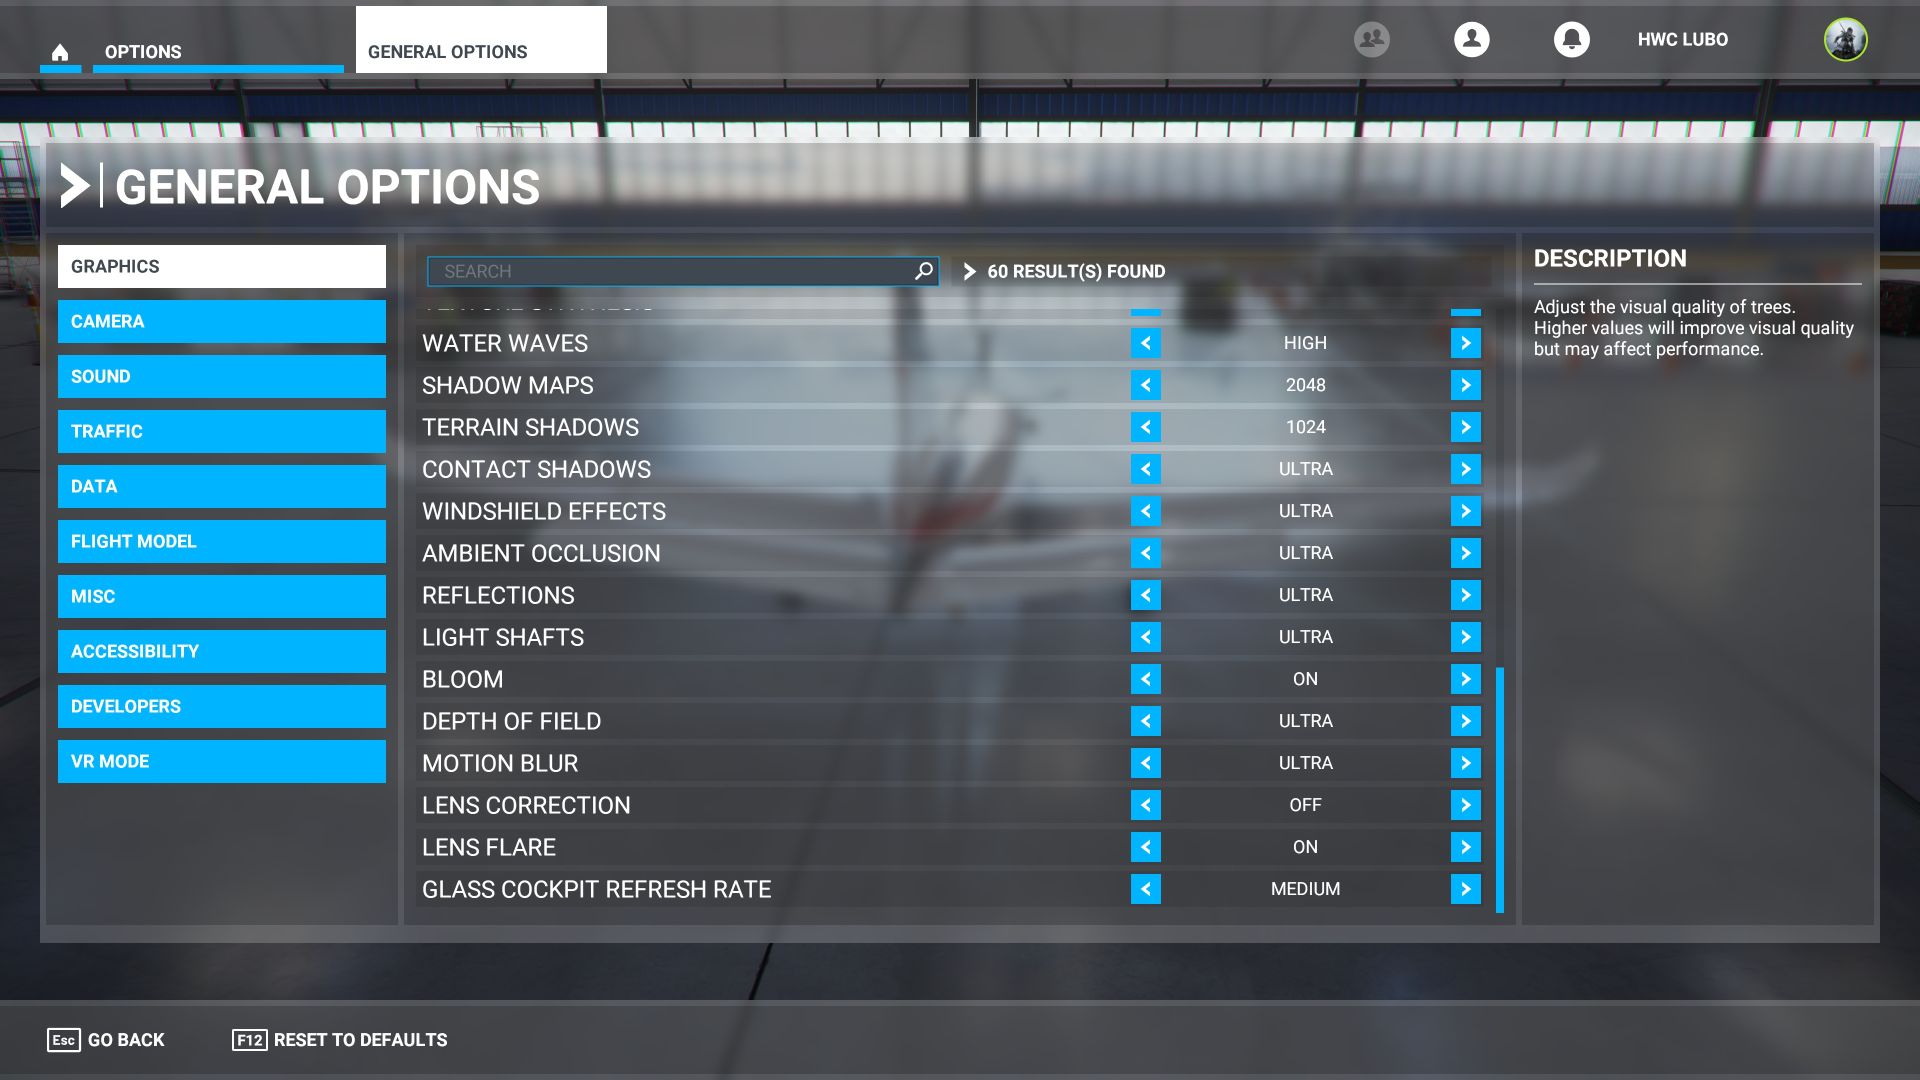
Microsoft Flight Simulator
Upozornenie: Výkon v tejto hre sa vplyvom priebežných aktualizácii často mení, zlepšuje. Konzistenciu výsledkov pred každým meraním overujeme re-testovávaním procesora Ryzen 7 5900X. Pri výraznejších odchýlkach staršie výsledky zahadzujeme a začíname databázu budovať odznova. Pre nekompletnosť výsledkov MFS nepoužívame pre výpočet priemerného herného výkonu procesorov.
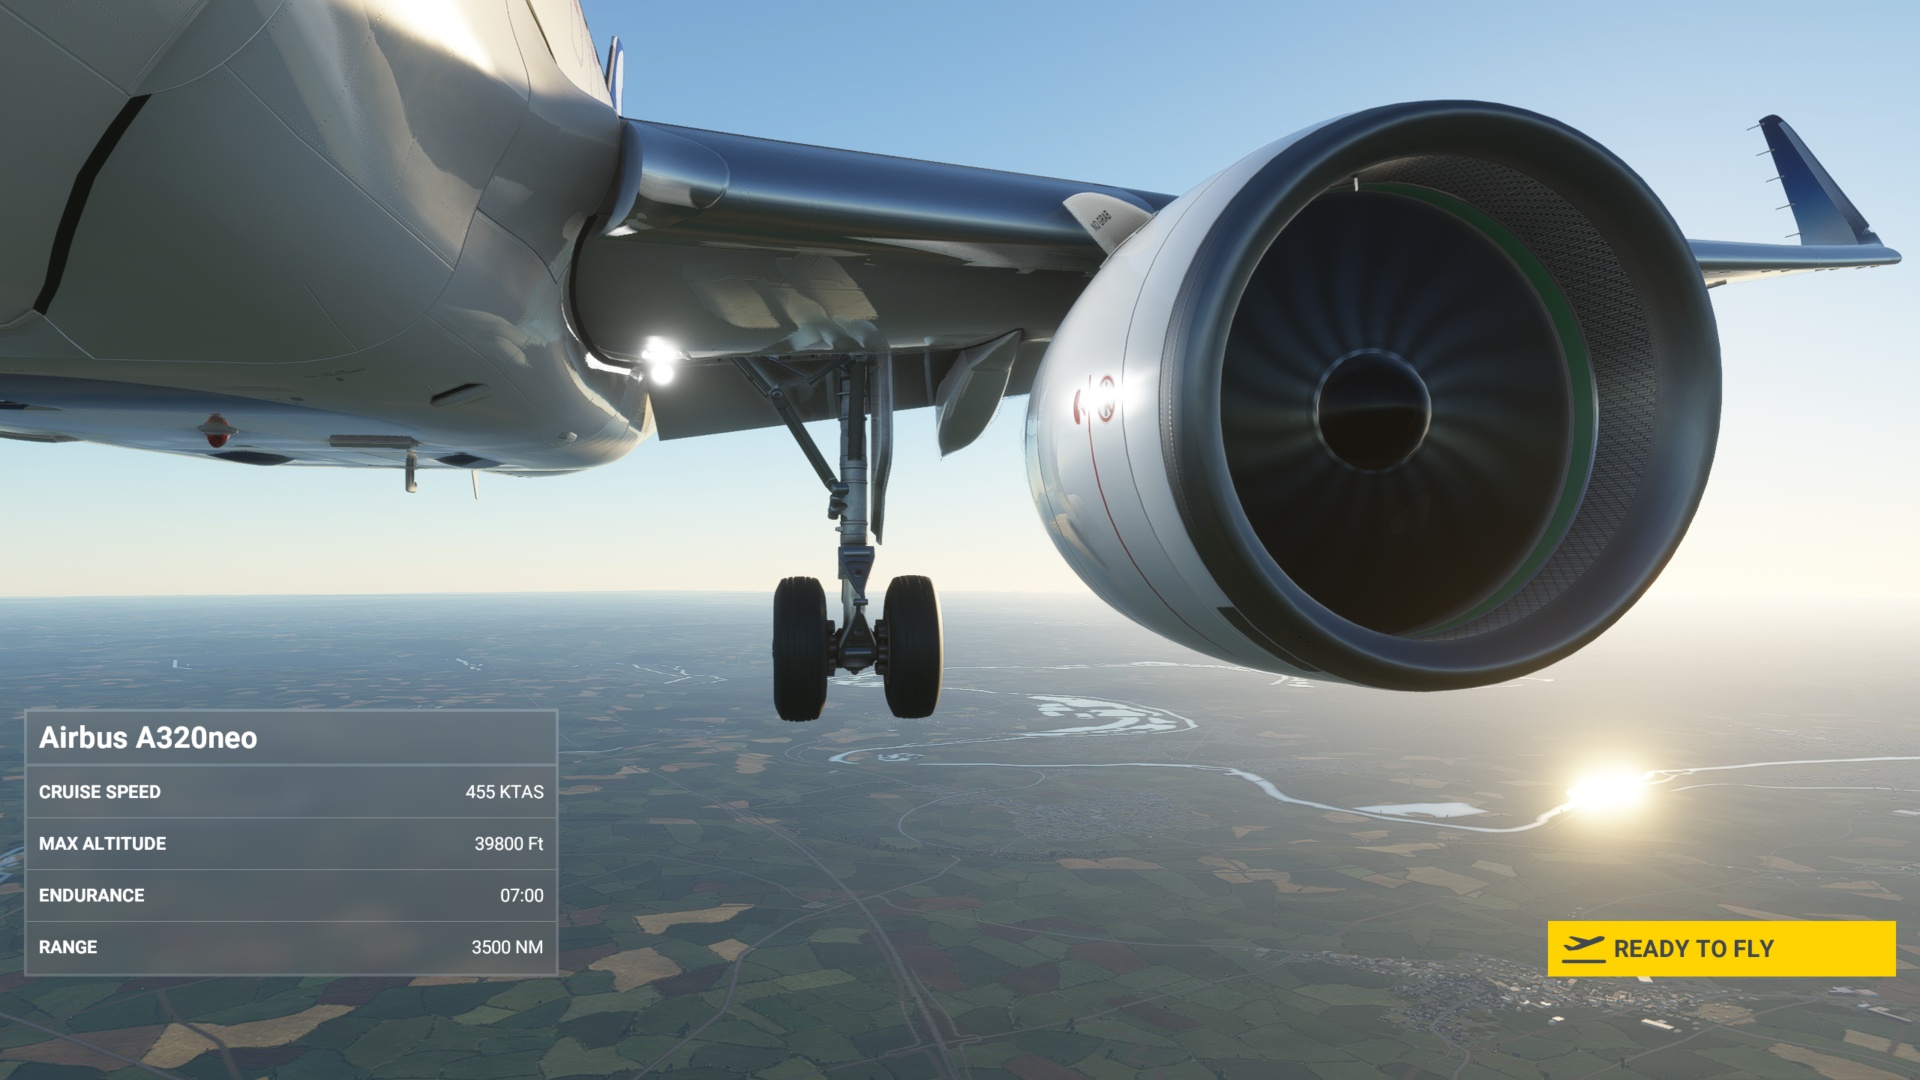
Test environment: resolution 1280 × 720 px; graphics settings preset Low; API DirectX 11; extra settings Anti-Aliasing: off; test scene: custom (Paris-Charles de Gaulle, Air Traffic: AI, February 14, 9:00) autopilot: from 1000 m until hitting the terrain.
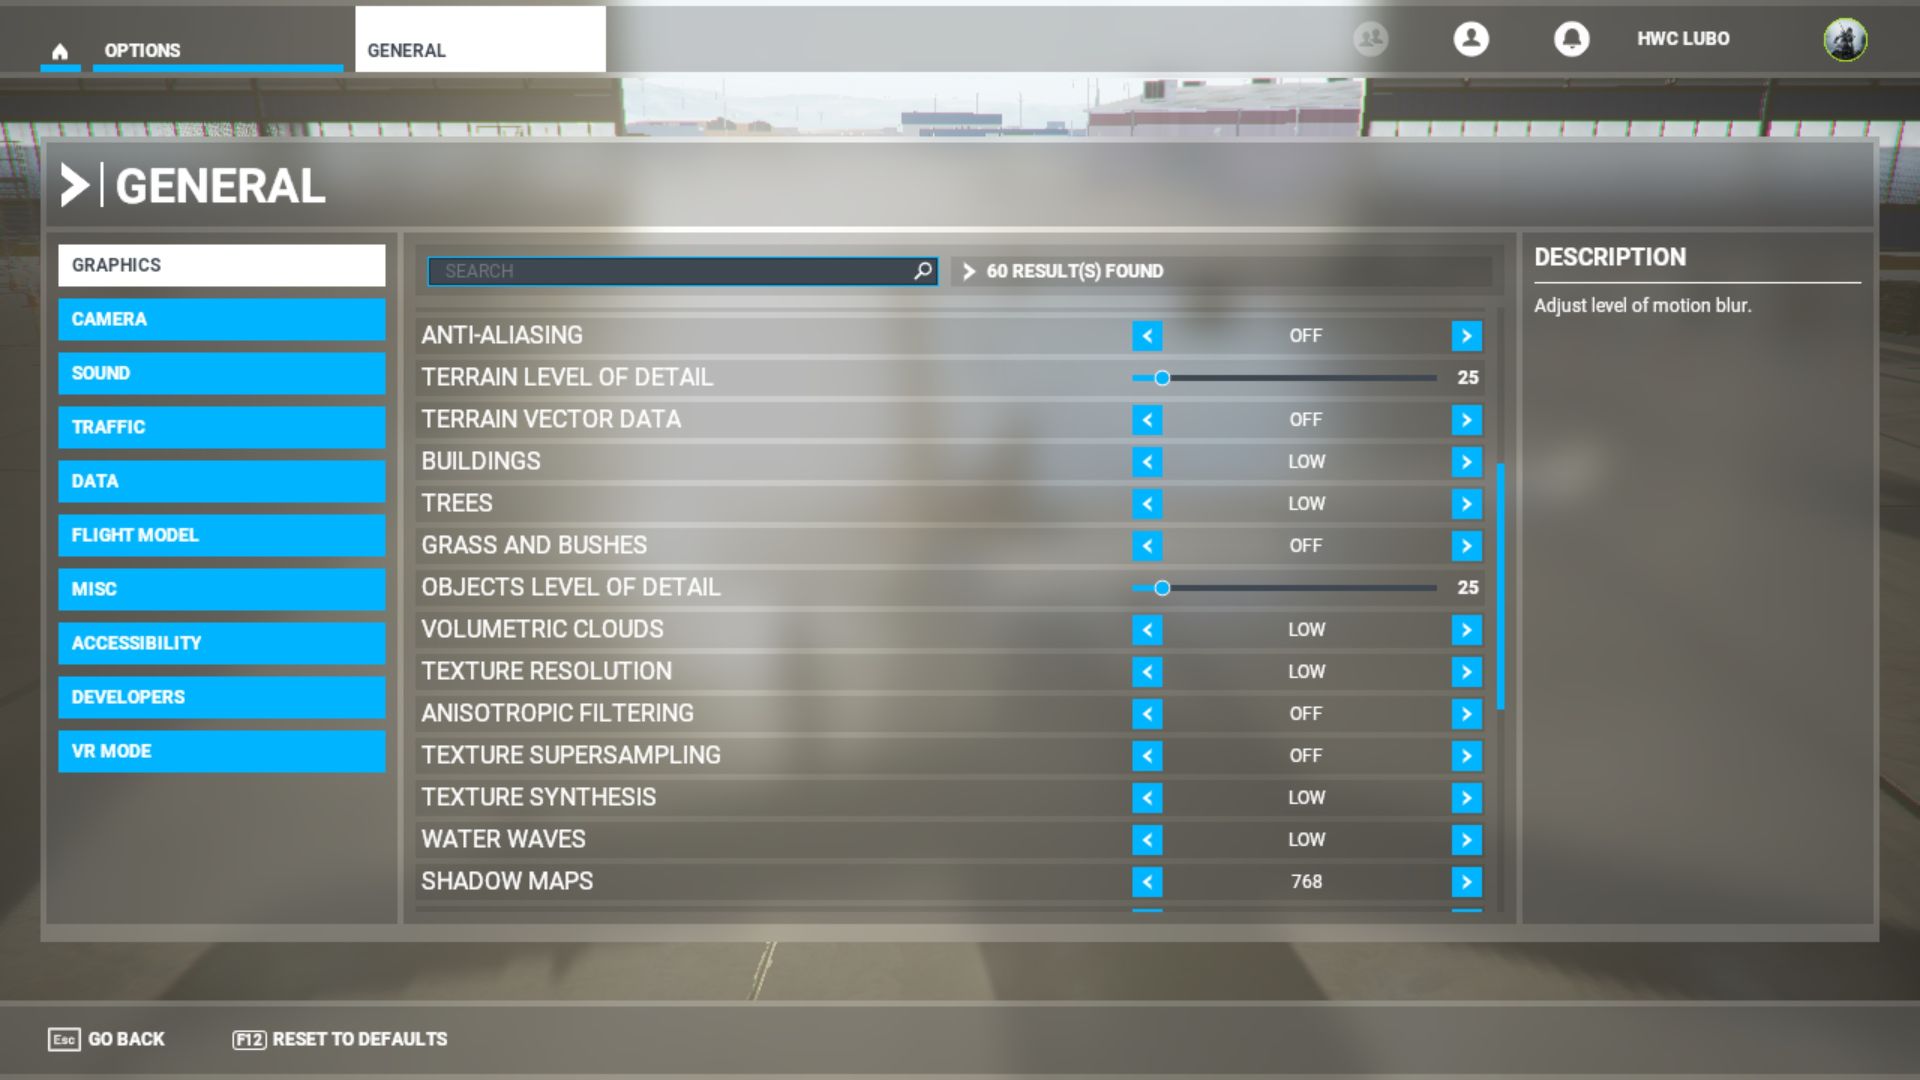

Test environment: resolution 1920 × 1080 px; graphics settings preset Low; API DirectX 11; extra settings Anti-Aliasing: off; test scene: custom (Paris-Charles de Gaulle, Air Traffic: AI, February 14, 9:00) autopilot: from 1000 m until hitting the terrain.
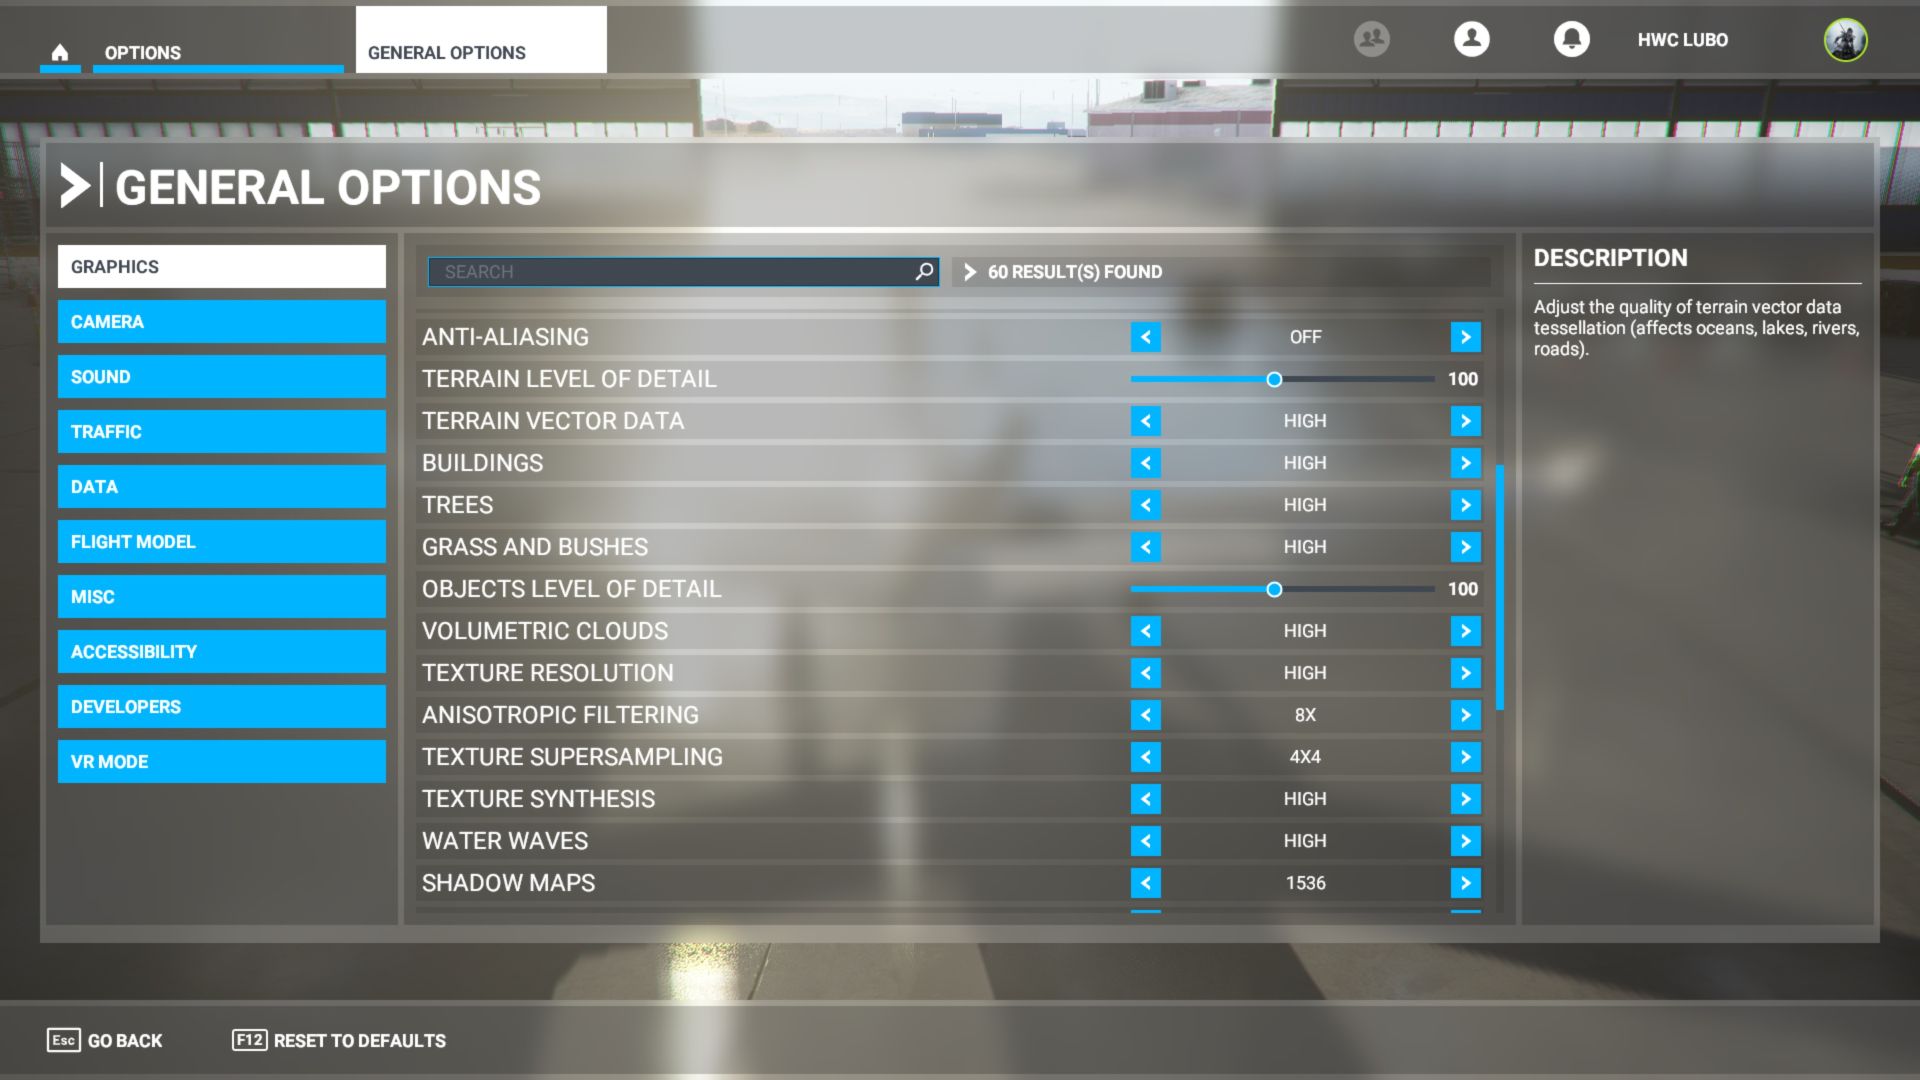
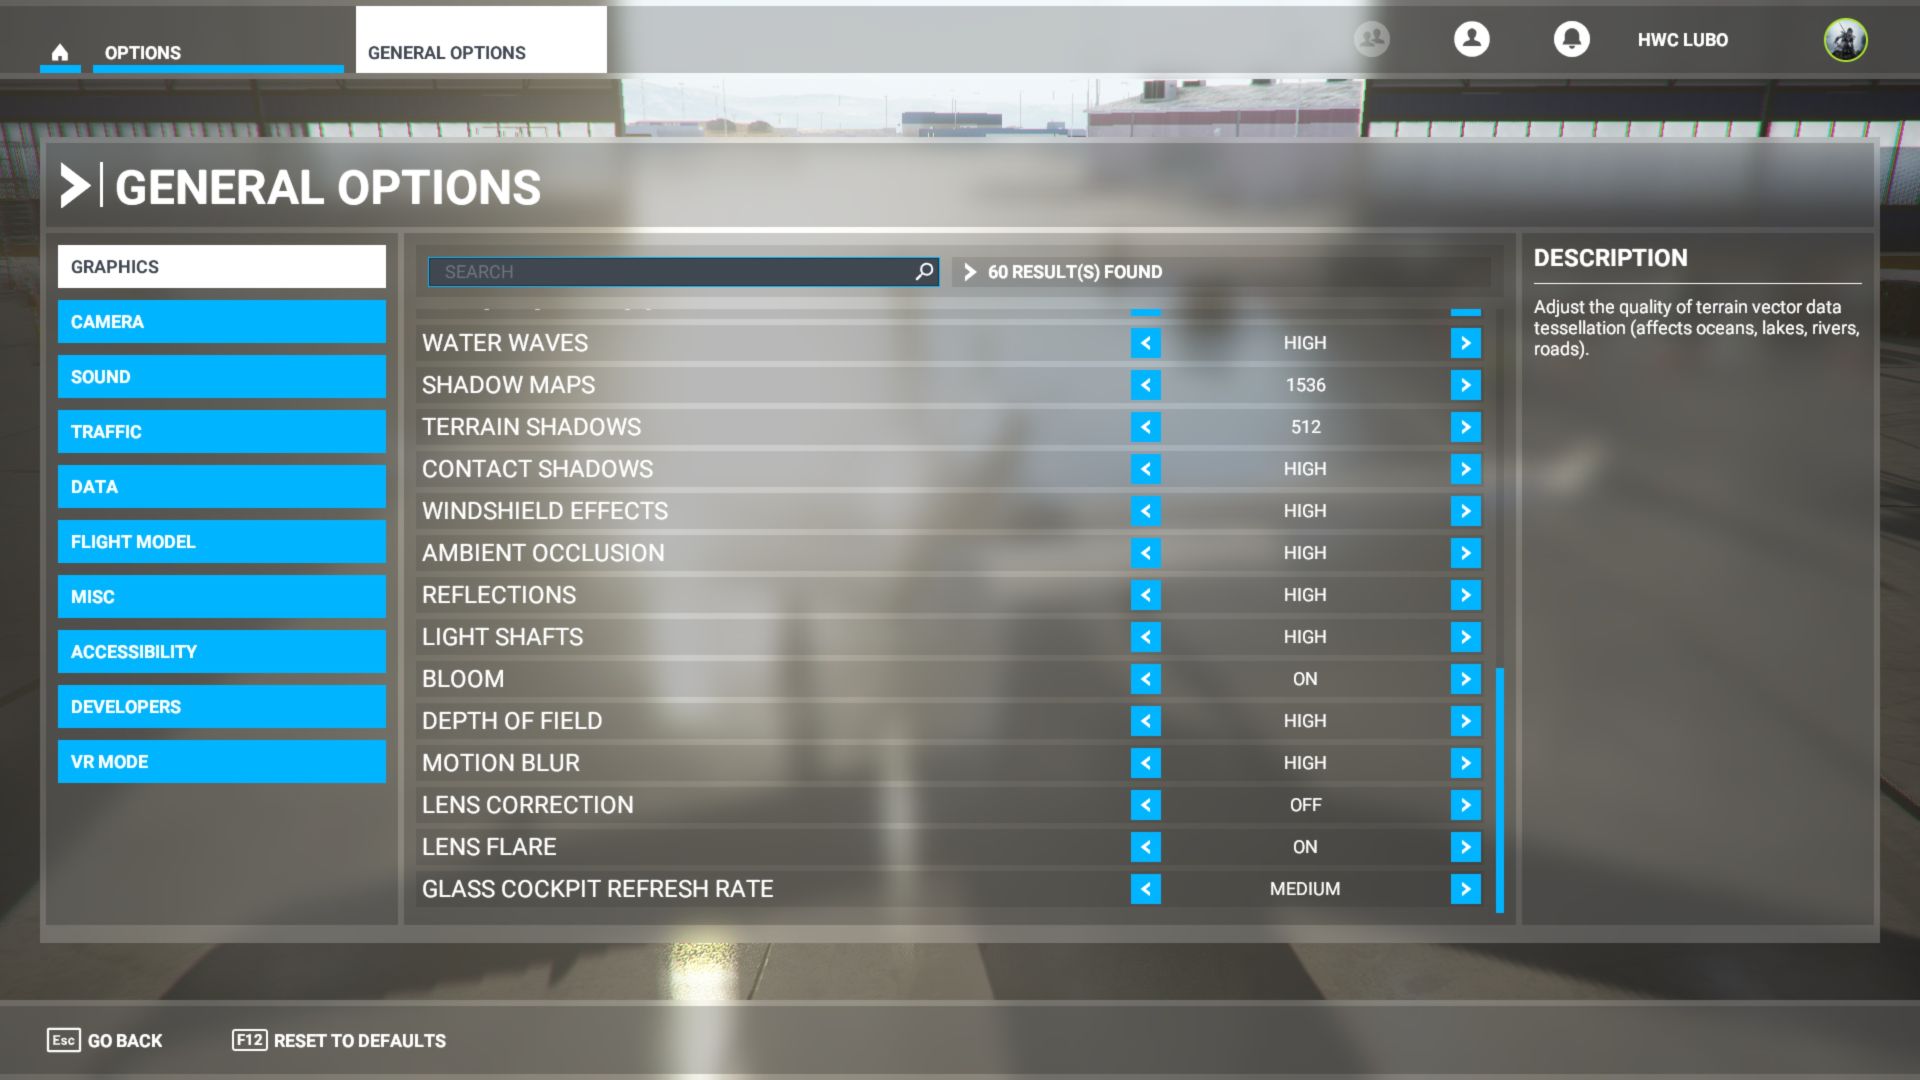
Test environment: resolution 2560 × 1440 px; graphics settings preset High; API DirectX 11; extra settings Anti-Aliasing: TAA; test scene: custom (Paris-Charles de Gaulle, Air Traffic: AI, February 14, 9:00) autopilot: from 1000 m until hitting the terrain.
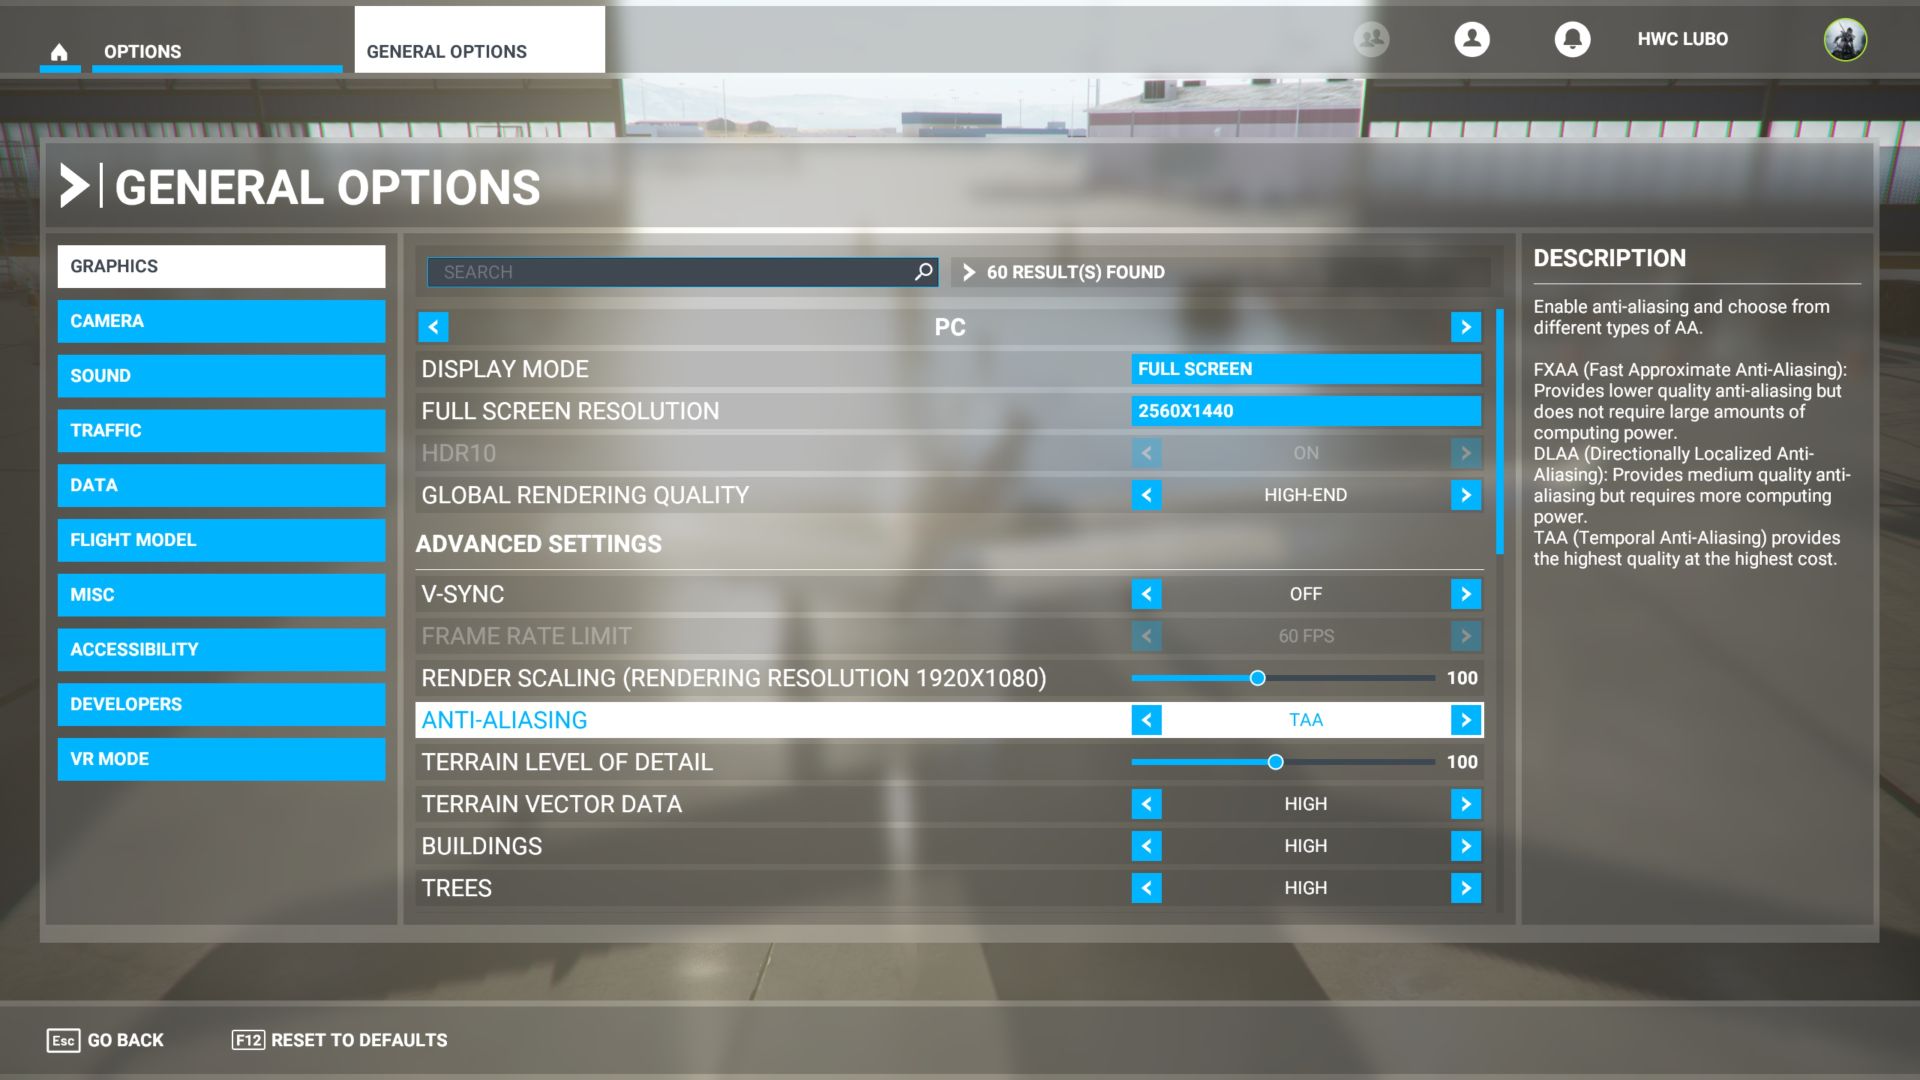
Test environment: resolution 3840 × 2160 px; graphics settings preset Ultra; API DirectX 11; extra settings Anti-Aliasing: TAA; test scene: custom (Paris-Charles de Gaulle, Air Traffic: AI, February 14, 9:00) autopilot: from 1000 m until hitting the terrain.

For completeness of Intel Core i5-14400F processor tests we add the results of its second stepping. We’ve already tested the B0 variant, now it’s time for the C0. Its availability in stores is, at least at the moment, considerably worse and the question arises whether it is worth it at all. Is there any point in aiming for stepping C0 or is B0 also “okay”? Or does it “not matter” (what you get in the shopping lottery)?
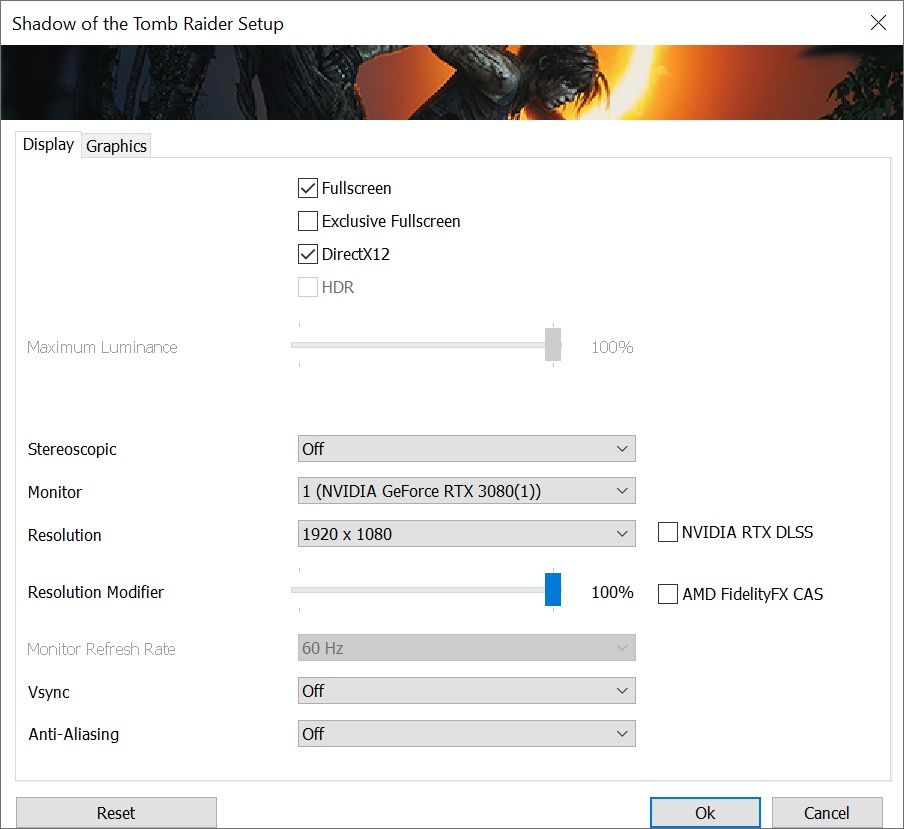
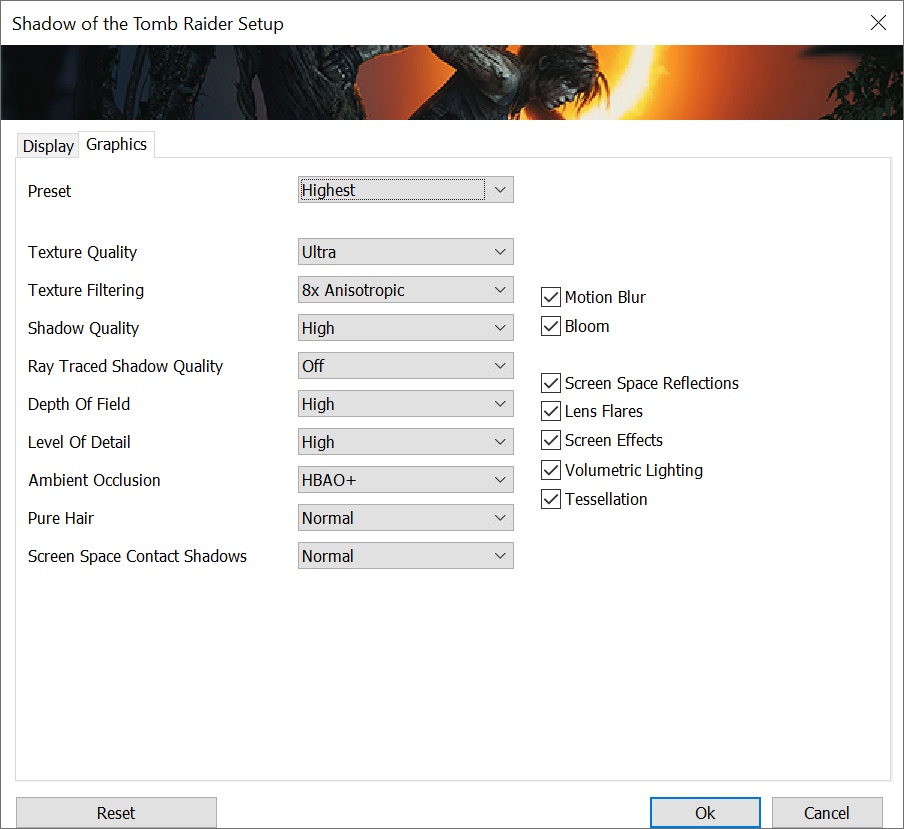
Shadow of the Tomb Raider

Test environment: resolution 1280 × 720 px; graphics settings preset Lowest; API DirectX 12; extra settings Anti-Aliasing: off; test scene: built-in benchmark.

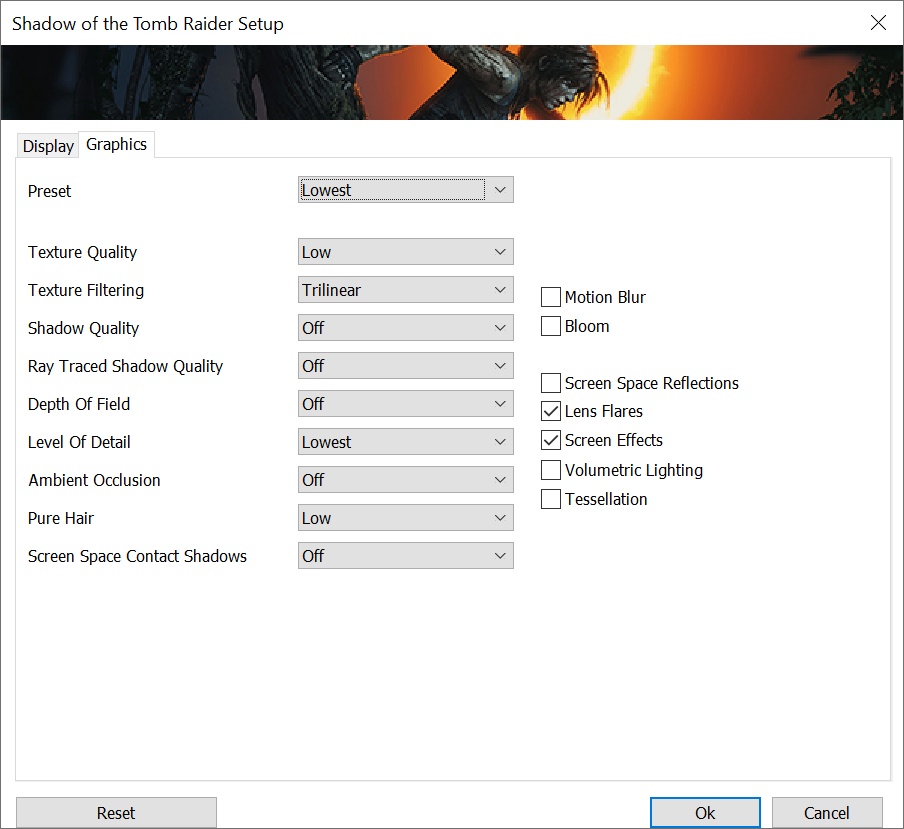
Test environment: resolution 1920 × 1080 px; graphics settings preset High; API DirectX 12; extra settings Anti-Aliasing: off; test scene: built-in benchmark.

Test environment: resolution 2560 × 1440 px; graphics settings preset High; API DirectX 12; extra settings Anti-Aliasing: TAA; test scene: built-in benchmark.

Test environment: resolution 3840 × 2160 px; graphics settings preset Highest; API DirectX 12; extra settings Anti-Aliasing: TAA; test scene: built-in benchmark.
For completeness of Intel Core i5-14400F processor tests we add the results of its second stepping. We’ve already tested the B0 variant, now it’s time for the C0. Its availability in stores is, at least at the moment, considerably worse and the question arises whether it is worth it at all. Is there any point in aiming for stepping C0 or is B0 also “okay”? Or does it “not matter” (what you get in the shopping lottery)?
Total War Saga: Troy
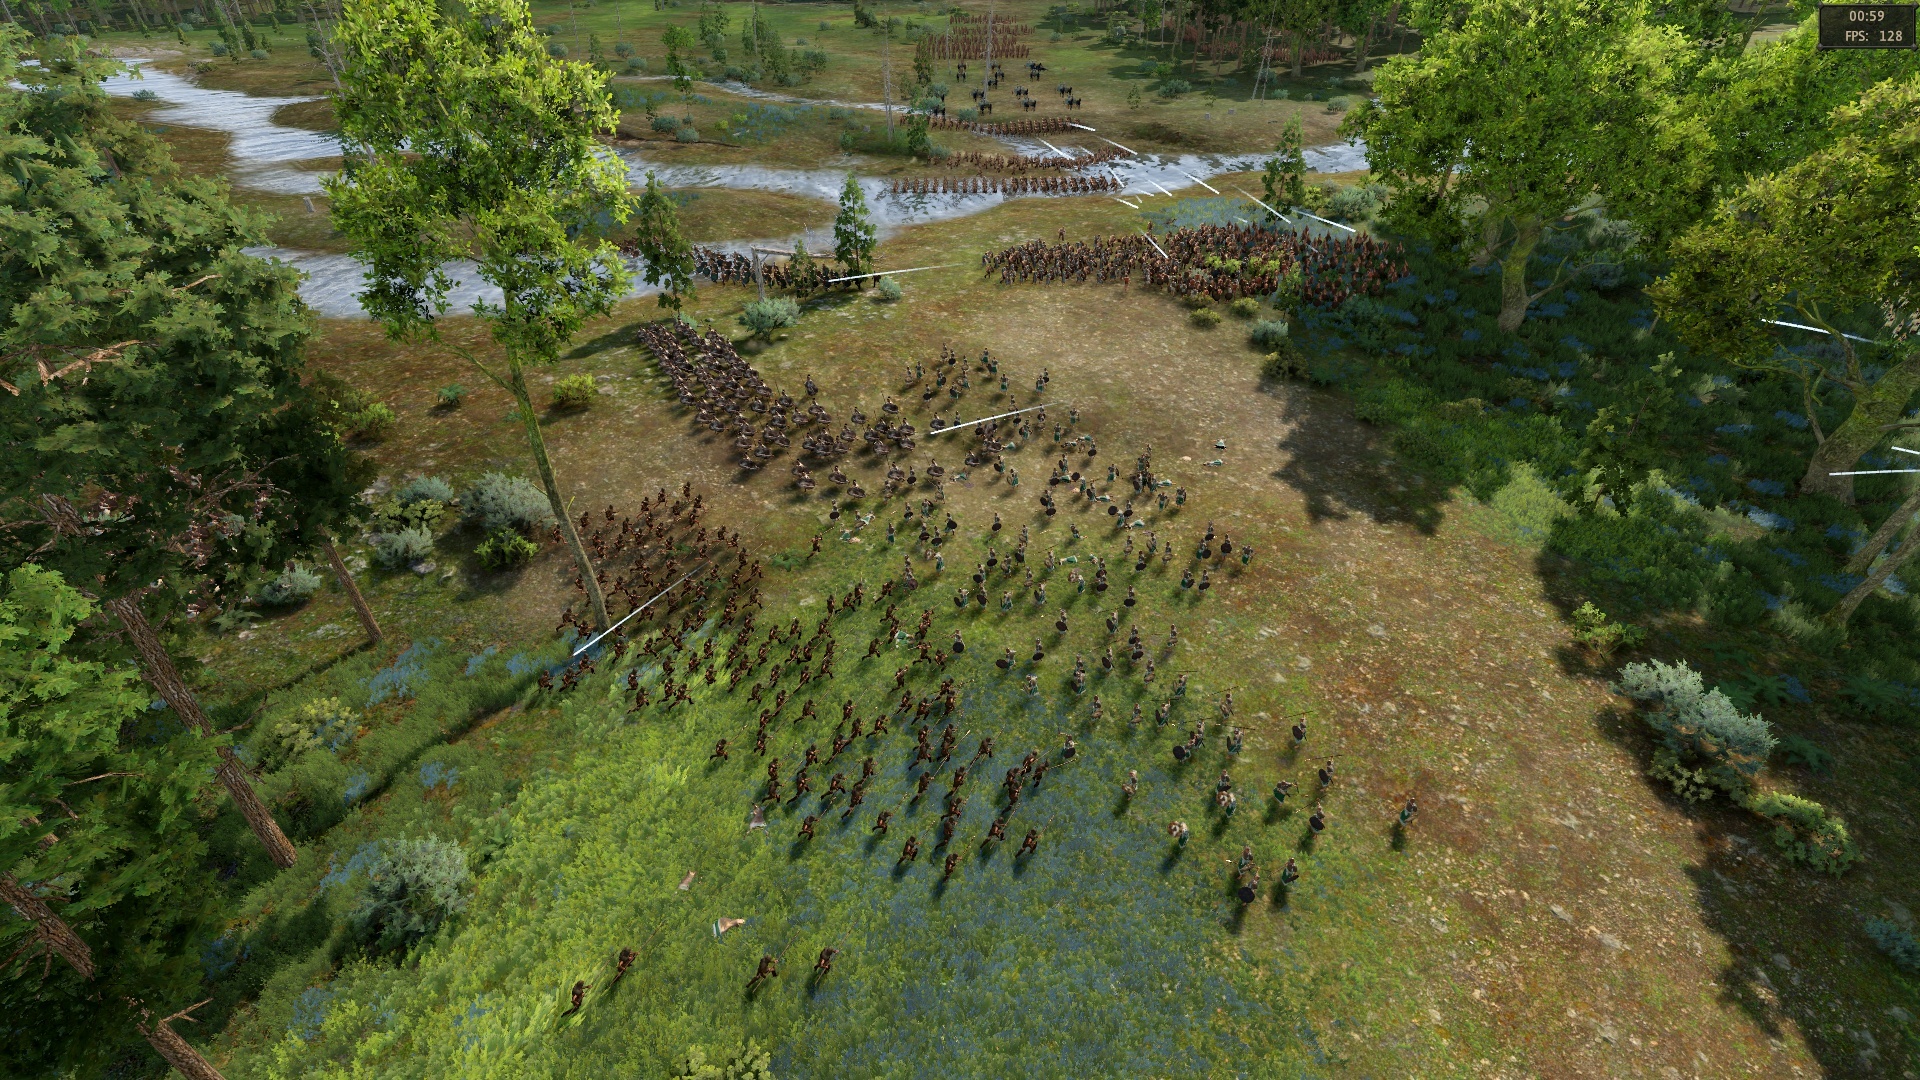
Test environment: resolution 1280 × 720 px; graphics settings preset Low; API DirectX 11; no extra settings; test scene: built-in benchmark.
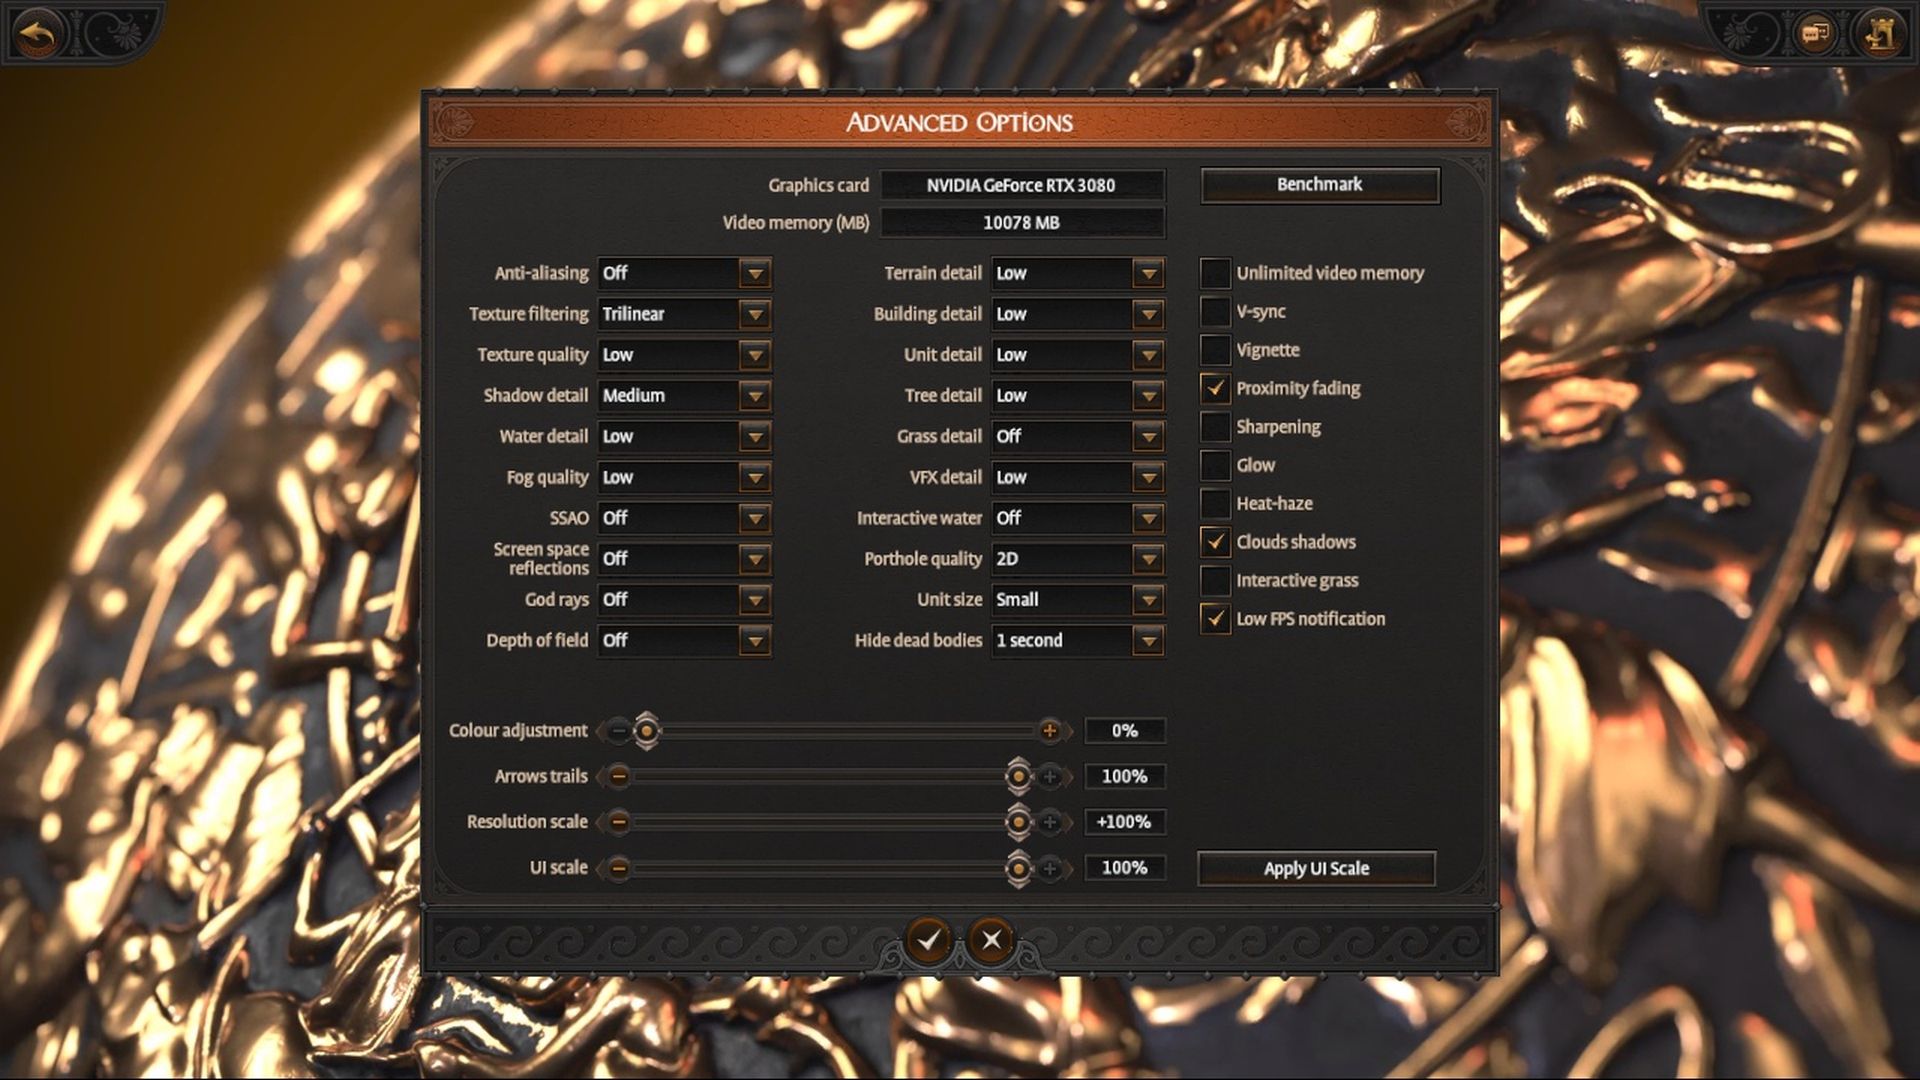
Test environment: resolution 1920 × 1080 px; graphics settings preset High; API DirectX 11; no extra settings; test scene: built-in benchmark.
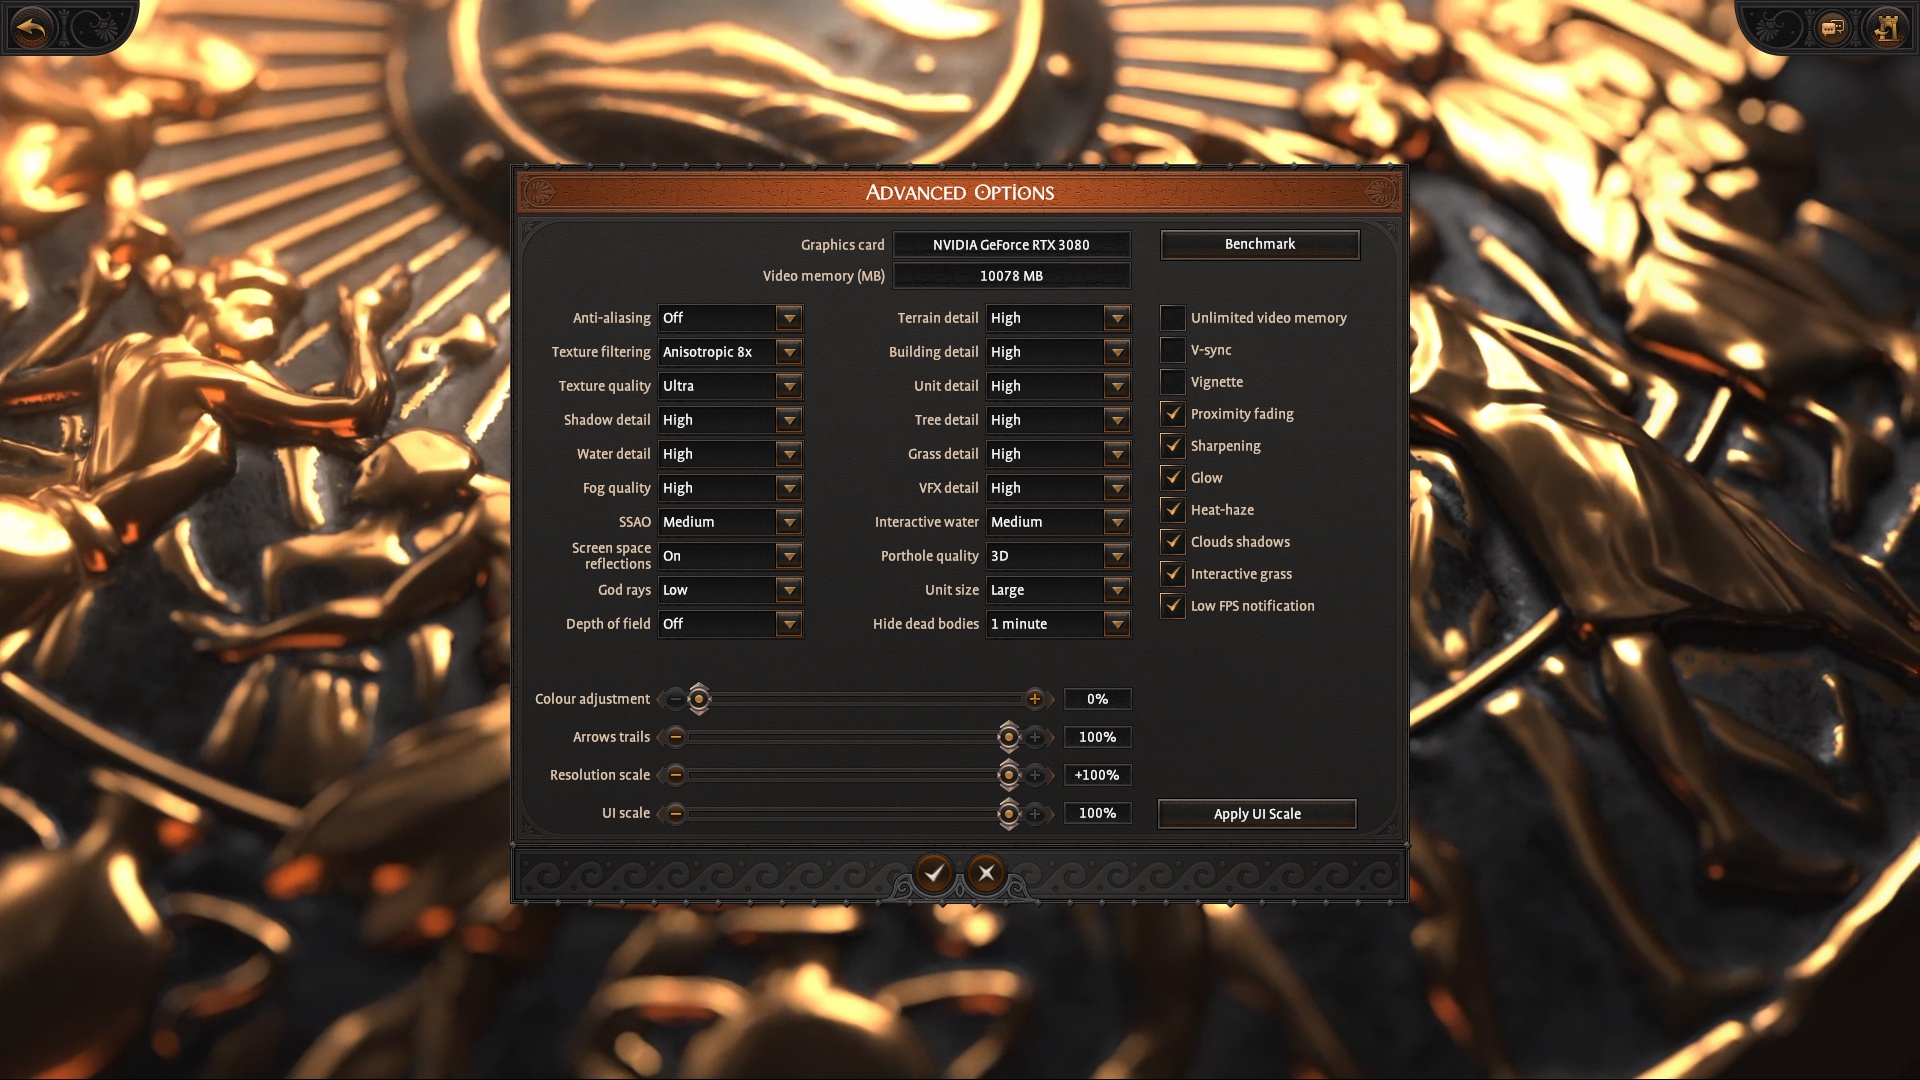
Test environment: resolution 2560 × 1440 px; graphics settings preset High; API DirectX 11; no extra settings; test scene: built-in benchmark.
strong>Test environment: resolution 3840 × 2160 px; graphics settings preset Ultra; API DirectX 11; no extra settings; test scene: built-in benchmark.

For completeness of Intel Core i5-14400F processor tests we add the results of its second stepping. We’ve already tested the B0 variant, now it’s time for the C0. Its availability in stores is, at least at the moment, considerably worse and the question arises whether it is worth it at all. Is there any point in aiming for stepping C0 or is B0 also “okay”? Or does it “not matter” (what you get in the shopping lottery)?
Overall gaming performance
To calculate average gaming performance, we normalized the Intel Core i7-11900K processor. The percentage differences of all other processors are based on this, with each of the games contributing an equal weight to the final result. To see exactly what the formula we use to arrive at each value looks like, see „New average CPU score measuring method“.
For completeness of Intel Core i5-14400F processor tests we add the results of its second stepping. We’ve already tested the B0 variant, now it’s time for the C0. Its availability in stores is, at least at the moment, considerably worse and the question arises whether it is worth it at all. Is there any point in aiming for stepping C0 or is B0 also “okay”? Or does it “not matter” (what you get in the shopping lottery)?
Gaming performance per euro
For completeness of Intel Core i5-14400F processor tests we add the results of its second stepping. We’ve already tested the B0 variant, now it’s time for the C0. Its availability in stores is, at least at the moment, considerably worse and the question arises whether it is worth it at all. Is there any point in aiming for stepping C0 or is B0 also “okay”? Or does it “not matter” (what you get in the shopping lottery)?
PCMark
Geekbench
For completeness of Intel Core i5-14400F processor tests we add the results of its second stepping. We’ve already tested the B0 variant, now it’s time for the C0. Its availability in stores is, at least at the moment, considerably worse and the question arises whether it is worth it at all. Is there any point in aiming for stepping C0 or is B0 also “okay”? Or does it “not matter” (what you get in the shopping lottery)?
Speedometer (2.0) and Octane (2.0)
Test environment: We’re using a portable version of Google Chrome (91.0.472.101) 64-bit so that real-time results are not affected by browser updates. GPU hardware acceleration is enabled as each user has in the default settings.
Note: The values in the graphs represent the average of the points obtained in the subtasks, which are grouped according to their nature into seven categories (Core language features, Memory and GC, Strings and arrays, Virtual machine and GC, Loading and Parsing, Bit and Math operations and Compiler and GC latency).
For completeness of Intel Core i5-14400F processor tests we add the results of its second stepping. We’ve already tested the B0 variant, now it’s time for the C0. Its availability in stores is, at least at the moment, considerably worse and the question arises whether it is worth it at all. Is there any point in aiming for stepping C0 or is B0 also “okay”? Or does it “not matter” (what you get in the shopping lottery)?
Cinebench R20
Cinebench R23
Blender@Cycles
Test environment: We use well-known projects BMW (510 tiles) and Classroom (2040 tiles) and renderer Cycles. Render settings are set to None, with which all the work falls on the CPU.
LuxRender (SPECworkstation 3.1)
For completeness of Intel Core i5-14400F processor tests we add the results of its second stepping. We’ve already tested the B0 variant, now it’s time for the C0. Its availability in stores is, at least at the moment, considerably worse and the question arises whether it is worth it at all. Is there any point in aiming for stepping C0 or is B0 also “okay”? Or does it “not matter” (what you get in the shopping lottery)?
Adobe Premiere Pro (PugetBench)
Test environment: set of PugetBench tests. App version of Adobe Premiere Pro is 15.2.
For completeness of Intel Core i5-14400F processor tests we add the results of its second stepping. We’ve already tested the B0 variant, now it’s time for the C0. Its availability in stores is, at least at the moment, considerably worse and the question arises whether it is worth it at all. Is there any point in aiming for stepping C0 or is B0 also “okay”? Or does it “not matter” (what you get in the shopping lottery)?
DaVinci Resolve Studio (PugetBench)
Test environment: set of PugetBench tests, test type: standard. App version of DaVinci Resolve Studio is 17.2.1 (build 12).
For completeness of Intel Core i5-14400F processor tests we add the results of its second stepping. We’ve already tested the B0 variant, now it’s time for the C0. Its availability in stores is, at least at the moment, considerably worse and the question arises whether it is worth it at all. Is there any point in aiming for stepping C0 or is B0 also “okay”? Or does it “not matter” (what you get in the shopping lottery)?
Graphics effects: Adobe After Effects
Test environment: set of PugetBench tests. App version of Adobe After Effects is 18.2.1.
For completeness of Intel Core i5-14400F processor tests we add the results of its second stepping. We’ve already tested the B0 variant, now it’s time for the C0. Its availability in stores is, at least at the moment, considerably worse and the question arises whether it is worth it at all. Is there any point in aiming for stepping C0 or is B0 also “okay”? Or does it “not matter” (what you get in the shopping lottery)?
HandBrake
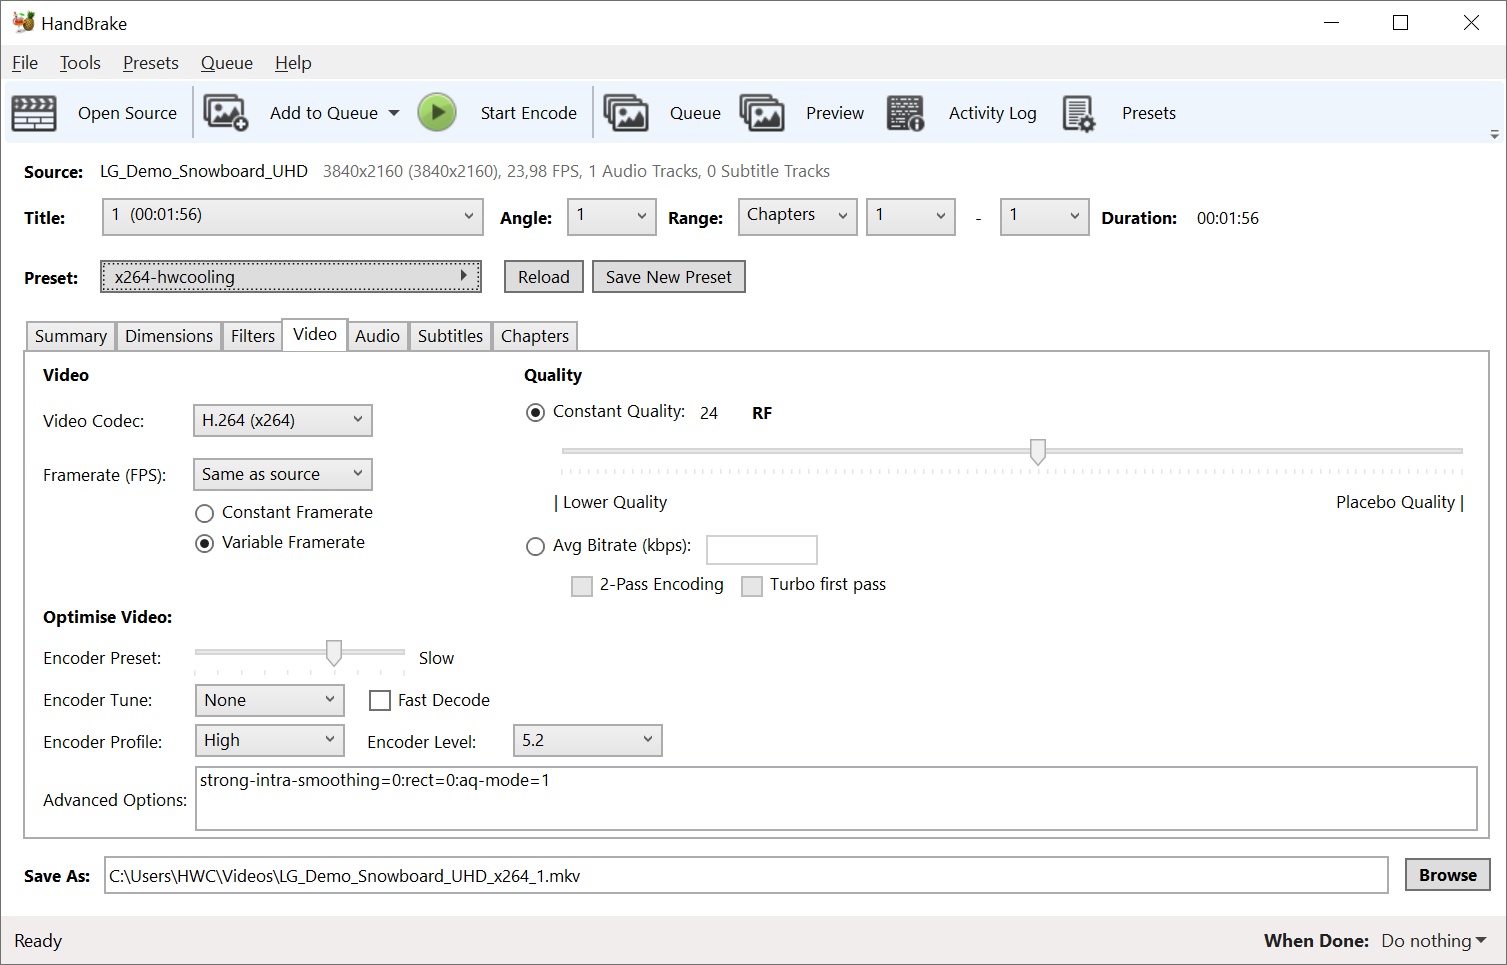
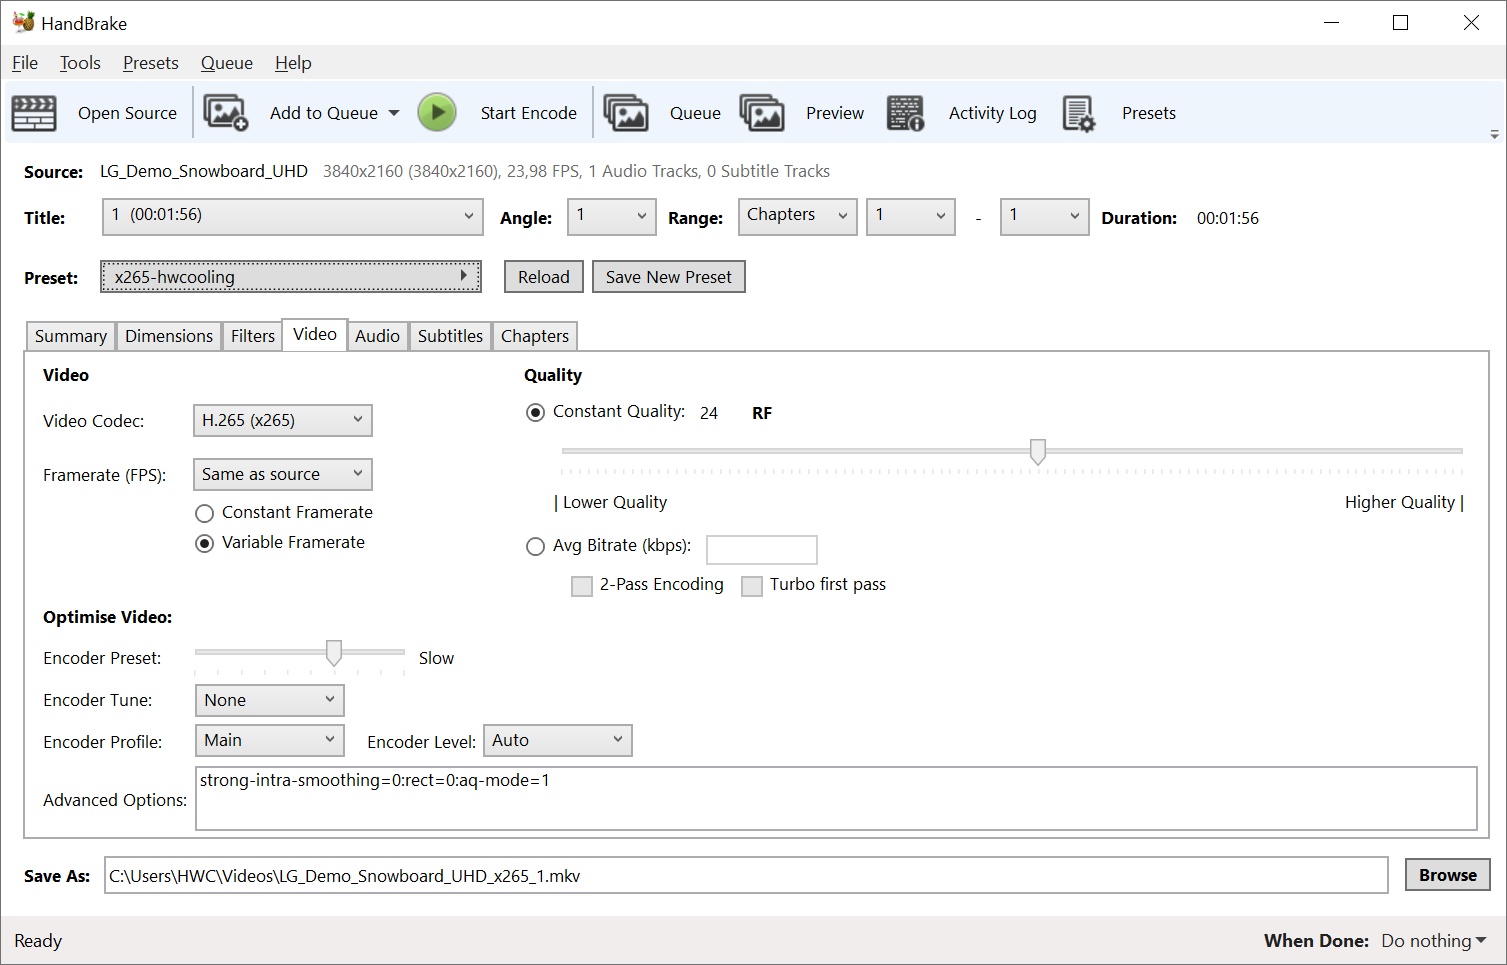
Test environment: For video conversion we’re using a 4K video LG Demo Snowboard with a 43,9 Mb/s bitrate. AVC (x264) and HEVC (x265) profiles are set for high quality and encoder profiles are “slow”. HandBrake version is 1.3.3 (2020061300).
Benchmarky x264 a x265
SVT-AV1
Test environment: We are encoding a short, publicly available sample park_joy_2160p50.y4m: uncompressed video 4096 × 2160 px, 8bit, 50 fps. Length is 585 frames with encoding quality set to 6 which makes the encoding still relatively slow. This test can make use of the AVX2 i AVX-512 instructions.
Version: SVT-AV1 Encoder Lib v0.8.7-61-g685afb2d via FFMpeg N-104429-g069f7831a2-20211026 (64bit)
Build from: https://github.com/BtbN/FFmpeg-Builds/releases
Command line: ffmpeg.exe -i “park_joy_2160p50.y4m” -c:v libsvtav1 -rc 0 -qp 55 -preset 6 -f null output.webm
For completeness of Intel Core i5-14400F processor tests we add the results of its second stepping. We’ve already tested the B0 variant, now it’s time for the C0. Its availability in stores is, at least at the moment, considerably worse and the question arises whether it is worth it at all. Is there any point in aiming for stepping C0 or is B0 also “okay”? Or does it “not matter” (what you get in the shopping lottery)?
Audio encoding
Test environment: Audio encoding is done using command line encoders, we measure the time it takes for the conversion to finish. The same 42-minute long 16-bit WAV file (stereo) with 44.1 kHz is always used (Love Over Gold by Dire Straits album rip in a single audio file).
Encoder settings are selected to achieve maximum or near maximum compression. The bitrate is relatively high, with the exception of lossless FLAC of about 200 kb/s.
Note: These tests measure single-thread performance.
FLAC: reference encoder 1.3.2, 64-bit build. Launch options: flac.exe -s -8 -m -e -p -f
MP3: encoder lame3.100.1, 64-bit build (Intel 19 Compiler) from RareWares. Launch options: lame.exe -S -V 0 -q 0
AAC: uses Apple QuickTime libraries, invoked through the application from the command line, QAAC 2.72, 64-bit build, Intel 19 Compiler (does not require installation of the whole Apple package). Launch options: qaac64.exe -V 100 -s -q 2
Opus: reference encoder 1.3.1, Launch options: opusenc.exe –comp 10 –quiet –vbr –bitrate 192
For completeness of Intel Core i5-14400F processor tests we add the results of its second stepping. We’ve already tested the B0 variant, now it’s time for the C0. Its availability in stores is, at least at the moment, considerably worse and the question arises whether it is worth it at all. Is there any point in aiming for stepping C0 or is B0 also “okay”? Or does it “not matter” (what you get in the shopping lottery)?
Broadcasting
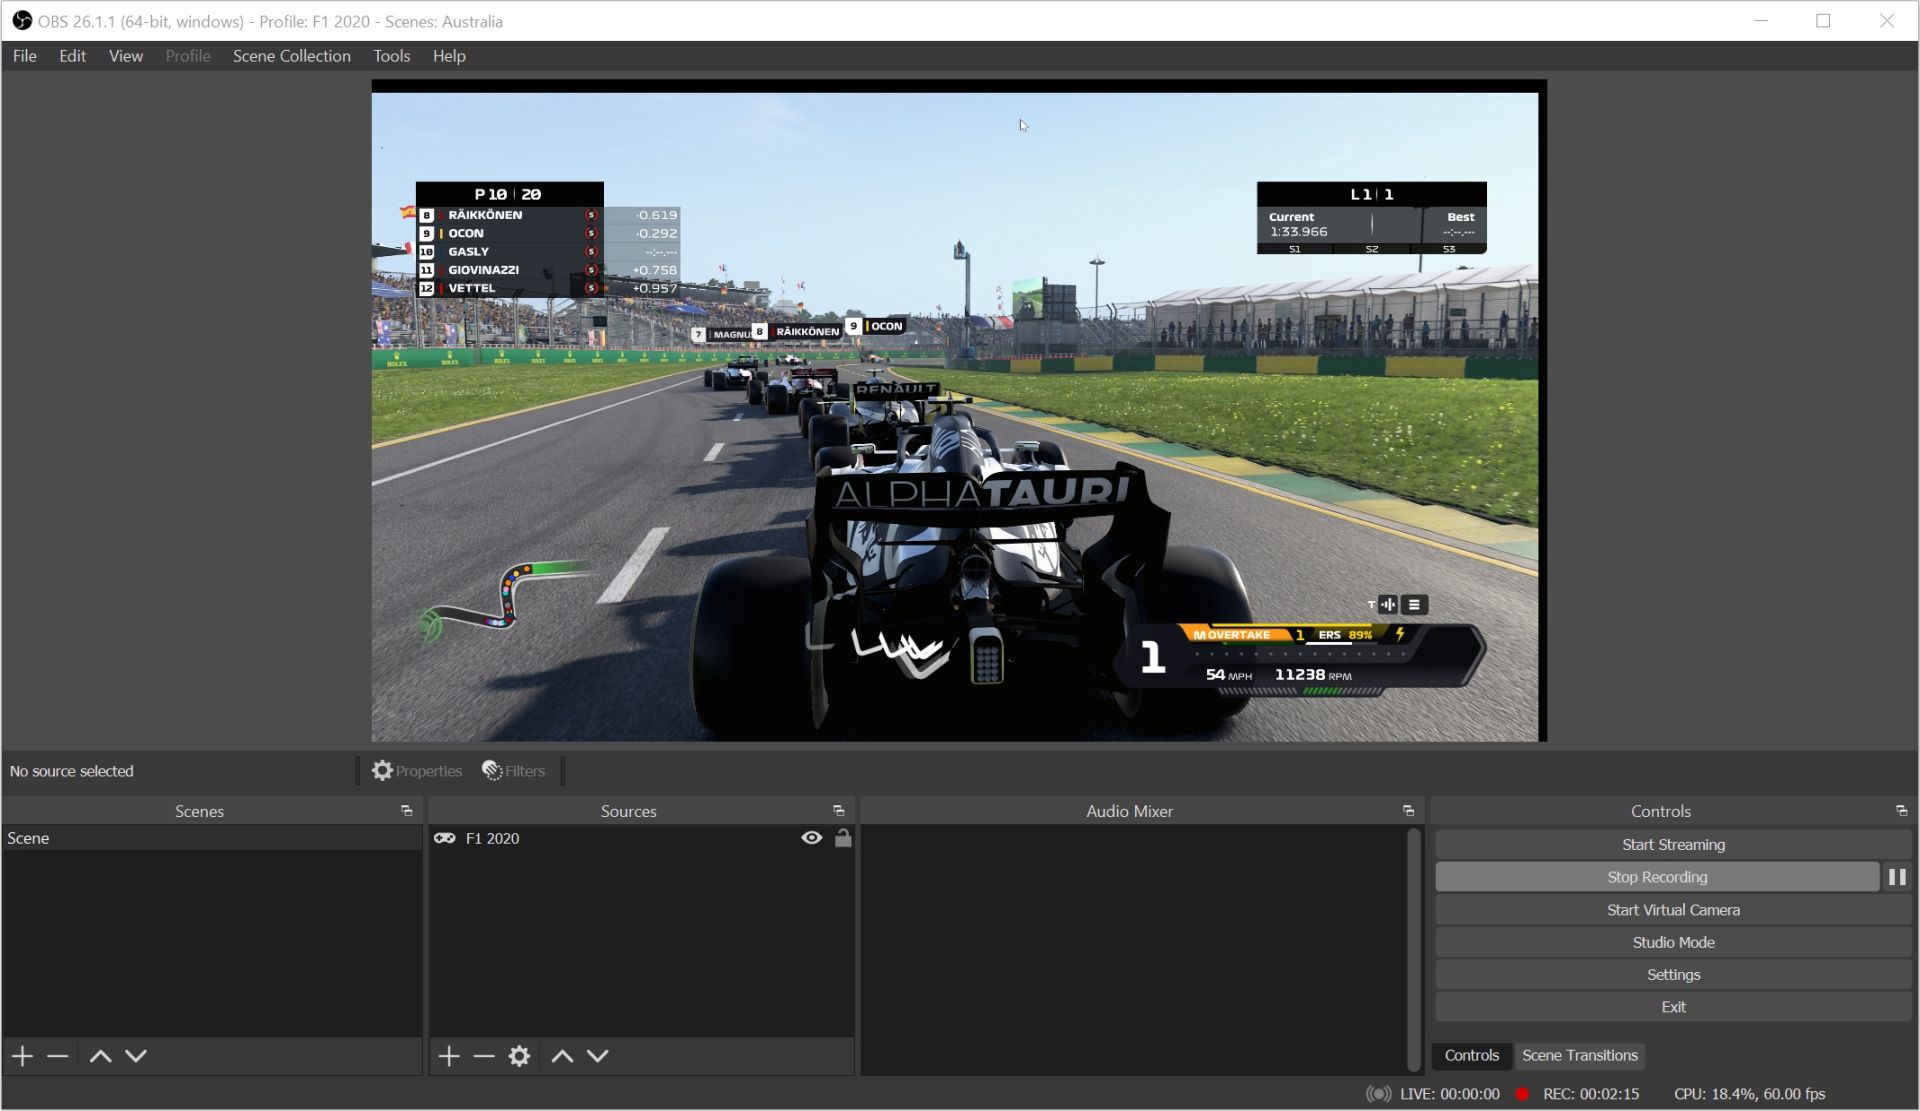
Test environment: Applications OBS Studio and Xsplit. We’re using the built-in benchmark (scene Australia, Clear/Dry, Cycle) in F1 2020, in a resolution of 2560 × 1440 px and the same graphics settings, as with standard game performance tests. Thanks to this, we can measure the performance decrease if you record your gameplay with the x264 software encoder while playing. The output is 2560 × 1440 px at 60 fps.
For completeness of Intel Core i5-14400F processor tests we add the results of its second stepping. We’ve already tested the B0 variant, now it’s time for the C0. Its availability in stores is, at least at the moment, considerably worse and the question arises whether it is worth it at all. Is there any point in aiming for stepping C0 or is B0 also “okay”? Or does it “not matter” (what you get in the shopping lottery)?

Adobe Photoshop (PugetBench)
Test environment: set of PugetBench tests. App version of Adobe Photoshop is 22.4.2.
Adobe Lightroom Classic
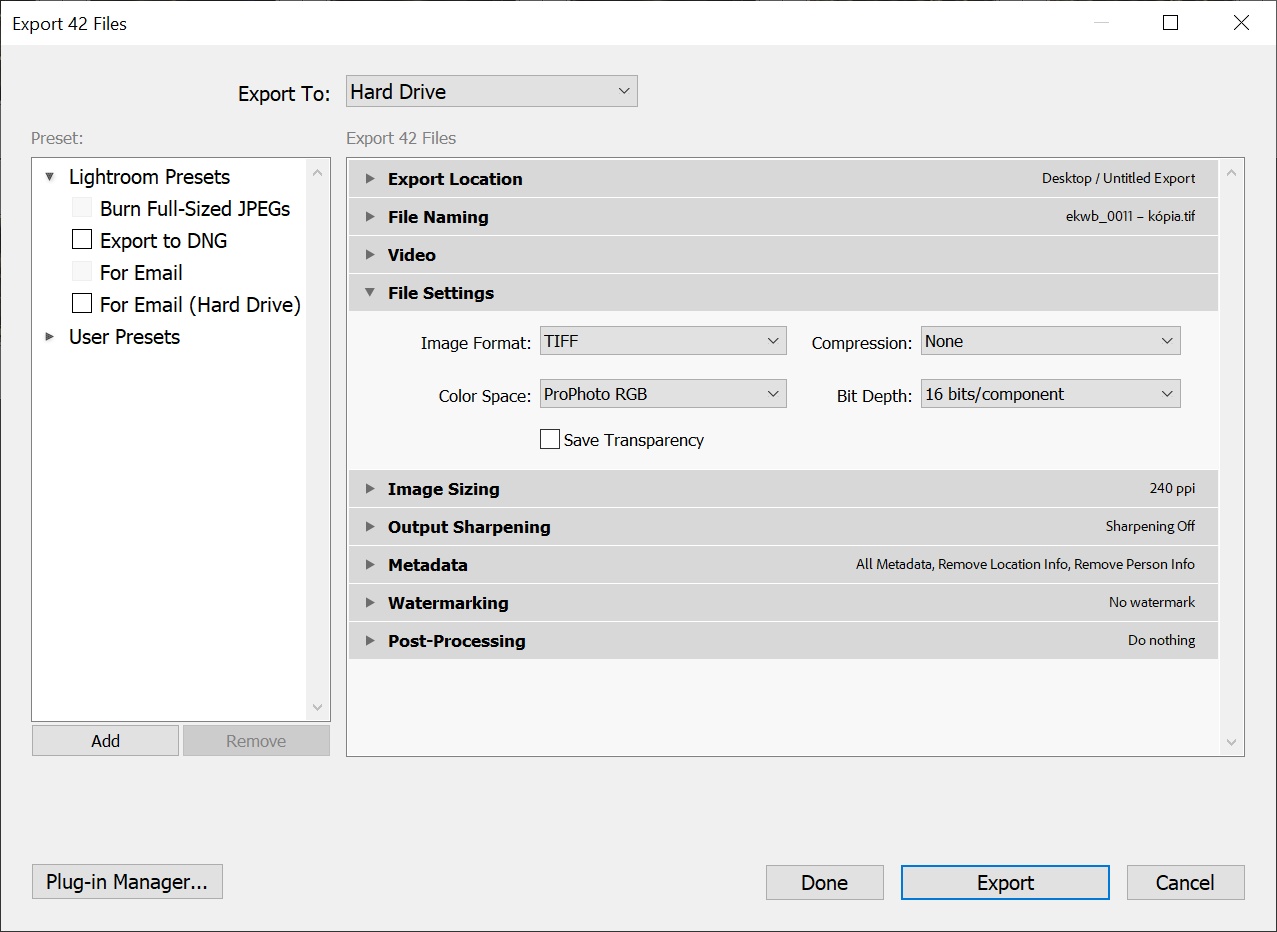
Test environment: With the settings above, we export 42 uncompressed .CR2 (RAW Canon) photos with a size of 20 Mpx. Then we create 1:1 previews from them, which also represent one of the most processor intensive tasks in Lightroom. The version of Adobe Lightroom Classic is 10.3.
For completeness of Intel Core i5-14400F processor tests we add the results of its second stepping. We’ve already tested the B0 variant, now it’s time for the C0. Its availability in stores is, at least at the moment, considerably worse and the question arises whether it is worth it at all. Is there any point in aiming for stepping C0 or is B0 also “okay”? Or does it “not matter” (what you get in the shopping lottery)?
Affinity Photo (benchmark)
Test environment: built-in benchmark.
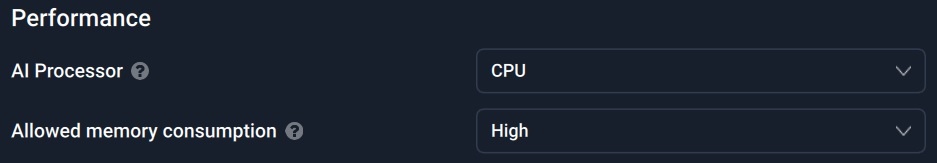
Topaz Labs AI apps
Topaz DeNoise AI, Gigapixel AI and Sharpen AI. These single-purpose applications are used for restoration of low-quality photos. Whether it is high noise (caused by higher ISO), raster level (typically after cropping) or when something needs extra focus. The AI performance is always used.
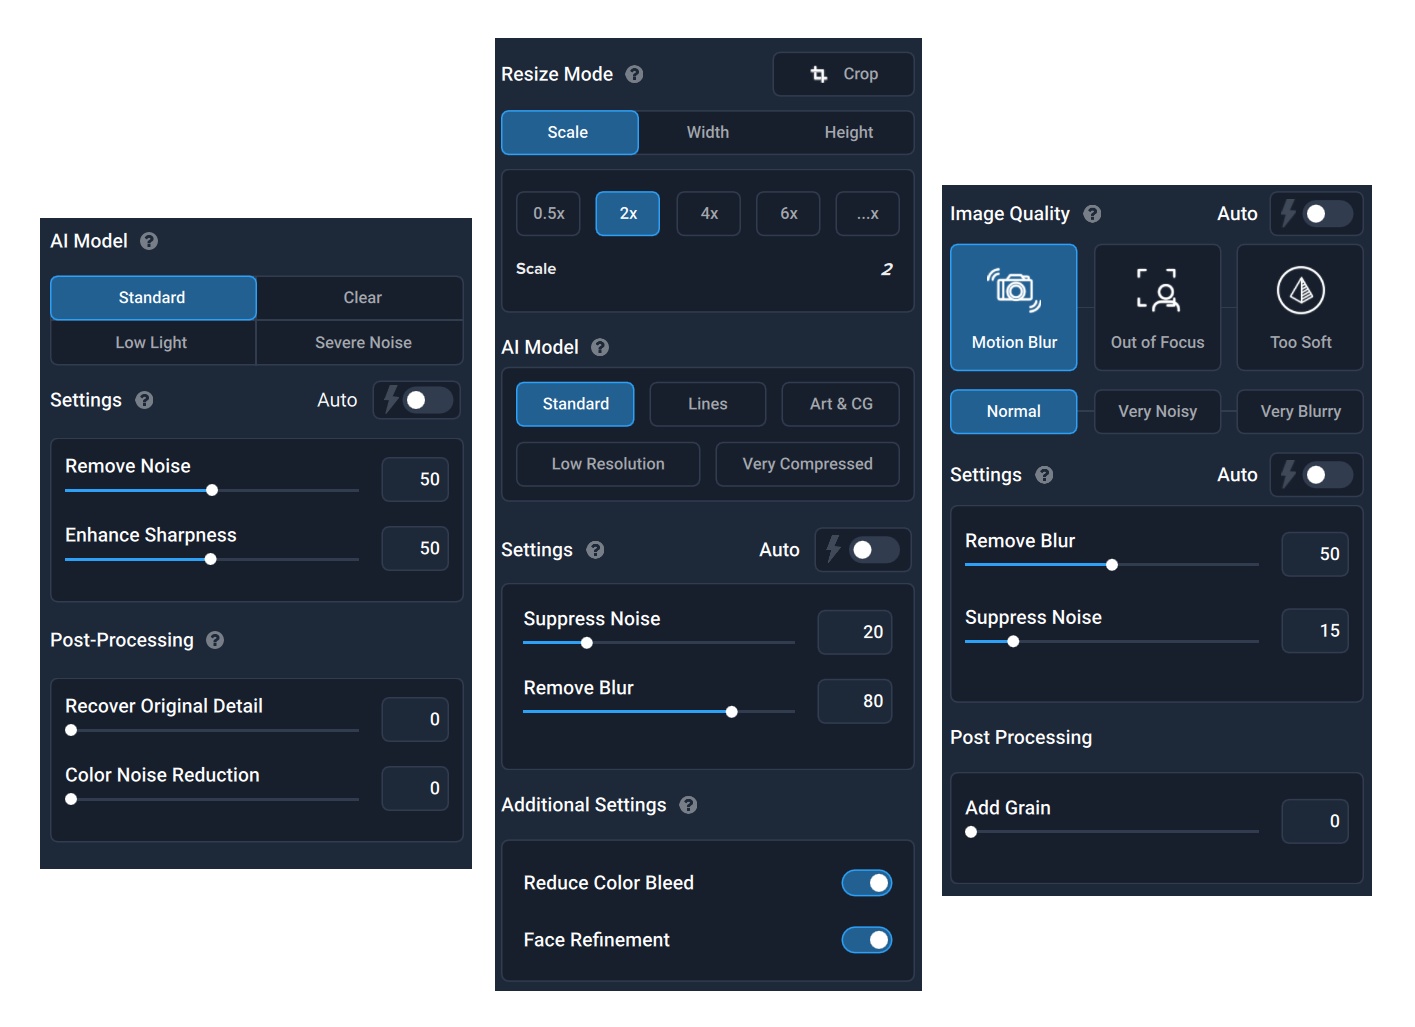
Test environment: As part of batch editing, 42 photos with a lower resolution of 1920 × 1280 px are processed, with the settings from the images above. DeNoise AI is in version 3.1.2, Gigapixel in 5.5.2 and Sharpen AI in 3.1.2.
XnViewMP

Test environment: XnViewMP is finally a photo-editor for which you don’t have to pay. At the same time, it uses hardware very efficiently. In order to achieve more reasonable comparison times, we had to create an archive of up to 1024 photos, where we reduce the original resolution of 5472 × 3648 px to 1980 × 1280 px and filters with automatic contrast enhancement and noise reduction are also being applied during this process. We use 64-bit portable version 0.98.4.
Zoner Photo Studio X
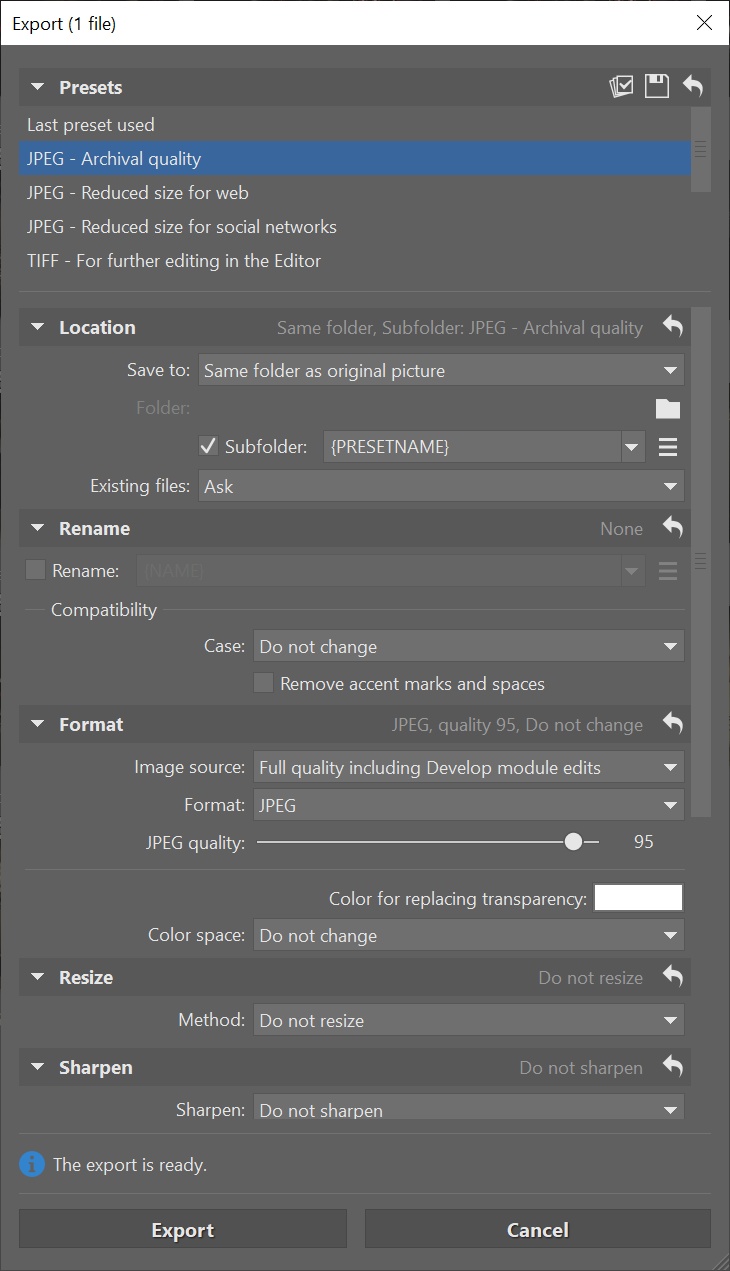
Test environment: In Zoner Photo Studio X we convert 42 .CR2 (RAW Canon) photos to JPEG while keeping the original resolution (5472 × 3648 px) at the lowest possible compression, with the ZPS X profile ”high quality for archival”.
For completeness of Intel Core i5-14400F processor tests we add the results of its second stepping. We’ve already tested the B0 variant, now it’s time for the C0. Its availability in stores is, at least at the moment, considerably worse and the question arises whether it is worth it at all. Is there any point in aiming for stepping C0 or is B0 also “okay”? Or does it “not matter” (what you get in the shopping lottery)?
WinRAR 6.01
7-Zip 19.00
For completeness of Intel Core i5-14400F processor tests we add the results of its second stepping. We’ve already tested the B0 variant, now it’s time for the C0. Its availability in stores is, at least at the moment, considerably worse and the question arises whether it is worth it at all. Is there any point in aiming for stepping C0 or is B0 also “okay”? Or does it “not matter” (what you get in the shopping lottery)?
TrueCrypt 7.1a
Aida64 (AES, SHA3)
For completeness of Intel Core i5-14400F processor tests we add the results of its second stepping. We’ve already tested the B0 variant, now it’s time for the C0. Its availability in stores is, at least at the moment, considerably worse and the question arises whether it is worth it at all. Is there any point in aiming for stepping C0 or is B0 also “okay”? Or does it “not matter” (what you get in the shopping lottery)?
Y-cruncher
Stockfish 13
Test environment: Host for the Stockfish 13 engine is a chess app Arena 2.0.1, build 2399.
Aida64, testy FPU
FSI (SPECworkstation 3.1)
Kirchhoff migration (SPECworkstation 3.1)
Python36 (SPECworkstation 3.1)
SRMP (SPECworkstation 3.1)
Octave (SPECworkstation 3.1)
FFTW (SPECworkstation 3.1)
Convolution (SPECworkstation 3.1)
CalculiX (SPECworkstation 3.1)
For completeness of Intel Core i5-14400F processor tests we add the results of its second stepping. We’ve already tested the B0 variant, now it’s time for the C0. Its availability in stores is, at least at the moment, considerably worse and the question arises whether it is worth it at all. Is there any point in aiming for stepping C0 or is B0 also “okay”? Or does it “not matter” (what you get in the shopping lottery)?
RodiniaLifeSci (SPECworkstation 3.1)
WPCcfd (SPECworkstation 3.1)
Poisson (SPECworkstation 3.1)
LAMMPS (SPECworkstation 3.1)
NAMD (SPECworkstation 3.1)
For completeness of Intel Core i5-14400F processor tests we add the results of its second stepping. We’ve already tested the B0 variant, now it’s time for the C0. Its availability in stores is, at least at the moment, considerably worse and the question arises whether it is worth it at all. Is there any point in aiming for stepping C0 or is B0 also “okay”? Or does it “not matter” (what you get in the shopping lottery)?
Tests of memory…
… and of cache (L1, L2, L3)
For completeness of Intel Core i5-14400F processor tests we add the results of its second stepping. We’ve already tested the B0 variant, now it’s time for the C0. Its availability in stores is, at least at the moment, considerably worse and the question arises whether it is worth it at all. Is there any point in aiming for stepping C0 or is B0 also “okay”? Or does it “not matter” (what you get in the shopping lottery)?
Processor power draw curve
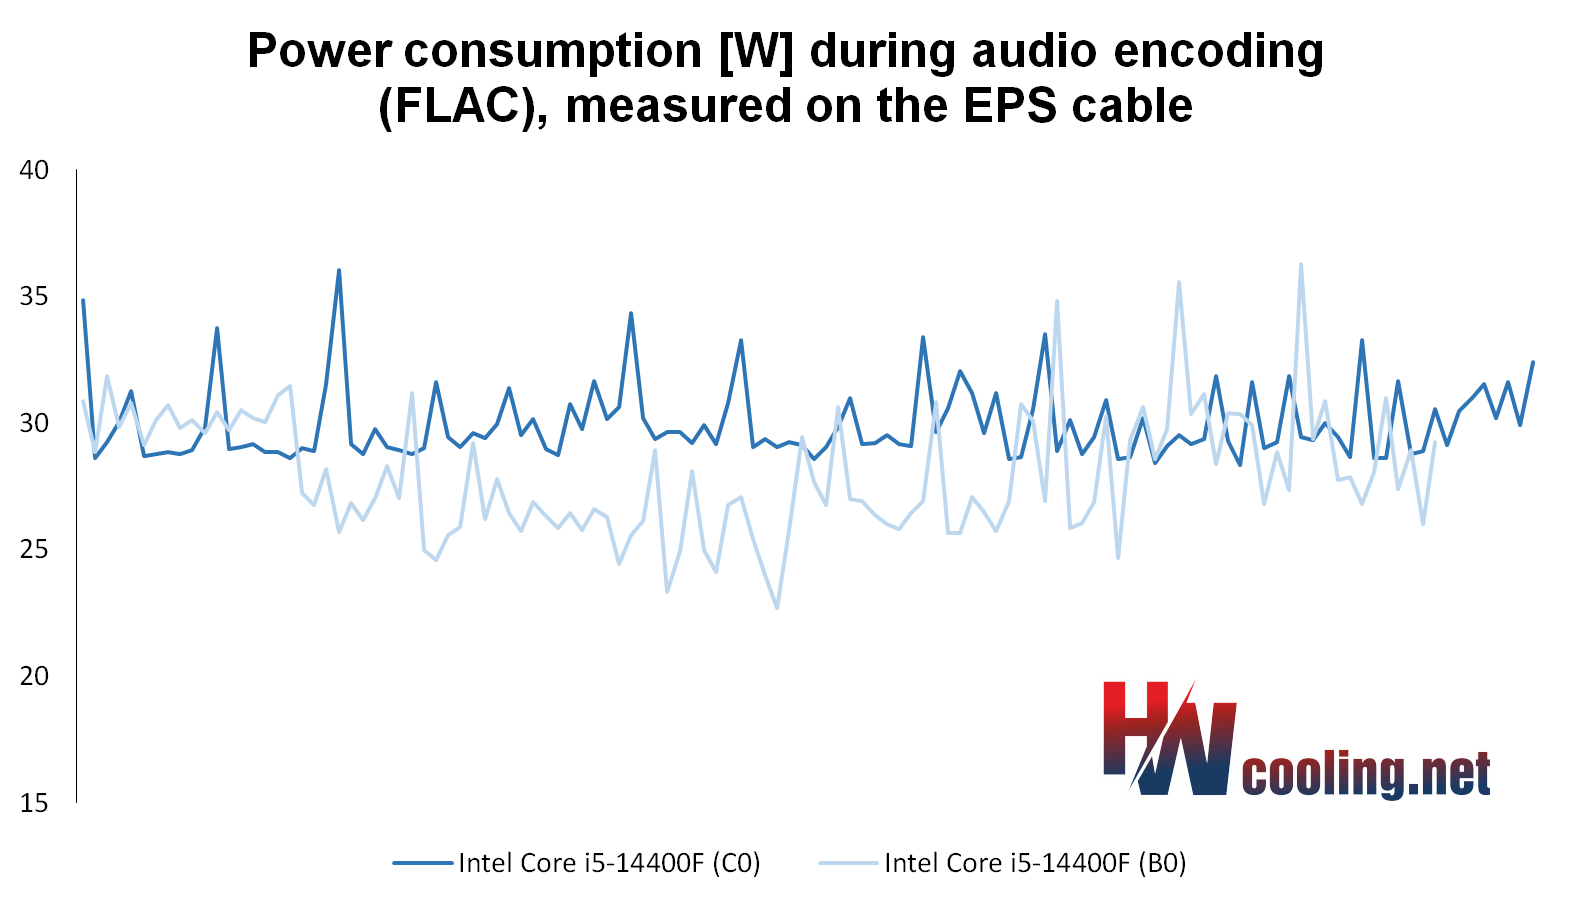
For completeness of Intel Core i5-14400F processor tests we add the results of its second stepping. We’ve already tested the B0 variant, now it’s time for the C0. Its availability in stores is, at least at the moment, considerably worse and the question arises whether it is worth it at all. Is there any point in aiming for stepping C0 or is B0 also “okay”? Or does it “not matter” (what you get in the shopping lottery)?
Average processor power draw

For completeness of Intel Core i5-14400F processor tests we add the results of its second stepping. We’ve already tested the B0 variant, now it’s time for the C0. Its availability in stores is, at least at the moment, considerably worse and the question arises whether it is worth it at all. Is there any point in aiming for stepping C0 or is B0 also “okay”? Or does it “not matter” (what you get in the shopping lottery)?
Performance per watt
For completeness of Intel Core i5-14400F processor tests we add the results of its second stepping. We’ve already tested the B0 variant, now it’s time for the C0. Its availability in stores is, at least at the moment, considerably worse and the question arises whether it is worth it at all. Is there any point in aiming for stepping C0 or is B0 also “okay”? Or does it “not matter” (what you get in the shopping lottery)?
Achieved CPU clock speed

For completeness of Intel Core i5-14400F processor tests we add the results of its second stepping. We’ve already tested the B0 variant, now it’s time for the C0. Its availability in stores is, at least at the moment, considerably worse and the question arises whether it is worth it at all. Is there any point in aiming for stepping C0 or is B0 also “okay”? Or does it “not matter” (what you get in the shopping lottery)?
CPU temperature
For completeness of Intel Core i5-14400F processor tests we add the results of its second stepping. We’ve already tested the B0 variant, now it’s time for the C0. Its availability in stores is, at least at the moment, considerably worse and the question arises whether it is worth it at all. Is there any point in aiming for stepping C0 or is B0 also “okay”? Or does it “not matter” (what you get in the shopping lottery)?
Conclusion
The C0 stepping of the Core i5-14400F is “worse” than the B0 stepping in almost every way. In the end, it is also quite good that there is little of it (and the B0 prevails). At maximum load, when the speed of the Ci5-14400F C0 is comparable to and rather lower than the Ci5-14400F B0, we also saw approximately 19% (20 W) higher power consumption at the same time. This also points to the lower efficiency of stepping C0.
A year ago, the Ci5-13400F B0 and C0 were more evenly matched in terms of efficiency, but that was at lower clock speeds, with which the Intel 7 (versus Intel 7 Ultra – Raptor Lake and Raptor Lake Refresh) manufacturing node can be more efficient, and also at a different point in time. It probably cannot be ruled out that the 14th generation is already drawing on the “last reserves” with the lowest quality characteristics or with characteristics at the upper end of the tolerances. In stepping C0, the Core i5-14400F has up to about 31% higher power consumption than the Core i5-13400F.
Sure, there’s some increase in power consumption because of the 200 MHz higher CPU core clock speeds, but that’s also with stepping B0, where the power consumption is even reduced a bit. From about 112 W (Ci5-13400F) to about 108 W (Ci5-14400F). Some small percentage across samples may fluctuate (contrary to what is written in the endnote of the first chapter), but certainly not to the extent that these proportions reverse – this is already too much variation. And they also do well to point out that there is also some efficiency increases in manufacturing across generations even when using the same process, which is key to the company, in this case the Intel 7 Ultra. This reasoning logically fits quite well with the application of older wafers (C0) for lower-power (35 W) processor models (the 14400T and the 14500T), with which the lower efficiency is not as pronounced or they may even be more efficient in their operating range. This is never the case with 65W TDP models anymore, even at lighter workloads the Core i5-14400F stepping B0 is a lower-power processor.
In single-threaded workloads, the Ci5-14400F B0 is about 7% lower-power and in games it’s 12–34% to the detriment of the stepping C0. For gaming deployments, it should also be noted that in some cases the Ci5-14400F C0 is the faster processor, at 1080p and 1440p resolutions, a 17–25% higher average framerate is achieved in CS:GO, and +8% (at 1080p) is also achieved in DOOM Eternal, for example. We can assure you that this is definitely not a measurement error, it comes out like this repeatedly. At higher resolutions, when we consider FHD and QHD, stepping C0 is usually faster, which is then reflected in the higher average gaming performance by 3%, or 5%. In UHD (2160p) it’s only 2%, but with a more powerful graphics card than the RTX 3080/RTX 4070 or RX 7800 XT, it can be more.
CPU core clock speeds are virtually the same across different workloads for both Core i5-14400F steppings, and as far as temperatures are concerned, they’re lower with the B0. The higher temperatures of the C0 are mainly related to the higher power consumption, the smaller die area (approx. 209 vs. 257 mm2) seems to have a minimal impact on them.
For a general assessment of the Core i5-14400, see the standard analysis, this one was only aimed at comparing existing steppings against each other. In terms of verbal evaluation and recommendations, nothing fundamentally changes, although the C0 stepping is more in line with the “Approved” award than the “Smart buy!” one (given to the Ci5-14400F stepping B0).
English translation and edit by Jozef Dudáš
| Intel Core i5-14400F (C0) |
| + Up to 10 cores and 16 threads |
| + Higher multi-threaded performance compared to the R5 7600 |
| + Attractive price/performance ratio (especially multi-threaded) |
| + High single-threaded performance. Higher than the Core i5-13400F |
| + Gaming performance sometimes higher than the Core i5-14400F stepping B0 |
| + Regardless of load intensity, high power efficiency |
| + Low idle power consumption |
| + Very high performance per clock |
| + Advanced 7nm manufacturing node |
| + Low temperatures |
| + In some cases, top-notch gaming performance... |
| ... but in some games lower than the Core i5-12400(F) due to E cores slowing down |
| - Relatively lower efficiency (still below Core i5-14600K at maximum performance) |
| - Single-threaded performance significantly lower than the Ryzen 5 7600 |
| - Does not have an integrated graphics core |
| - Poor availability. At least regarding retail |
| Approximate retail price: 196 EUR |
ZWe are grateful to Datacomp e-shop for cooperation in providing the tested hardware
![]()

Special thanks also to Blackmagic Design (for DaVinci Resolve Studio license), Topaz Labs (for DeNoise AI, Gigapixel AI and Sharpen AI licenses) and Zoner (for Photo Studio X license)
- Contents
- Intel Core i5-14400F (C0 vs. B0)
- Methodology: performance tests
- Methodology: how we measure power draw
- Methodology: temperature and clock speed tests
- Test setup
- 3DMark
- Assassin’s Creed: Valhalla
- Borderlands 3
- Counter-Strike: GO
- Cyberpunk 2077
- DOOM Eternal
- F1 2020
- Metro Exodus
- Microsoft Flight Simulator
- Shadow of the Tomb Raider
- Total War Saga: Troy
- Overall gaming performance
- Gaming performance per euro
- PCMark and Geekbench
- Web performance
- 3D rendering: Cinebench, Blender, ...
- Video 1/2: Adobe Premiere Pro
- Video 2/2: DaVinci Resolve Studio
- Graphics effects: Adobe After Effects
- Video encoding
- Audio encoding
- Broadcasting (OBS and Xsplit)
- Photos 1/2: Adobe Photoshop and Lightroom
- Photos 2/2: Affinity Photo, Topaz Labs AI Apps, ZPS X, ...
- (De)compression
- (De)encryption
- Numerical computing
- Simulations
- Memory and cache tests
- Processor power draw curve
- Average processor power draw
- Performance per watt
- Achieved CPU clock speed
- CPU temperature
- Conclusion