


Test setup
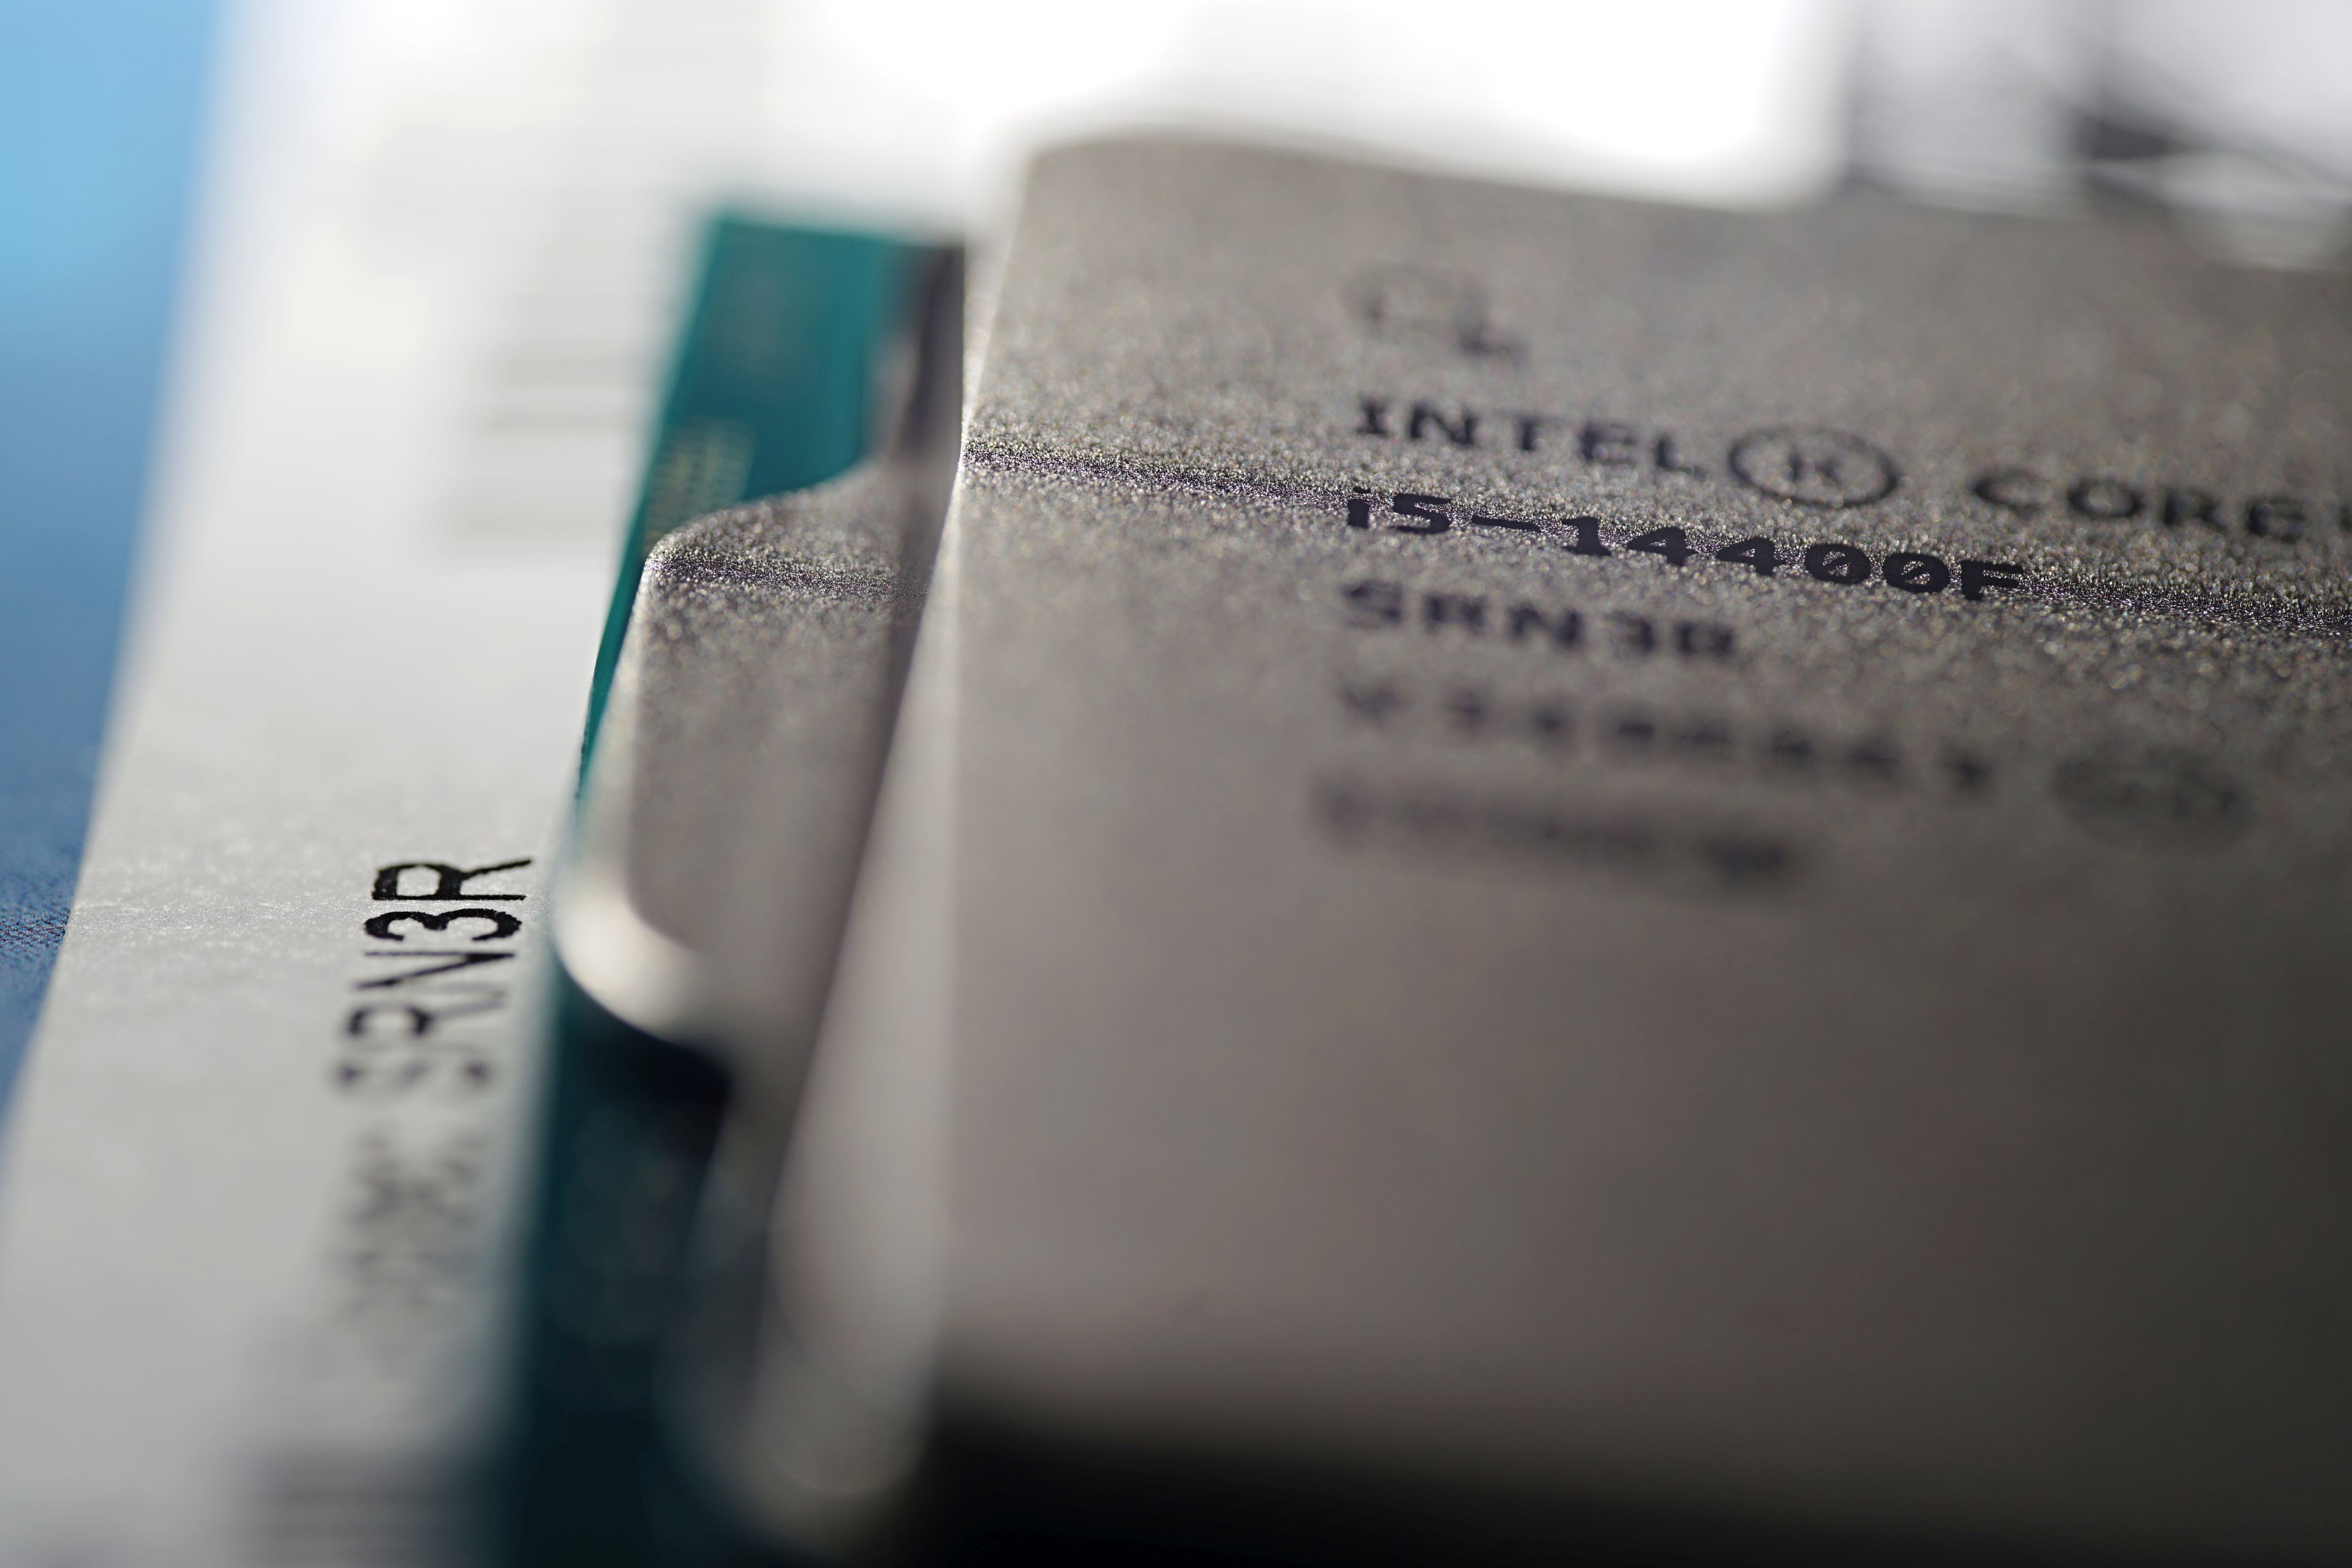
For completeness of Intel Core i5-14400F processor tests we add the results of its second stepping. We’ve already tested the B0 variant, now it’s time for the C0. Its availability in stores is, at least at the moment, considerably worse and the question arises whether it is worth it at all. Is there any point in aiming for stepping C0 or is B0 also “okay”? Or does it “not matter” (what you get in the shopping lottery)?
Test setup
| Test configuration | |
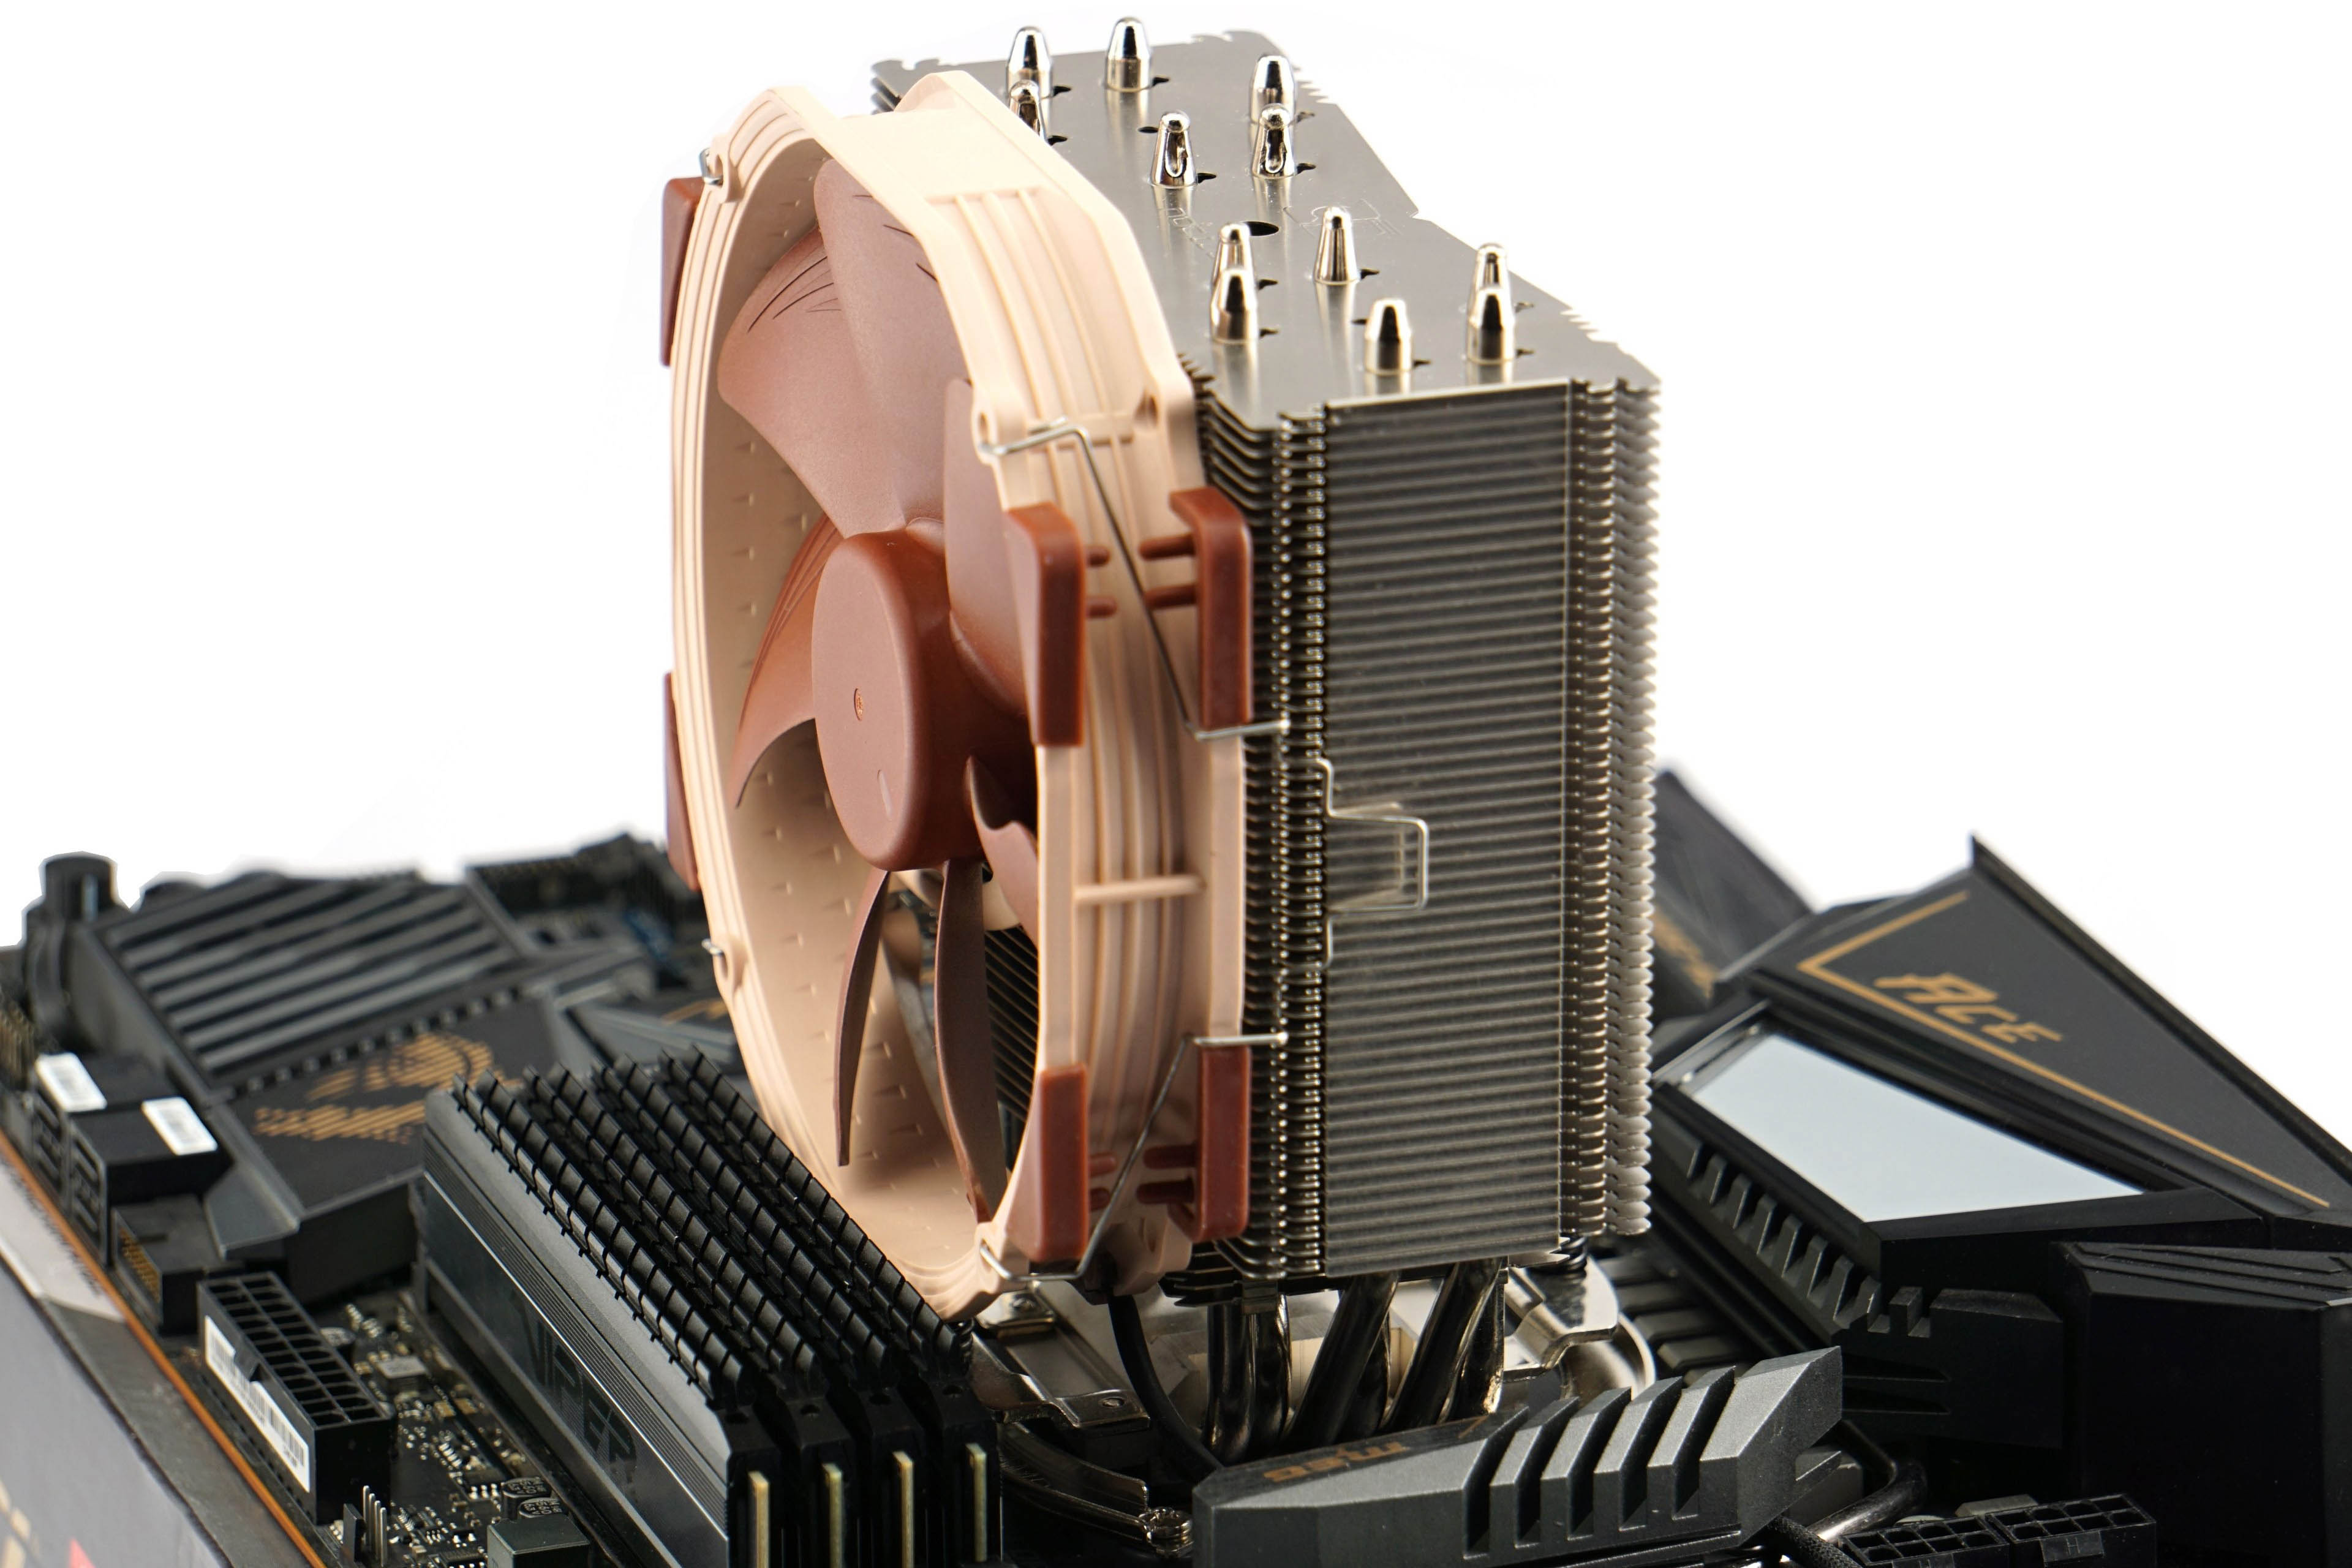
| CPU cooler | Noctua NH-U14S@12 V |
| Thermal compound | Noctua NT-H2 |
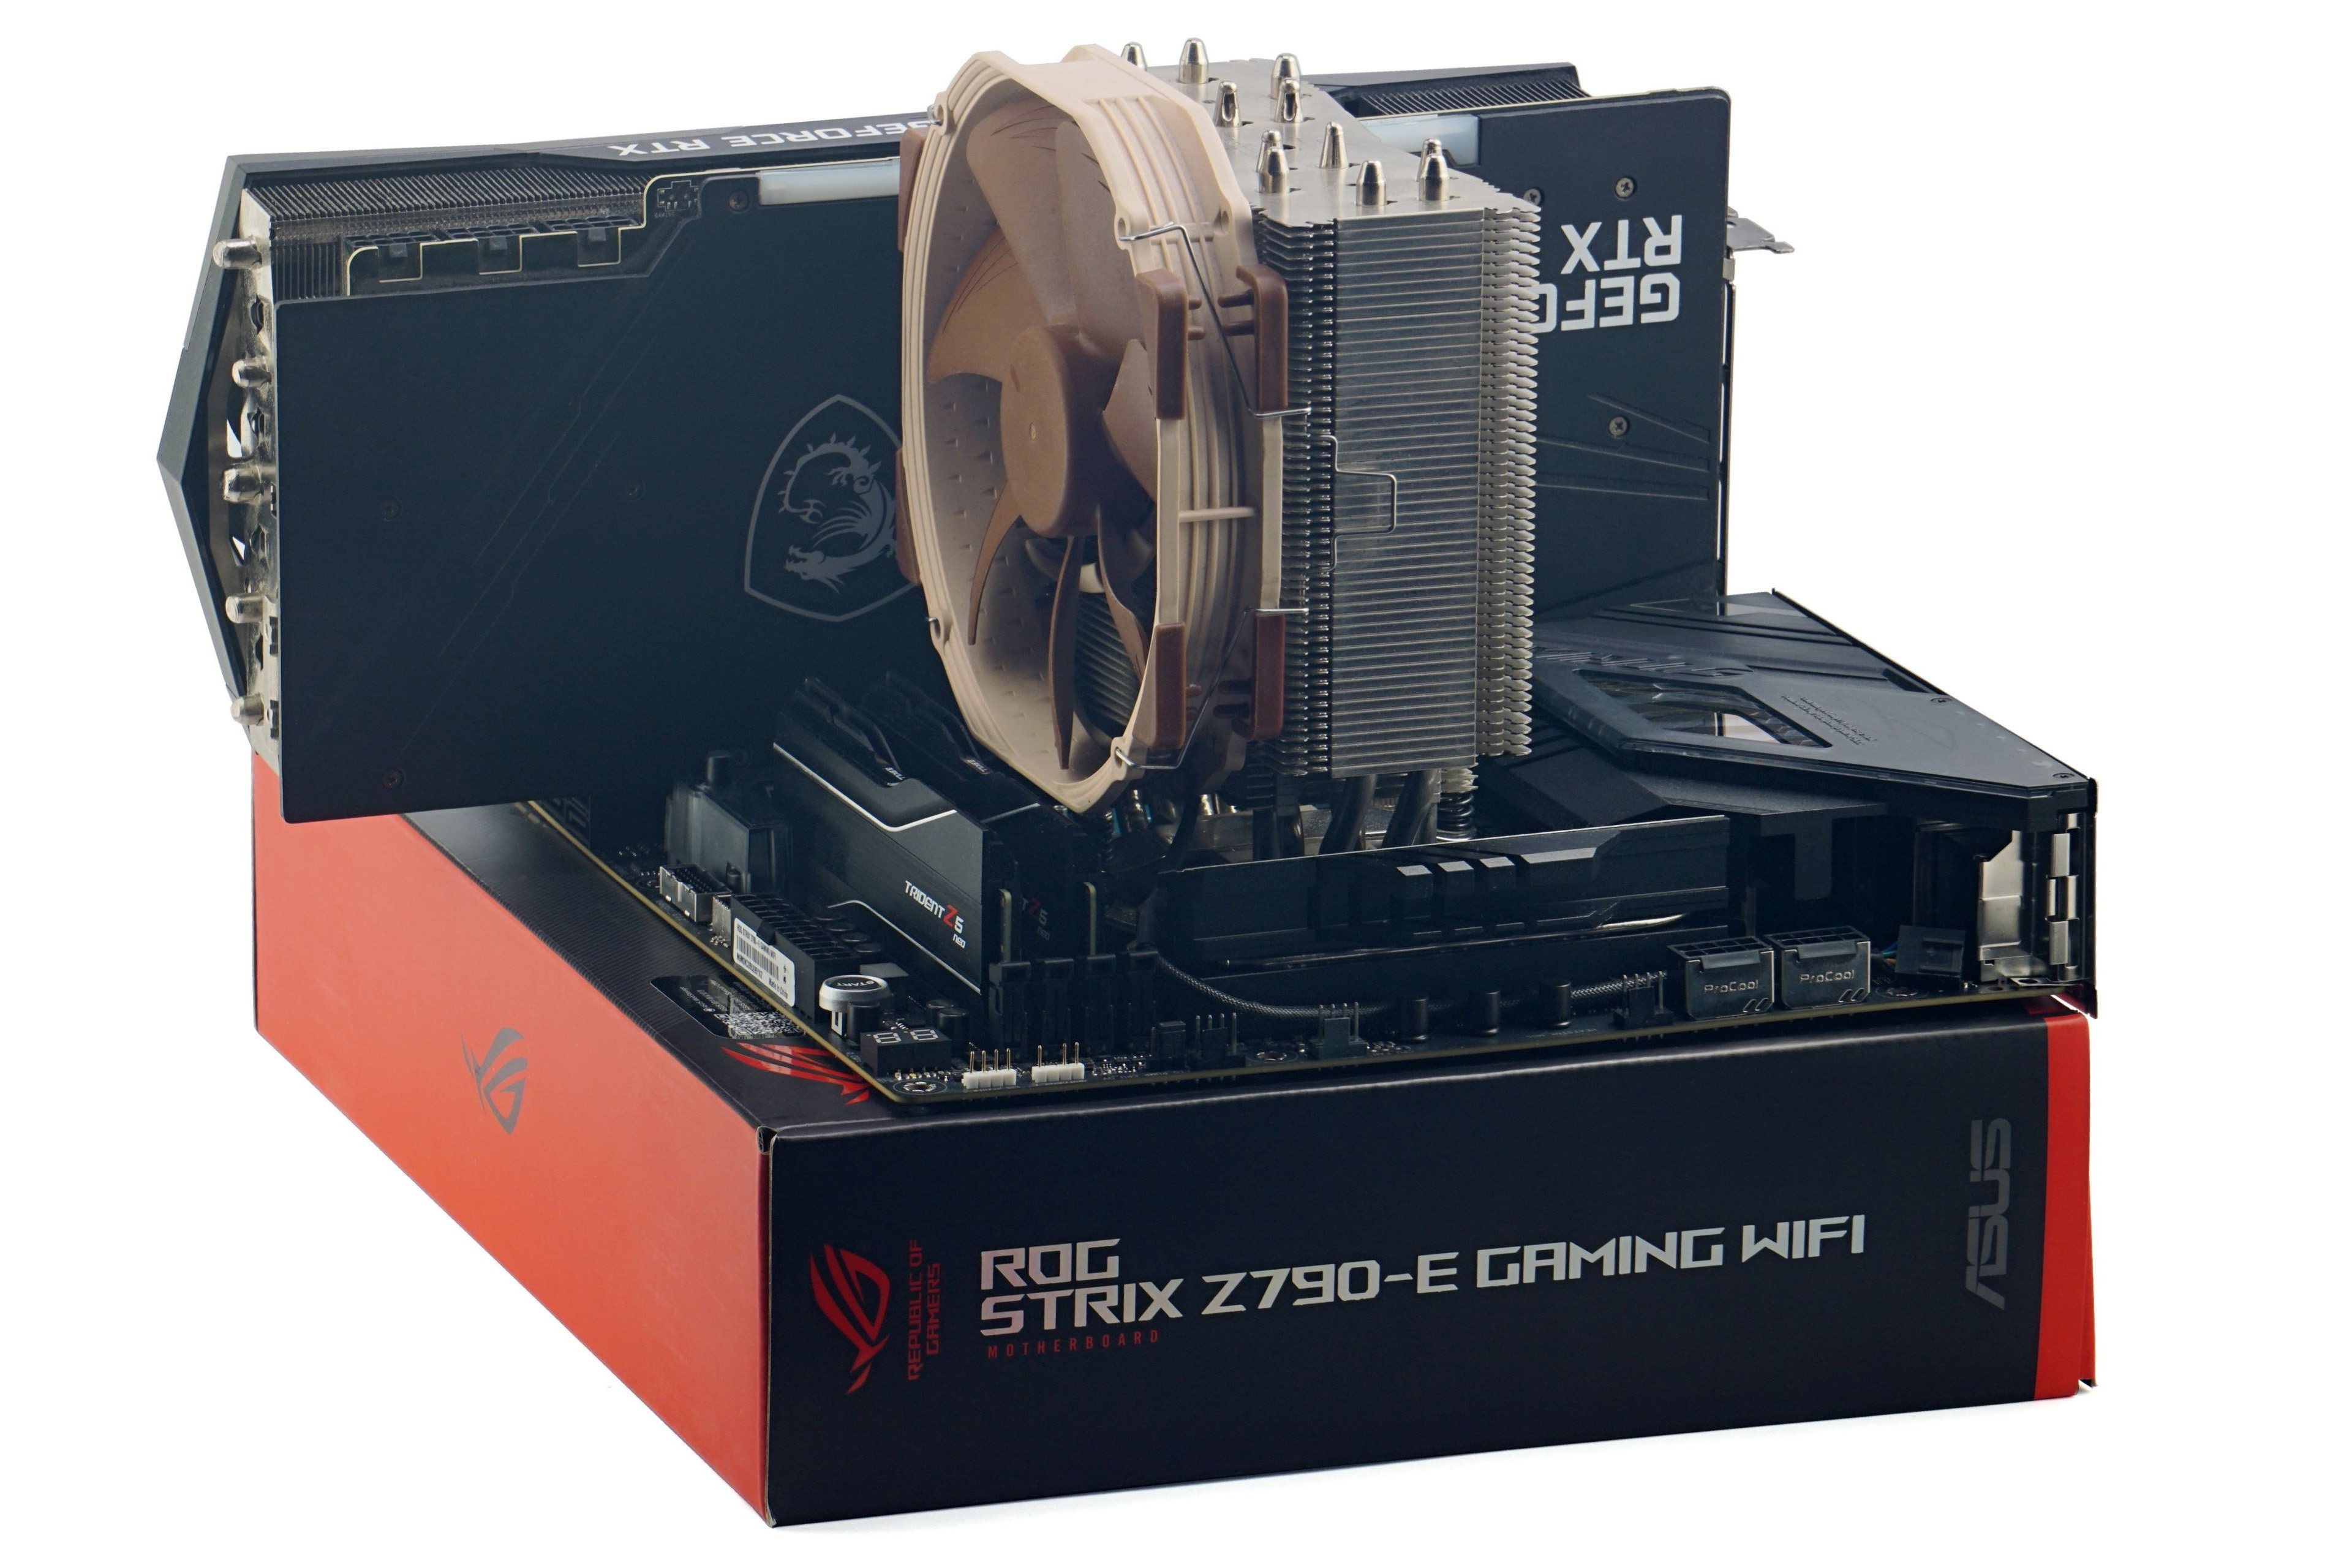
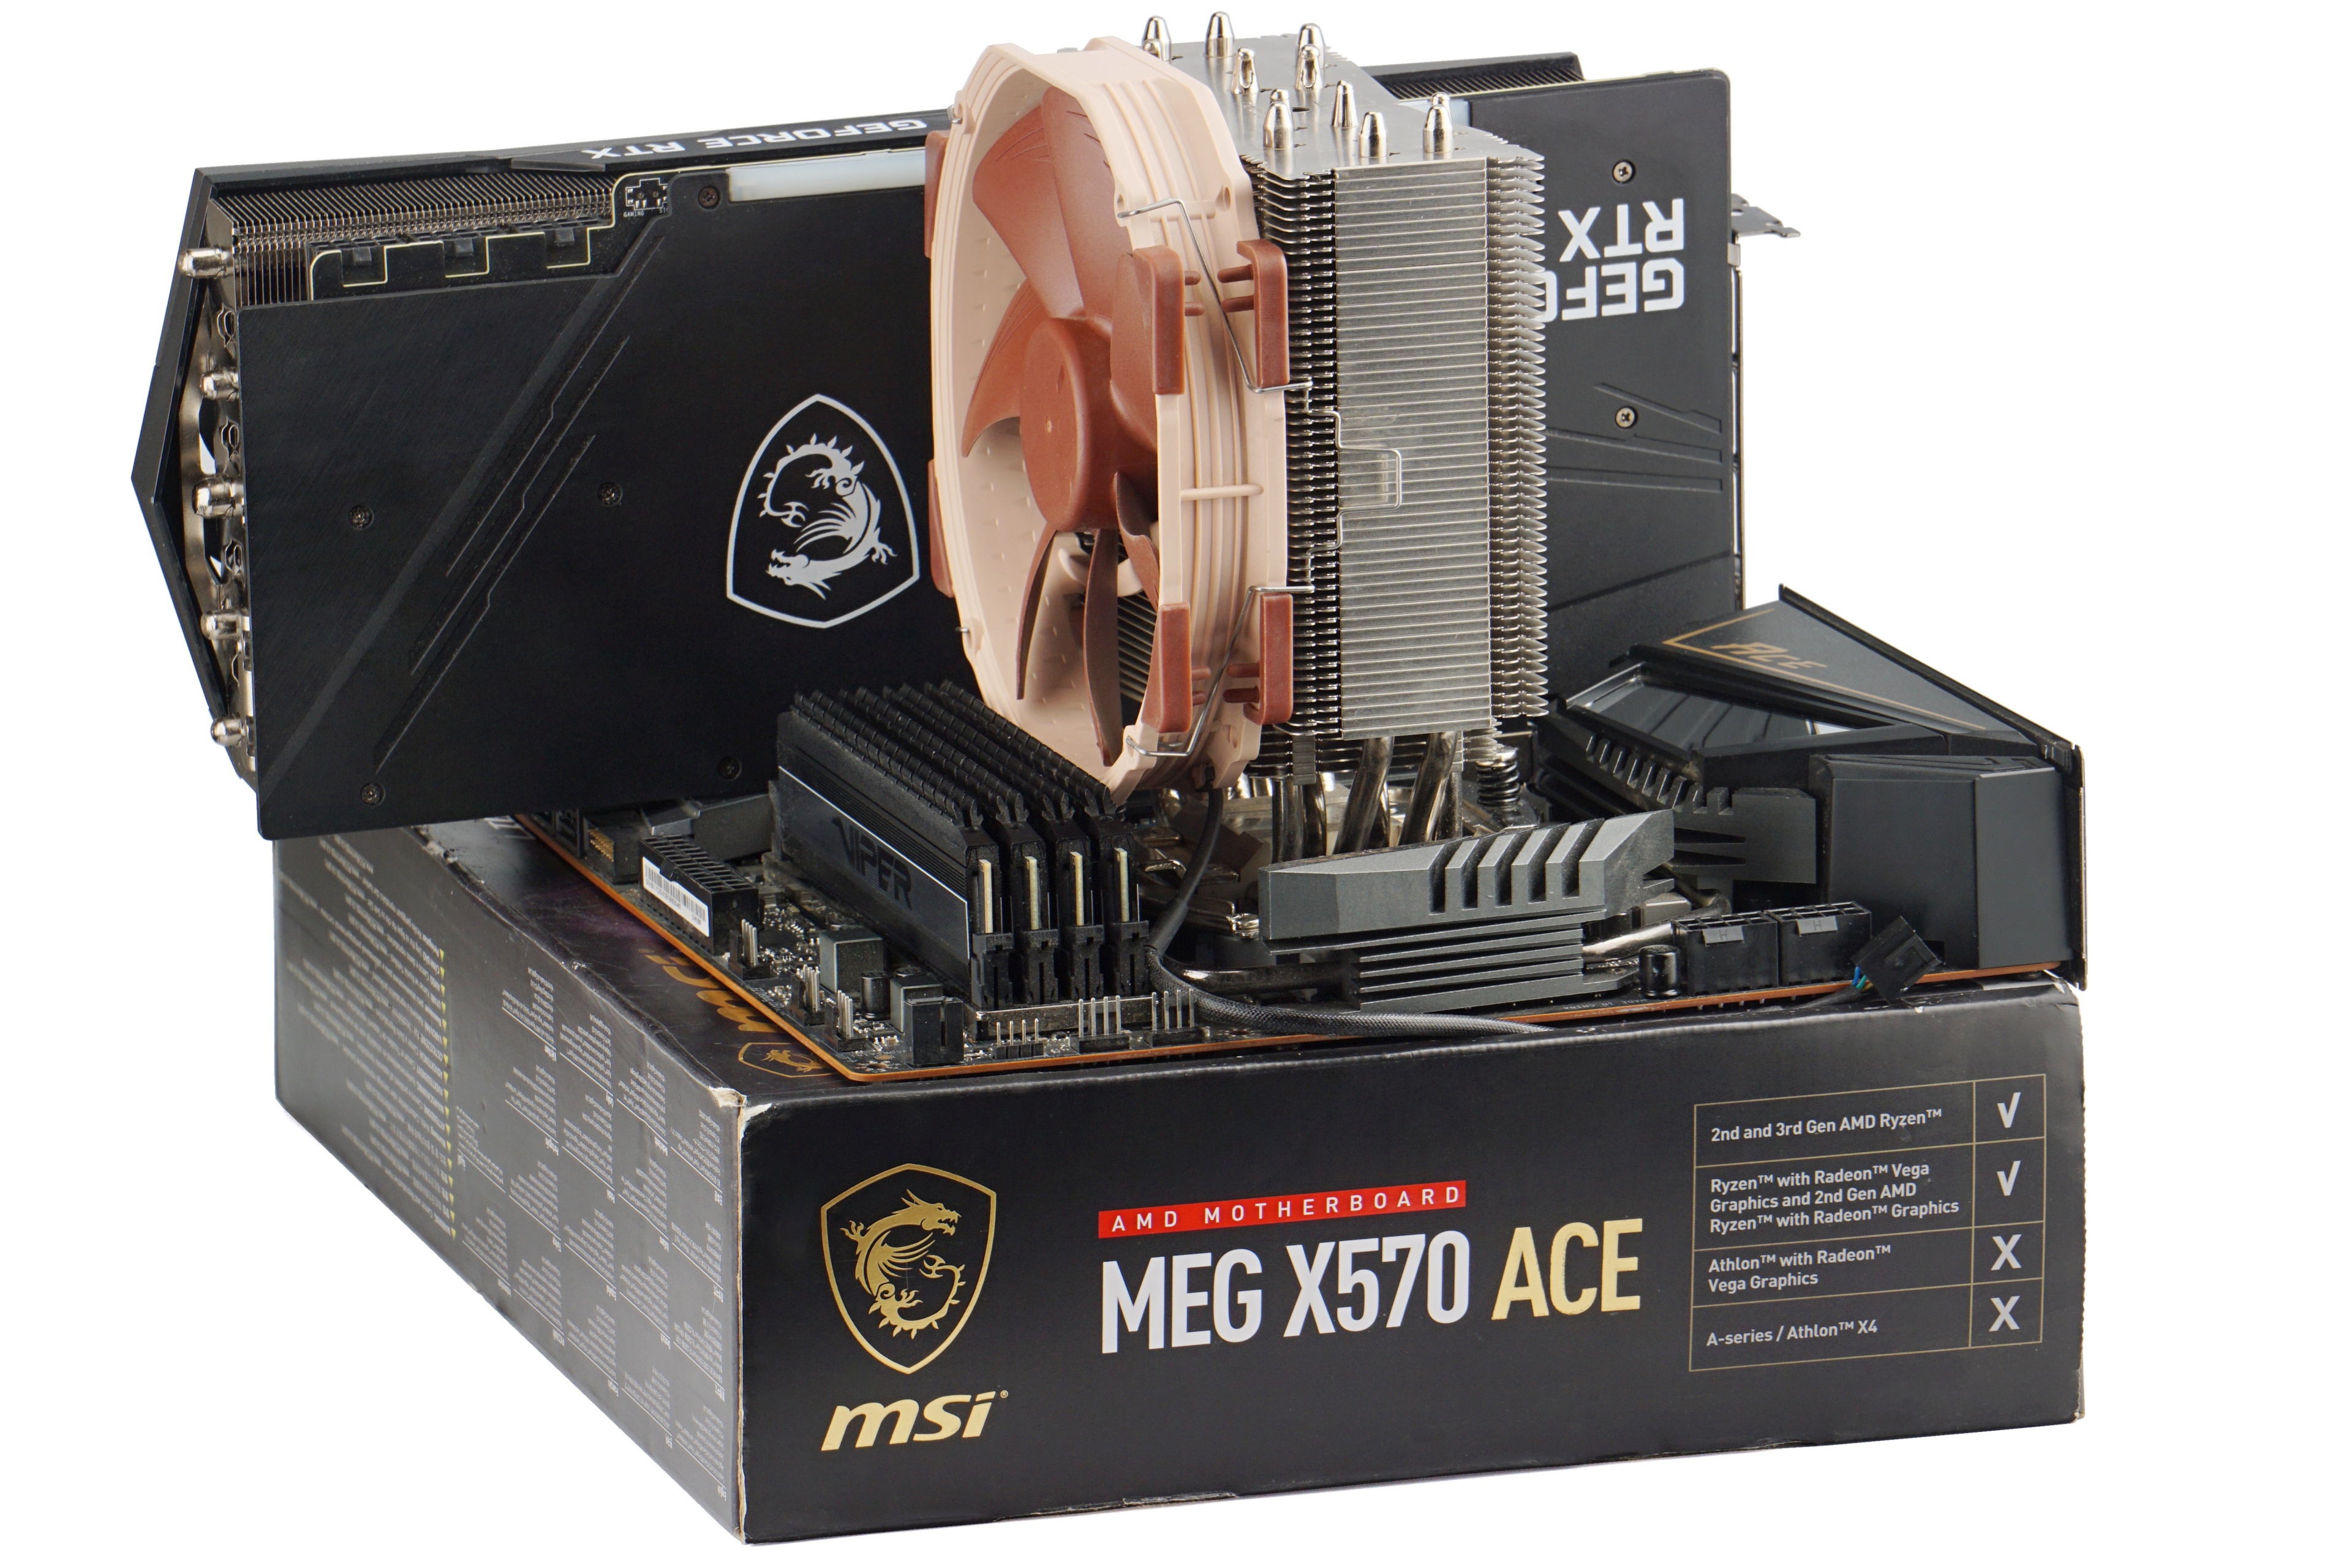
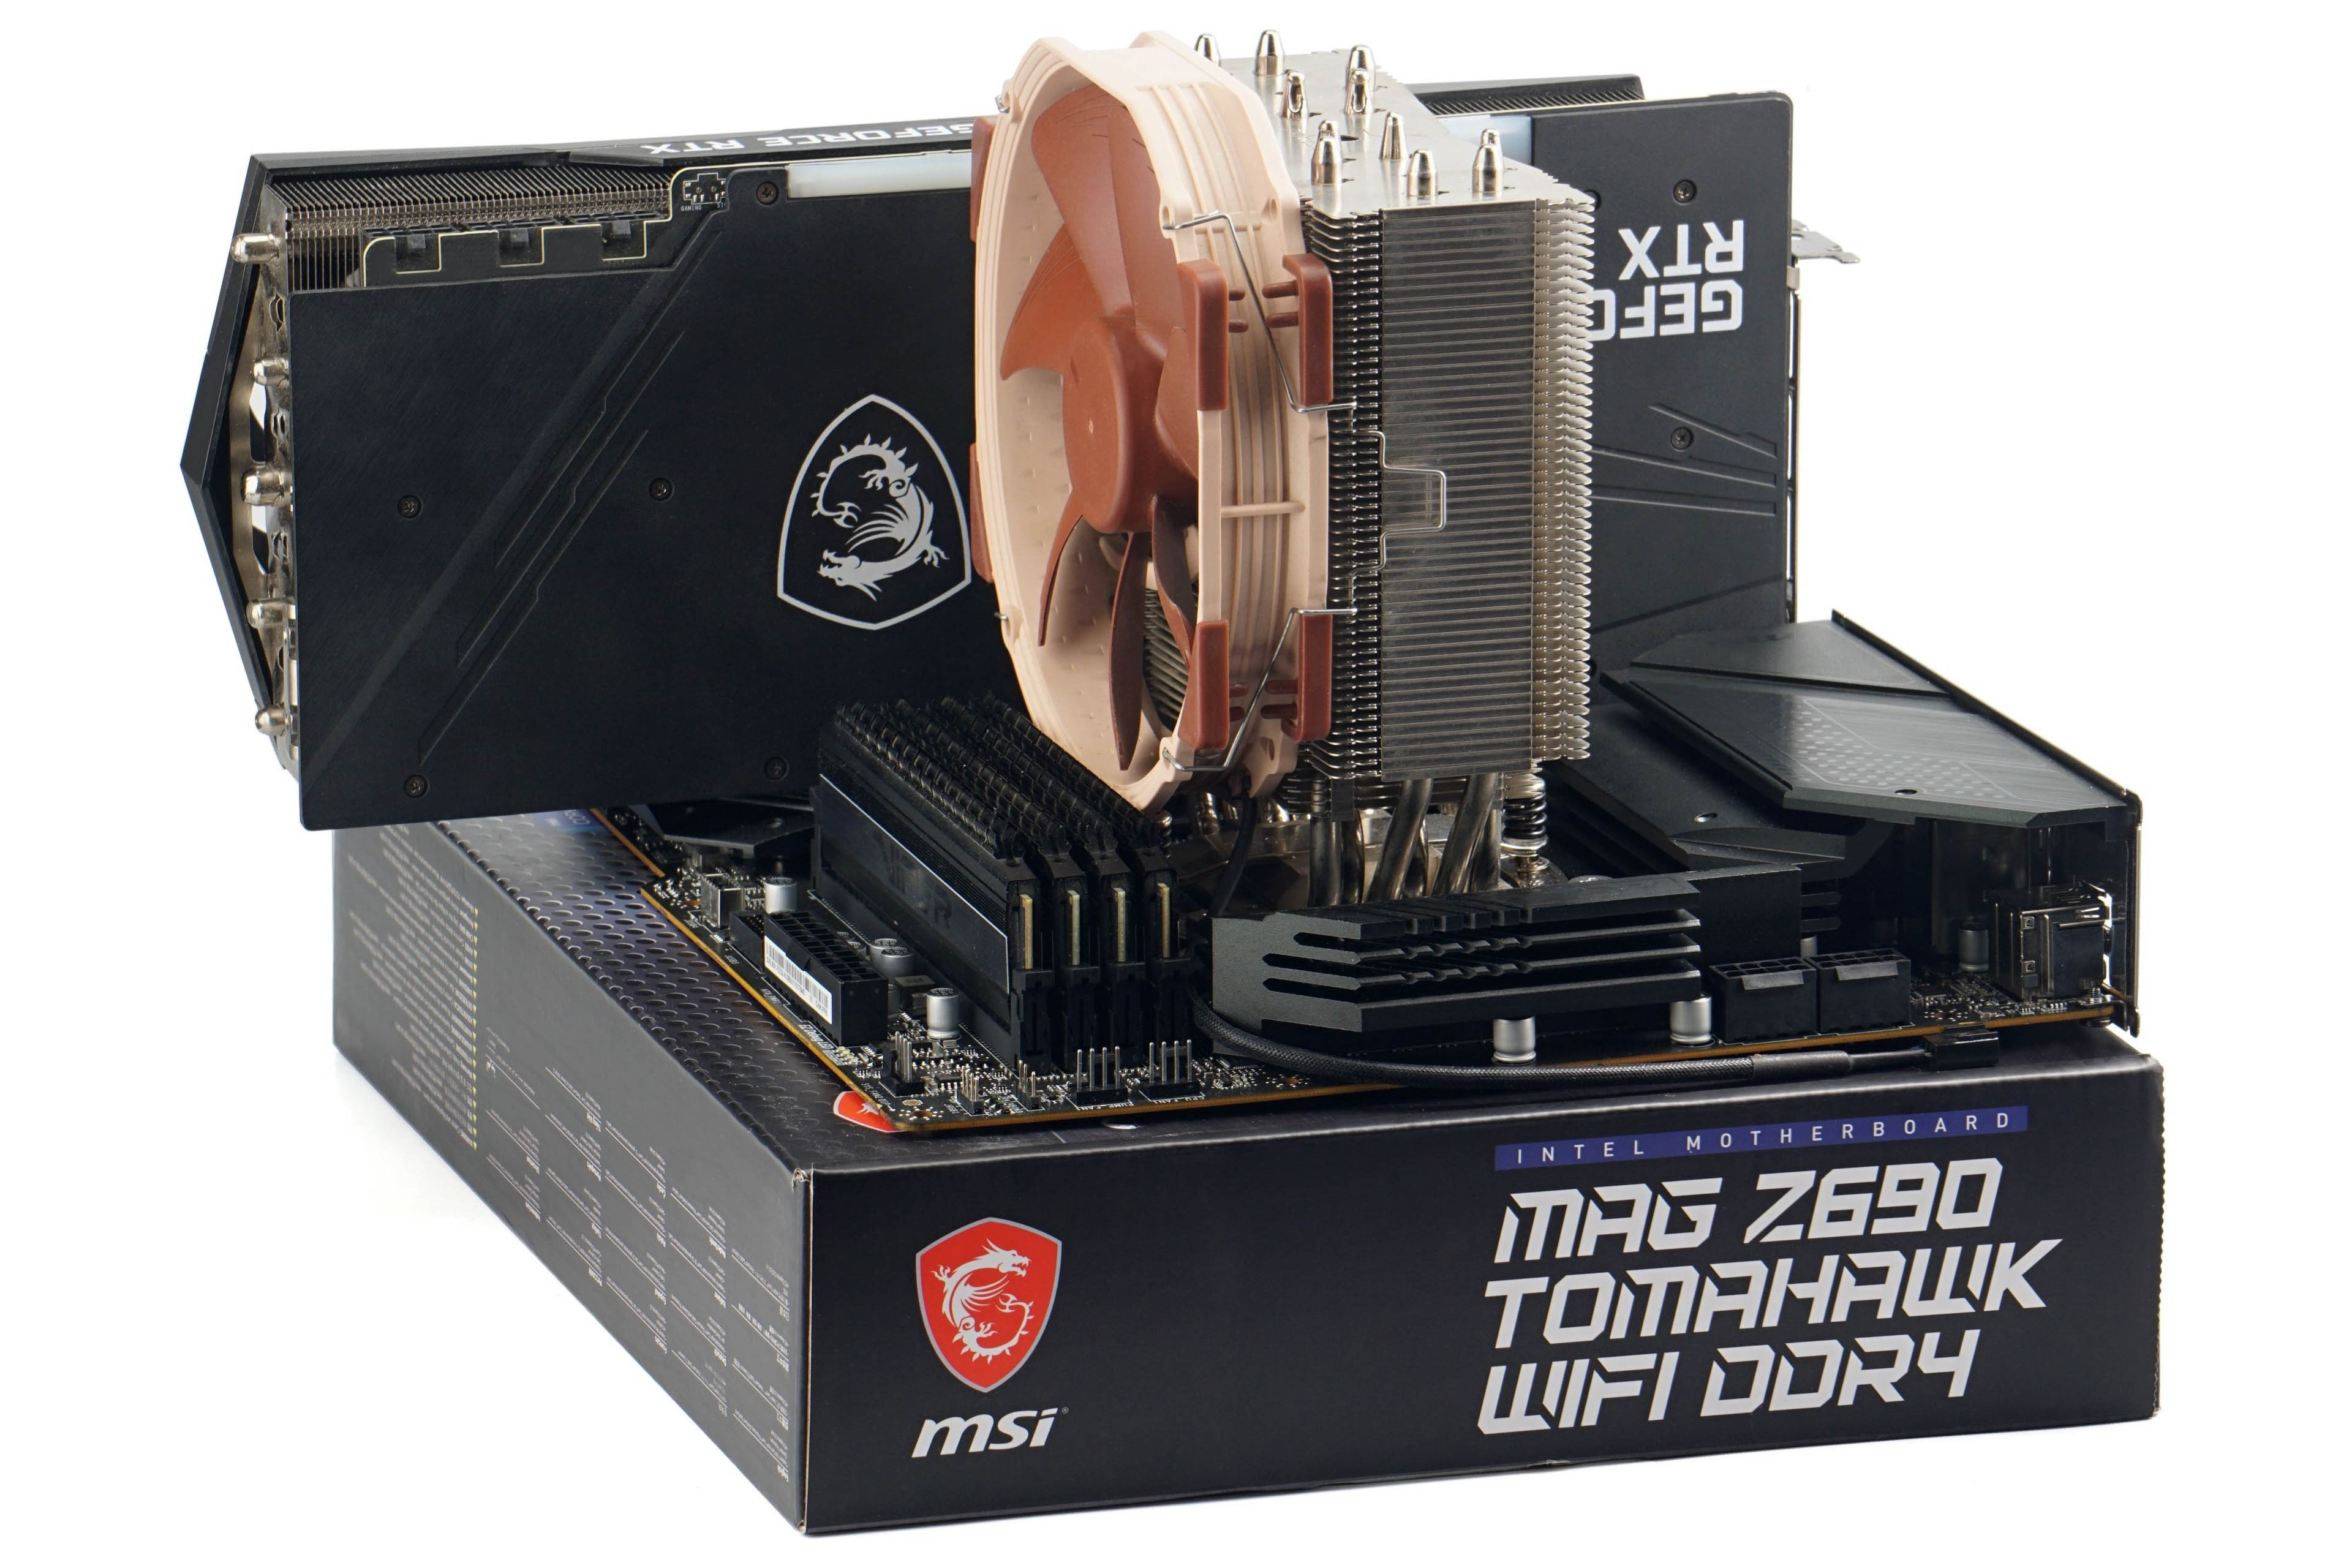
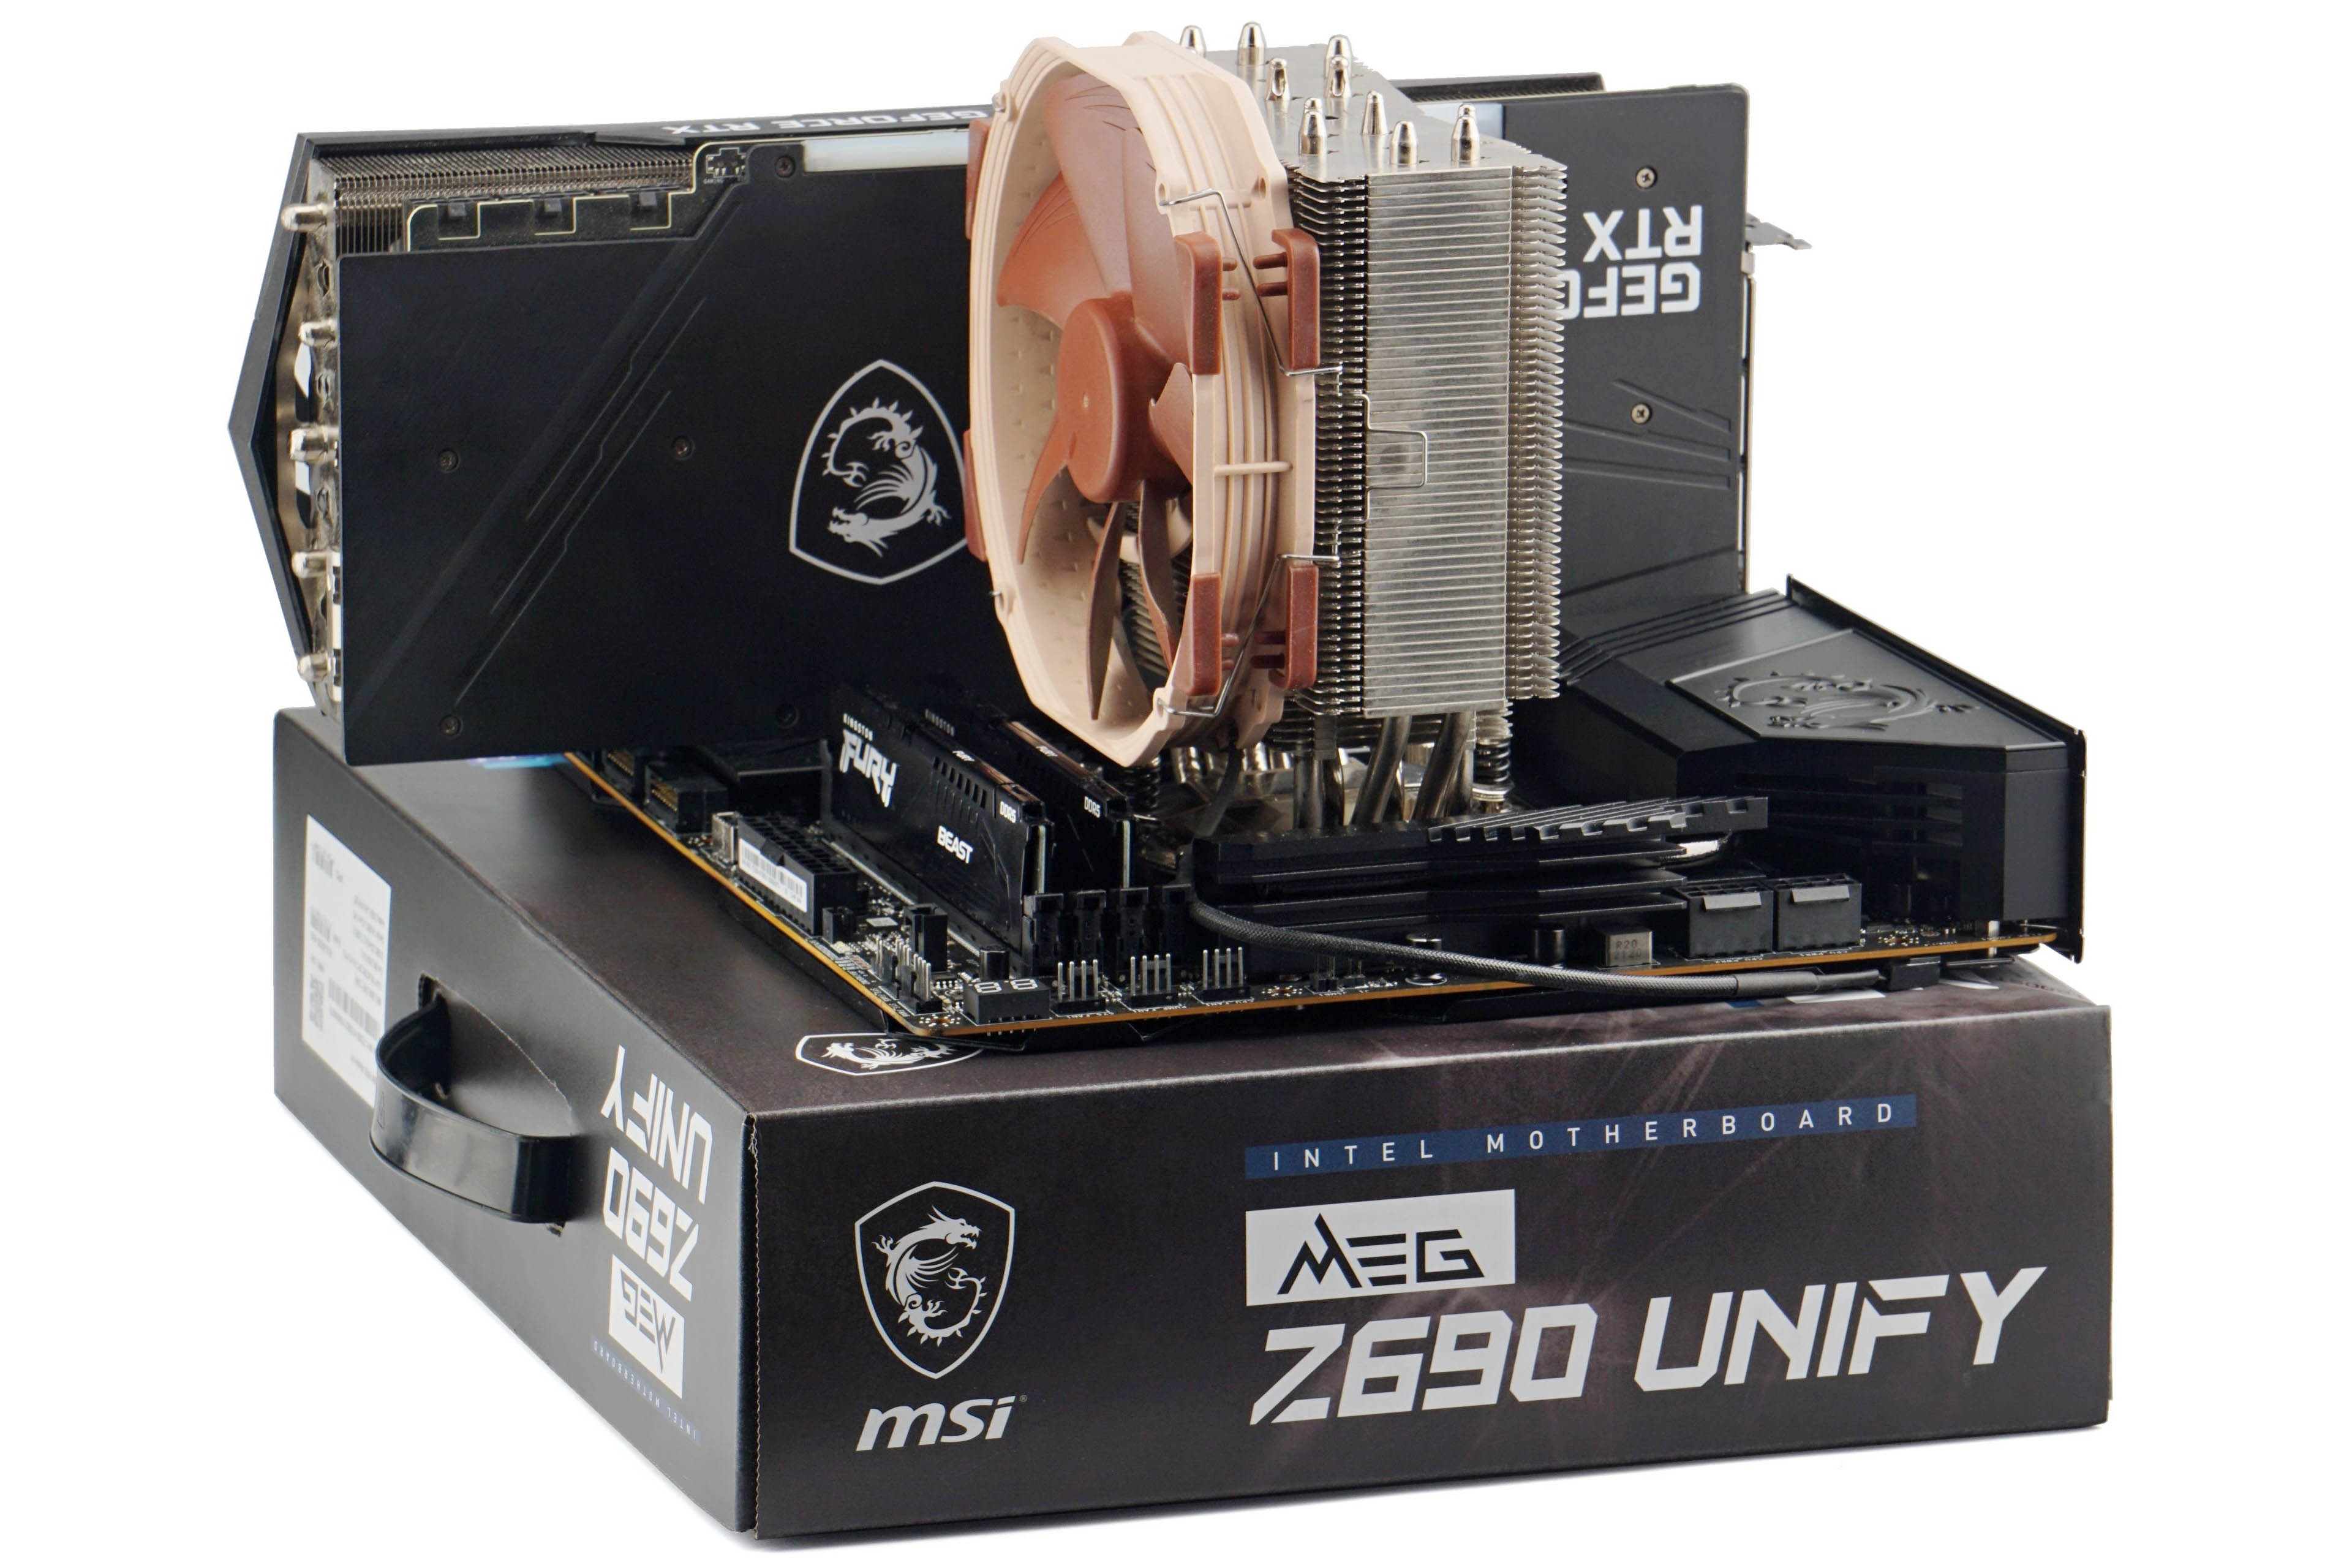
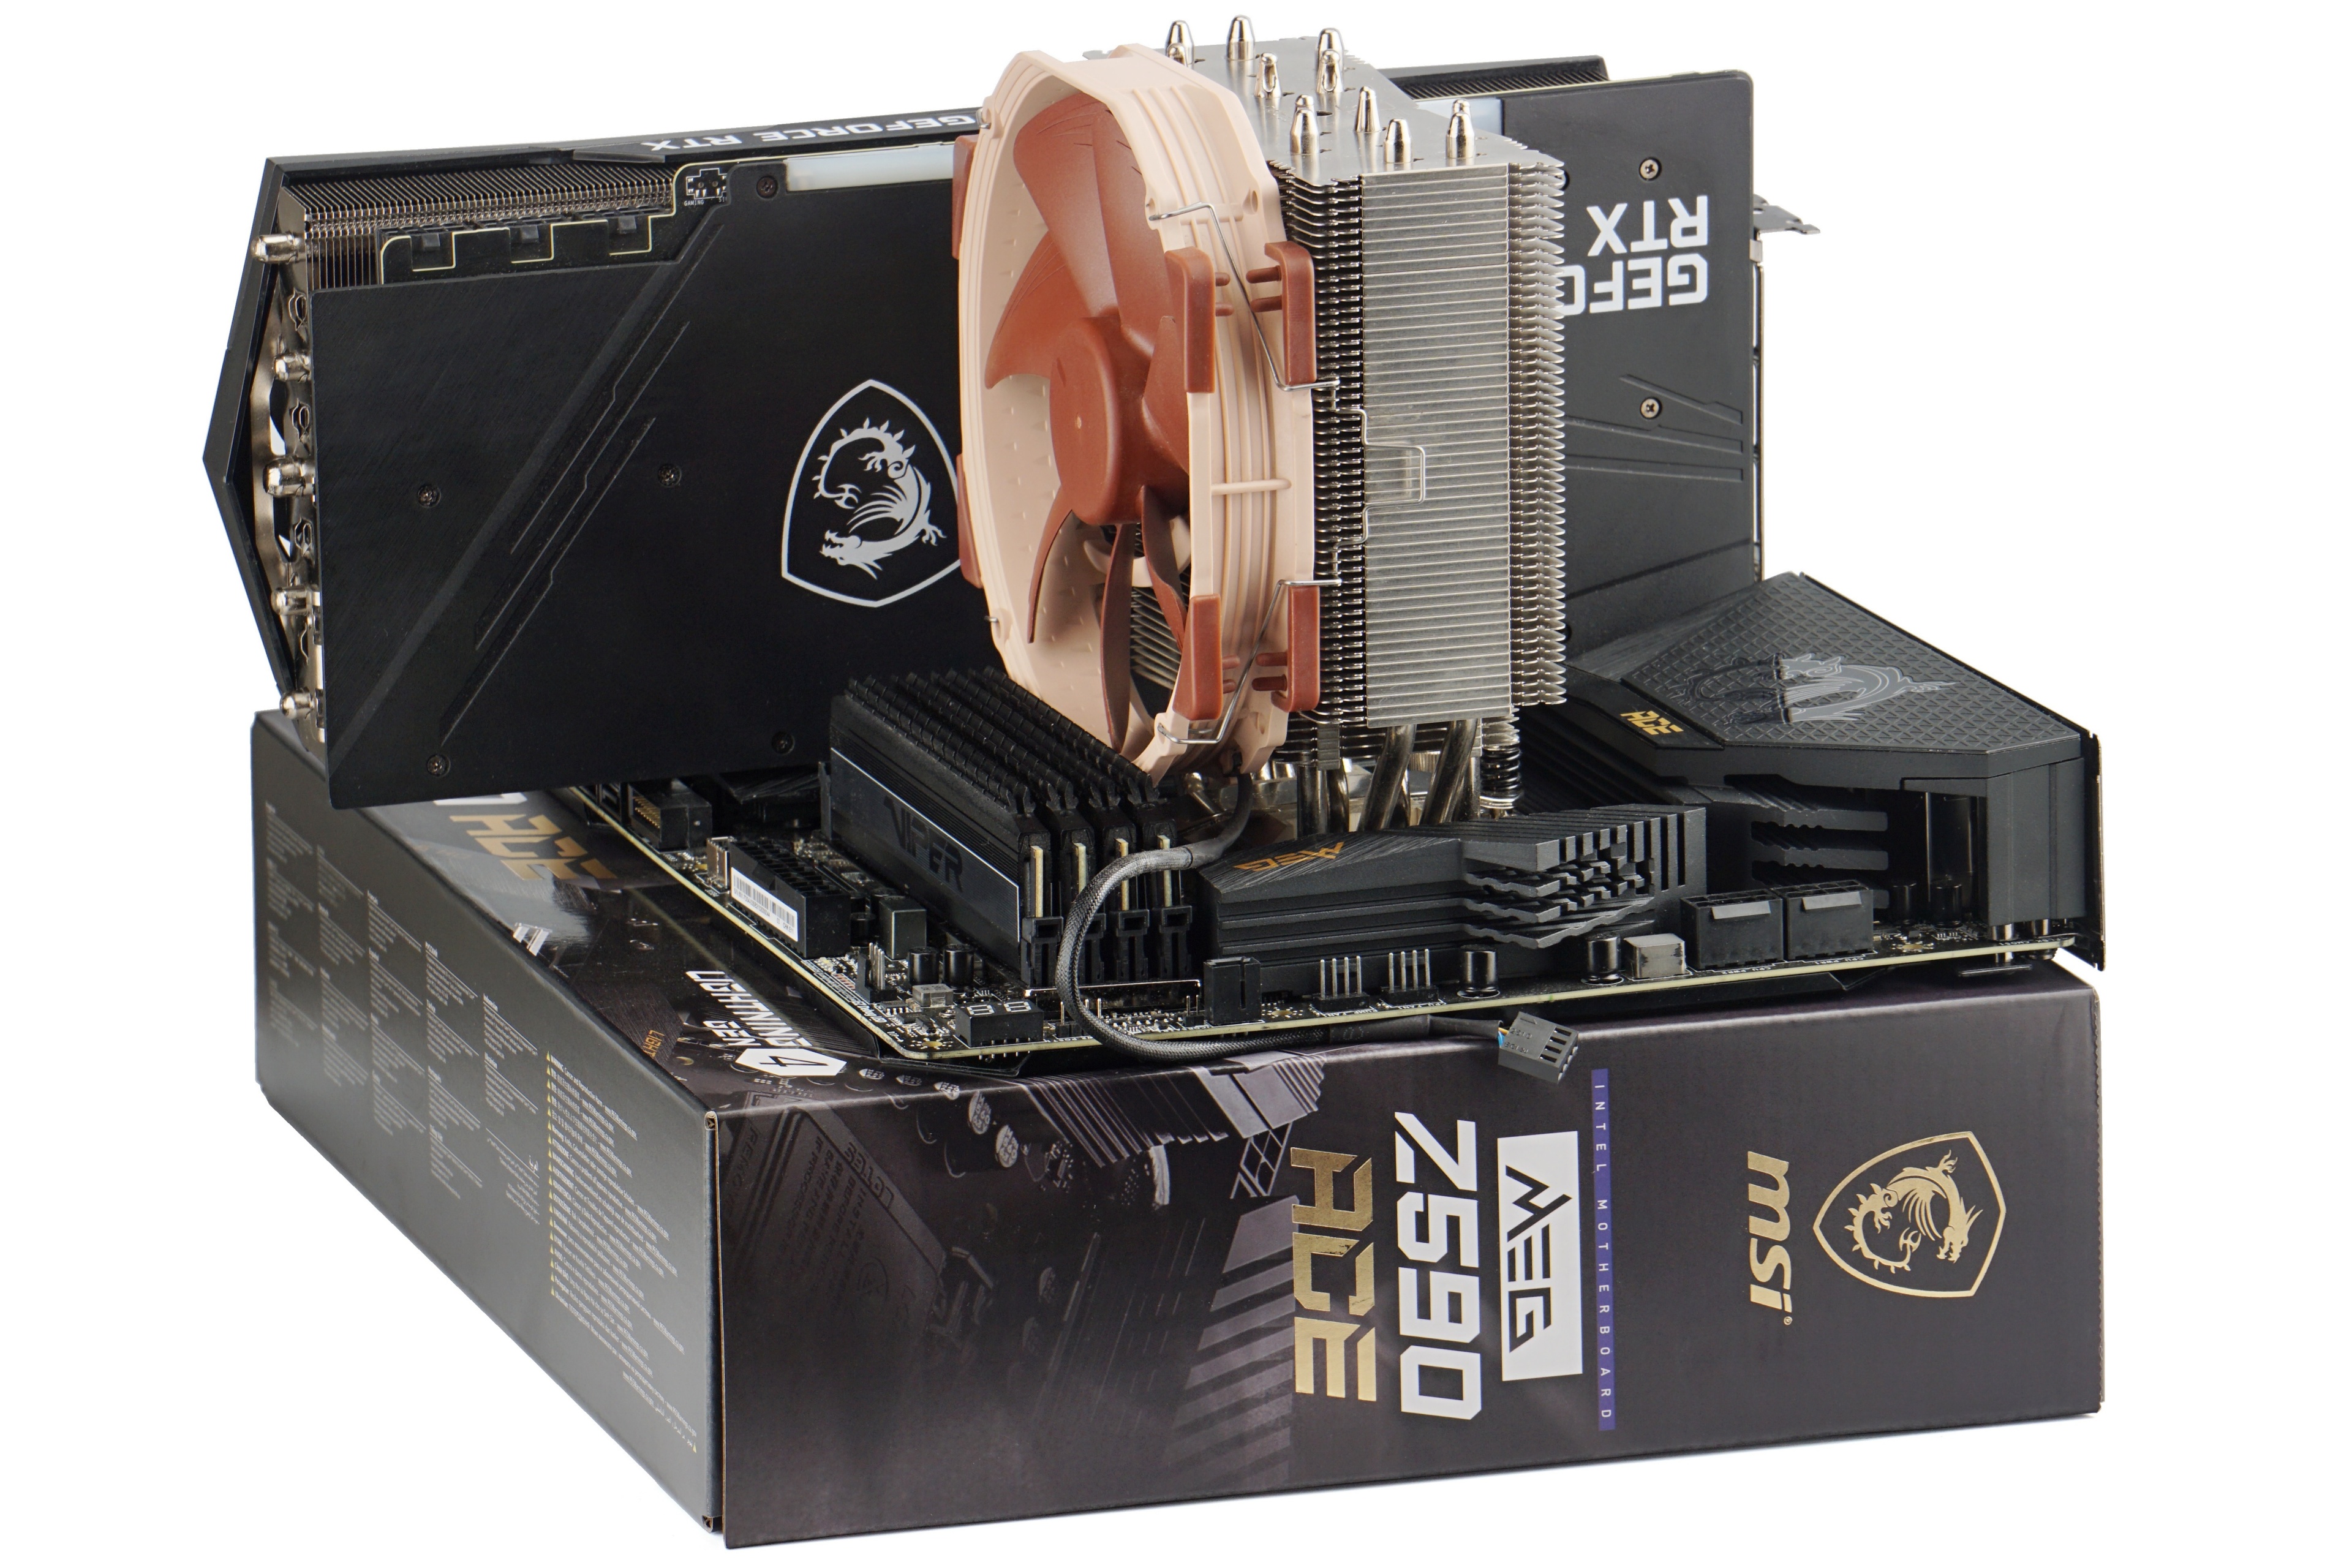
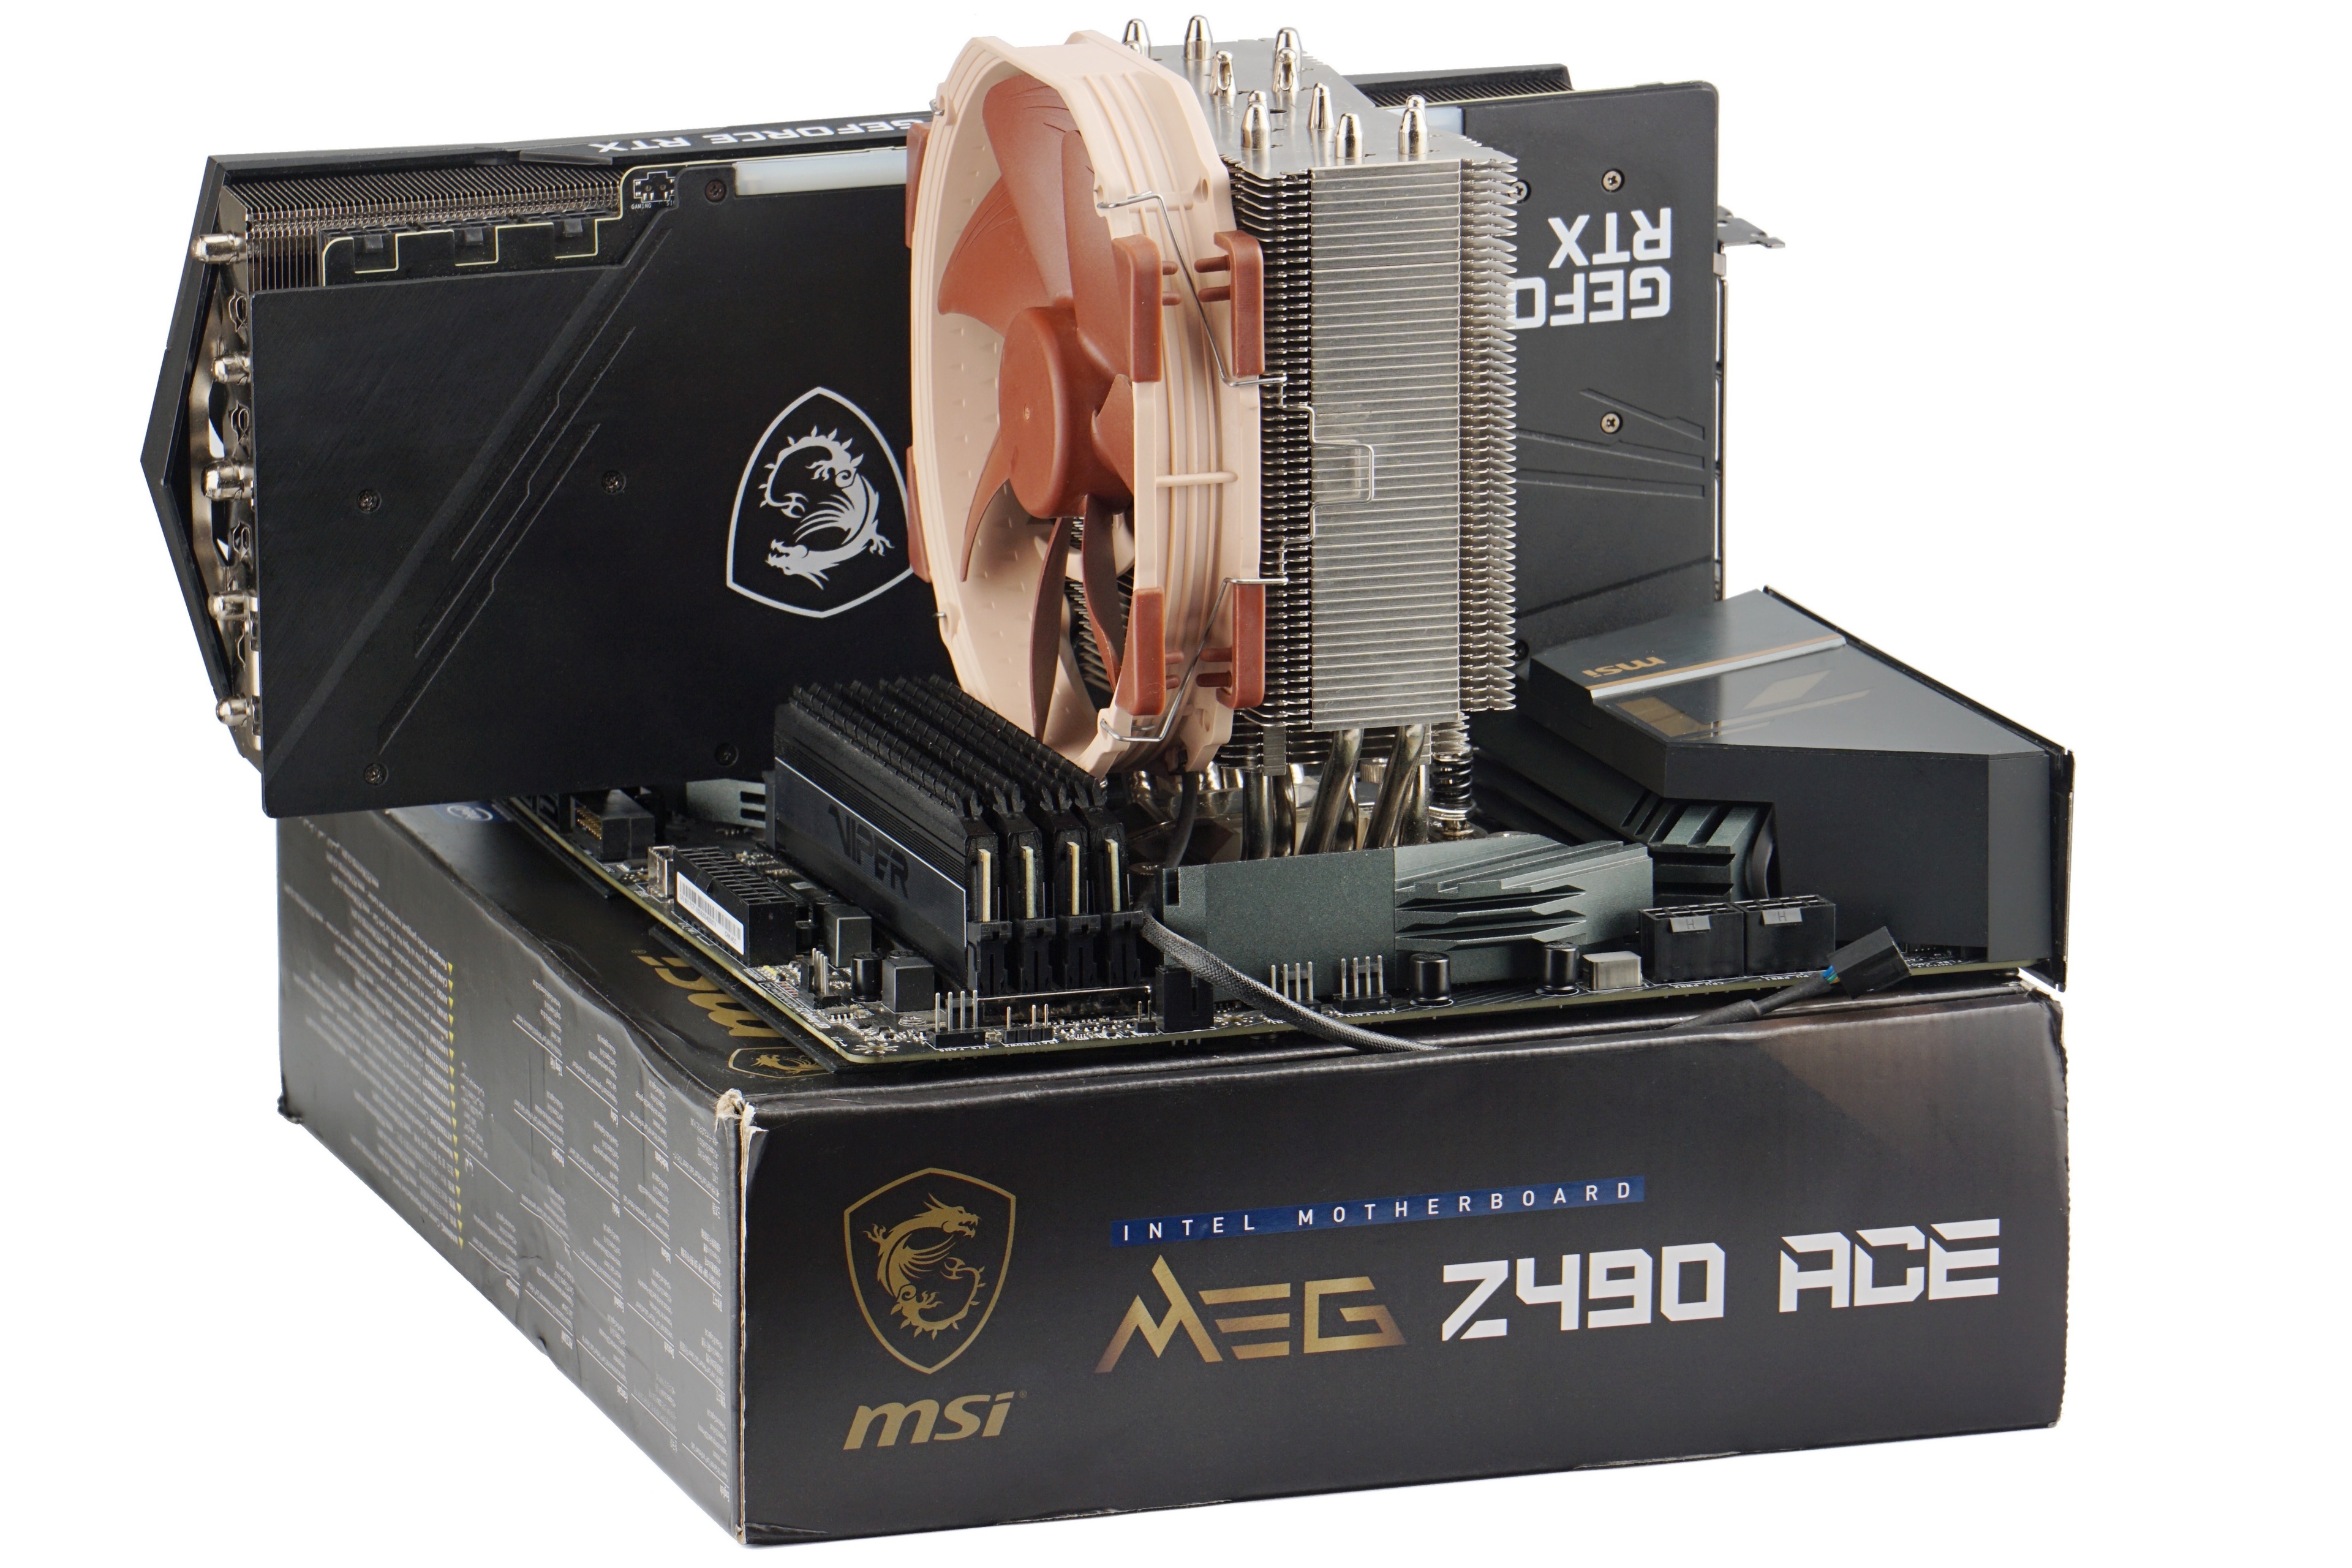
| Motherboard * | Acc. to processor: ASRock B650E Taichi, MSI MEG X670E Ace, Asus ROG Strix Z790-E Gaming WiFi, MEG X570 Ace, MEG Z690 Unify, MAG Z690 Tomahawk WiFi DDR4, Z590 Ace, MSI MEG X570 Ace alebo MSI MEG Z490 Ace |
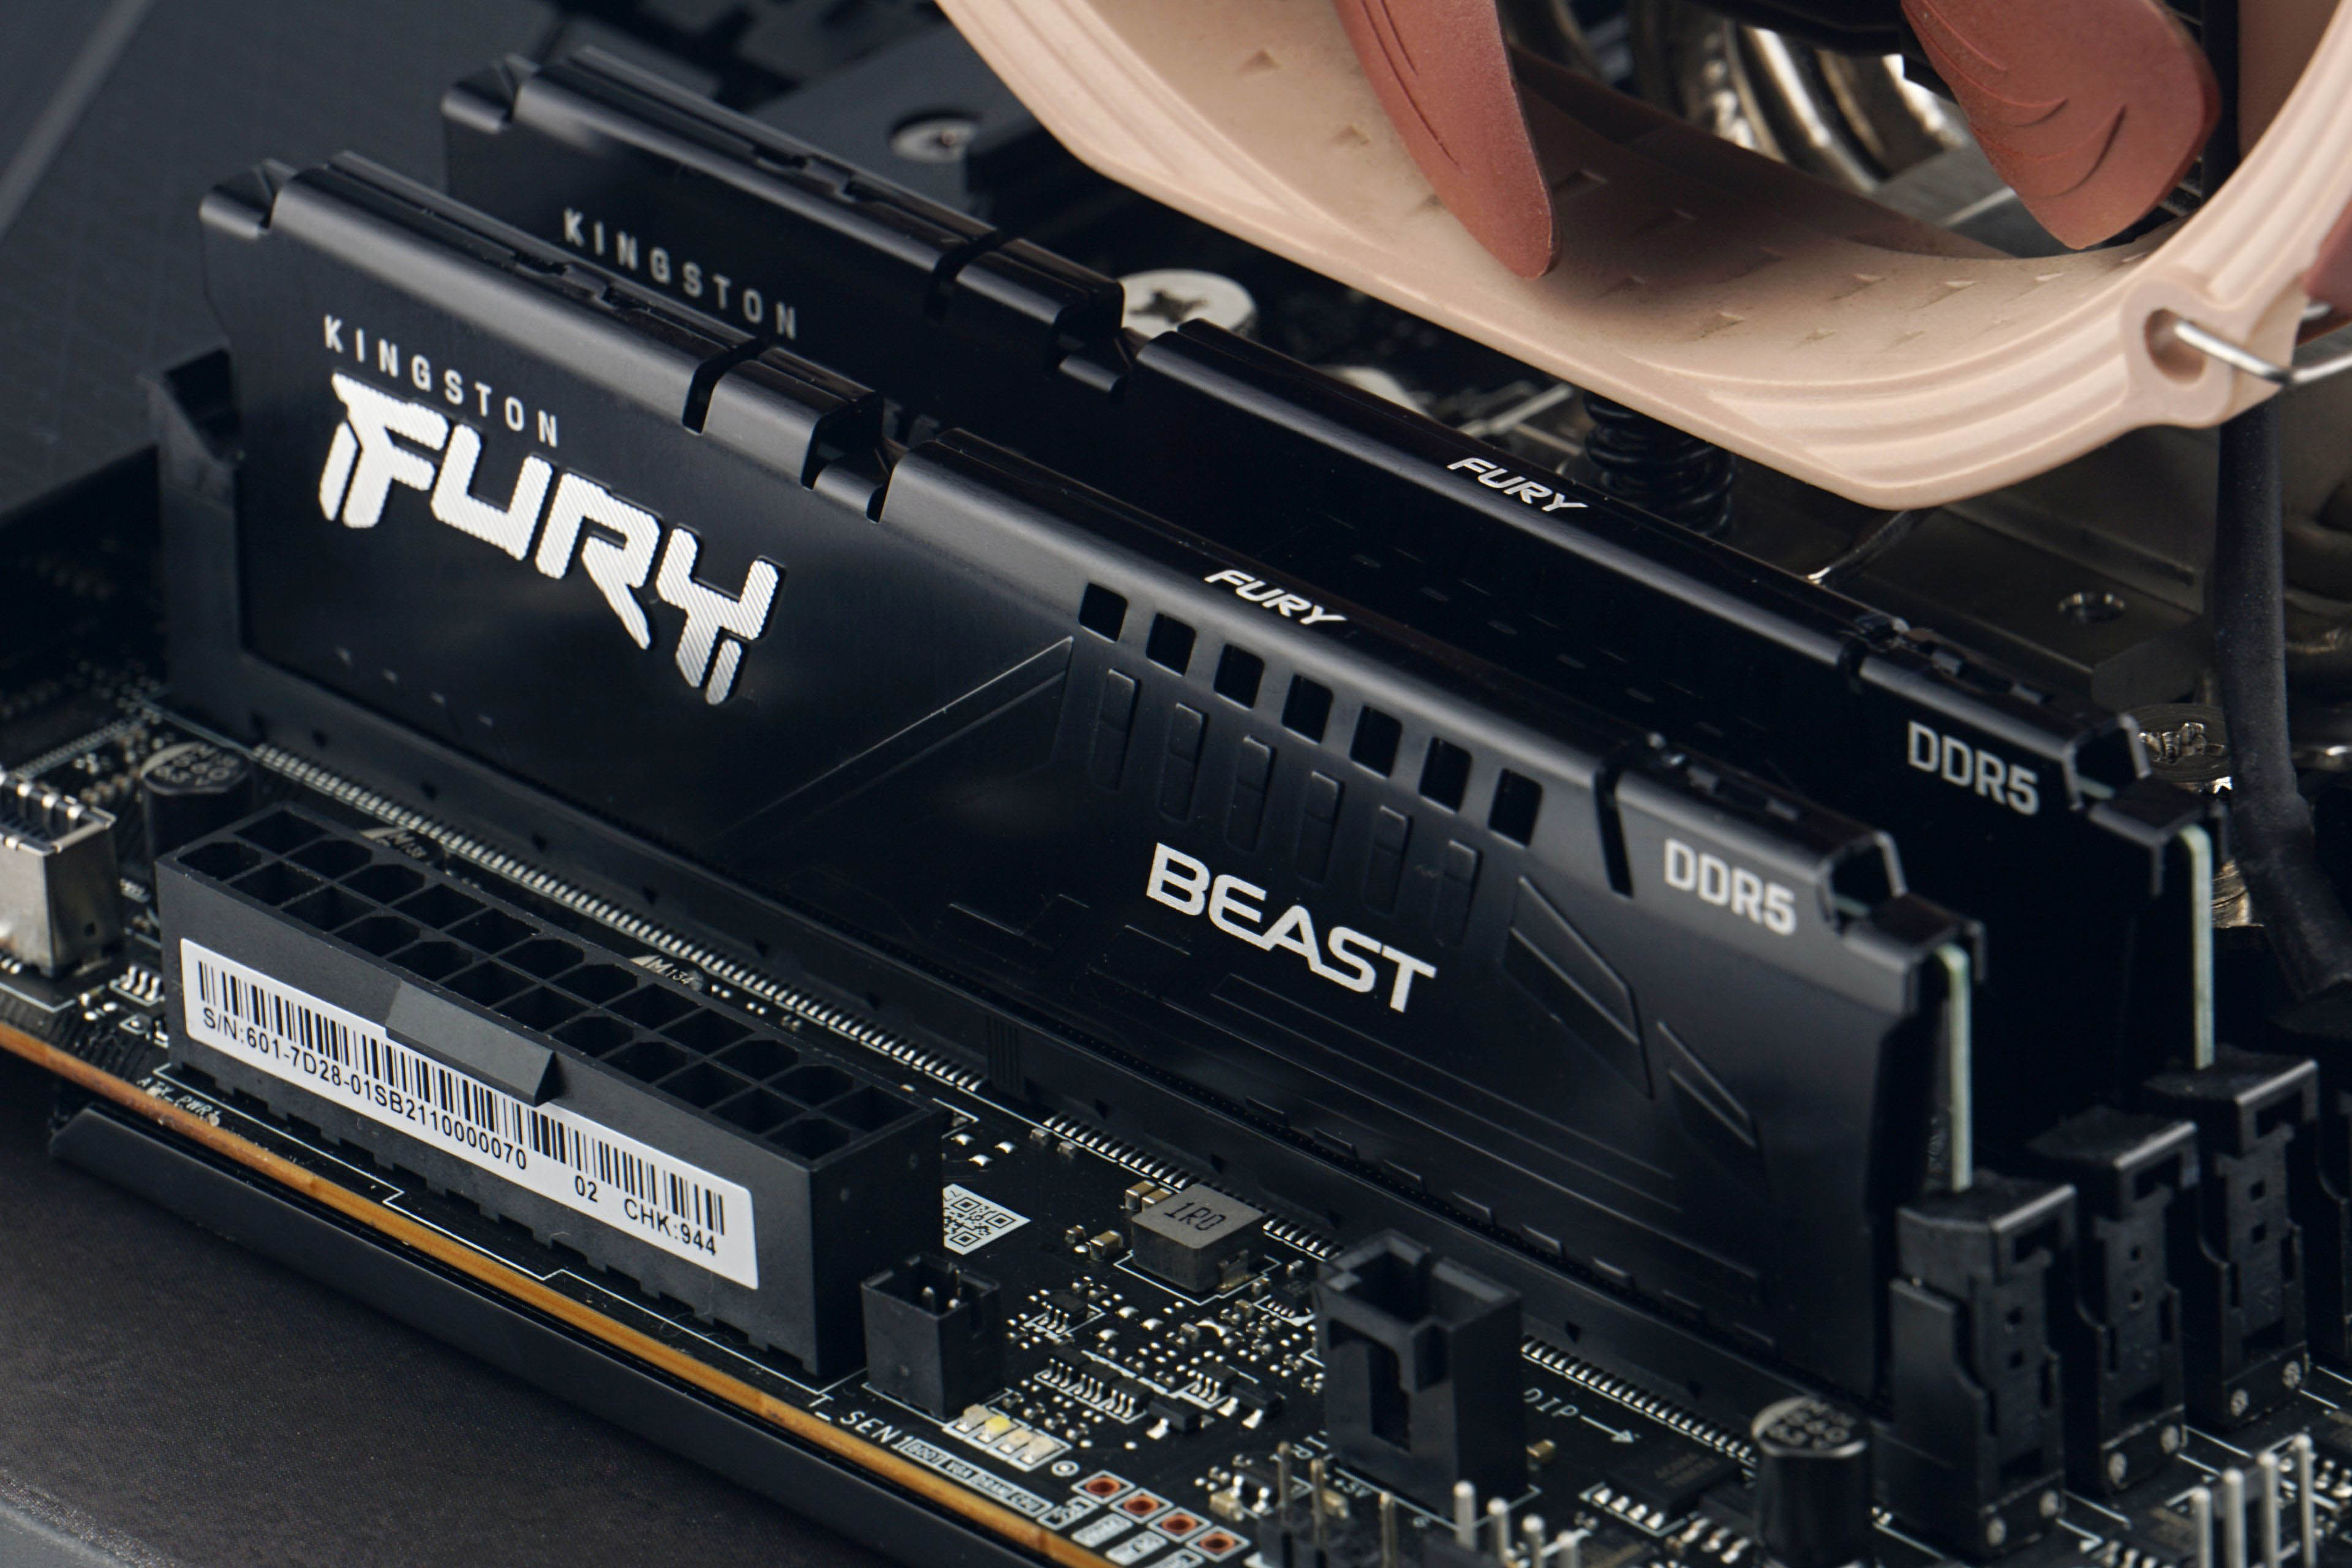
| Memory (RAM) | Acc. to platform: z DDR5 G.Skill Trident Z5 Neo (2× 16 GB, 6000 MHz/CL30) a Kingston Fury Beast (2× 16 GB, 5200 MHz/CL40) a DDR4 Patriot Blackout, (4× 8 GB, 3600 MHz/CL18) |
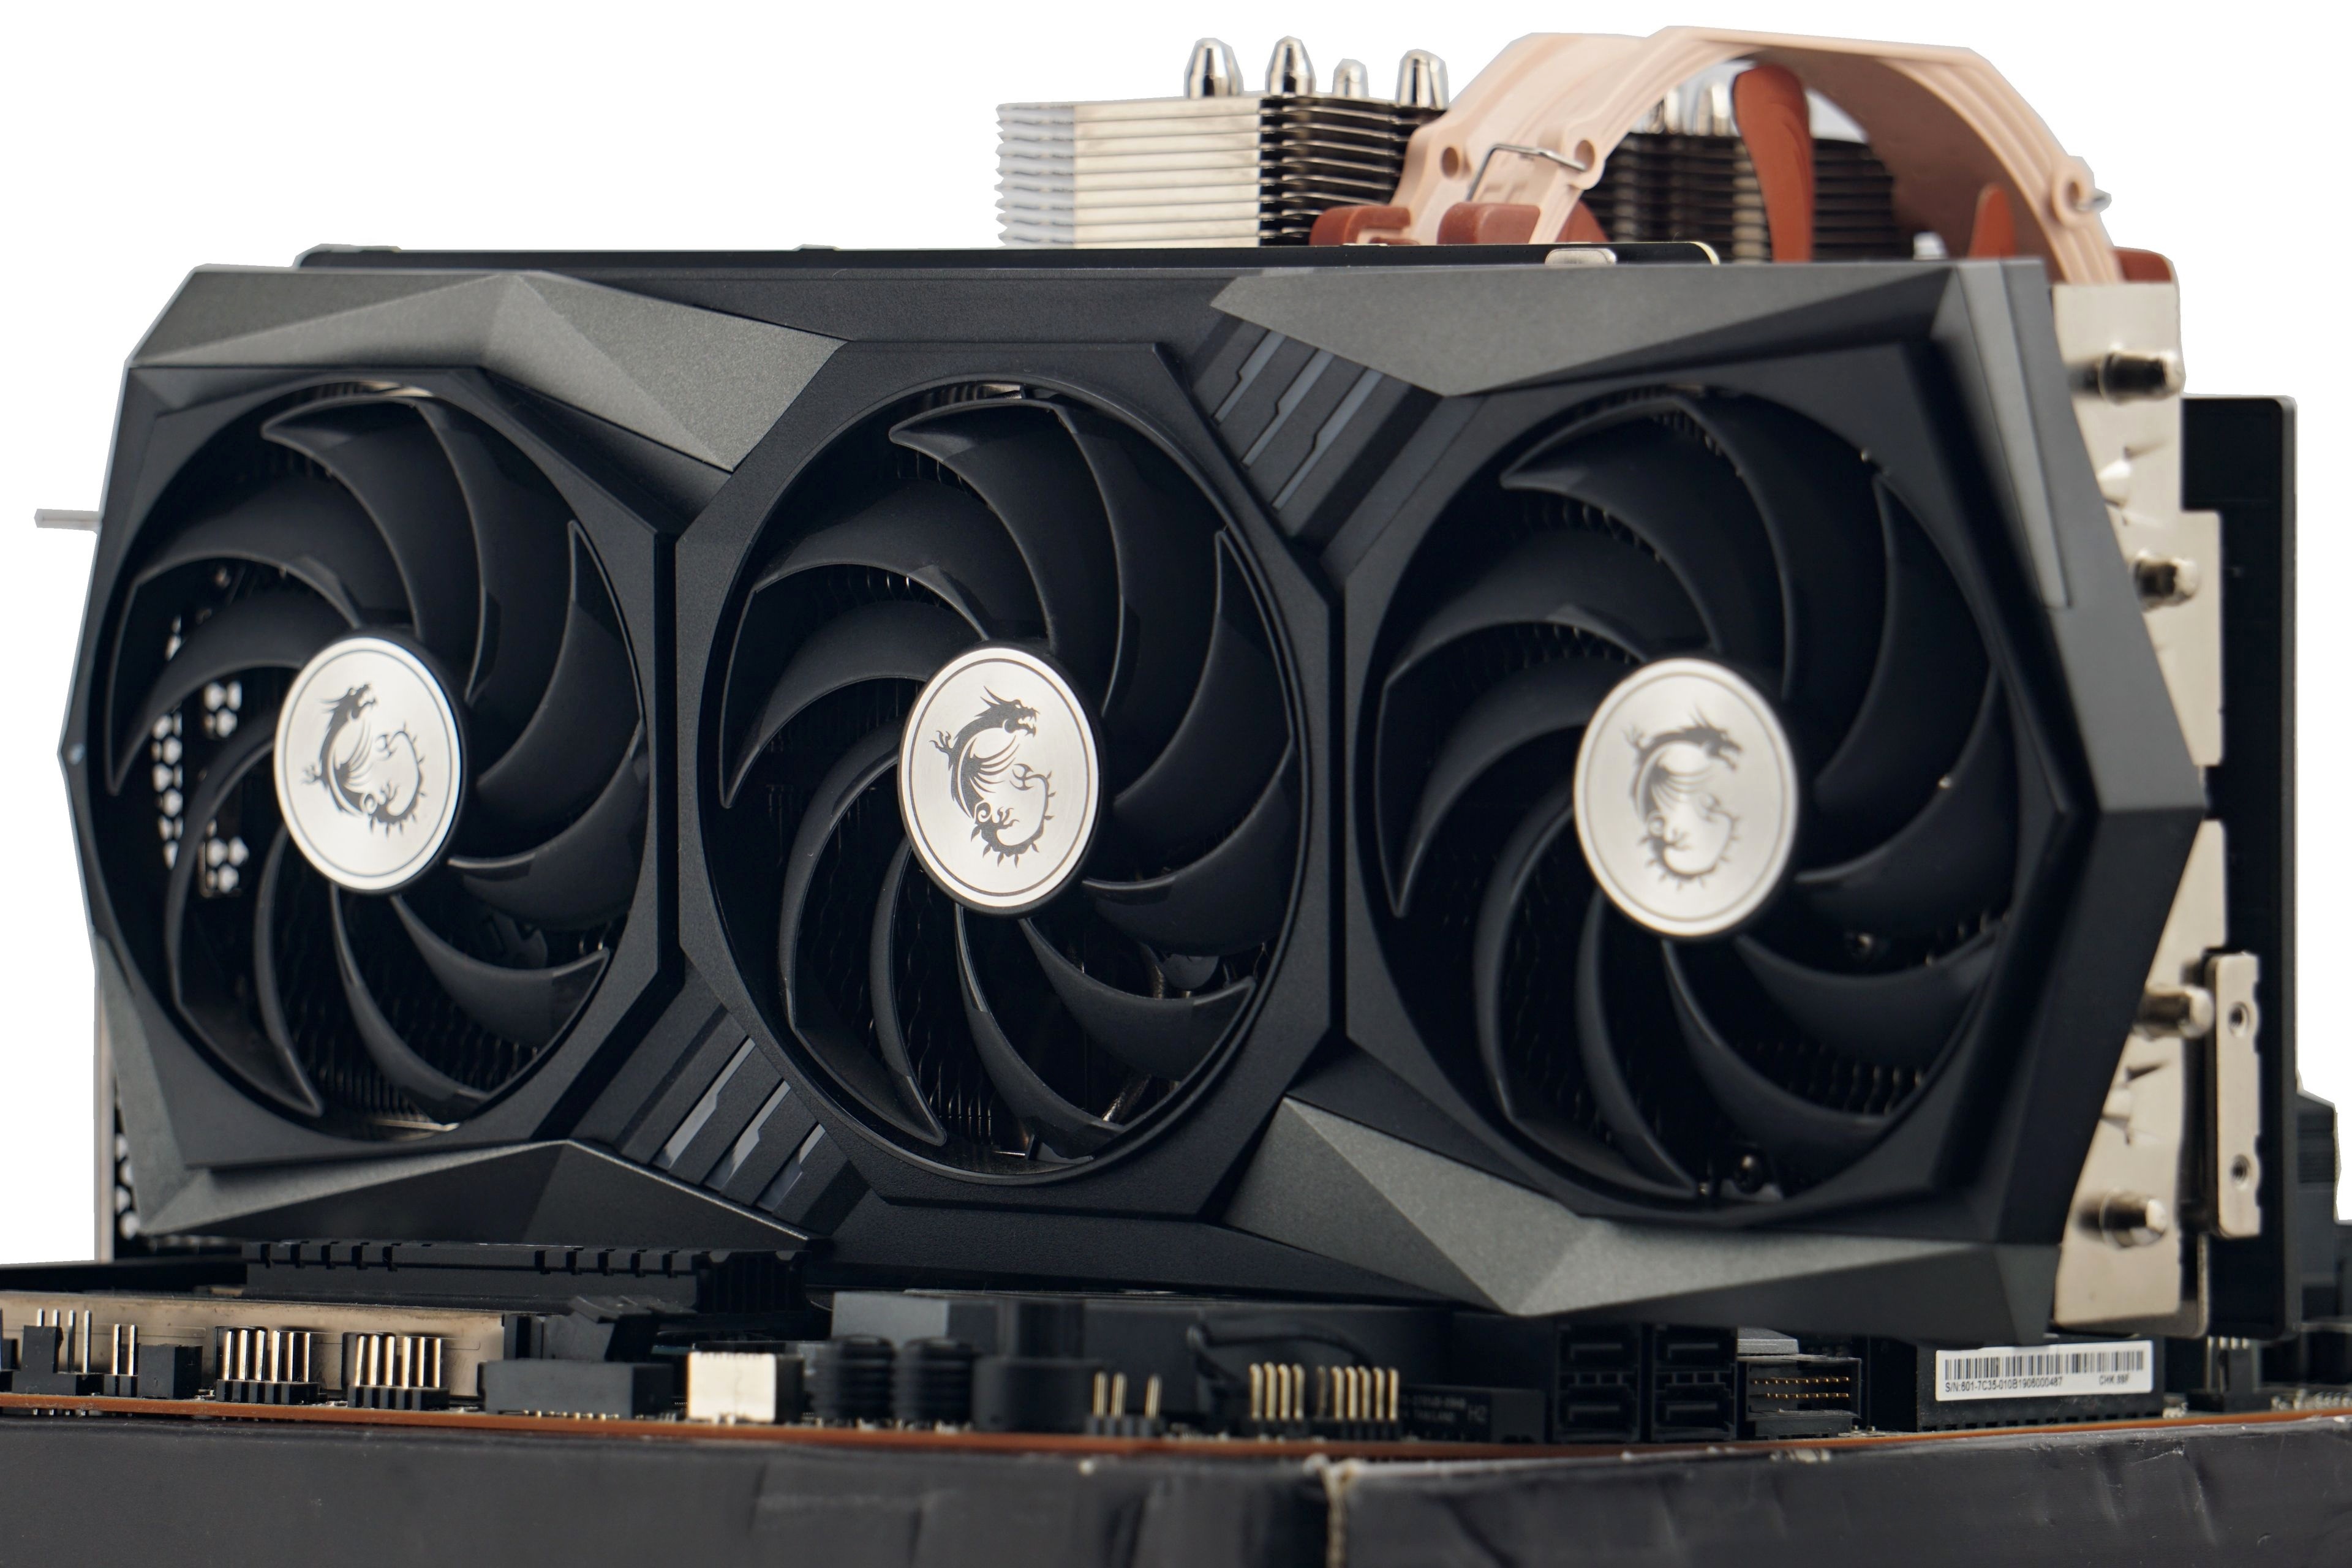
| Graphics card | MSI RTX 3080 Gaming X Trio w/o Resizable BAR |
| SSD | 2× Patriot Viper VPN100 (512 GB + 2 TB) |
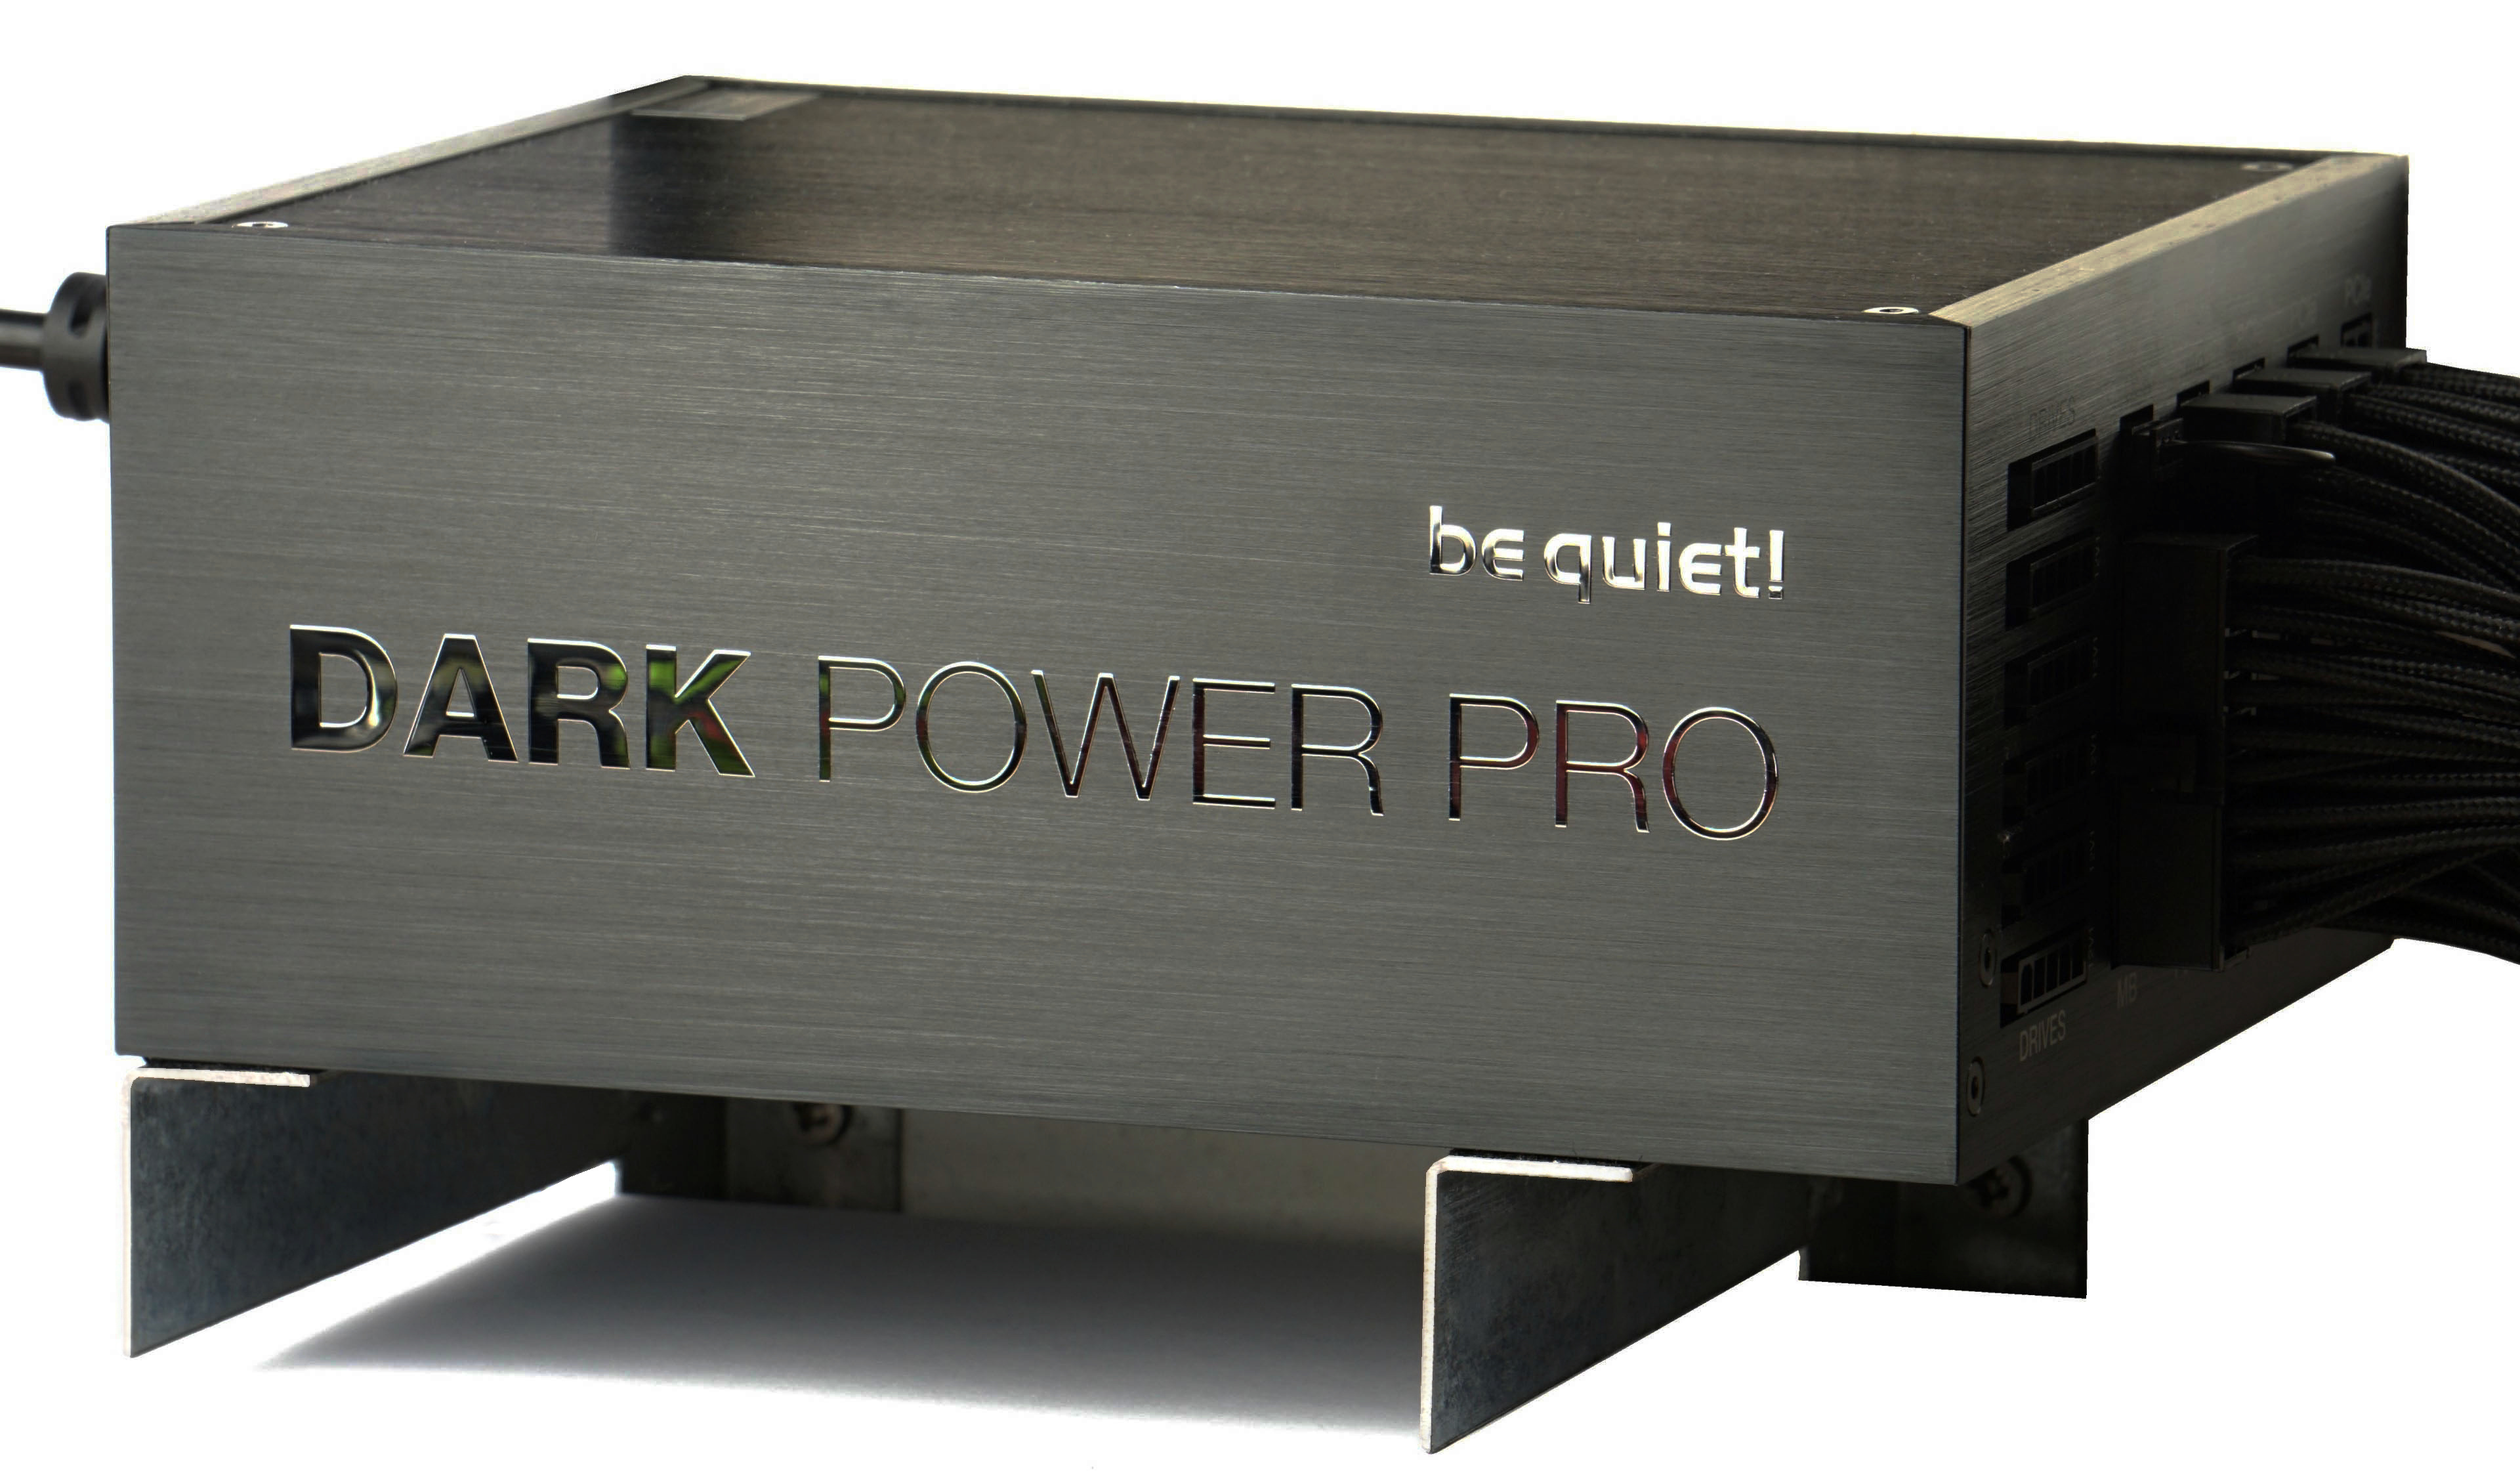
| PSU | BeQuiet! Dark Power Pro 12 (1200 W) |
* We use the following BIOSes on motherboards. For the Asus ROG Strix Z790-E Gaming WiFi, it’s v0502, for the MSI MEG X670E Ace, it’ v1.10NPRP, for the MEG X570 Ace, it’s v1E, for the MEG Z690 Unify, it’s v10, for the MAG Z690 Tomahawk WiFi DDR4, it’s v11, for the MEG Z590 Ace, it’s v1.14 and for the MEG Z490 Ace, it’s v17.
Note: The graphics drivers we use are Nvidia GeForce 466.77 and the Windows 10 OS build is 19045 at the time of testing.
Processors of other platforms are tested on MSI MEG Z690 Unify, MAG Z490 Tomahawk WiFi DDR4, Z590 Ace and Z490 Ace motherboards, MEG Z690 Unify (all Intel) and MEG X570 Ace, MEG X670E Ace (AMD).

On platforms supporting DDR5 memory, we use two different sets of modules. For more powerful processors with an “X” (AMD) or “K” (Intel) in the name, we use the faster G.Skill Trident Z5 Neo memory (2×16 GB, 6000 MHz/CL30). In the case of cheaper processors (without X or K at the end of the name), the slower Kingston Fury Beast modules (2×16 GB, 5200 MHz/CL40). But this is more or less just symbolic, the bandwidth is very high for both kits, it is not a bottleneck, and the difference in processor performance is very small, practically negligible, across the differently fast memory kits.
- Contents
- Intel Core i5-14400F (C0 vs. B0)
- Methodology: performance tests
- Methodology: how we measure power draw
- Methodology: temperature and clock speed tests
- Test setup
- 3DMark
- Assassin’s Creed: Valhalla
- Borderlands 3
- Counter-Strike: GO
- Cyberpunk 2077
- DOOM Eternal
- F1 2020
- Metro Exodus
- Microsoft Flight Simulator
- Shadow of the Tomb Raider
- Total War Saga: Troy
- Overall gaming performance
- Gaming performance per euro
- PCMark and Geekbench
- Web performance
- 3D rendering: Cinebench, Blender, ...
- Video 1/2: Adobe Premiere Pro
- Video 2/2: DaVinci Resolve Studio
- Graphics effects: Adobe After Effects
- Video encoding
- Audio encoding
- Broadcasting (OBS and Xsplit)
- Photos 1/2: Adobe Photoshop and Lightroom
- Photos 2/2: Affinity Photo, Topaz Labs AI Apps, ZPS X, ...
- (De)compression
- (De)encryption
- Numerical computing
- Simulations
- Memory and cache tests
- Processor power draw curve
- Average processor power draw
- Performance per watt
- Achieved CPU clock speed
- CPU temperature
- Conclusion


What is the explanation of the occasional erratic results? For instance, the first results for 3D mark: 14400F performs 6x better there than 14900k (and everything else)! I noticed similar weird results for multiple other tests as well. For example, in several graphics tests (gpu-based?), 12100 was the fastest one.
There may be several reasons. For a deeper analysis it is necessary to have an overview of the activity of all cores and the consumption for specific tests. We have this only for selected tests, for all tests it is impossible with such a large subset (of tests). We do not even do some tests for Intel processors with little and big cores and we do not include them in the graphs, because we know that the processor is not fully loaded and for example only little cores are used (there are boxes with a warning about this in all the result chapters that are concerned). In such cases we would, of course, measure significantly higher speed with the Ci3-12100F (with four P cores) than Ci5-14400F (with four E cores). In some subtests, the behavior with poor utilization of the P cores definitely occurs, and for example this can explain the things you are asking about. But of course there may be more explanations, and it is not possible to deal with every single situation in such a range of tests, and we can only speculate on the results in this way. 🙂
PS: Some, typically very short tests, are also affected by the speed with which a given processor can react to a change in CPU core(s) clock speeds (e.g. in a single-threaded load).