


Photos 2/2: Affinity Photo, Topaz Labs AI Apps, ZPS X, ...
For completeness of Intel Core i5-14400F processor tests we add the results of its second stepping. We’ve already tested the B0 variant, now it’s time for the C0. Its availability in stores is, at least at the moment, considerably worse and the question arises whether it is worth it at all. Is there any point in aiming for stepping C0 or is B0 also “okay”? Or does it “not matter” (what you get in the shopping lottery)?
Affinity Photo (benchmark)
Test environment: built-in benchmark.
Topaz Labs AI apps
Topaz DeNoise AI, Gigapixel AI and Sharpen AI. These single-purpose applications are used for restoration of low-quality photos. Whether it is high noise (caused by higher ISO), raster level (typically after cropping) or when something needs extra focus. The AI performance is always used.
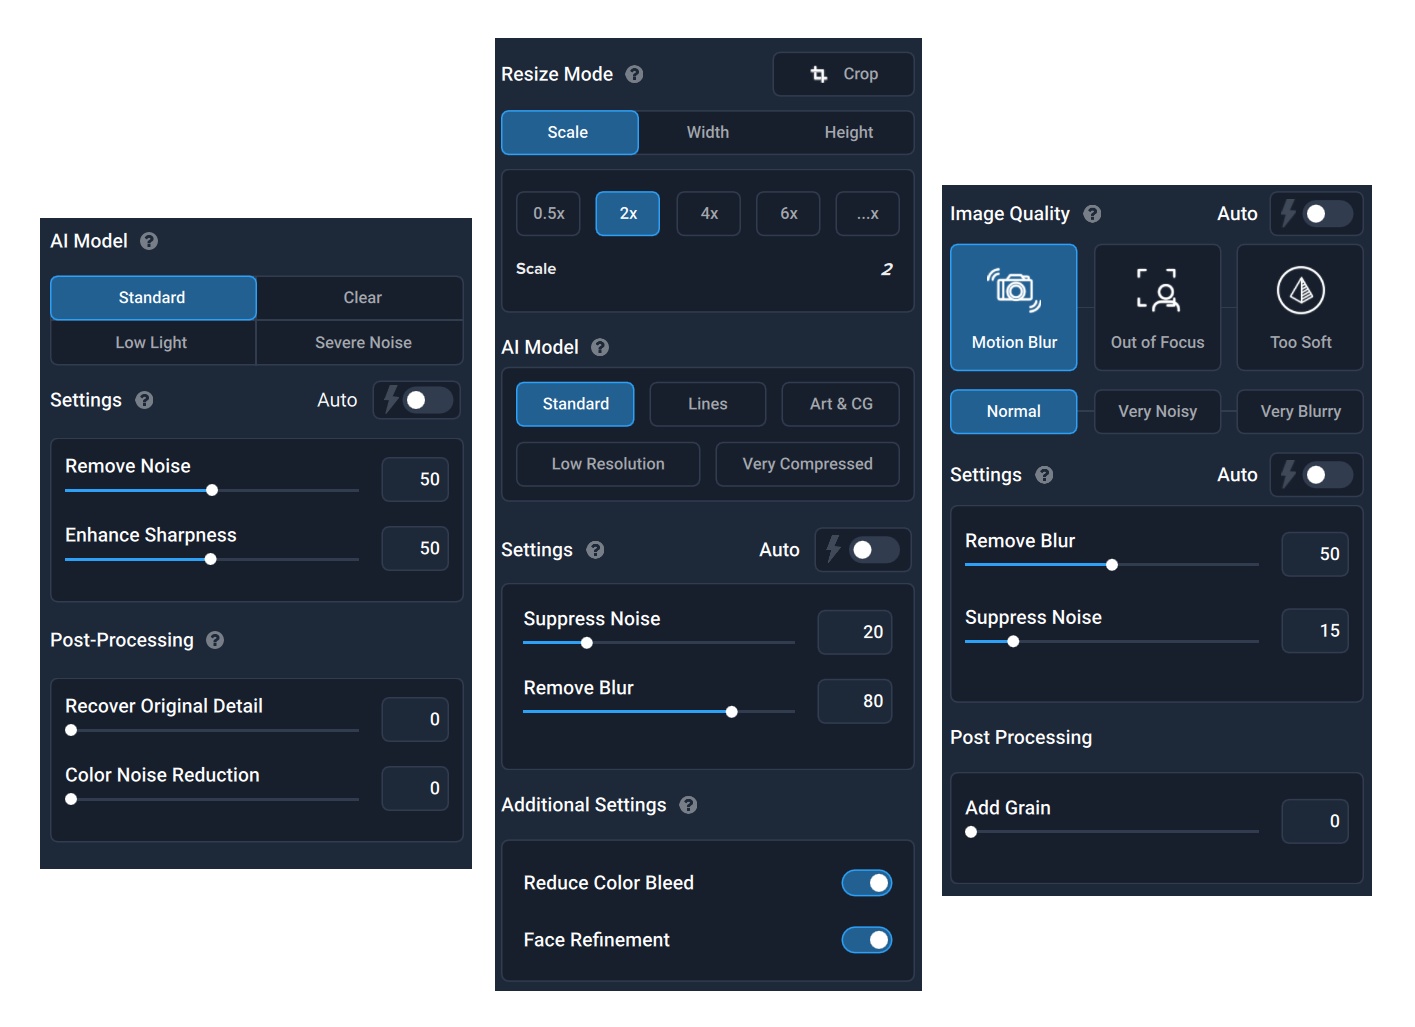
Test environment: As part of batch editing, 42 photos with a lower resolution of 1920 × 1280 px are processed, with the settings from the images above. DeNoise AI is in version 3.1.2, Gigapixel in 5.5.2 and Sharpen AI in 3.1.2.

XnViewMP

Test environment: XnViewMP is finally a photo-editor for which you don’t have to pay. At the same time, it uses hardware very efficiently. In order to achieve more reasonable comparison times, we had to create an archive of up to 1024 photos, where we reduce the original resolution of 5472 × 3648 px to 1980 × 1280 px and filters with automatic contrast enhancement and noise reduction are also being applied during this process. We use 64-bit portable version 0.98.4.
Zoner Photo Studio X
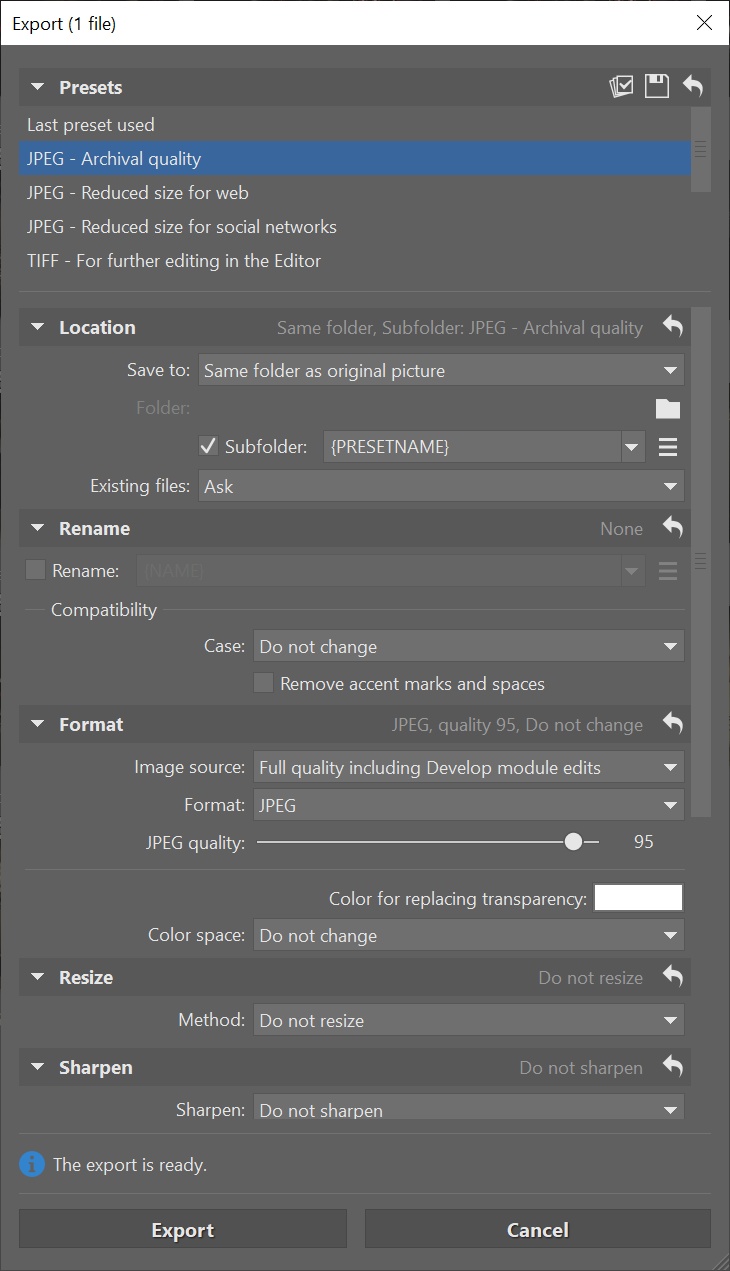
Test environment: In Zoner Photo Studio X we convert 42 .CR2 (RAW Canon) photos to JPEG while keeping the original resolution (5472 × 3648 px) at the lowest possible compression, with the ZPS X profile ”high quality for archival”.
- Contents
- Intel Core i5-14400F (C0 vs. B0)
- Methodology: performance tests
- Methodology: how we measure power draw
- Methodology: temperature and clock speed tests
- Test setup
- 3DMark
- Assassin’s Creed: Valhalla
- Borderlands 3
- Counter-Strike: GO
- Cyberpunk 2077
- DOOM Eternal
- F1 2020
- Metro Exodus
- Microsoft Flight Simulator
- Shadow of the Tomb Raider
- Total War Saga: Troy
- Overall gaming performance
- Gaming performance per euro
- PCMark and Geekbench
- Web performance
- 3D rendering: Cinebench, Blender, ...
- Video 1/2: Adobe Premiere Pro
- Video 2/2: DaVinci Resolve Studio
- Graphics effects: Adobe After Effects
- Video encoding
- Audio encoding
- Broadcasting (OBS and Xsplit)
- Photos 1/2: Adobe Photoshop and Lightroom
- Photos 2/2: Affinity Photo, Topaz Labs AI Apps, ZPS X, ...
- (De)compression
- (De)encryption
- Numerical computing
- Simulations
- Memory and cache tests
- Processor power draw curve
- Average processor power draw
- Performance per watt
- Achieved CPU clock speed
- CPU temperature
- Conclusion


What is the explanation of the occasional erratic results? For instance, the first results for 3D mark: 14400F performs 6x better there than 14900k (and everything else)! I noticed similar weird results for multiple other tests as well. For example, in several graphics tests (gpu-based?), 12100 was the fastest one.
There may be several reasons. For a deeper analysis it is necessary to have an overview of the activity of all cores and the consumption for specific tests. We have this only for selected tests, for all tests it is impossible with such a large subset (of tests). We do not even do some tests for Intel processors with little and big cores and we do not include them in the graphs, because we know that the processor is not fully loaded and for example only little cores are used (there are boxes with a warning about this in all the result chapters that are concerned). In such cases we would, of course, measure significantly higher speed with the Ci3-12100F (with four P cores) than Ci5-14400F (with four E cores). In some subtests, the behavior with poor utilization of the P cores definitely occurs, and for example this can explain the things you are asking about. But of course there may be more explanations, and it is not possible to deal with every single situation in such a range of tests, and we can only speculate on the results in this way. 🙂
PS: Some, typically very short tests, are also affected by the speed with which a given processor can react to a change in CPU core(s) clock speeds (e.g. in a single-threaded load).