


Methodology: how we measure power draw
AMD’s first processor with 3D V-cache is a rather controversial piece of hardware. Sure, it may be the ultimate in gaming performance, but the desired effect is more “on paper” than practical, and when it does come, it’s in very rare cases. So that you don’t end up disappointed with a virtually single-purpose processor that may not even excel at gaming, we’ve broken it all down in detailed tests.
Methodology: how we measure power draw
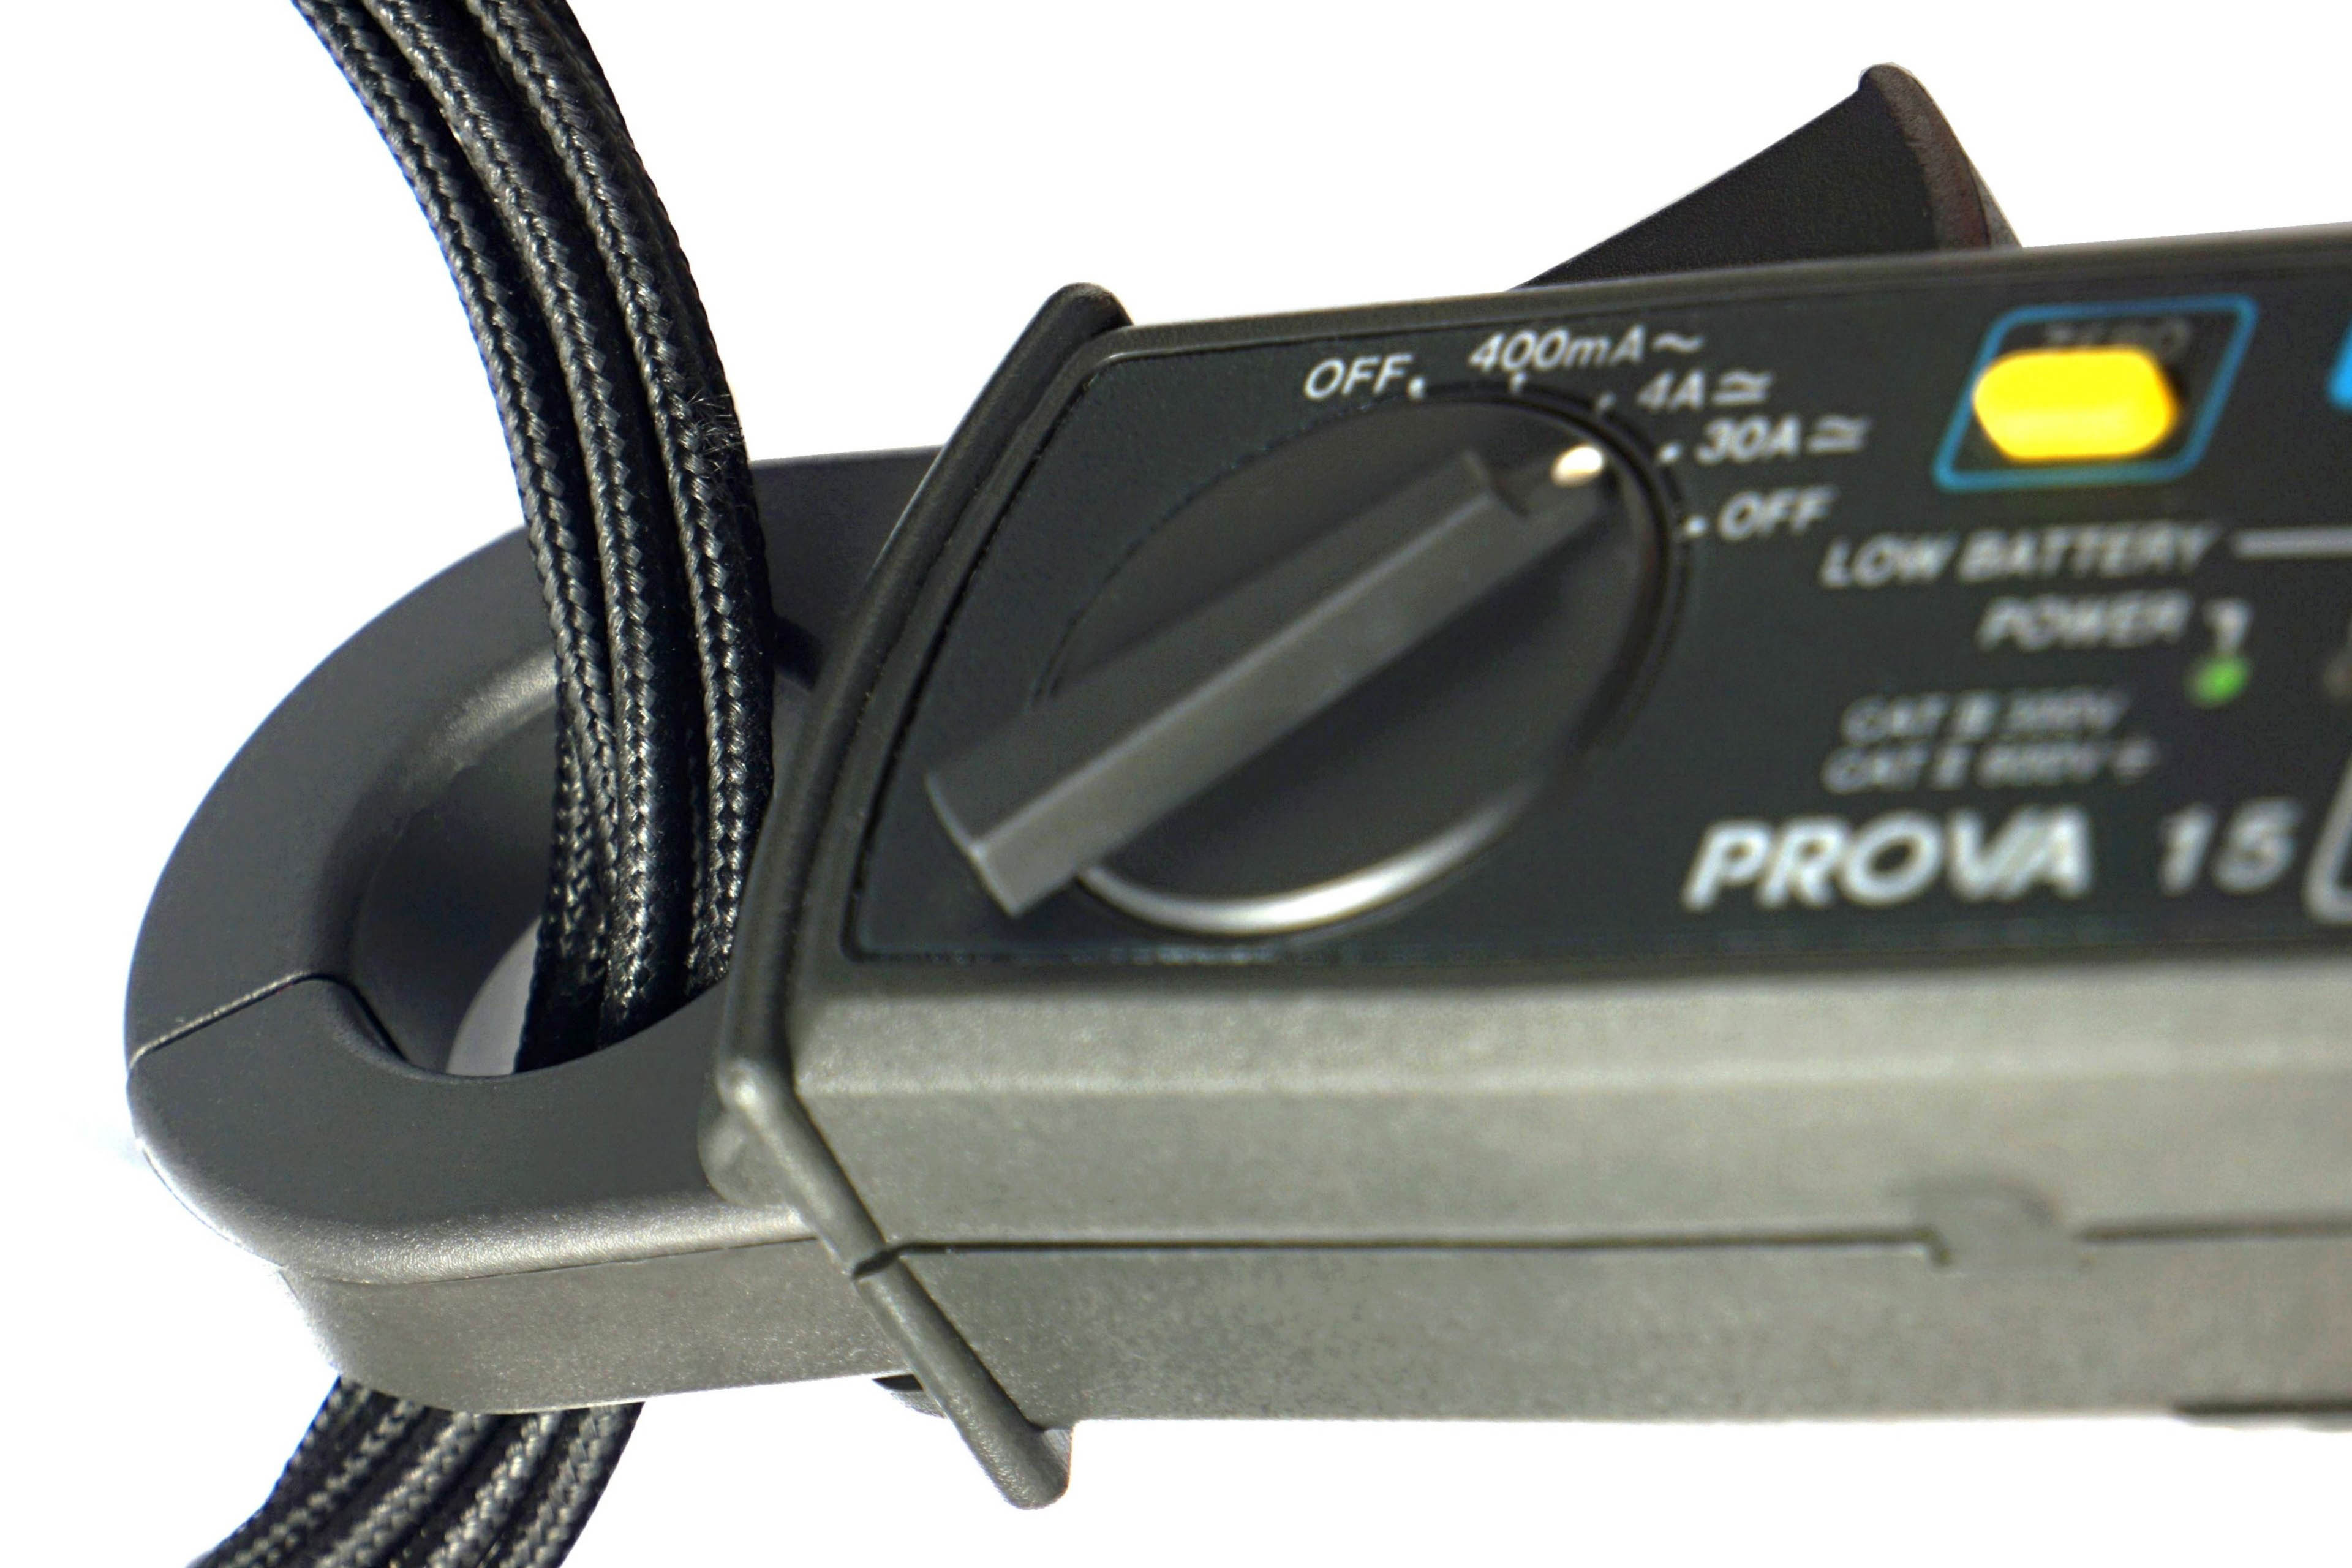
Measuring CPU power consumption is relatively simple, much easier than with graphics cards. All power goes through one or two EPS cables. We also use two to increase the cross-section, which is suitable for high performance AMD processors up to sTR(X)4 or for Intel HEDT, and in fact almost for mainstream processors as well. We have Prova 15 current probes to measure current directly on the wires. This is a much more accurate and reliable way of measuring than relying on internal sensors.
The only limitation of our current probes may be when testing the most powerful processors. These already exceed the maximum range of 30 A, at which high accuracy is guaranteed. For most processors, the range is optimal (even for measuring a lower load, when the probes can be switched to a lower and more accurate range of 4 A), but we will test models with power consumption over 360 W on our own device, a prototype of which we have already built. Its measuring range will no longer be limiting, but for the time being we will be using the Prova probes in the near future.
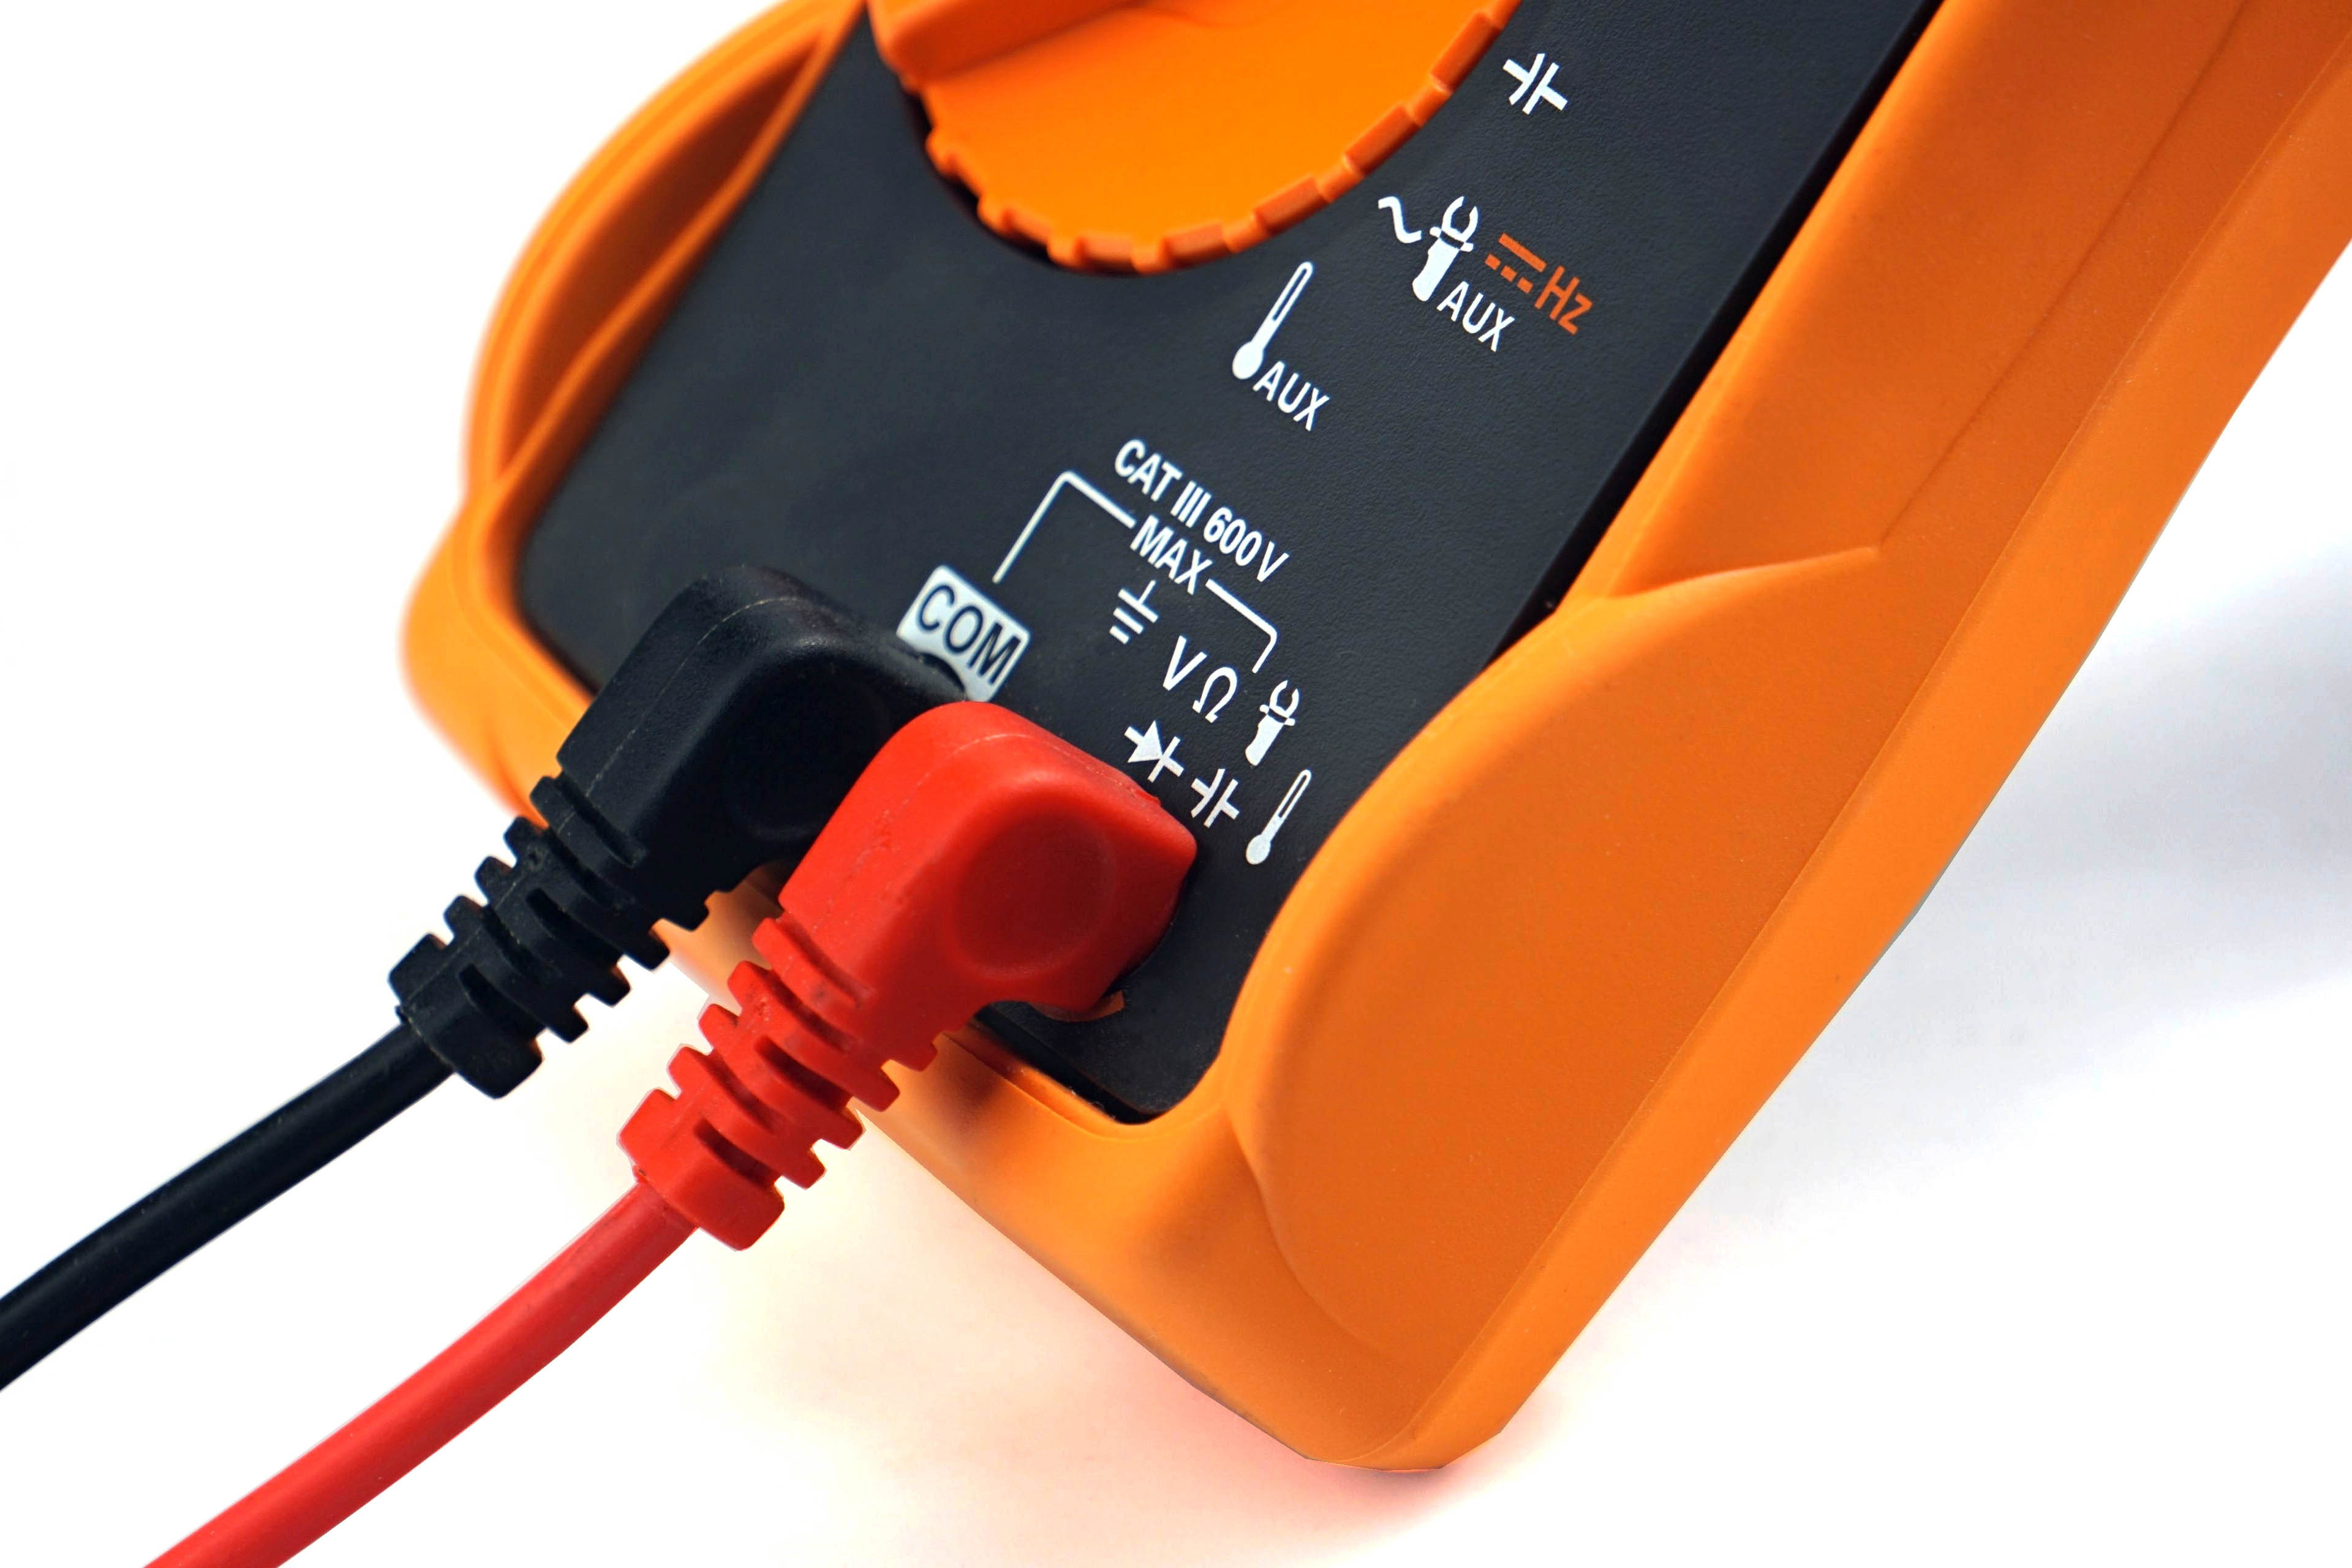
The probes are properly set to zero and connected to a UNI-T UT71E multimeter before each measurement. It records samples of current values during the tests via the IR-USB interface and writes them in a table at one-second intervals. We can then create bar graphs with power consumption patterns. But we always write average values in bar graphs. Measurements take place in various load modes. The lowest represents an idle Windows 10 desktop. This measurement takes place on a system that had been idle for quite some time.

Audio encoding (FLAC) represents a higher load, but processors use only one core or one thread for this. Higher loads, where more cores are involved, are games. We test power consumption in F1 2020, Shadow of the Tomb Raider and Total War Saga: Troy in 1920 × 1080 px. In this resolution, the power consumption is usually the highest or at least similar to that in lower or higher resolutions, where in most cases the CPU power draw rather decreases due to its lower utilization.
Like most motherboard manufacturers, we too ignore the time limit for “Tau”, after which the power consumption is to be reduced from the PL2 boost limit (when it exceeds the TDP) to the TDP/PL1 value, recommended by Intel, in our tests. This means that neither the power draw nor the clock speed after 56 seconds of higher load does not decrease and the performance is kept stable with just small fluctuations. We had been considering whether or not to respect the Tau. In the end, we decided not to because the vast majority of users won’t either, and therefore the results and comparisons would be relatively uninteresting. The solution would be to test with and without a power limit, but this is no longer possible due to time requirements. We will pay more attention to the behavior of PL2 in motherboard tests, where it makes more sense.
We always use motherboards with extremely robust, efficient VRM, so that the losses on MOSFETs distort the measured results as little as possible and the test setups are powered by a high-end 1200 W BeQuiet! Dark Power Pro 12 power supply. It is strong enough to supply every processor, even with a fully loaded GeForce RTX 3080, and at the same time achieves above-standard efficiency even at lower load. For a complete overview of test setup components, see Chapter 5 of this article.
- Contents
- AMD Ryzen 7 5800X3D in detail
- Methodology: performance tests
- Methodology: how we measure power draw
- Methodology: temperature and clock speed tests
- Test setup
- 3DMark
- Assassin’s Creed: Valhalla
- Borderlands 3
- Counter-Strike: GO
- Cyberpunk 2077
- DOOM Eternal
- F1 2020
- Metro Exodus
- Microsoft Flight Simulator
- Shadow of the Tomb Raider
- Total War Saga: Troy
- Overall gaming performance
- Gaming performance per euro
- PCMark and Geekbench
- Web performance
- 3D rendering: Cinebench, Blender, ...
- Video 1/2: Adobe Premiere Pro
- Video 2/2: DaVinci Resolve Studio
- Graphics effects: Adobe After Effects
- Video encoding
- Audio encoding
- Broadcasting (OBS and Xsplit)
- Photos 1/2: Adobe Photoshop and Lightroom
- Photos 2/2: Affinity Photo, Topaz Labs AI Apps, ZPS X, ...
- (De)compression
- (De)cryption
- Numerical computing
- Simulations
- Memory and cache tests
- Processor power draw curve
- Average processor power draw
- Performance per watt
- Achieved CPU clock speed
- CPU temperature
- Conclusion

You have the 5800x’s launch price as $299 when it was actually the same as the 5800x3d’s at $450. You have the 5800x as coming with a AMD Wraith Stealth cooler when it didn’t come with a cooler. These are just things that immediately stood out to me and I haven’t checked further. The article seems fairly detailed, but apparently with the wrong details and I have to ask myself why such obvious things are wrong. There’s a reason why these details are wrong that appear to me to not be because of simple mistakes. It’s almost like you’re going out of your way to make the 5800x3d look bad.
Thanks for the heads up, you are correct, we have two factual errors in the chart. But I’m sure it would be a big mistake to condemn the rest of the article because of them. I make charts at the end, often at the end of my rope. It is very difficult to edit such a voluminous article with so much information, especially considering how small the editorial team is (tests of much larger editorial offices are usually a quarter the size of ours…). So now and then a mistake can happen. The Wraith Stealth cooler in the R7 5800X specs is an error that was caused by cloning the chart from a non-X model, after which the cooler was left there due to an oversight.
And yes, the launch price of the R7 5800X, of course, is not 299 USD, but 449 USD. So yes, this information was also incorrect in the original chart, but know that the goal was definitely not to put R7 5800X3D at a disadvantage. Again, I’ll explain how this came about. In all tests we use the same template and in the R7 5800X test we have something like “Launch price:
449299 USD” in the chart, which hopefully makes it clear that the crossed out price is the launch price and the second amount is the price after discounting. Here the amount dropped out and it looks really strange, but at the same time at the time of writing the article 299 USD corresponded to the suggested price (the one after discounting) by AMD. In order to make everything right, we’re putting back the original wording “449299 USD” with a note (below the chart) that explains that this is the price after discounting, which we’re reflecting. It would be impractical to work with the same launch price of the R7 5800X and the R7 5800X3D in the test case, as the market situation is different.So hopefully it makes a little more sense to you and you will reconsider that this could perhaps be deliberate manipulation. Everything has been corrected and thank you again for your observation and for reading carefully.