
Microsoft Flight Simulator
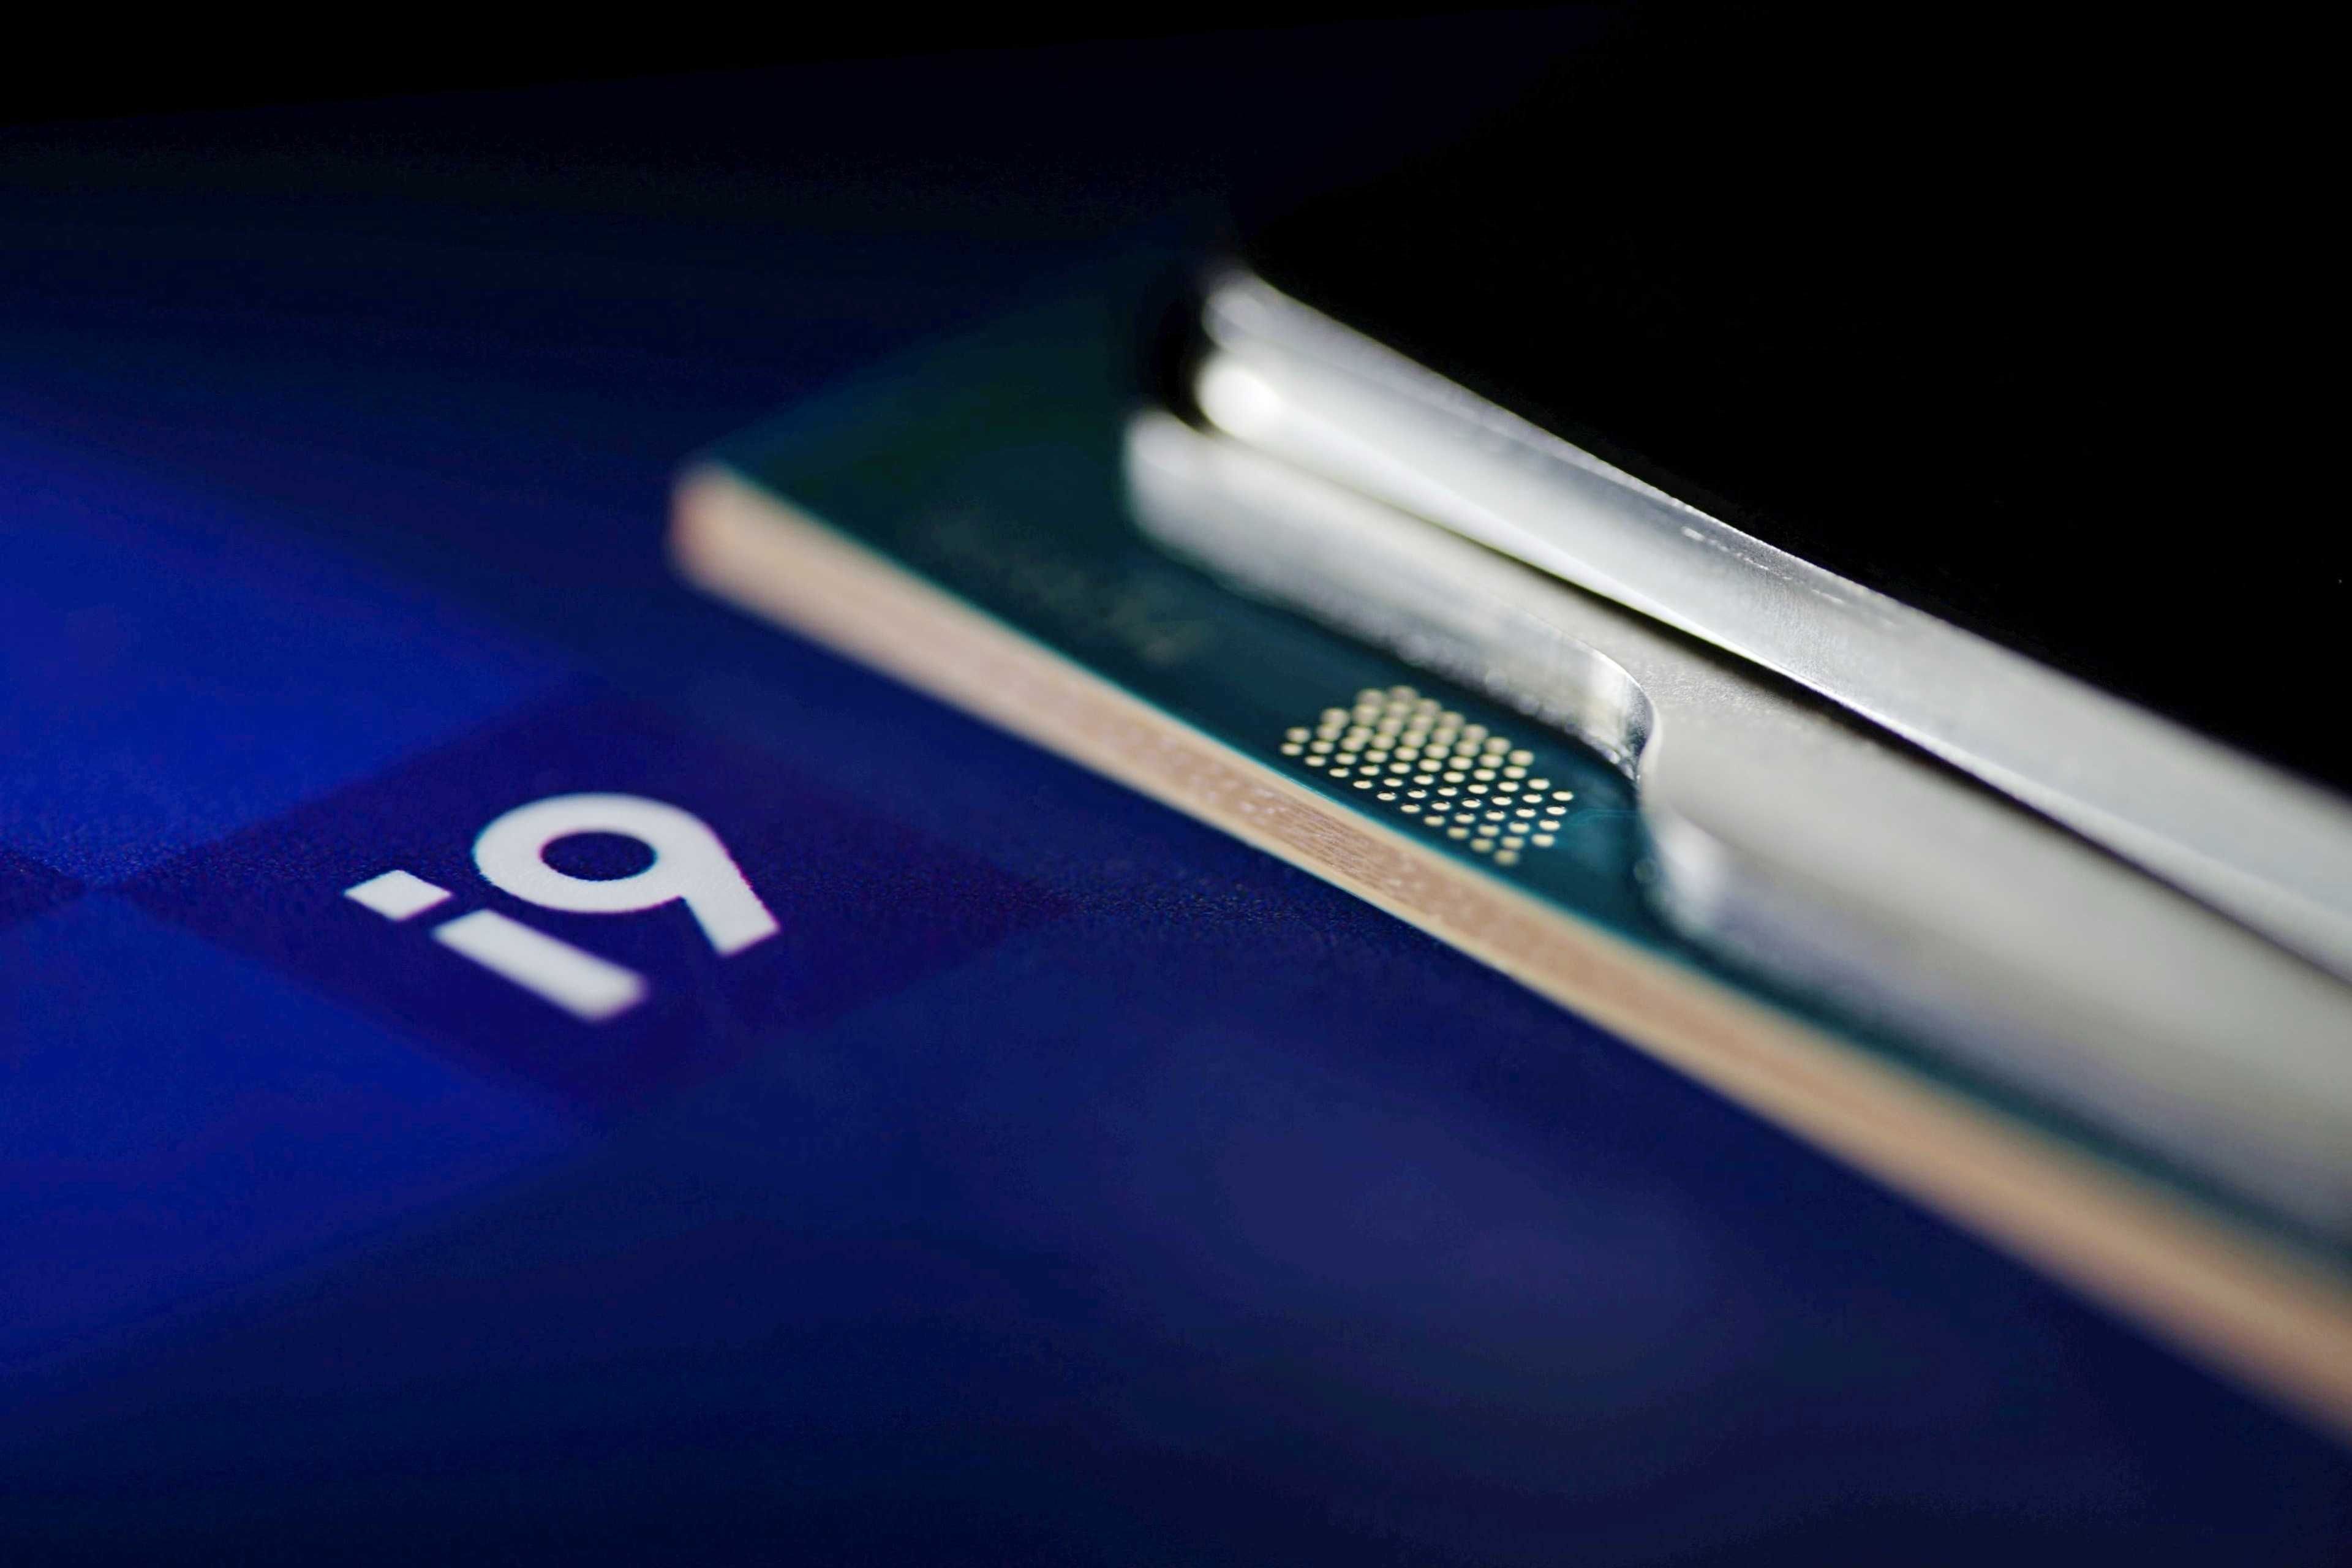
The top model of the 14th generation of Intel Core (Raptor Lake Refresh-S) processors has outperformed everything that has come out for desktop computers so far. In speed, but also in power draw. On the one hand, the 6 GHz metric for single-threaded applications has been reached and the clock speeds are very high even under all-core boost, the side effect is that the Core i9-14900K’s power draw can sometimes spike up to 400 W.
Microsoft Flight Simulator
Disclaimer: The performance of this game changes and improves frequently due to continuous updates. We verify the consistency of the results by re-testing the Ryzen 9 5900X processor before each measurement. In case of significant deviations, we discard the older results and start building the database from scratch. Due to the incompleteness of the MFS results, we do not use MFS to calculate the average gaming performance of the processors.
Test environment: resolution 1280 × 720 px; graphics settings preset Low; API DirectX 11; extra settings Anti-Aliasing: off; test scene: custom (Paris-Charles de Gaulle, Air Traffic: AI, February 14, 9:00) autopilot: from 1000 m until hitting the terrain.
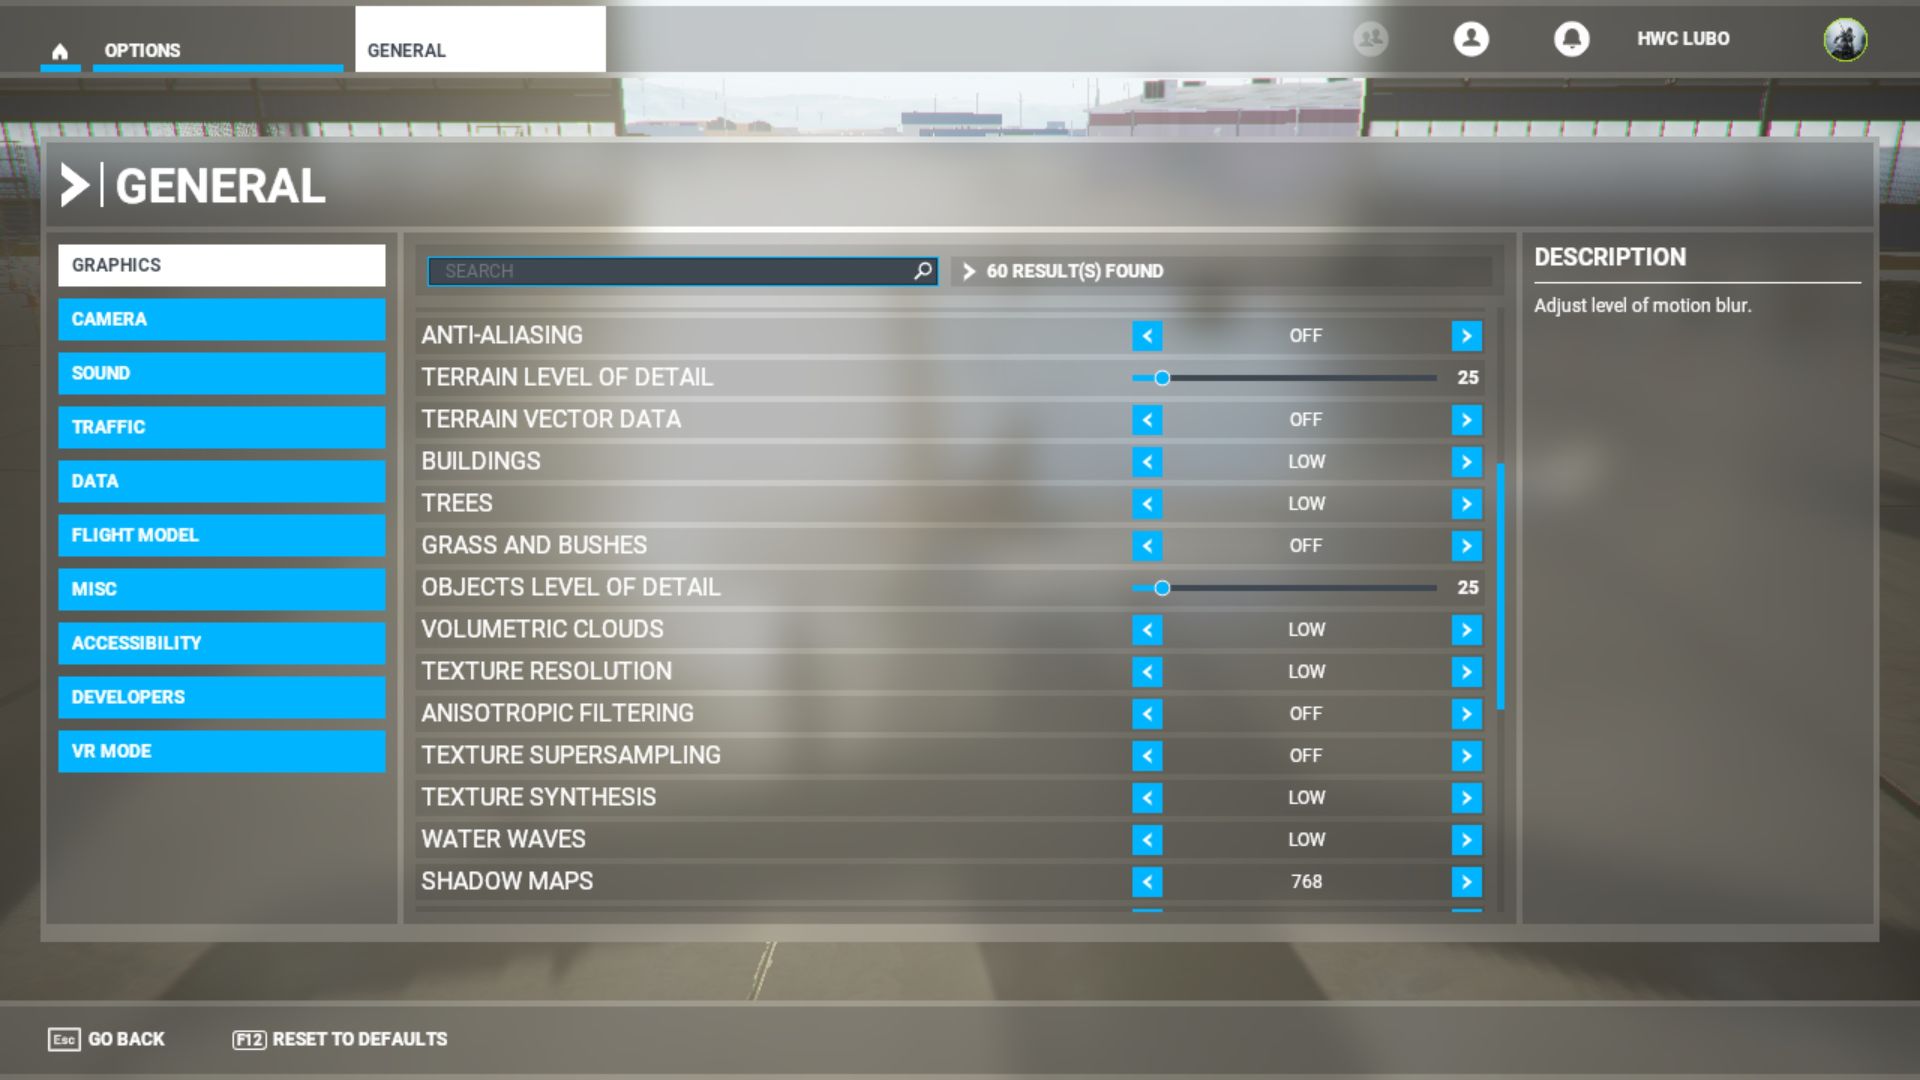

Test environment: resolution 1920 × 1080 px; graphics settings preset Low; API DirectX 11; extra settings Anti-Aliasing: off; test scene: custom (Paris-Charles de Gaulle, Air Traffic: AI, February 14, 9:00) autopilot: from 1000 m until hitting the terrain.
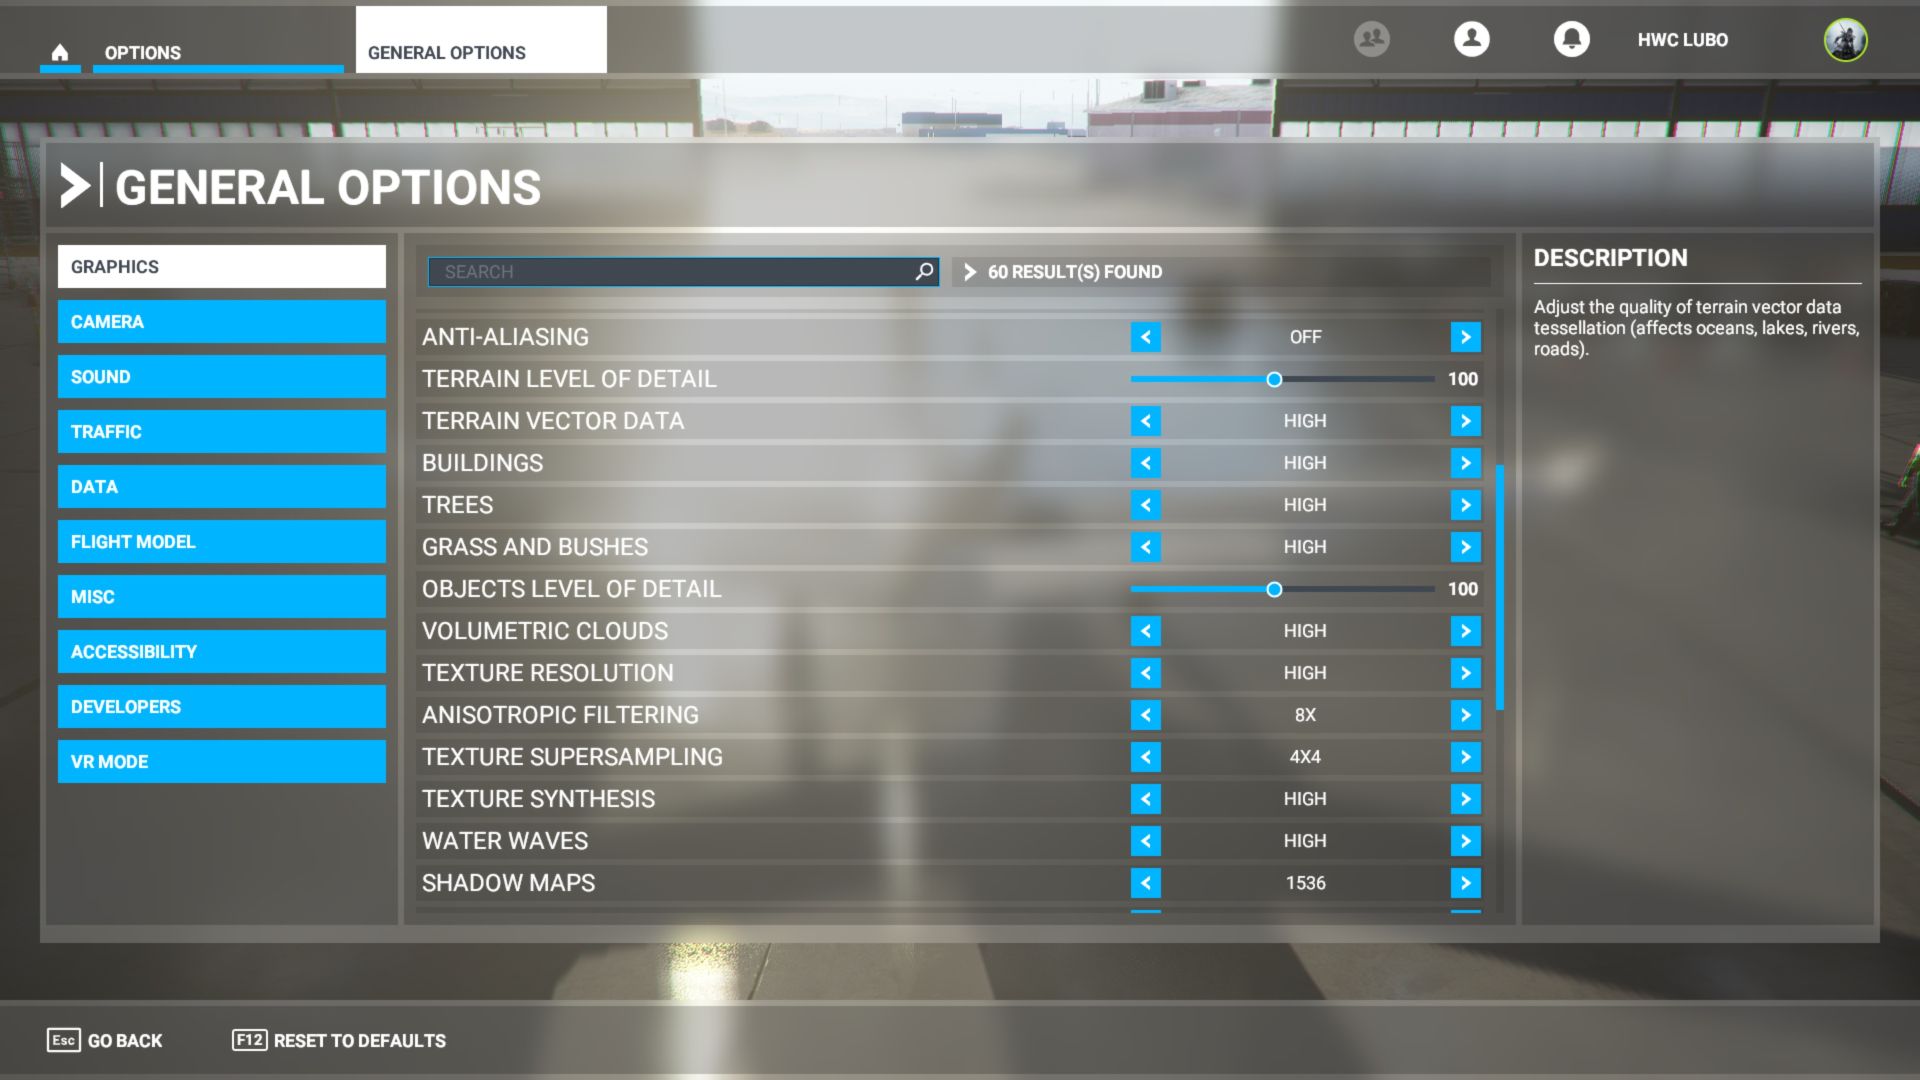
Test environment: resolution 2560 × 1440 px; graphics settings preset High; API DirectX 11; extra settings Anti-Aliasing: TAA; test scene: custom (Paris-Charles de Gaulle, Air Traffic: AI, February 14, 9:00) autopilot: from 1000 m until hitting the terrain.
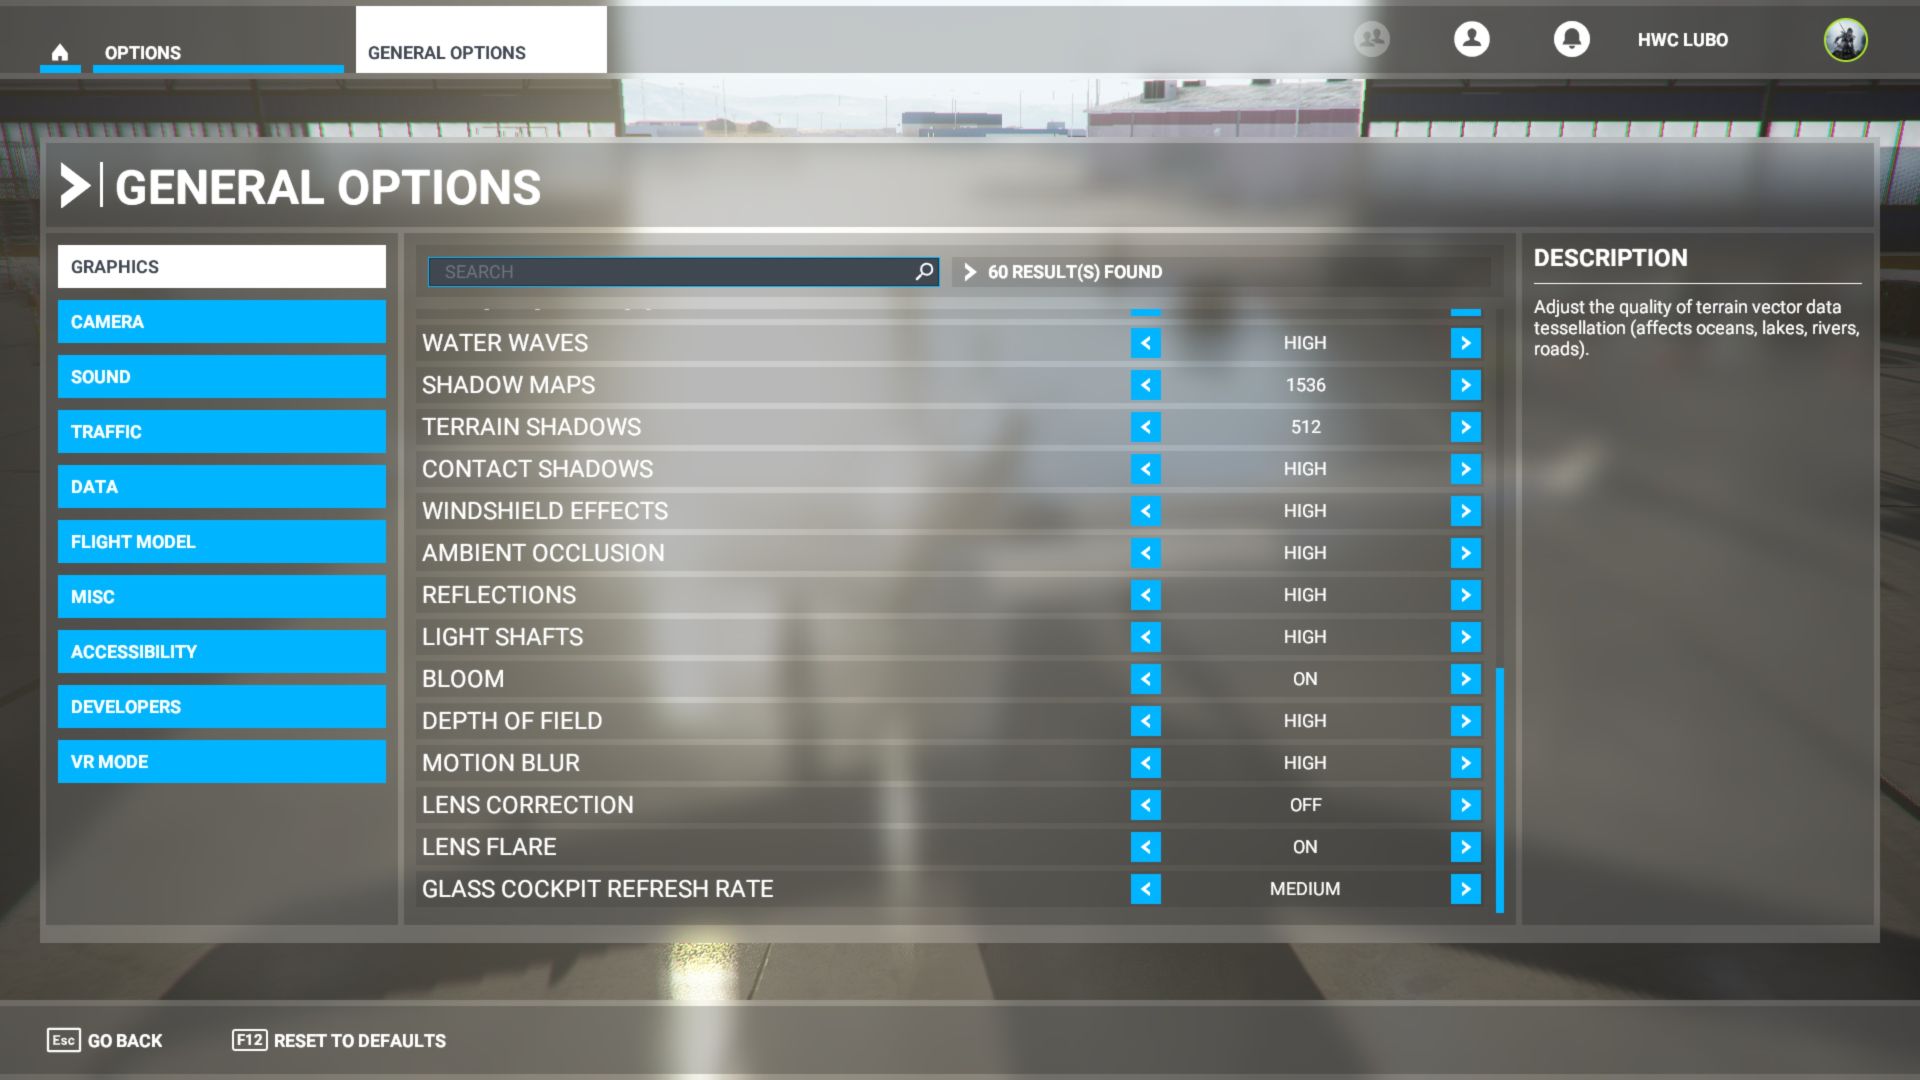
Test environment: resolution 3840 × 2160 px; graphics settings preset Ultra; API DirectX 11; extra settings Anti-Aliasing: TAA; test scene: custom (Paris-Charles de Gaulle, Air Traffic: AI, February 14, 9:00) autopilot: from 1000 m until hitting the terrain.

- Contents
- Intel Core i9-14900K in detail
- Methodology: performance tests
- Methodology: how we measure power draw
- Methodology: temperature and clock speed tests
- Test setup
- 3DMark
- Assassin’s Creed: Valhalla
- Borderlands 3
- Counter-Strike: GO
- Cyberpunk 2077
- DOOM Eternal
- F1 2020
- Metro Exodus
- Microsoft Flight Simulator
- Shadow of the Tomb Raider
- Total War Saga: Troy
- Overall gaming performance
- Gaming performance per euro
- PCMark and Geekbench
- Web performance
- 3D rendering: Cinebench, Blender, ...
- Video 1/2: Adobe Premiere Pro
- Video 2/2: DaVinci Resolve Studio
- Graphics effects: Adobe After Effects
- Video encoding
- Audio encoding
- Broadcasting (OBS and Xsplit)
- Photos 1/2: Adobe Photoshop and Lightroom
- Photos 2/2: Affinity Photo, Topaz Labs AI Apps, ZPS X, ...
- (De)compression
- (De)encryption
- Numerical computing
- Simulations
- Memory and cache tests
- Processor power draw curve
- Average processor power draw
- Performance per watt
- Achieved CPU clock speed
- CPU temperature
- Conclusion