


The first Fluctus 120 PWM fans marked a great qualitative progress in SilentiumPC production (now Endorfy). Nevertheless, they had their flaws, which the developers are gradually eliminating and, based on the measurement results, the newer 140 mm Fluctus can be said to be a clear improvement. The Fluctus 140 PWM ARGB stands out nicely from other fans in its price category.
33 dBA or 33 dBA
The noise level, given as a single dBA value, is good for quick reference, but it doesn’t give you an idea of exactly what the sound sounds like. That’s because it averages a mix of noise levels of all frequencies of sound. One fan may disturb you more than the other, even though they both reach exactly the same dBA, yet each is characterized by different dominant (louder) frequencies. To analyze thoroughly with an idea of the “color” of the sound, it is essential to record and assess noise levels across the entire spectrum of frequencies that we perceive.

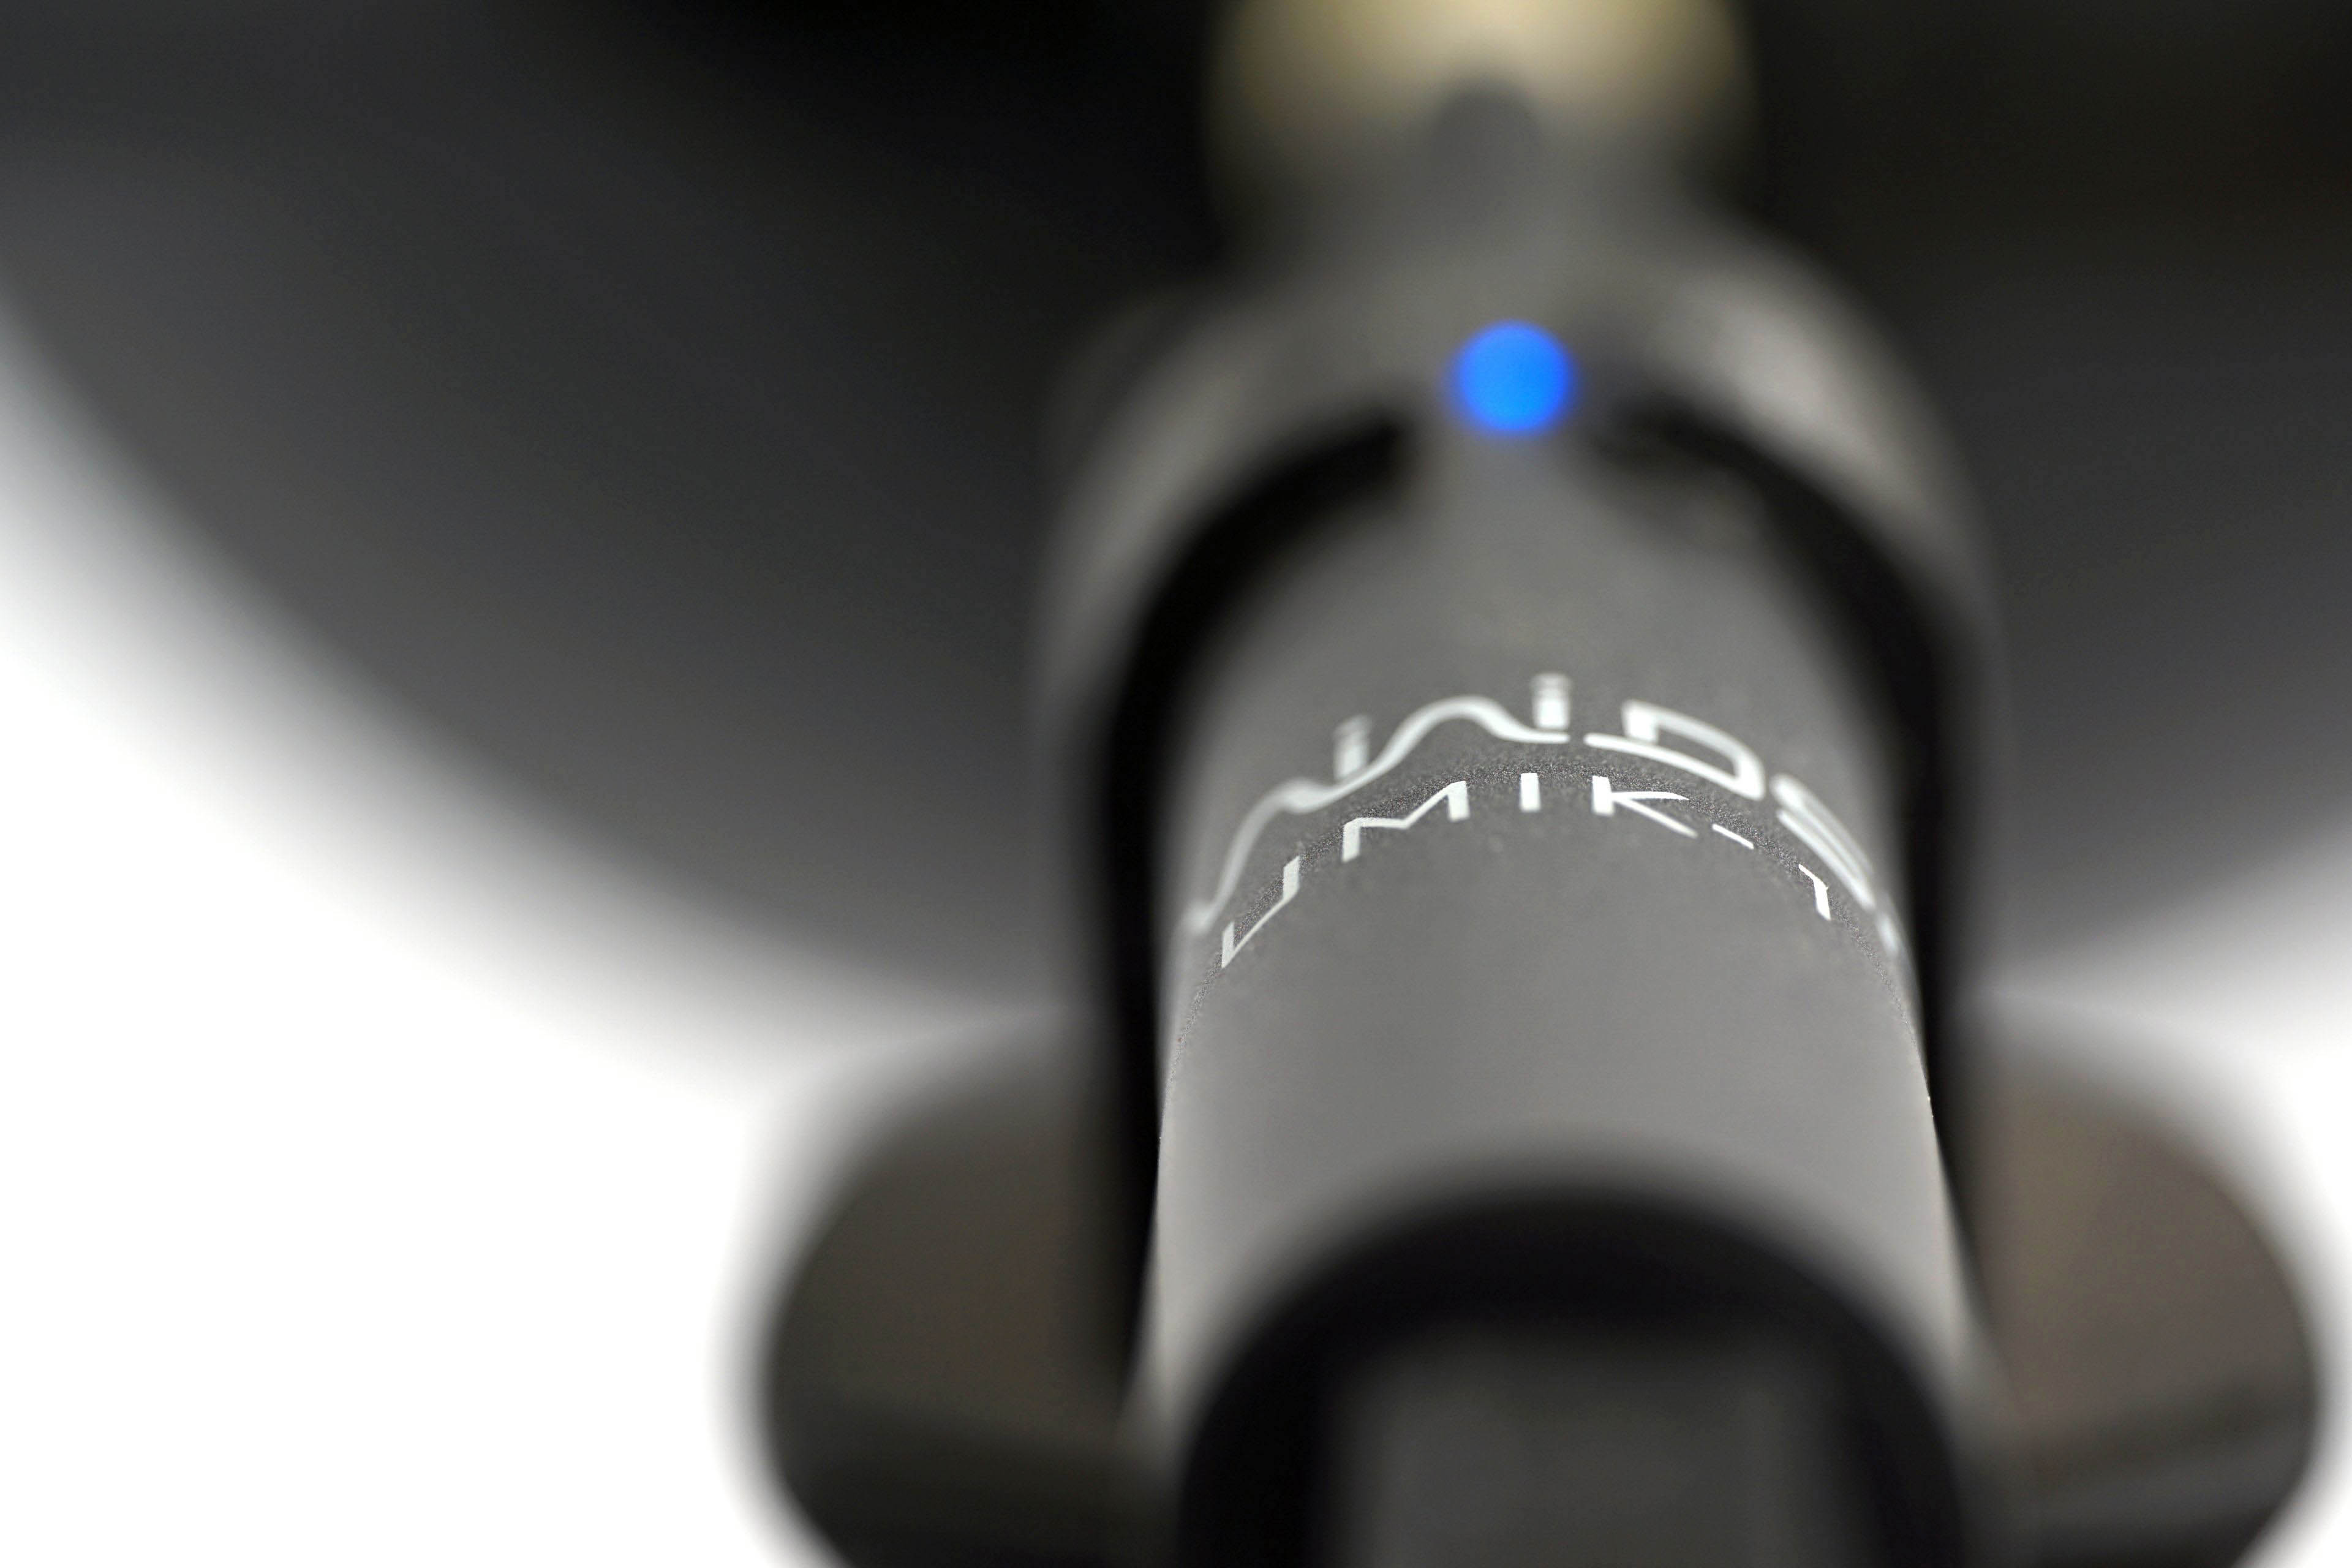
We already do this in graphics card tests, and we’ll do it for fans too, where it makes even more sense. Using the UMIK-1 miniDSP microphone and TrueRTA’s mode-specific, fixed dBA application, we also measure which frequencies contribute more and which contribute less to the sound. The monitored frequency range is 20-20,000 Hz, which we’ll work with at a fine resolution of 1/24 octave. In it, noise levels from 20 Hz to 20 000 Hz are captured at up to 240 frequencies.
The information captured in the spectrograph is a bit more than we will need for clear fan comparisons. While you’ll always find a complete spectrograph in the tests, we’ll only work with the dominant frequencies (and their noise intensities) in the low, mid, and high bands in the comparison tables and charts. The low frequency band is represented by 20–200 Hz, the medium by 201–2000 Hz and the high by 2001–20 000 Hz. From each of these three bands, we select the dominant frequency, i.e. the loudest one, which contributes most to the composition of the sound.
To the dominant frequency we also give the intensity of its noise. However, in this case it is in a different decibel scale than those you are used to from noise meter measurements. Instead of dBA, we have dBu. This is a finer scale, which is additionally expressed negatively. Be careful of this when studying the results – a noise intensity of -70 dBu is higher than -75 dBu. We discussed this in more detail in the article Get familiar with measuring the frequency response of sound.
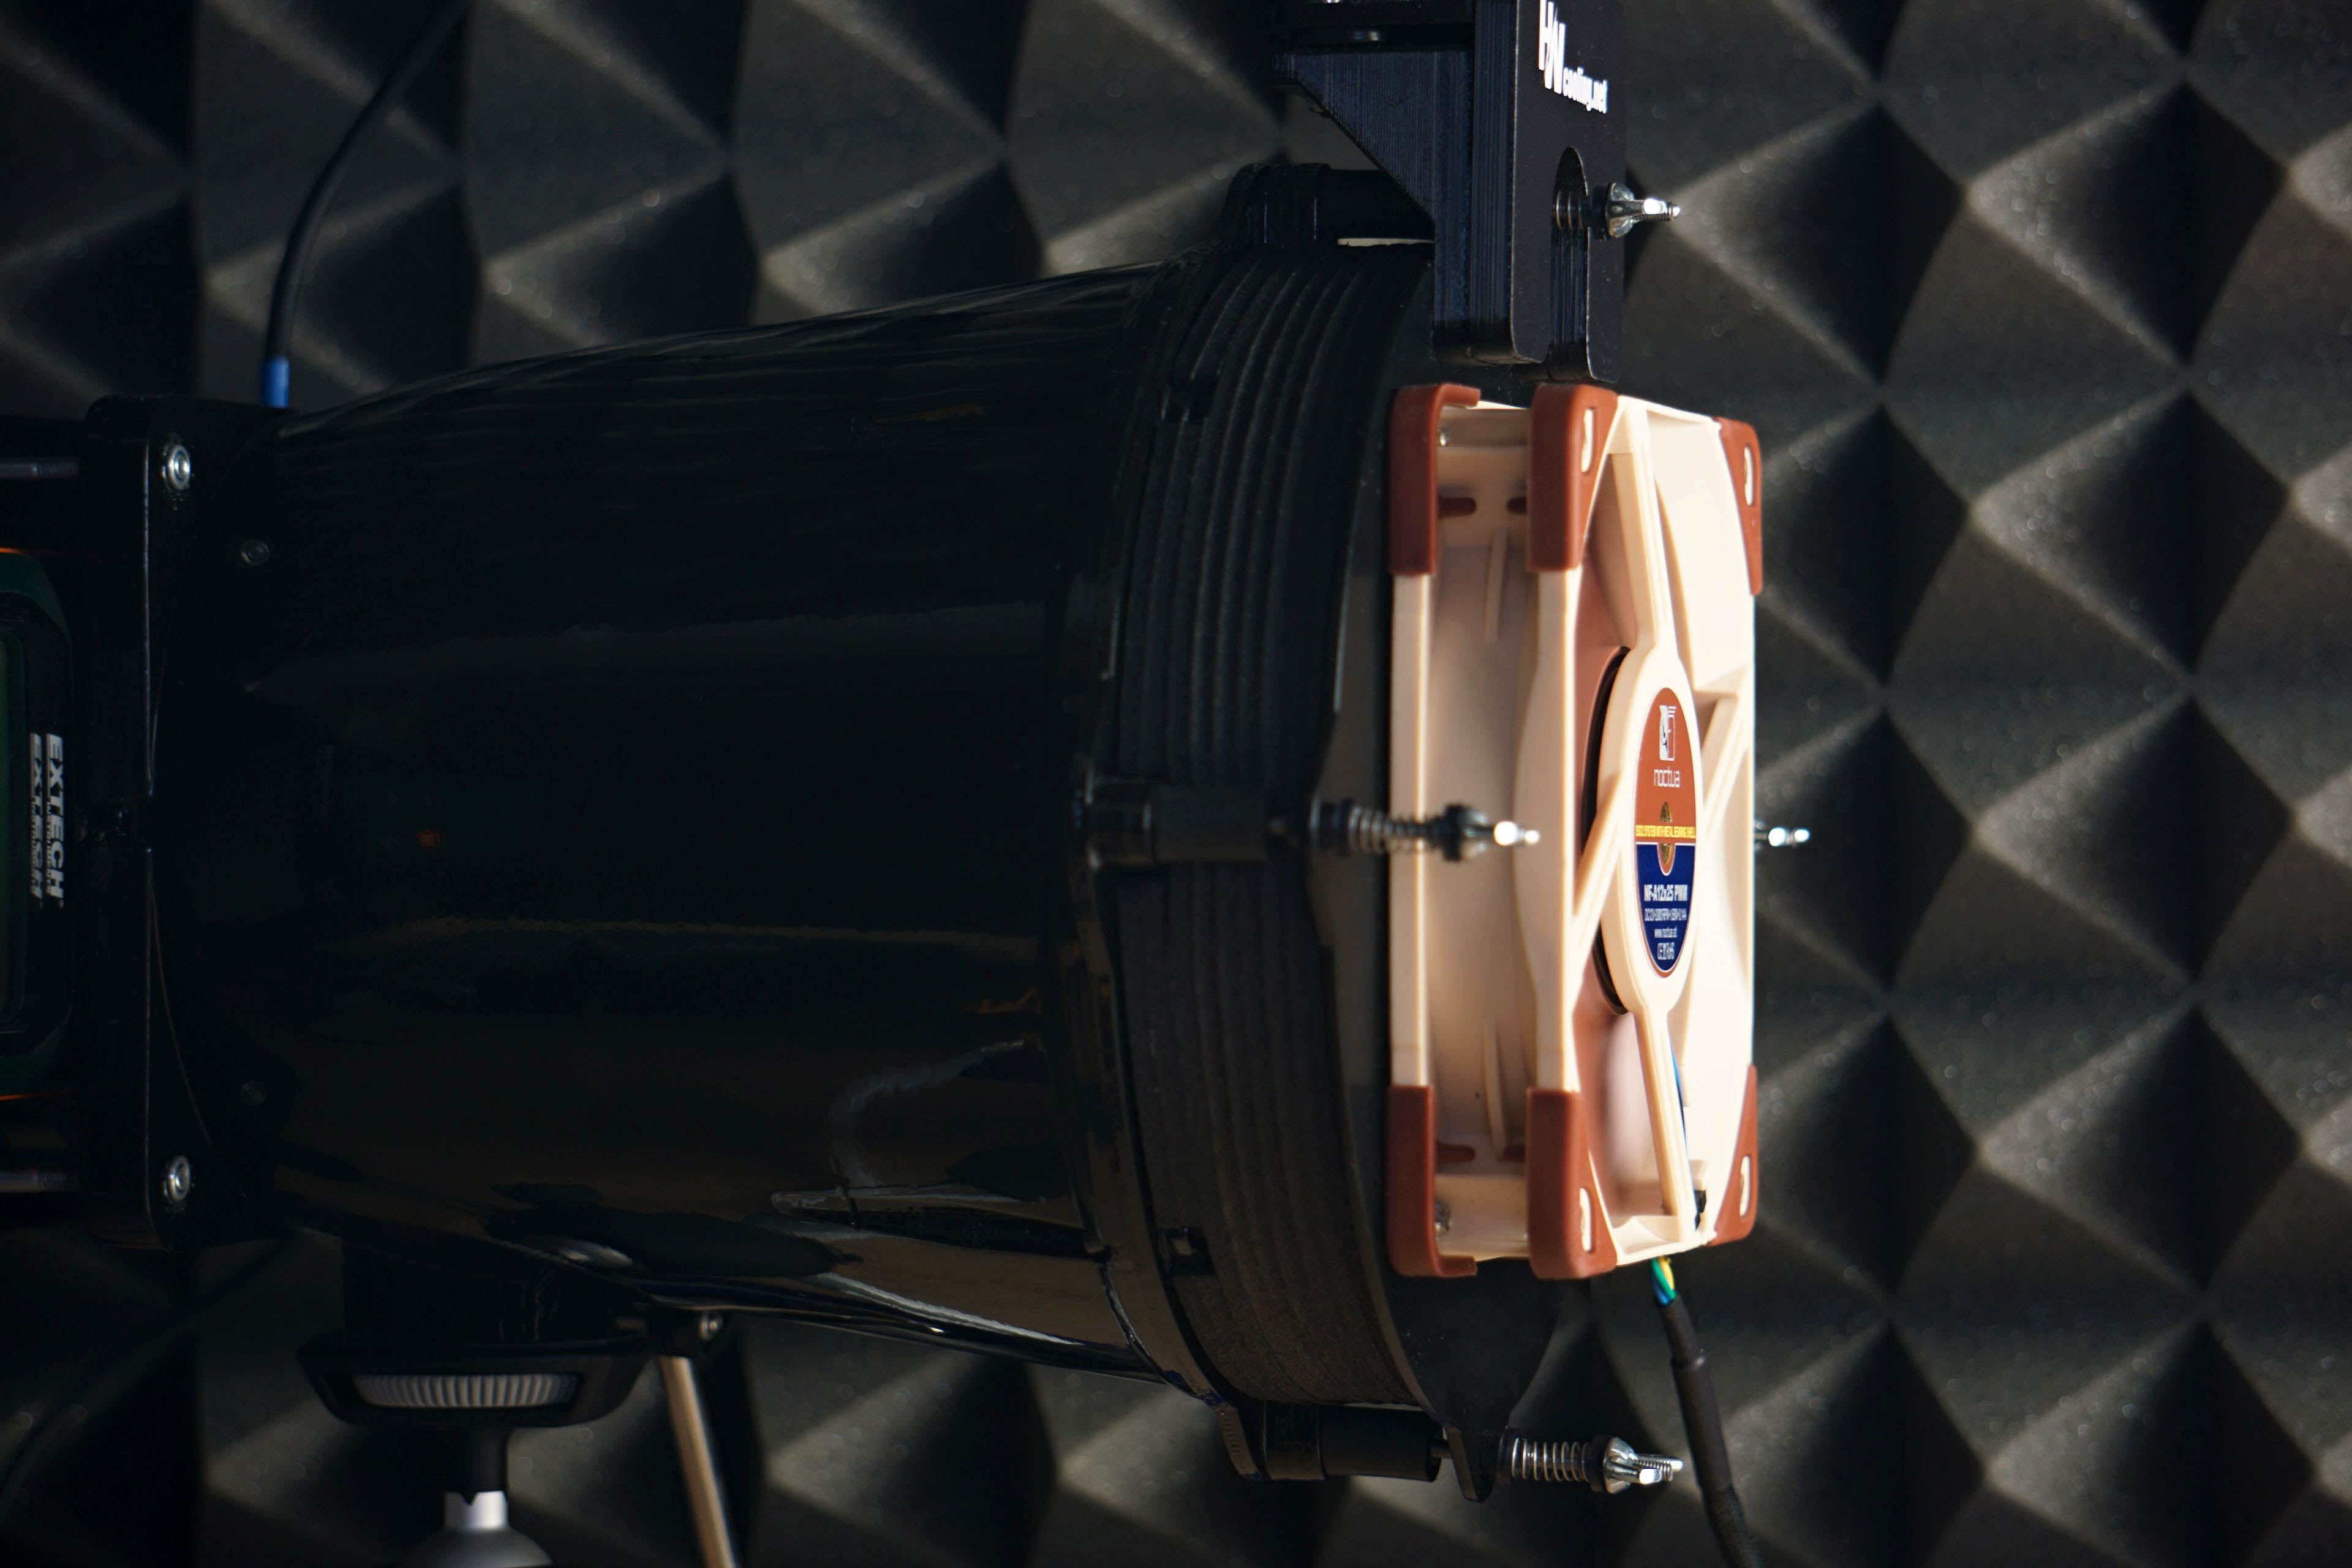
Strict acoustic safeguards are required to ensure that these measurements can be carried out with satisfactory repeatability at all. We use acoustic panels to measure the same values at all frequencies across repeated measurements. These ensure that the sound is always reflected equally to the microphone regardless of the distribution of other objects we have in the testlab. The baseline noise level before each measurement is also naturally the same. The room in which we measure is soundproofed.
Like the noise meter, the microphone has a parabolic collar to increase resolution. The latter is specially in this case not only to amplify but also to filter out the noises that occur whether we want them or not behind the microphone. We are talking about the physical activity of the user (tester). Without this addition, human breathing, for example, would also be picked up by the spectrograph. However, this is successfully reflected off the microphone sensor by the back (convex) side of the collar. As a result, the spectrogram only contains information about the sound emitted by the fan itself.


I have several general questions.
I see how the exhaust airflow pattern is often commended on. By how much does airflow pattern affect cooling performance? For example, assuming two fans have identical airflow rate on a thin radiator. One fan has cylindrical exhaust while the other has conical exhaust. Alternatively, one has a larger fan hub and the other has a smaller one. Or just different blade design in general. Does cooling performance differ, and if so, by how much? How about for case fans? How about on the intake side, does airflow pattern differ there?
The wind tunnel is made free of dust before testing. By how much does dust settled on the wind tunnel/fan blades etc affect airflow and noise? Would a thin layer significantly affect the results?
Great questions. We have had the ones from the first paragraph jotted down for a while and we will deal with them later in specialized tests. We just have to work our way through the other topics. 🙂
As for the effect of fan “dirtiness” on air flow, I wonder how this could be tested. Of course, we keep the wind tunnel as clean as possible (it is even stored in a vacuum chamber) and I don’t think it is a good idea to risk changing the friction or reducing the anemometer speed by some sediments from the tested fan. But we’ll figure something out. For this purpose we could use some of the prototype tunnels that preceded the final one we are using. They have some imperfections, but they should be suitable for this purpose.
I’m in love with these deeply scientific reviews. No other reviewer, ever, anywhere, went to such lengths and details in their reviews, especially about pc fans. Because of them I’m getting now 2x Endrofy Fluctus 140 argb for a top exhaust on case with grill+ dust filter. Having read all other reviews, I do prefer them over Pure Wings 3, they seem to be more efficient and more quiet at similar settings.
Thank you!