


From the top, we gradually worked our way down to the class of the iconic Pentium. Its design is quite conservative by today’s standards. The performance of the dual-core processor is at the limit, which begins to complicate the actual execution of the tests. One of the biggest appeals is the low power draw, but that may not be worth much if your processor can’t handle your demands in real time. Or can it?
Microsoft Flight Simulator
Disclaimer: The performance of this game changes and improves frequently due to continuous updates. We verify the consistency of the results by re-testing the Ryzen 9 5900X processor before each measurement. In case of significant deviations, we discard the older results and start building the database from scratch. Due to the incompleteness of the MFS results, we do not use MFS to calculate the average gaming performance of the processors.

Test environment: resolution 1280 × 720 px; graphics settings preset Low; API DirectX 11; extra settings Anti-Aliasing: off; test scene: custom (Paris-Charles de Gaulle, Air Traffic: AI, February 14, 9:00) autopilot: from 1000 m until hitting the terrain.
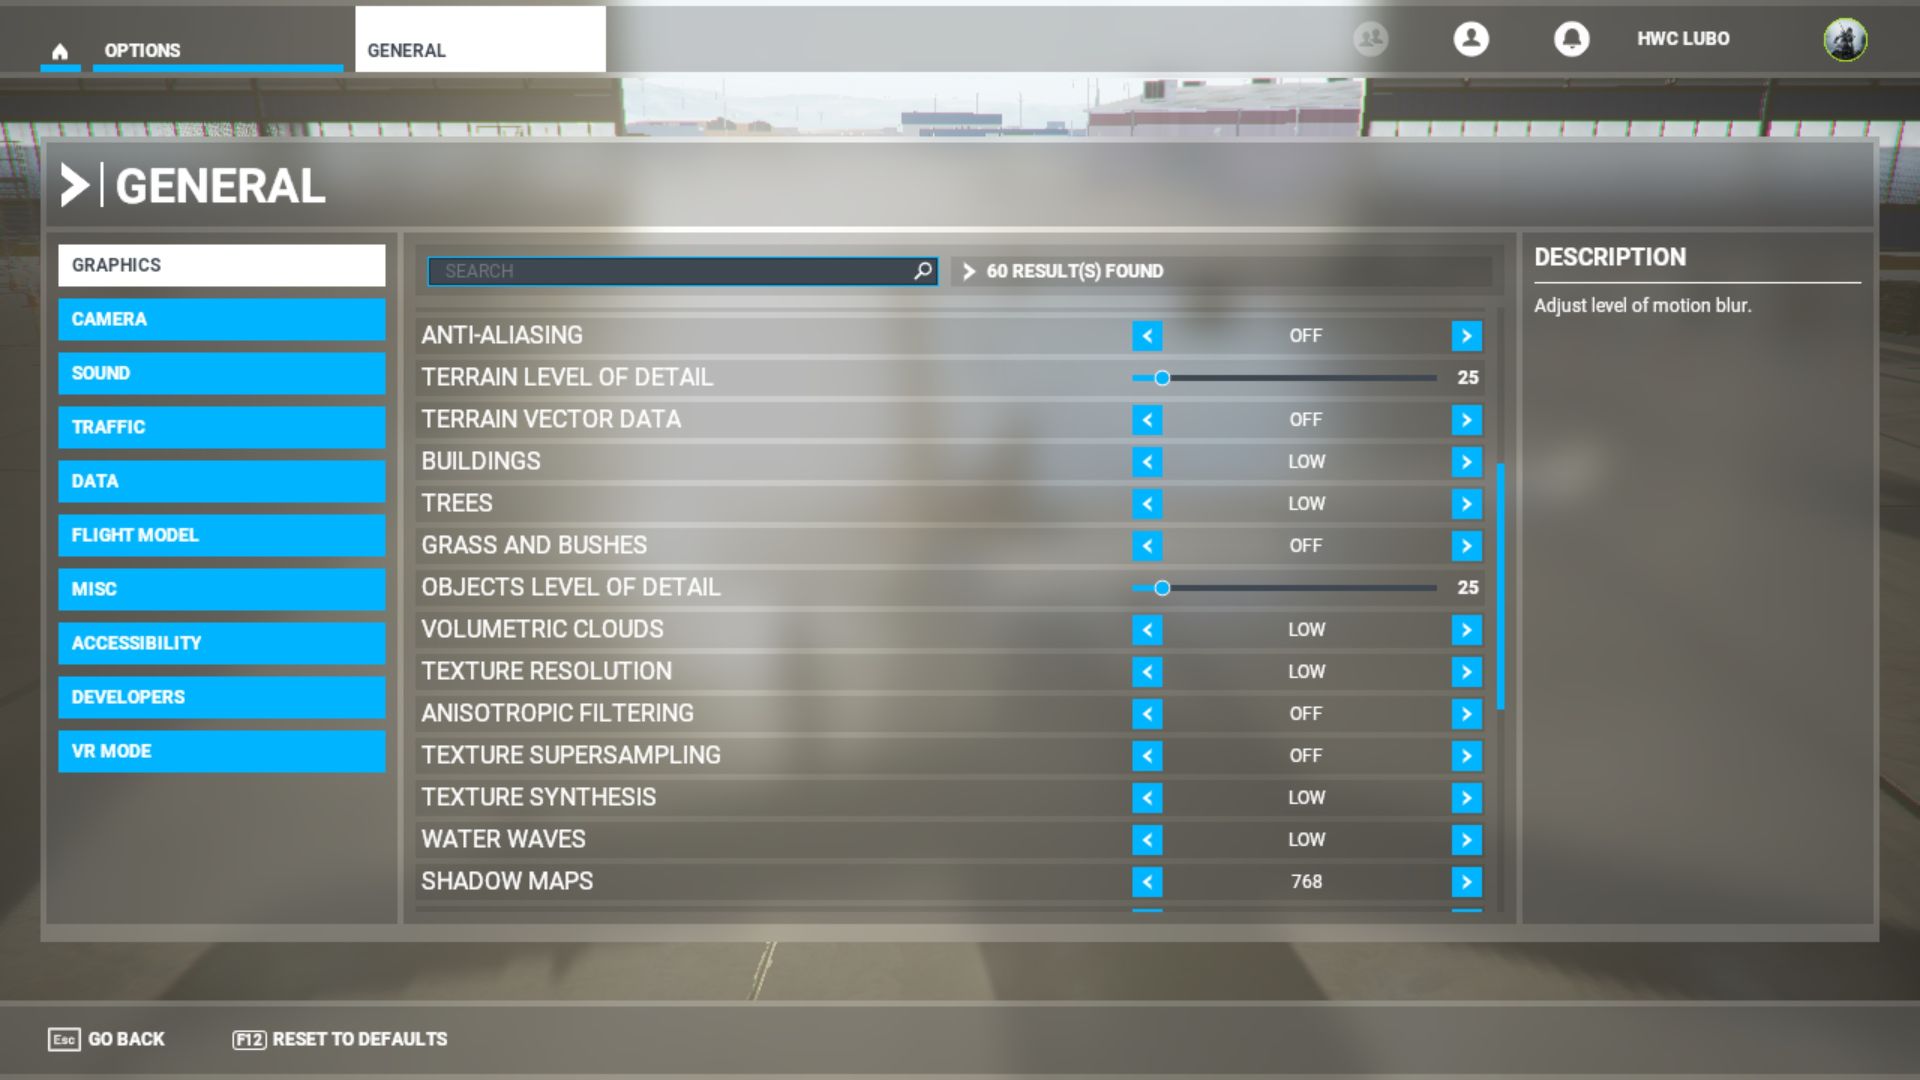

Test environment: resolution 1920 × 1080 px; graphics settings preset Low; API DirectX 11; extra settings Anti-Aliasing: off; test scene: custom (Paris-Charles de Gaulle, Air Traffic: AI, February 14, 9:00) autopilot: from 1000 m until hitting the terrain.
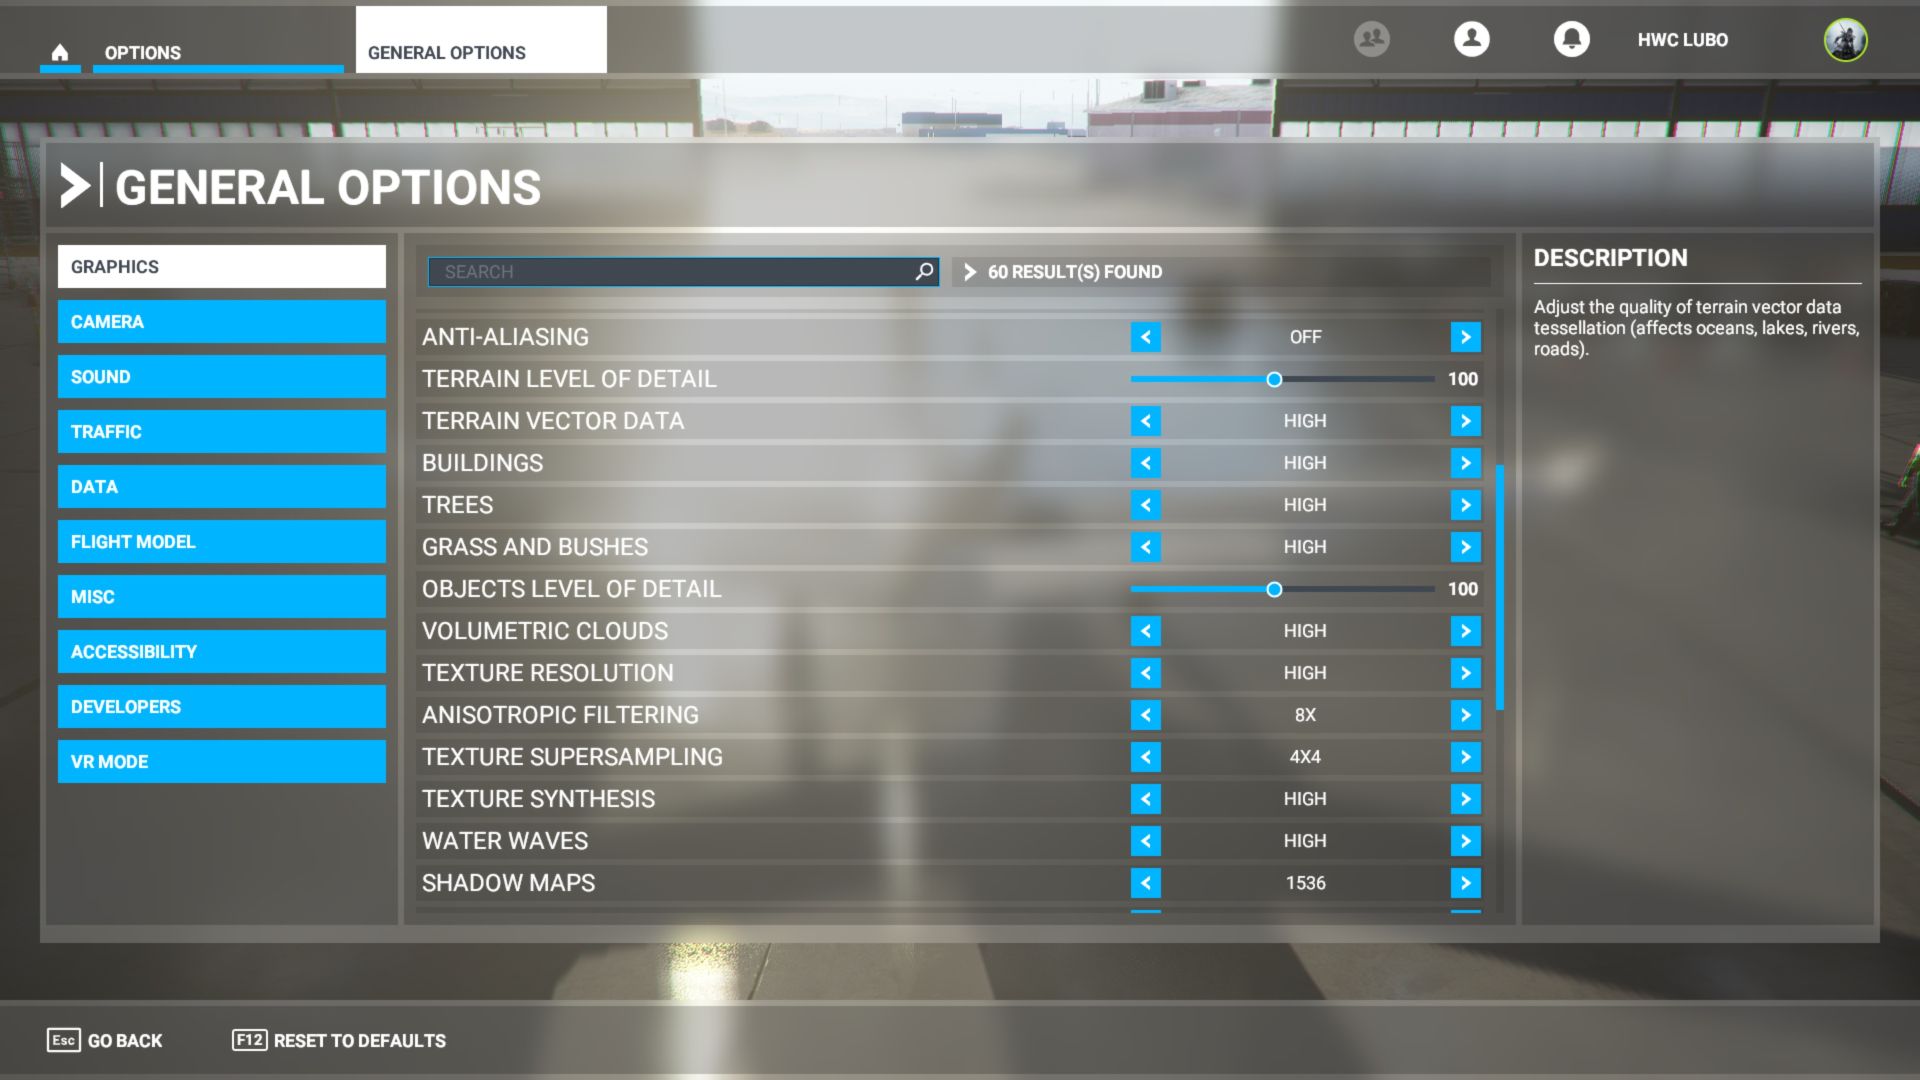
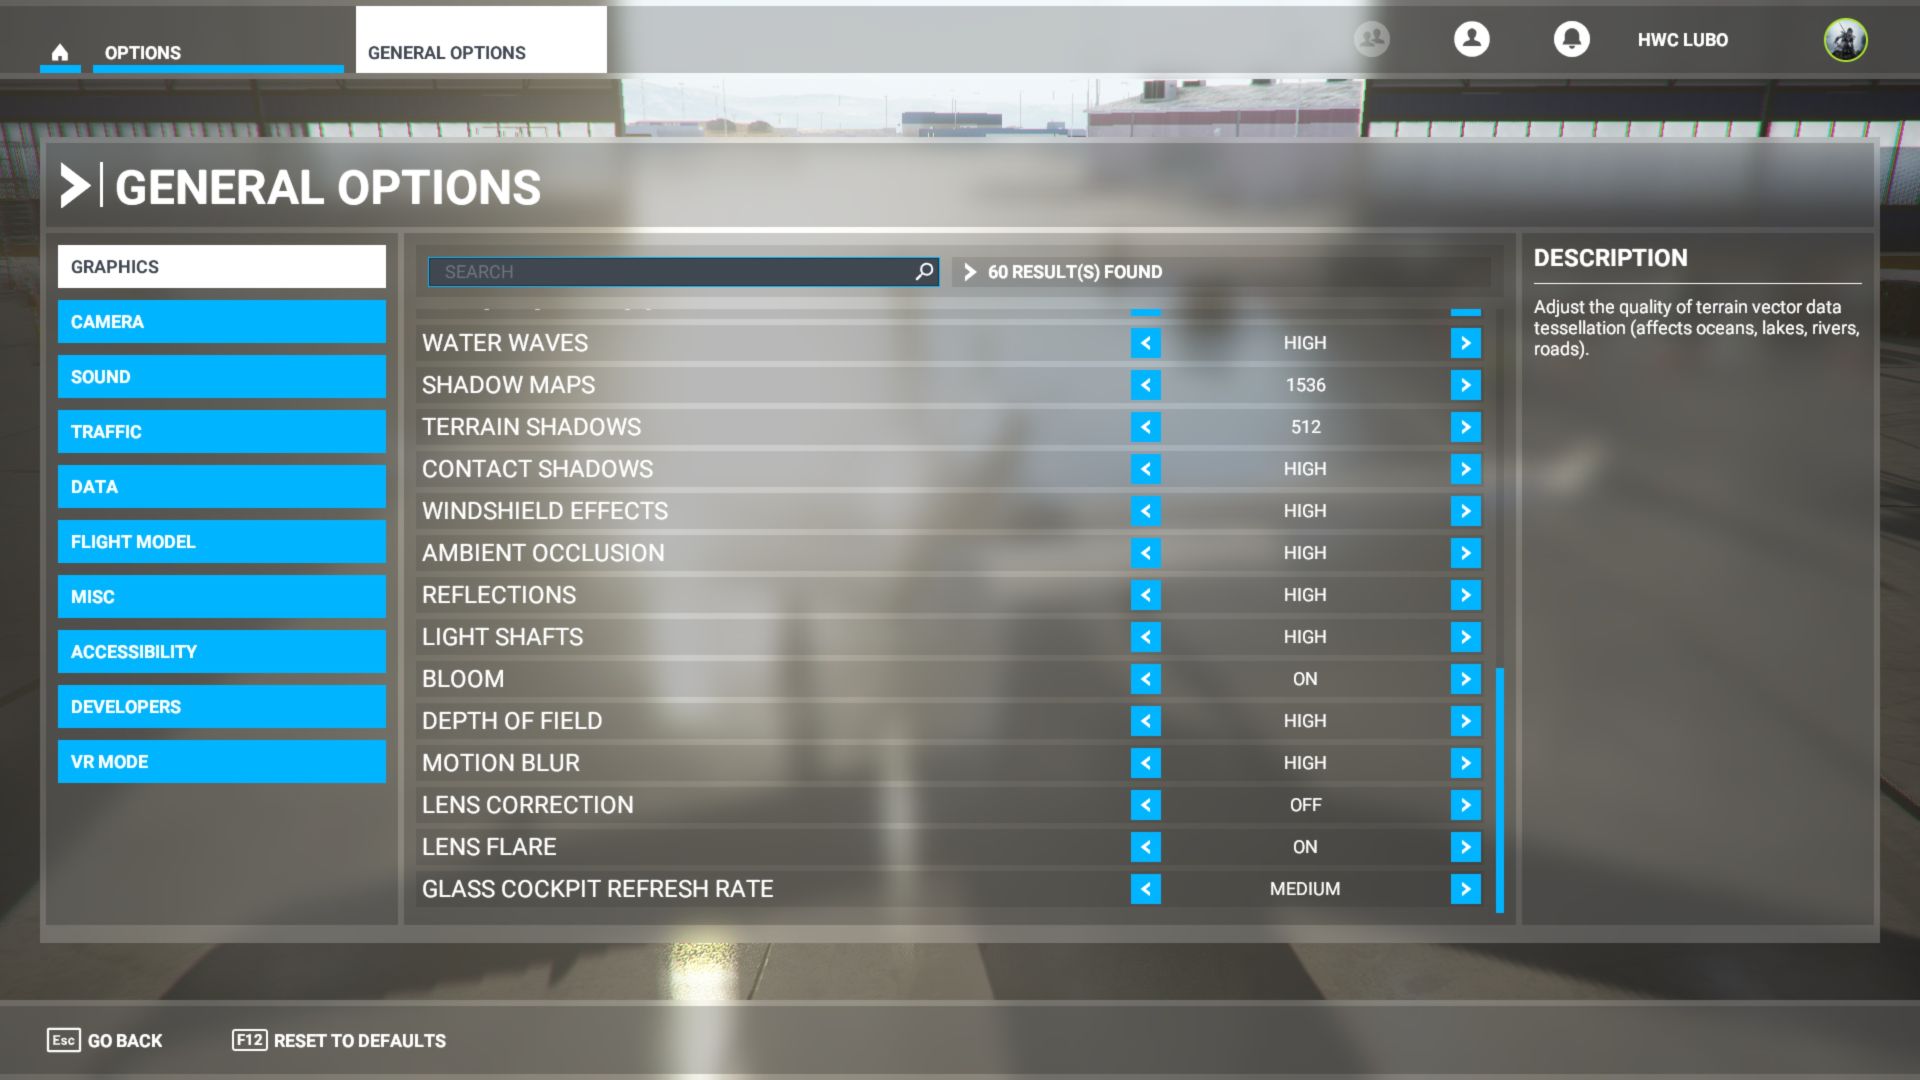
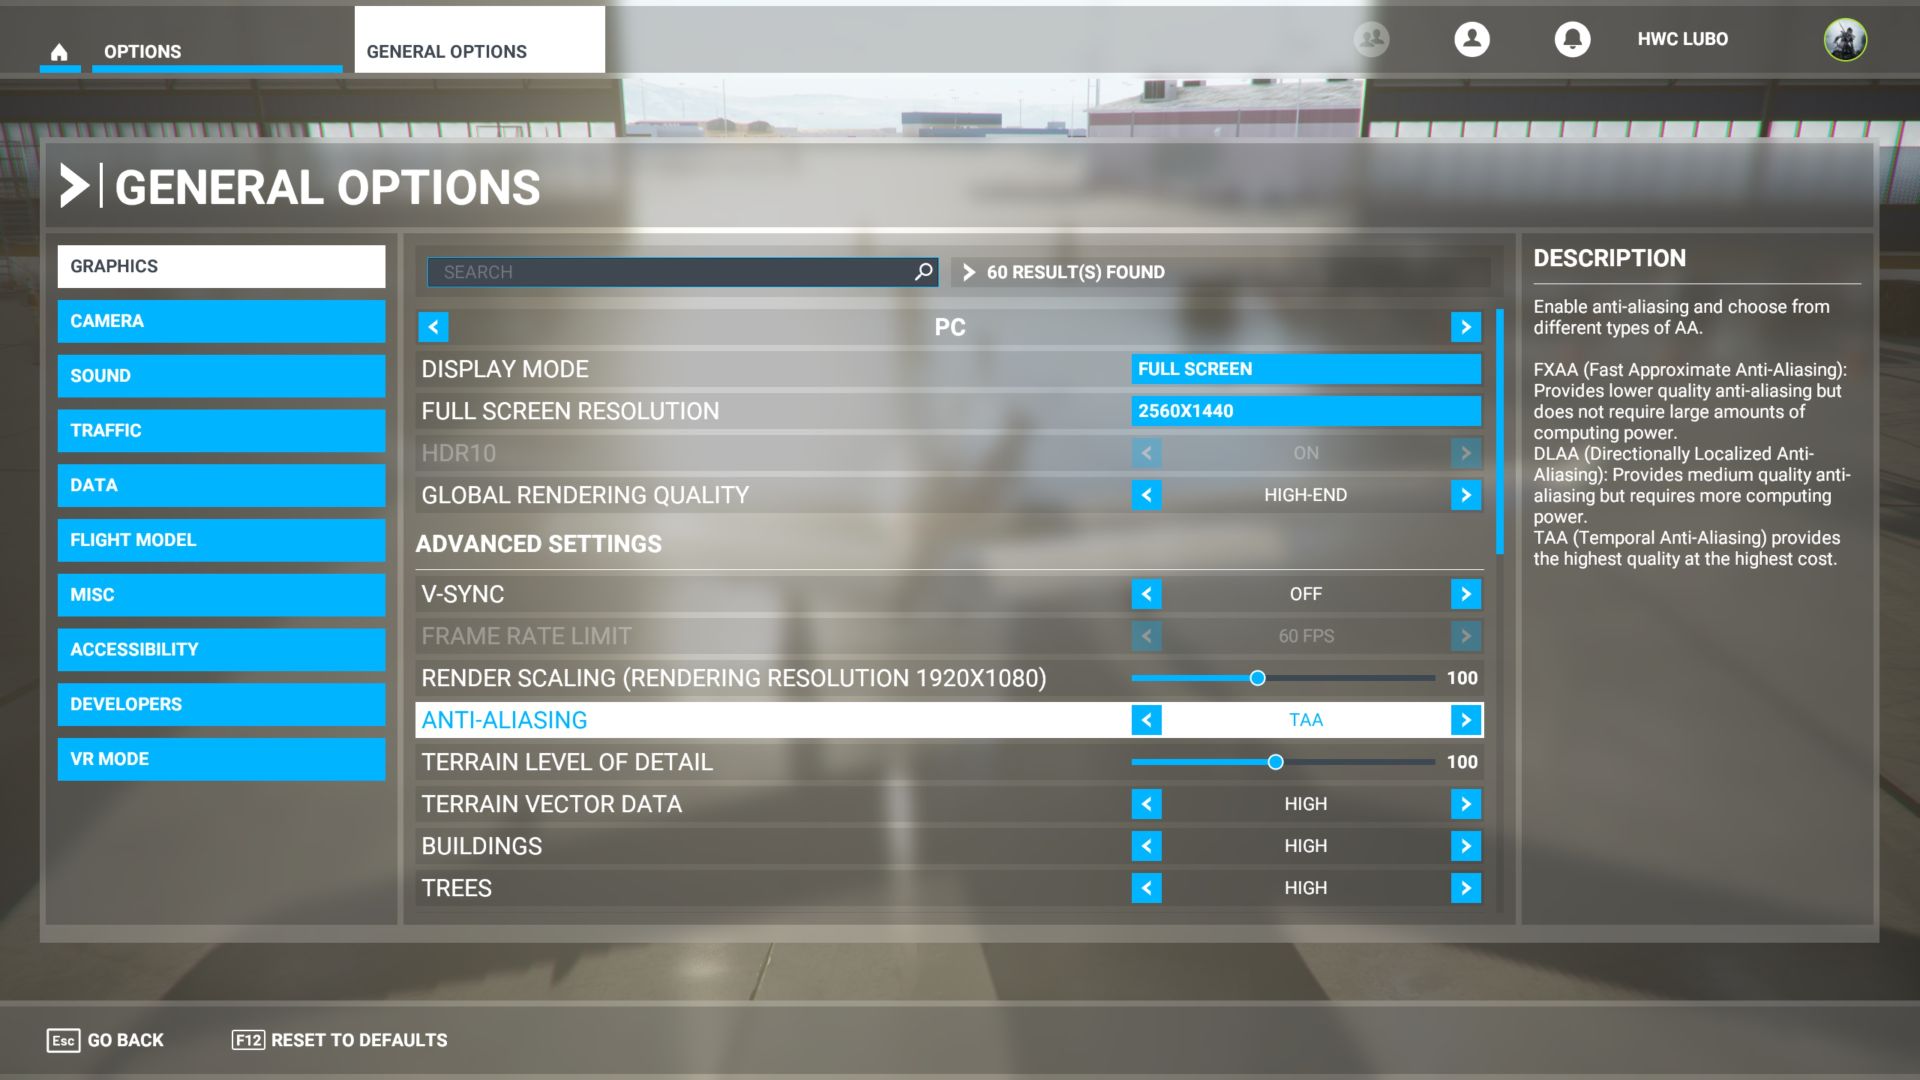
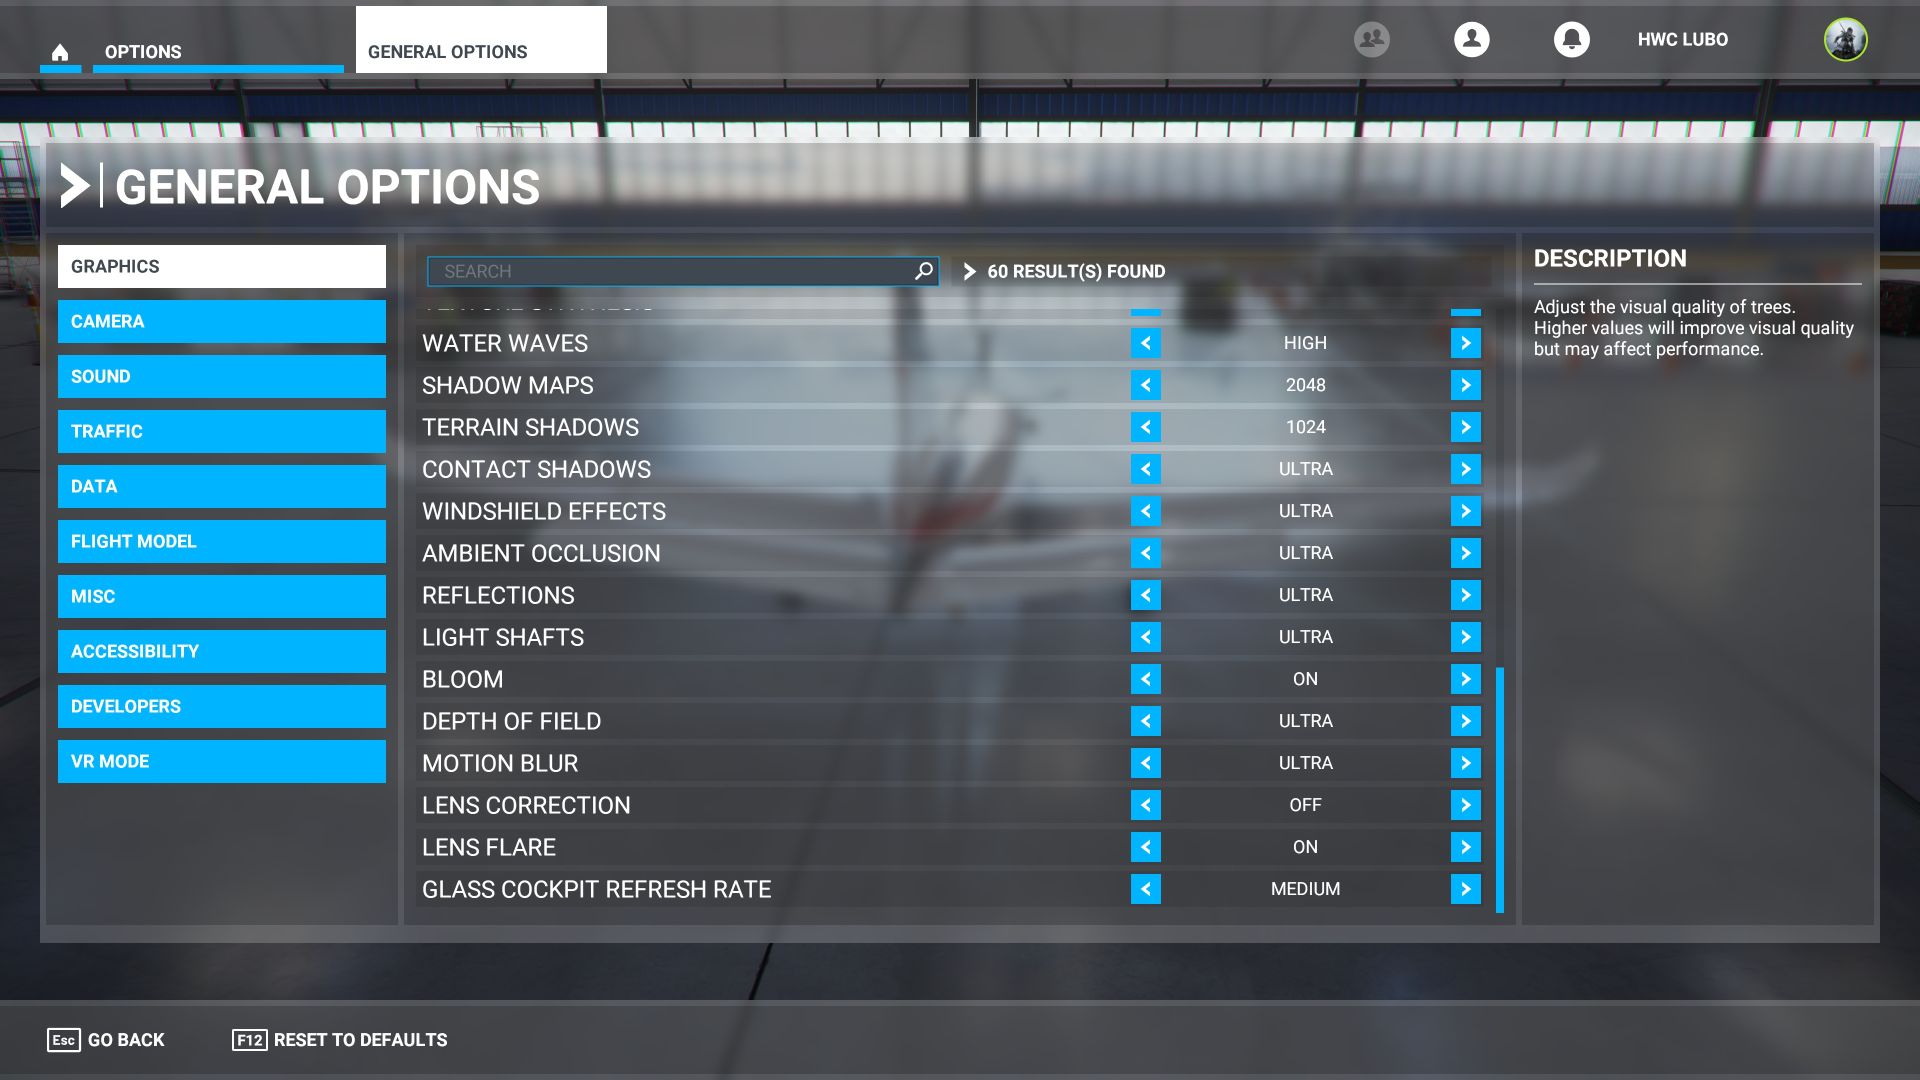
Test environment: resolution 2560 × 1440 px; graphics settings preset High; API DirectX 11; extra settings Anti-Aliasing: TAA; test scene: custom (Paris-Charles de Gaulle, Air Traffic: AI, February 14, 9:00) autopilot: from 1000 m until hitting the terrain.
Test environment: resolution 3840 × 2160 px; graphics settings preset Ultra; API DirectX 11; extra settings Anti-Aliasing: TAA; test scene: custom (Paris-Charles de Gaulle, Air Traffic: AI, February 14, 9:00) autopilot: from 1000 m until hitting the terrain.


Ahaha, it beat my old 3770K
Yeah! G7400 is a monster, haha.
HW video encode AV1 – is not a mistake?
No. The results are certainly correct. Pentium’s video encoding performance is significantly slower than Core i3 Alder/Comet Lake. It has half the number of cores/threads and lower clock speeds.
I mean the last table with hardware encoders/decoders.
Yes, I know. This one, right?
https://www.hwcooling.net/wp-content/uploads/2022/04/intel-pentium-g7400-g328.html
No, it looks like the it is done In software in that chart.
If it has hw encoders and they are utilized, it will be faster than a Ryzen that
lacks hw encoders and decoders.
You’re right. I overlooked that Victor was asking about hardware encoding. This is still not supported by current processors for AV1. So yes, these tests capture the performance of software encoding.
In Febarary 2025 a desktop computer with g7400, 8 GB ram and 512GB SSD sells new for 135 USD. Now i bought one with discount for 98 USD. A Lenovo.
Is it worth the price?
Personally, I think it is a very attractive offer, if it is an office computer or a build for simpler applications. 🙂