

Memory and cache tests
It clearly outperformed its predecessors (including the R7 5800X) and also the Core i9-10900K, which has two more cores. But it can’t compare with the Core i7-13700K in heavy MT workloads, and that’s just a month after its release. In ST loads, however, it’s even performance-wise, as in games, where Ryzen 7 is more efficient. Whether the R7 7700X is worth more than the Ci7-13700K for similar money, however, you’ll have to judge for yourself.
Memory tests…
… and cache (L1, L2, L3)
Note: The L3 memory results, at least with our component configuration, could not be measured in AIDA64, the corresponding application windows remained empty. Tested with older versions as well as with the latest one (6.60.5900).
Continue: Processor power draw curve
- Contents
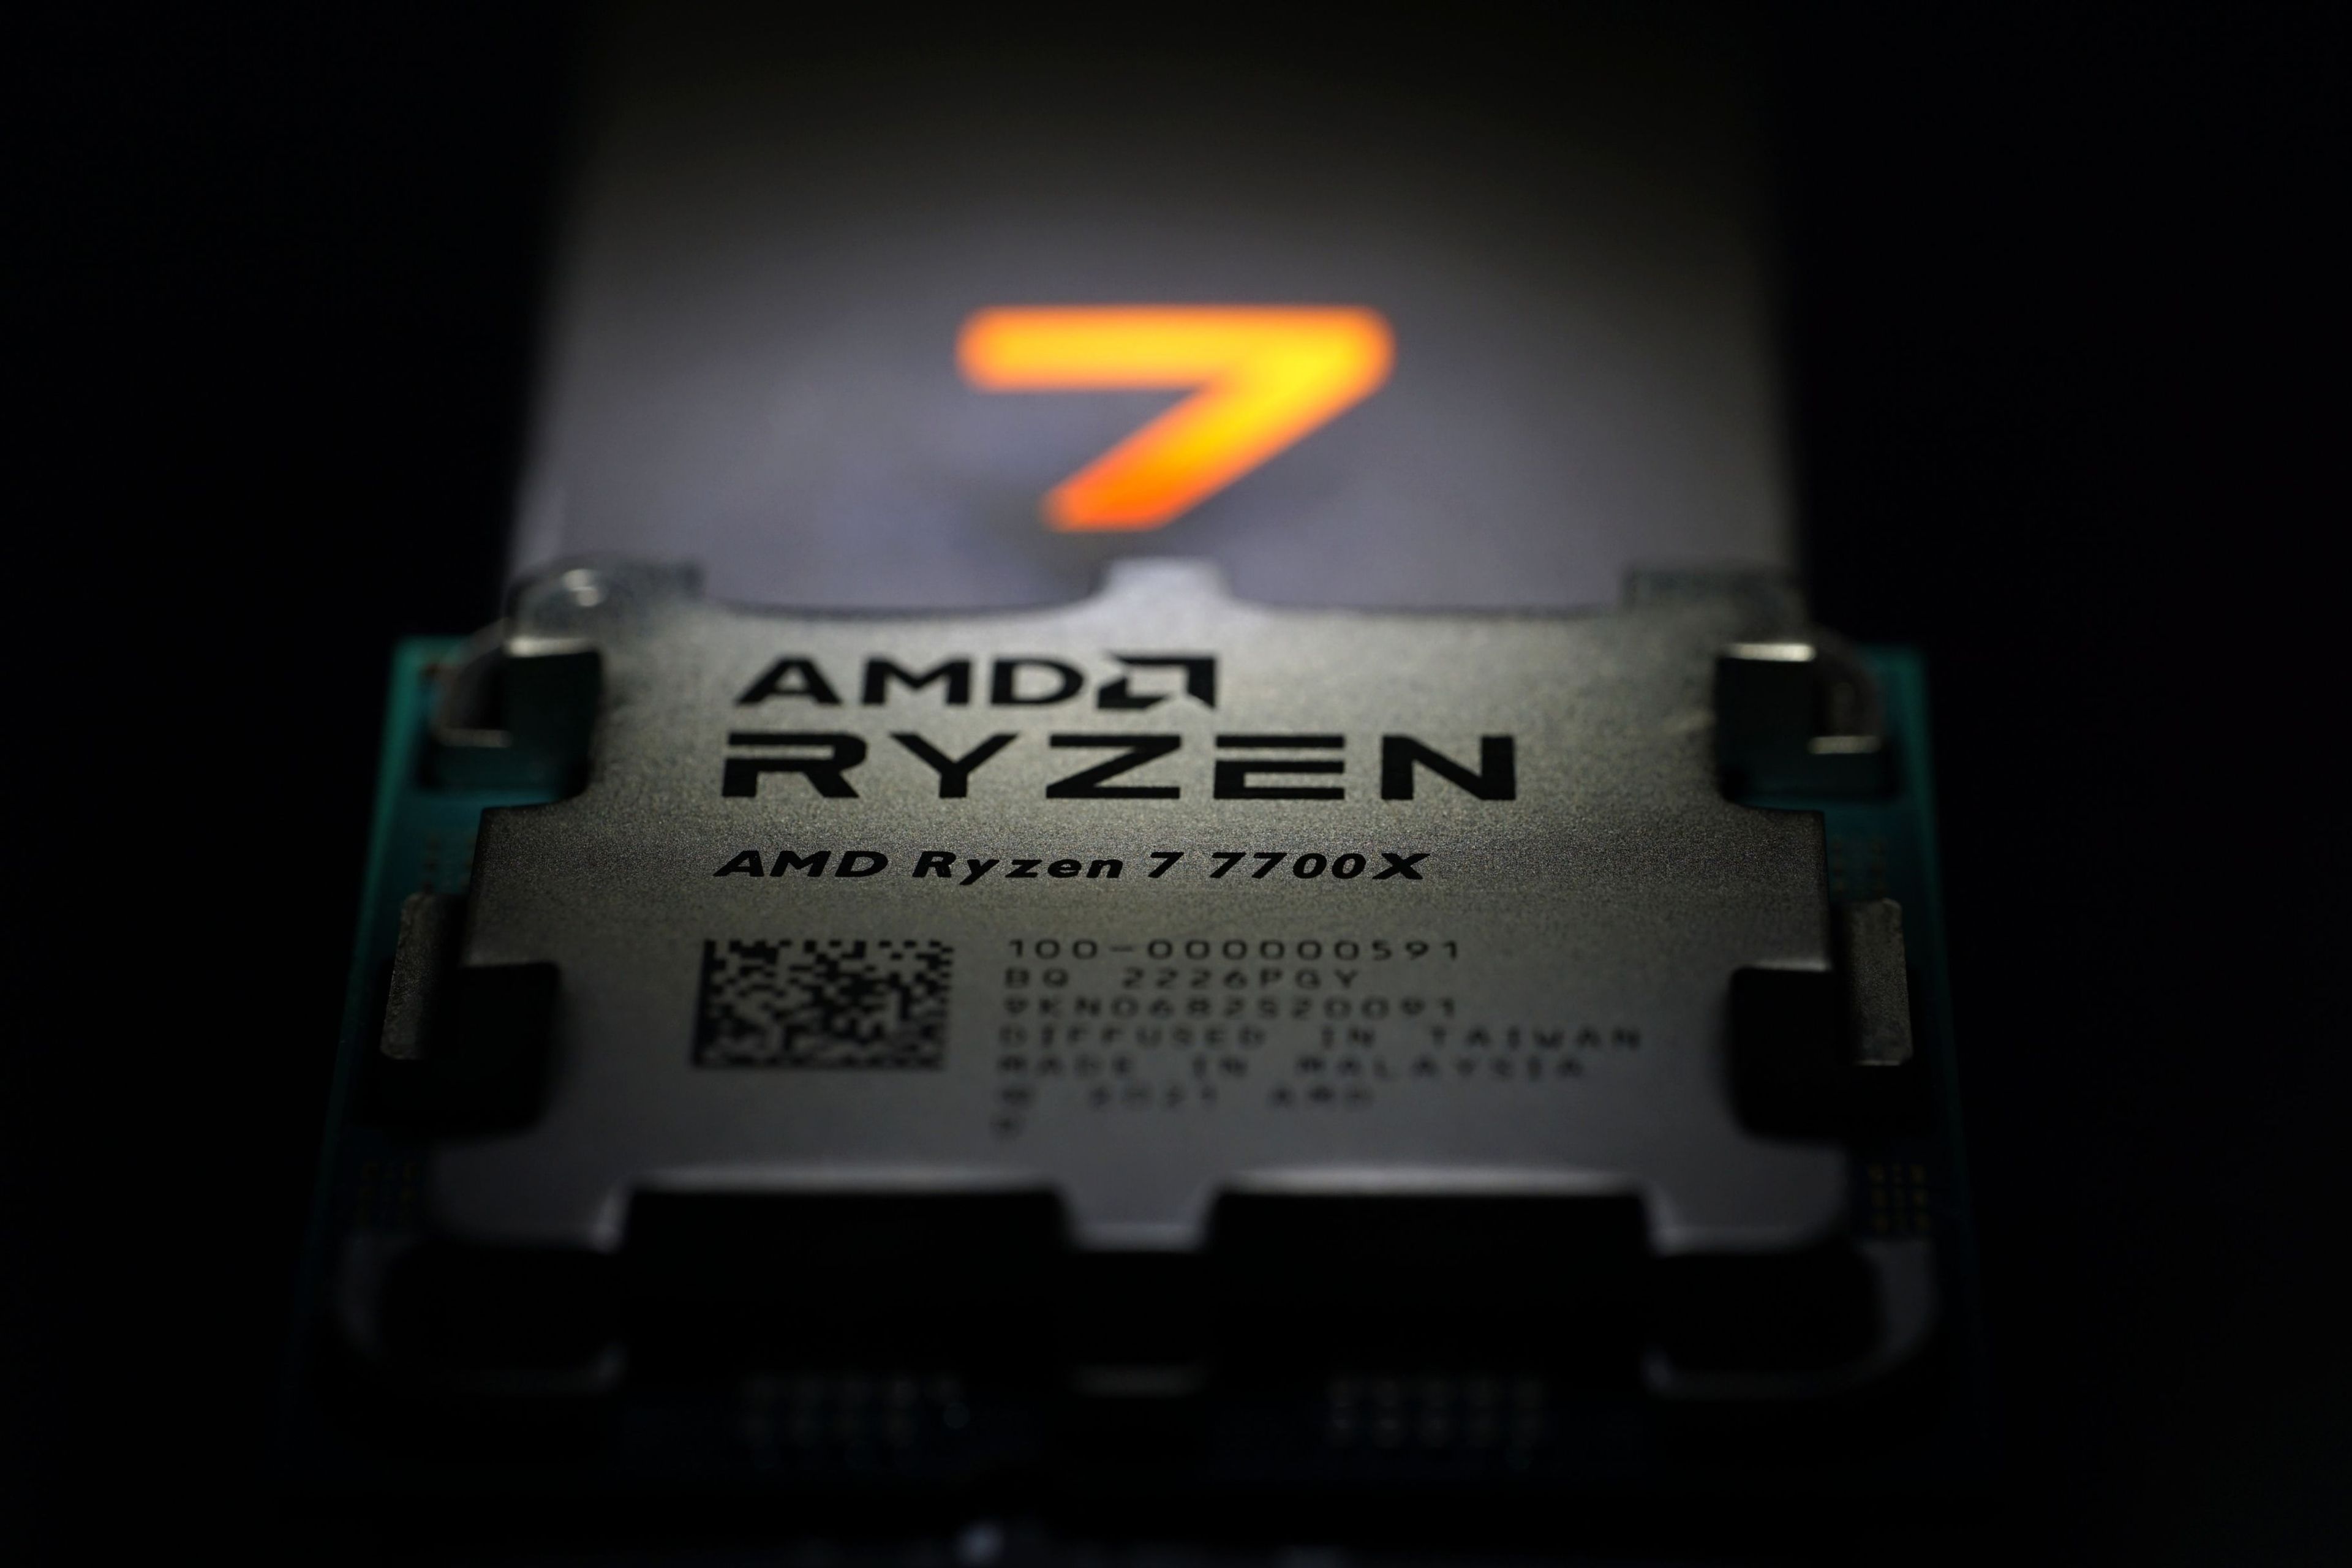
- AMD Ryzen 7 7700X in detail
- Methodology: performance tests
- Methodology: how we measure power draw
- Methodology: temperature and clock speed tests
- Test setup
- 3DMark
- Assassin’s Creed: Valhalla
- Borderlands 3
- Counter-Strike: GO
- Cyberpunk 2077
- DOOM Eternal
- F1 2020
- Metro Exodus
- Microsoft Flight Simulator
- Shadow of the Tomb Raider
- Total War Saga: Troy
- Overall gaming performance
- Gaming performance per euro
- PCMark and Geekbench
- Web performance
- 3D rendering: Cinebench, Blender, ...
- Video 1/2: Adobe Premiere Pro
- Video 2/2: DaVinci Resolve Studio
- Graphics effects: Adobe After Effects
- Video encoding
- Audio encoding
- Broadcasting (OBS and Xsplit)
- Fotky 1/2: Adobe Photoshop and Lightroom
- Photos 2/2: Affinity Photo, Topaz Labs AI Apps, ZPS X, ...
- (De)compression
- (De)encryption
- Numerical computing
- Simulations
- Memory and cache tests
- Processor power draw curve
- Average processor power draw
- Performance per watt
- Achieved CPU clock speed
- CPU temperature
- Conclusion