
The sixteen-core desktop Raptor Lake (Ci7-13700K) is a curious compromise between Core i9 (13900K) and Core i5 (13600K). Compared to the Core i5, it is significantly faster thanks to higher clock speeds and Turbo Boost 3.0 support, and it doesn’t lose much performance compared to Core i9 in lighter workloads, including gaming, but it is significantly more power-efficient.
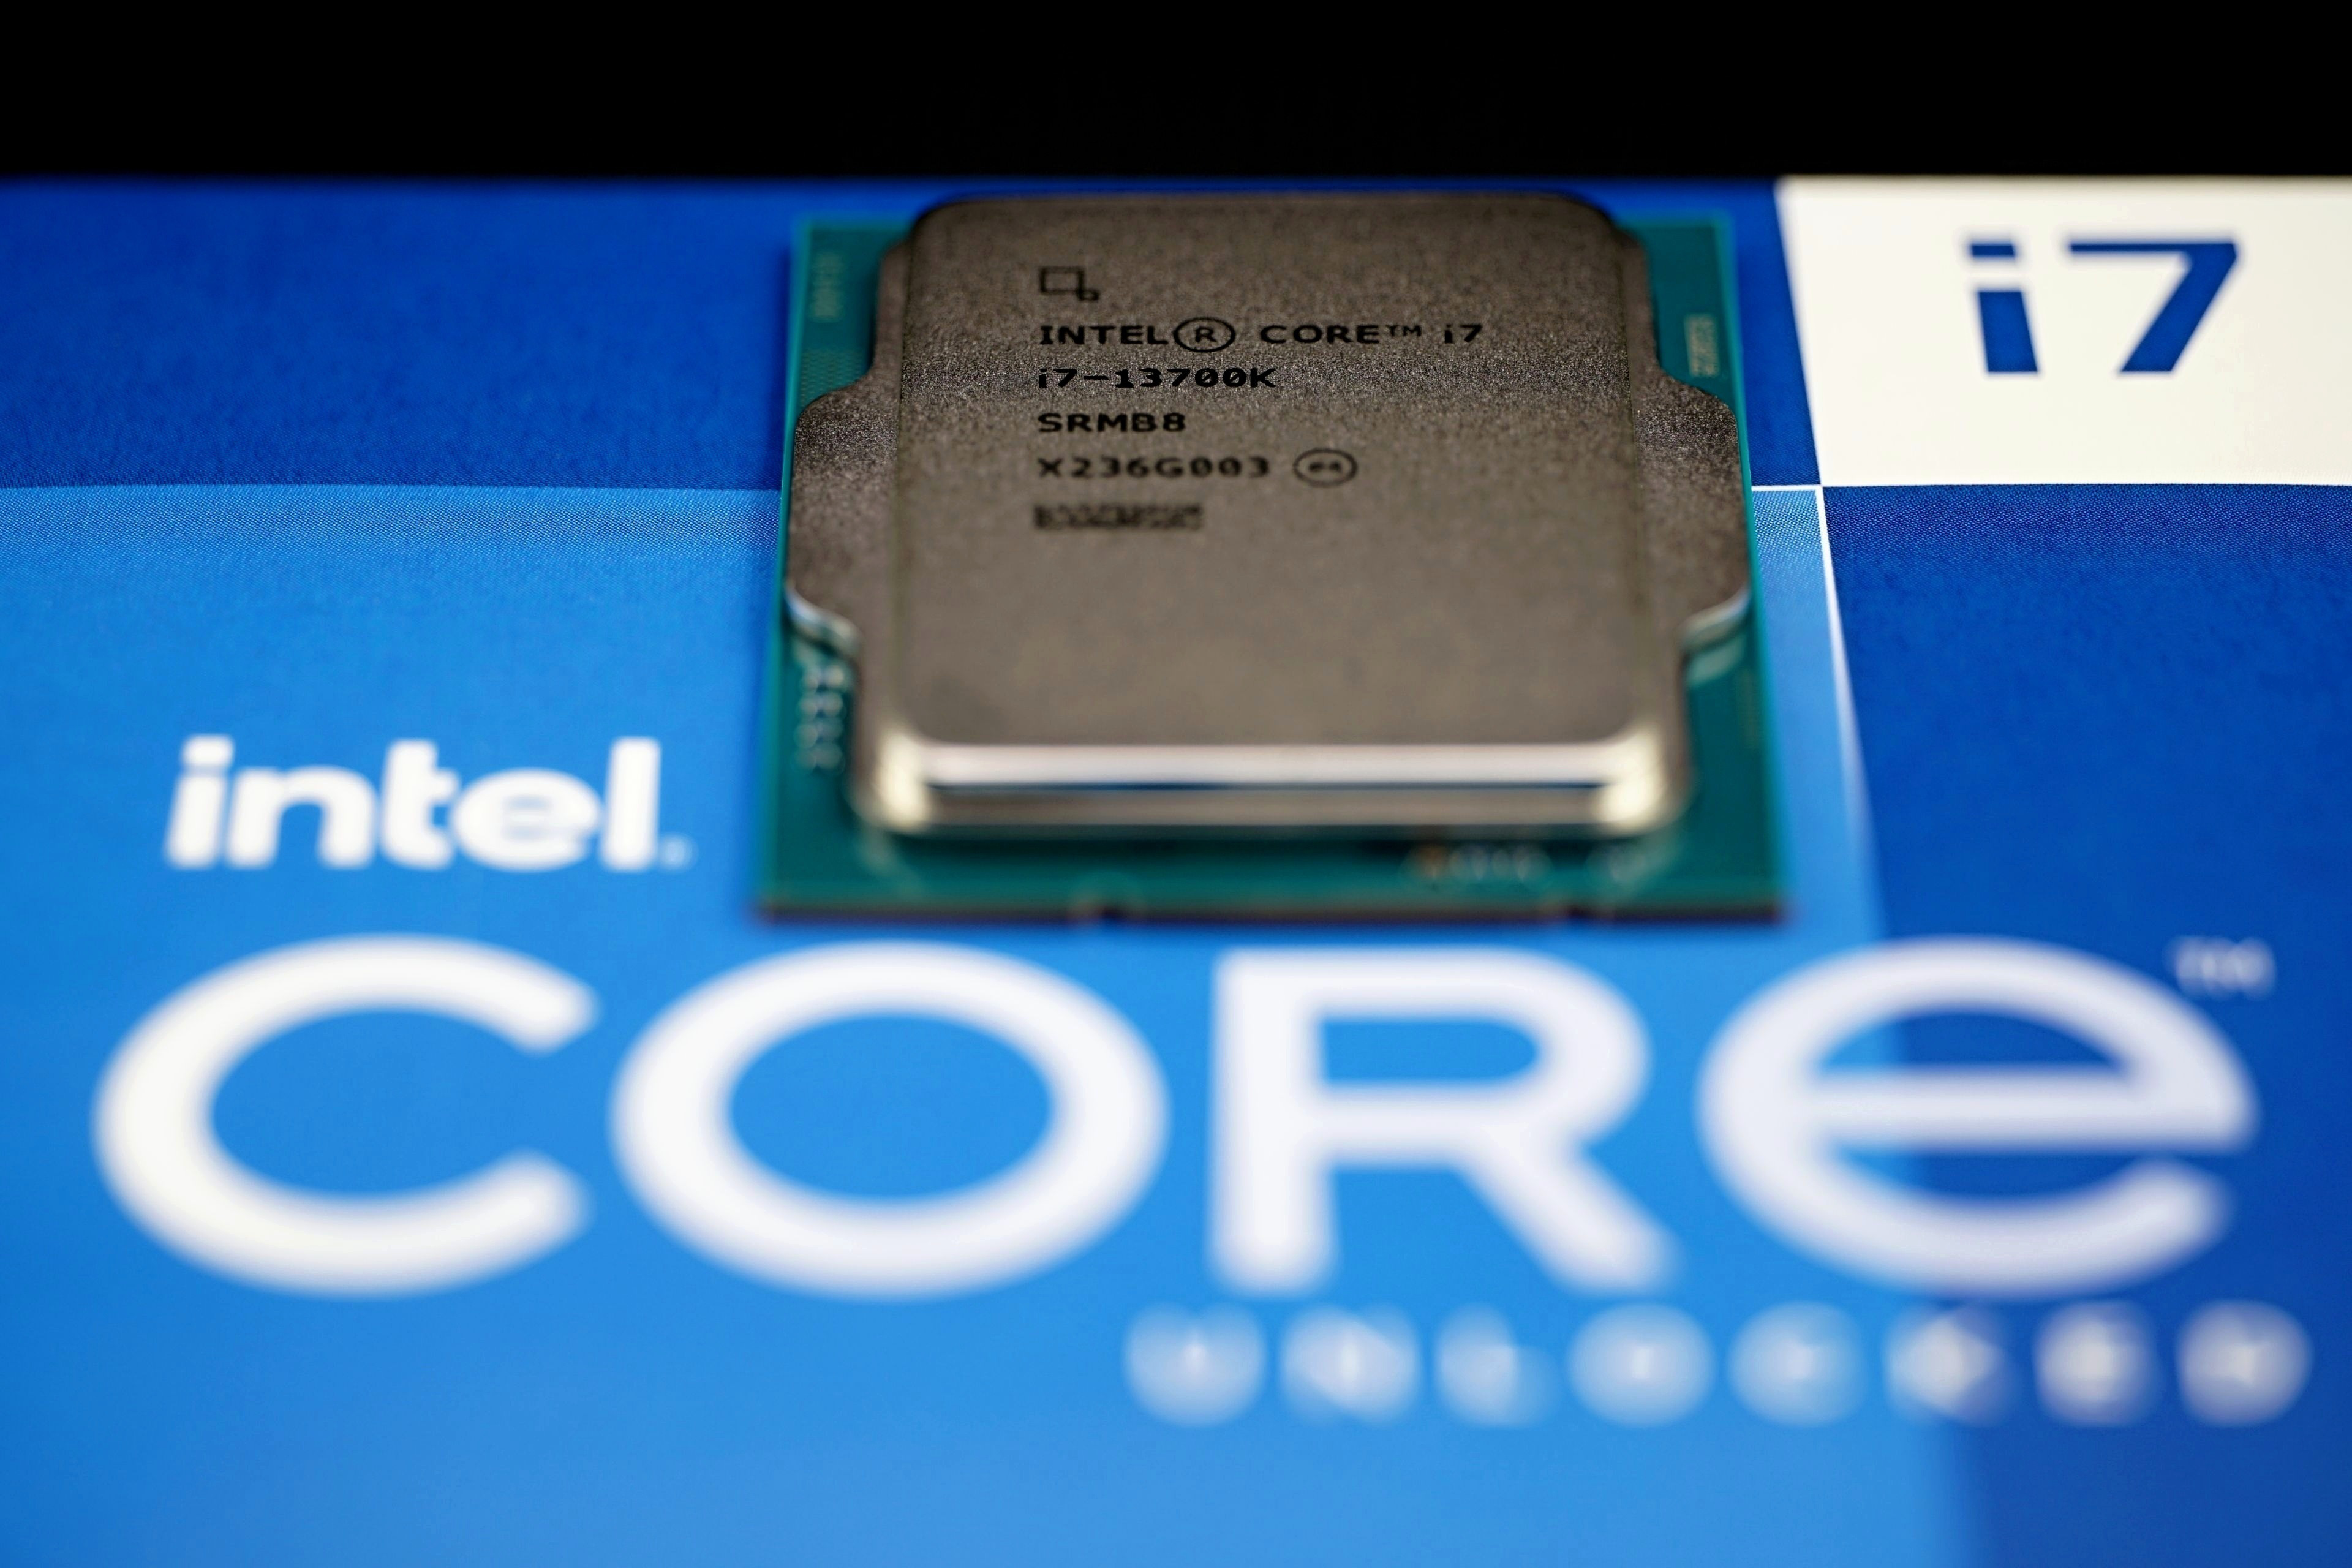
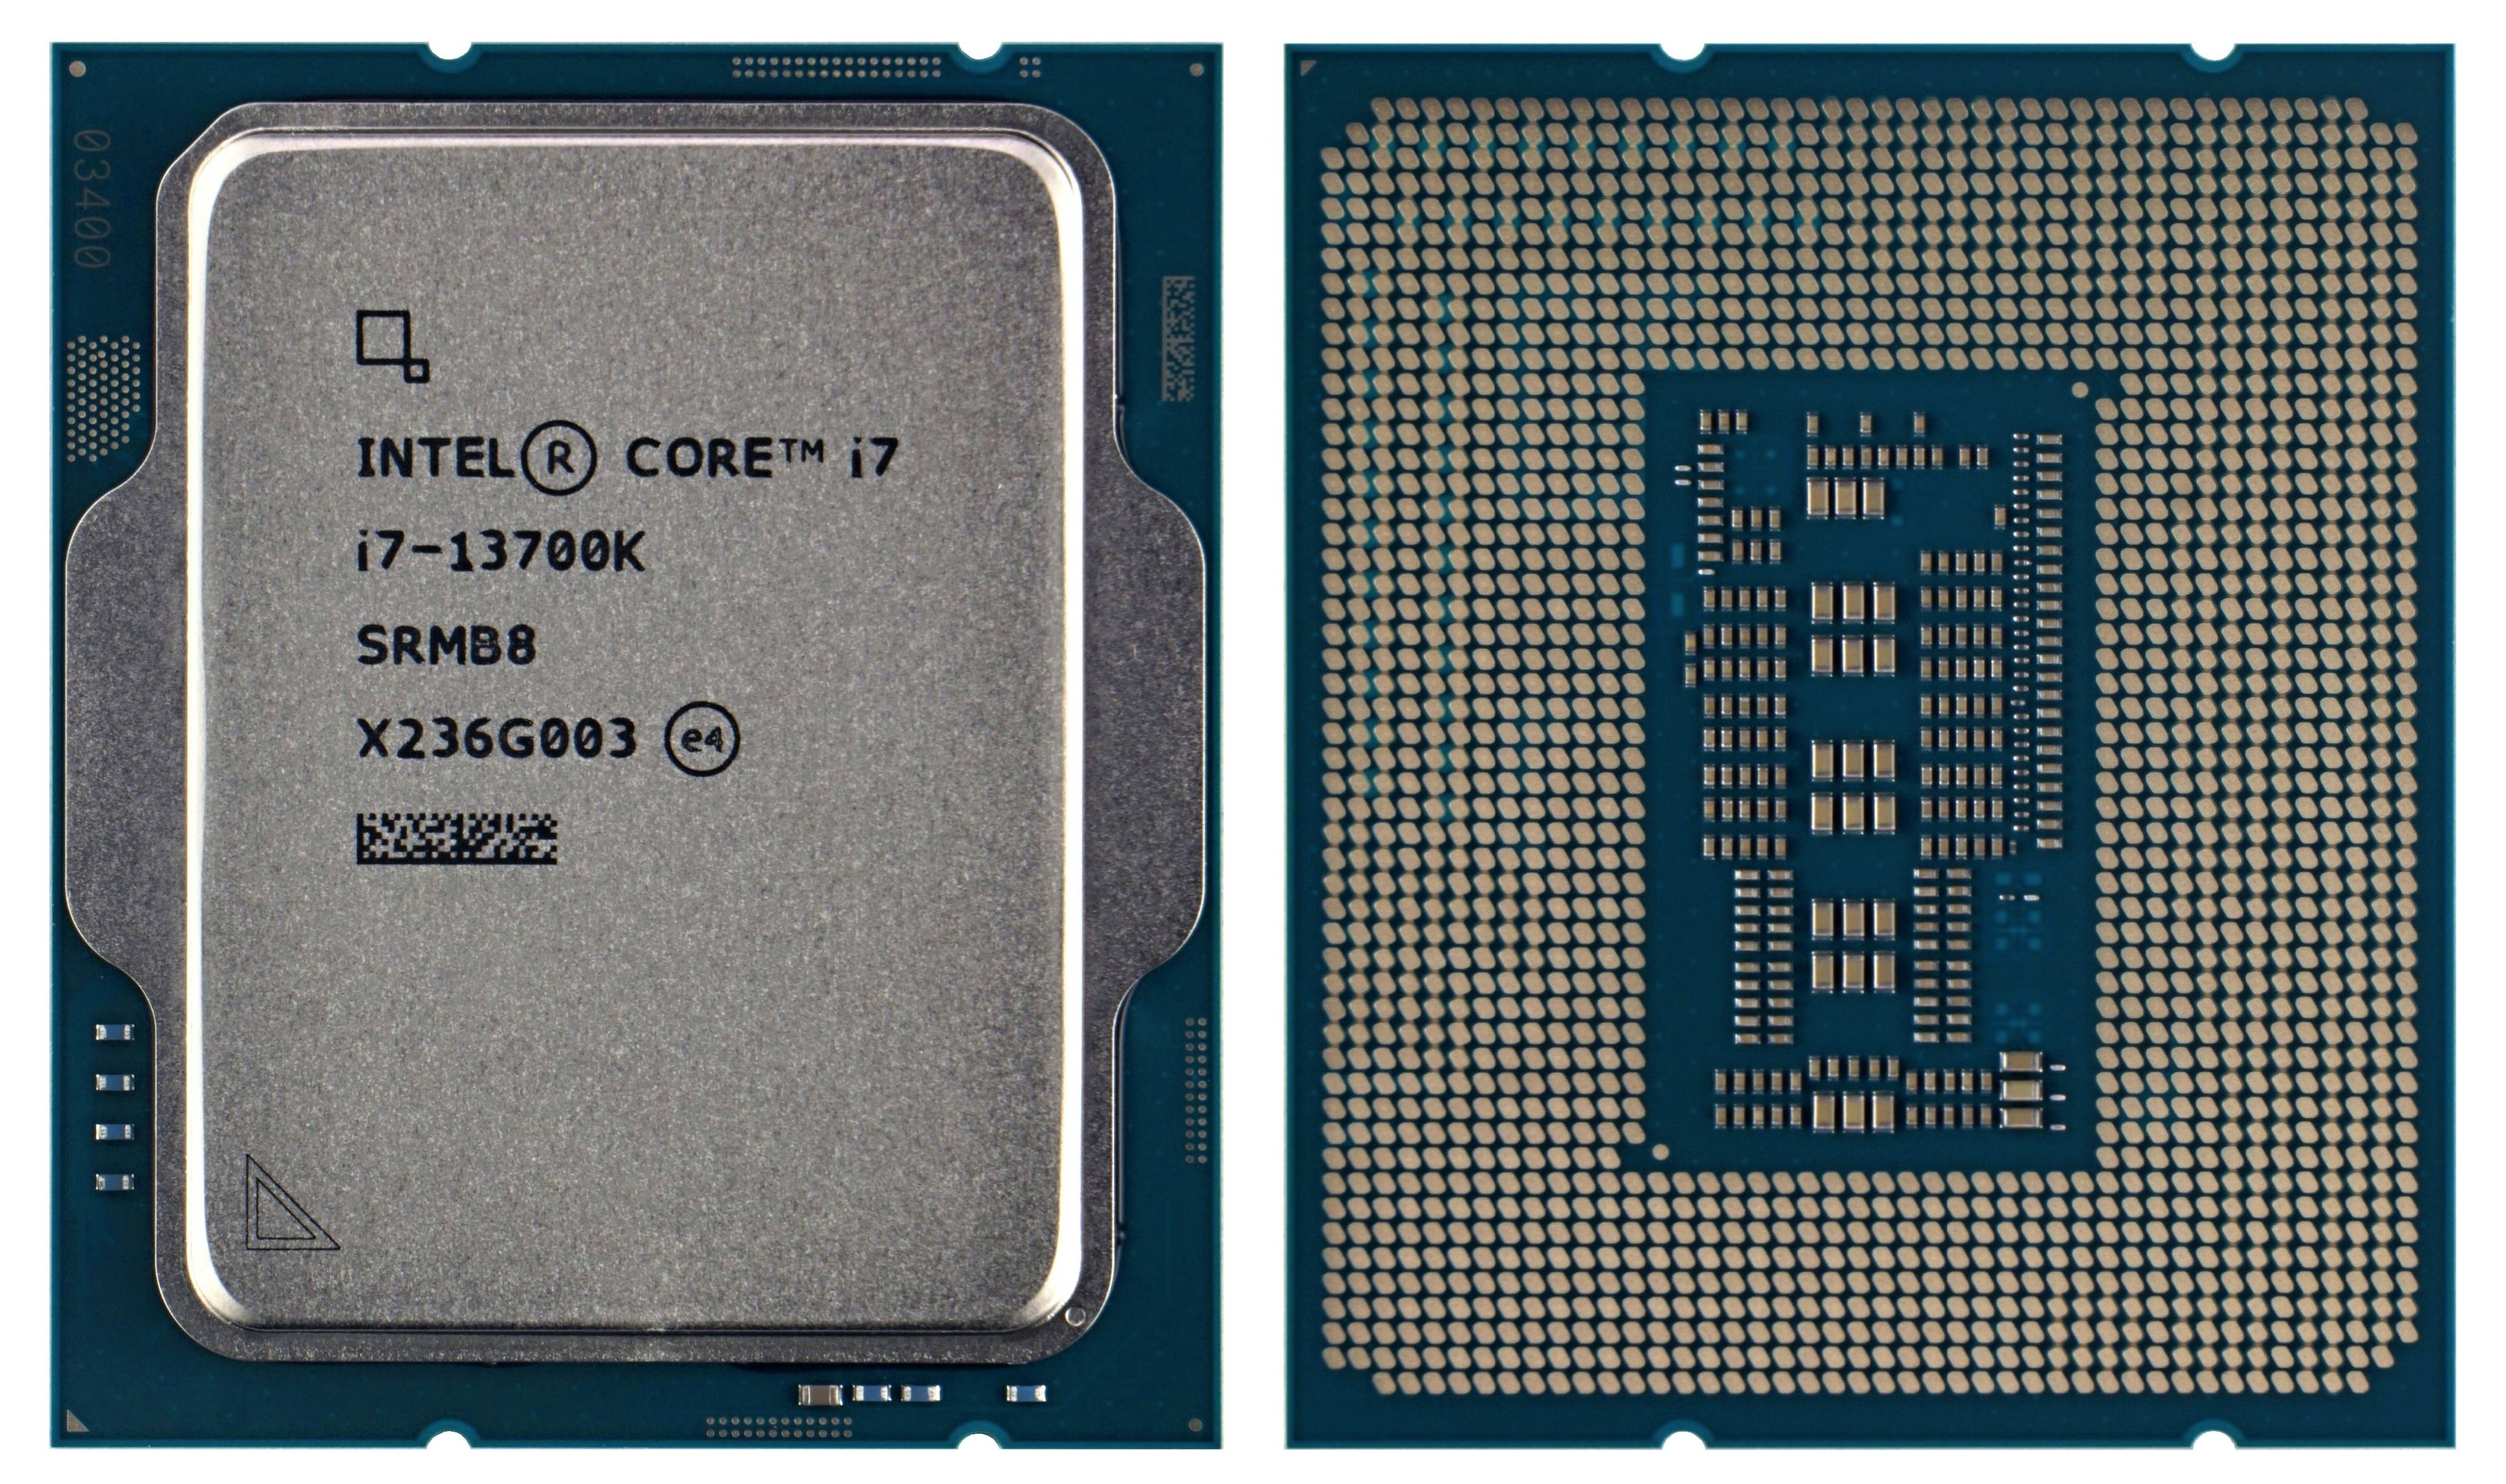
Intel Core i7-13700K in detail
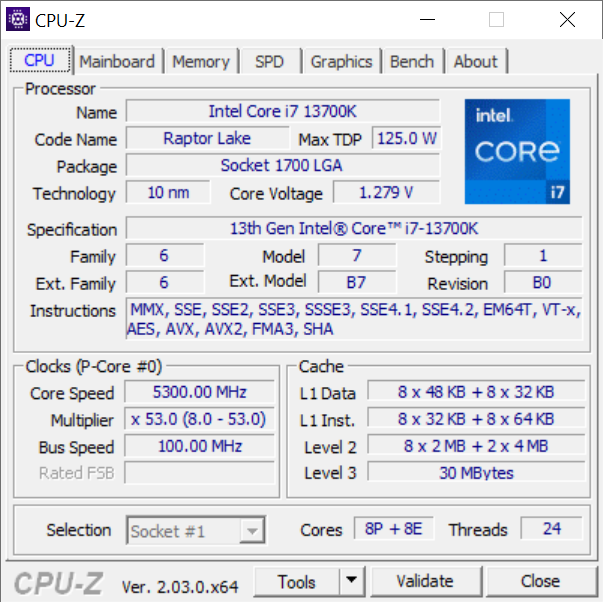
This processor is quite similar to the Core i9-12900K from last generation (Alder Lake). This primarily means that the Core i7-13700K uses eight active P cores (Raptor/Golden Cove) and an equal number of small E cores (Gracemont), which, moreover, support Hyper Threading, so they run in 16 threads.
In total, the Ci7-13700K has 16 cores with 24 threads. The main difference is that the Raptor Lake processor reaches higher clock speeds. Both in an all-core workload (up to 5.3 GHz, i.e. an increase of possibly 400 MHz) and in a single-threaded workload on a single core, or two cores that alternate on this task. There, the Core i9-13700K is 200 MHz faster compared to the Core i9-12900K, as long as this increase is not curbed by the CPU cooler used.
Despite the Ci7-13700K being a more efficient processor than the Ci9-12900K in single-threaded workloads, the 5.4 GHz is less fun to cool (than the 5.2 GHz of Alder Lake). At maximum performance in a multi-threaded workload, the cooling requirements are already comparable, with the difference that due to its higher efficiency, the Core i7-13700K comes out of the pair as the model with the higher computational performance. Not only because of the higher clock speeds on the P cores, but also on the E cores. While with the Ci9-12900K they were below the 4 GHz threshold (up to 3.7 GHz MC and 3.9 GHz SC), with the Core i7-13700K they are already beyond it – 4.2 GHz in boosts of all cores and of one (in single-threaded applications). Naturally, though, this applies to settings that consume more than the TDP (125 W).
Also one of the inter-generational changes is a slight increase in the power limit (PL2) from 241 W to 253 W. And although manufacturers tend not to observe it either (and exceed it, especially in the factory settings of Z790s boards with robust power delivery), the Core i7-13700K practically does not exceed it, unlike other processors (even from the Raptor Lake generation, for example, in the form of Ci9-13900K). Depending on the motherboard used, however, this can naturally vary a bit. Anyway, even with unlimited power supply, the Core i7-13700K will be quite close to PL2 values.
And lastly, a few design differences from the Core i9-12900K: The Core i7-13700K processor has a larger L2 cache. Instead of 1.25 MB per core (Ci9-12900K), it’s now 2 MB per core, but the IPC (performance per clock) are very similar on average. Whether the performance in a particular application swings from this average to the minus or to the plus depends on whether the task can take advantage of the larger L2 cache capacity or is instead “hurt” by higher latency.
Also worth noting is the roughly 23 % larger die area of Raptor Lake processors. The integrated graphics core of the Ci7-13700K is the same as that of the Ci9-12900K, the Intel UHD 770 with 32 EU.
| Manufacturer | Intel | AMD | |
| Line | Core i7 | Ryzen 9 | |
| SKU | 13700K | 7900X | |
| Codename | Raptor Lake | Raphael | |
| CPU microarchitecture | Golden Cove (P) + Gracemont (E) | Zen 4 | |
| Manufacturing node | 7 nm („Intel 7 Ultra“) | 5 nm + 6 nm | |
| Socket | LGA 1700 | AM5 | |
| Launch date | 10/20/2022 | 09/26/2022 | |
| Launch price | 409 USD | 549 USD | |
| Core count | 8+8 | 12 | |
| Thread count | 24 | 24 | |
| Base frequency | 3.4 GHz (P)/2.5 GHz (E) | 4.7 GHz | |
| Max. Boost (1 core) | 5.4 GHz (P)/4.2 GHz (E) | 5.6 GHz (5.75 GHz unofficially) | |
| Max. boost (all-core) | 5.3 GHz (P)/4.2 GHz (E) | N/A | |
| Typ boostu | TBM 3.0 | PB 2.0 | |
| L1i cache | 32 kB/core (P), 64 kB/core (E) | 32 kB/core | |
| L1d cache | 48 kB/core (P), 32 kB/core (E) | 32 kB/core | |
| L2 cache | 2 MB/core (P), 2× 4 MB/4 cores (E) | 1 MB/core | |
| L3 cache | 1× 30 MB | 2× 32 MB | |
| TDP | 125 W | 170 W | |
| Max. power draw during boost | 253 W (PL2) | 230 W (PPT) | |
| Overclocking support | Yes | Yes | |
| Memory (RAM) support | DDR5-5600/DDR4-3200 | DDR5-5200 | |
| Memory channel count | 2× 64 bit | 2× 64 bit | |
| RAM bandwidth | 89,6 GB/s/51,2 GB/s | 83.2 GB/s | |
| ECC RAM support | Yes (with vPro/W680) | Yes (depends on motherboard support) | |
| PCI Express support | 5.0/4.0 | 5.0 | |
| PCI Express lanes | ×16 (5.0) + ×4 (4.0) | ×16 + ×4 + ×4 | |
| Chipset downlink | DMI 4.0 ×8 | PCIe 4.0 ×4 | |
| Chipset downlink bandwidth | 16.0 GB/s duplex | 8.0 GB/s duplex | |
| BCLK | 100 MHz | 100 MHz | |
| Die size | ~257 mm² | 2× 66,3 mm² + 118 mm² | |
| Transistor count | ? bn. | 2× 6,57 + 3,37 bn. | |
| TIM used under IHS | Solder | Solder | |
| Boxed cooler in package | No | No | |
| Instruction set extensions | SSE4.2, AVX2, FMA, SHA, VNNI (256-bit), GNA 3.0, VAES (256-bit), vPro | SSE4.2, AVX2, FMA, SHA, VAES (256-bit), AVX-512, VNNI | |
| Virtualization | VT-x, VT-d, EPT | AMD-V, IOMMU, NPT | |
| Integrated GPU | UHD 770 | AMD Radeon | |
| GPU architecture | Xe LP (Gen. 12) | RDNA 2 | |
| GPU: shader count | 256 | 128 | |
| GPU: TMU count | 16 | 8 | |
| GPU: ROP count | 8 | 4 | |
| GPU frequency | 300–1600 MHz | 400–2200 MHz | |
| Display outputs | DP 1.4a, HDMI 2.1 | DP 2.0, HDMI 2.1 | |
| Max. resolution | 7680 × 4320 (60 Hz) | 3840 × 2160 px (60 Hz) | |
| HW video encode | HEVC, VP9 | HEVC, VP9 | |
| HW video decode | AV1, HEVC, VP9 | AV1, HEVC, VP9 |