


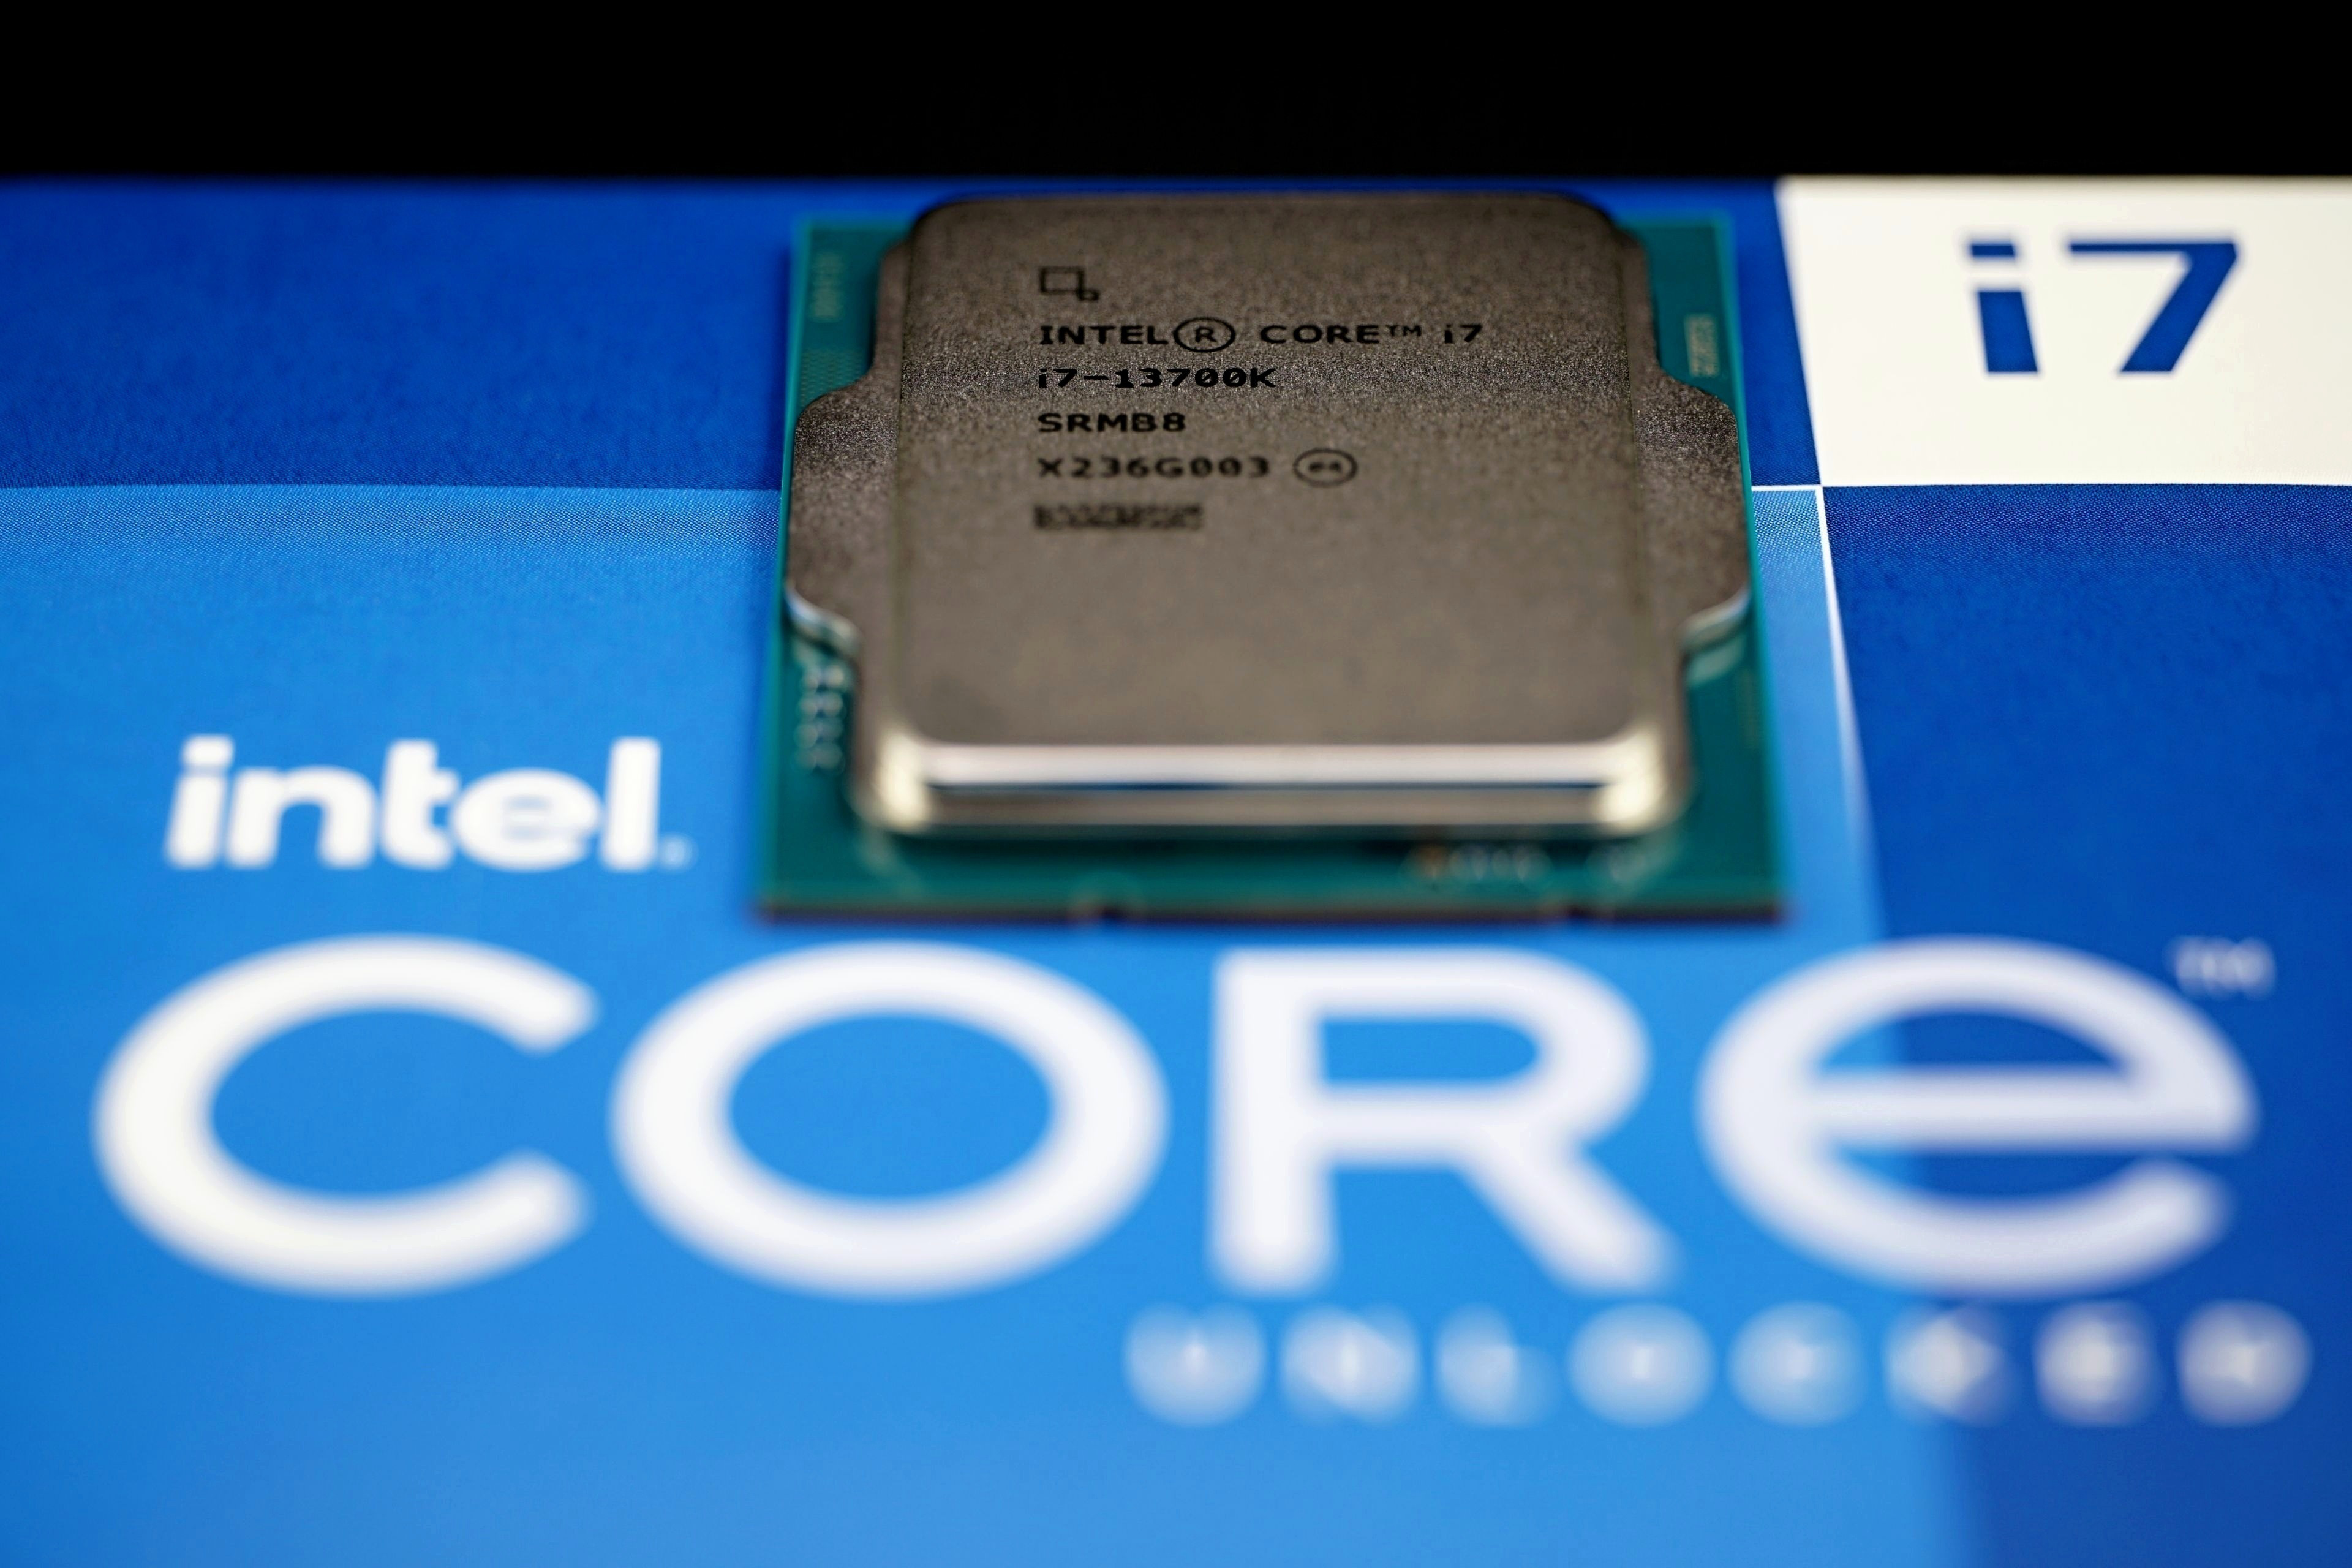
Intel Core i7-13700K in detail”]The sixteen-core desktop Raptor Lake (Ci7-13700K) is a curious compromise between Core i9 (13900K) and Core i5 (13600K). Compared to the Core i5, it is significantly faster thanks to higher clock speeds and Turbo Boost 3.0 support, and it doesn’t lose much performance compared to Core i9 in lighter workloads, including gaming, but it is significantly more power-efficient. If it isn’t the most efficient processor that is this powerful (and that’s the R7 7700X, which we’ ll see about…), it’s the second at worst.
Affinity Photo (benchmark)
Test environment: built-in benchmark.
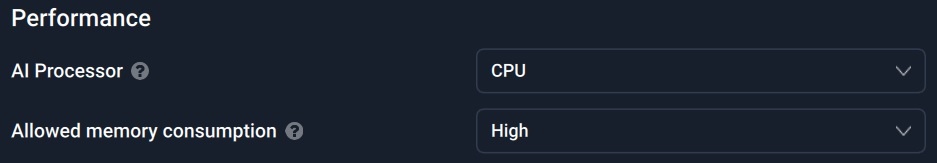
Topaz Labs AI apps
Topaz DeNoise AI, Gigapixel AI and Sharpen AI. These single-purpose applications are used for restoration of low-quality photos. Whether it is high noise (caused by higher ISO), raster level (typically after cropping) or when something needs extra focus. The AI performance is always used.
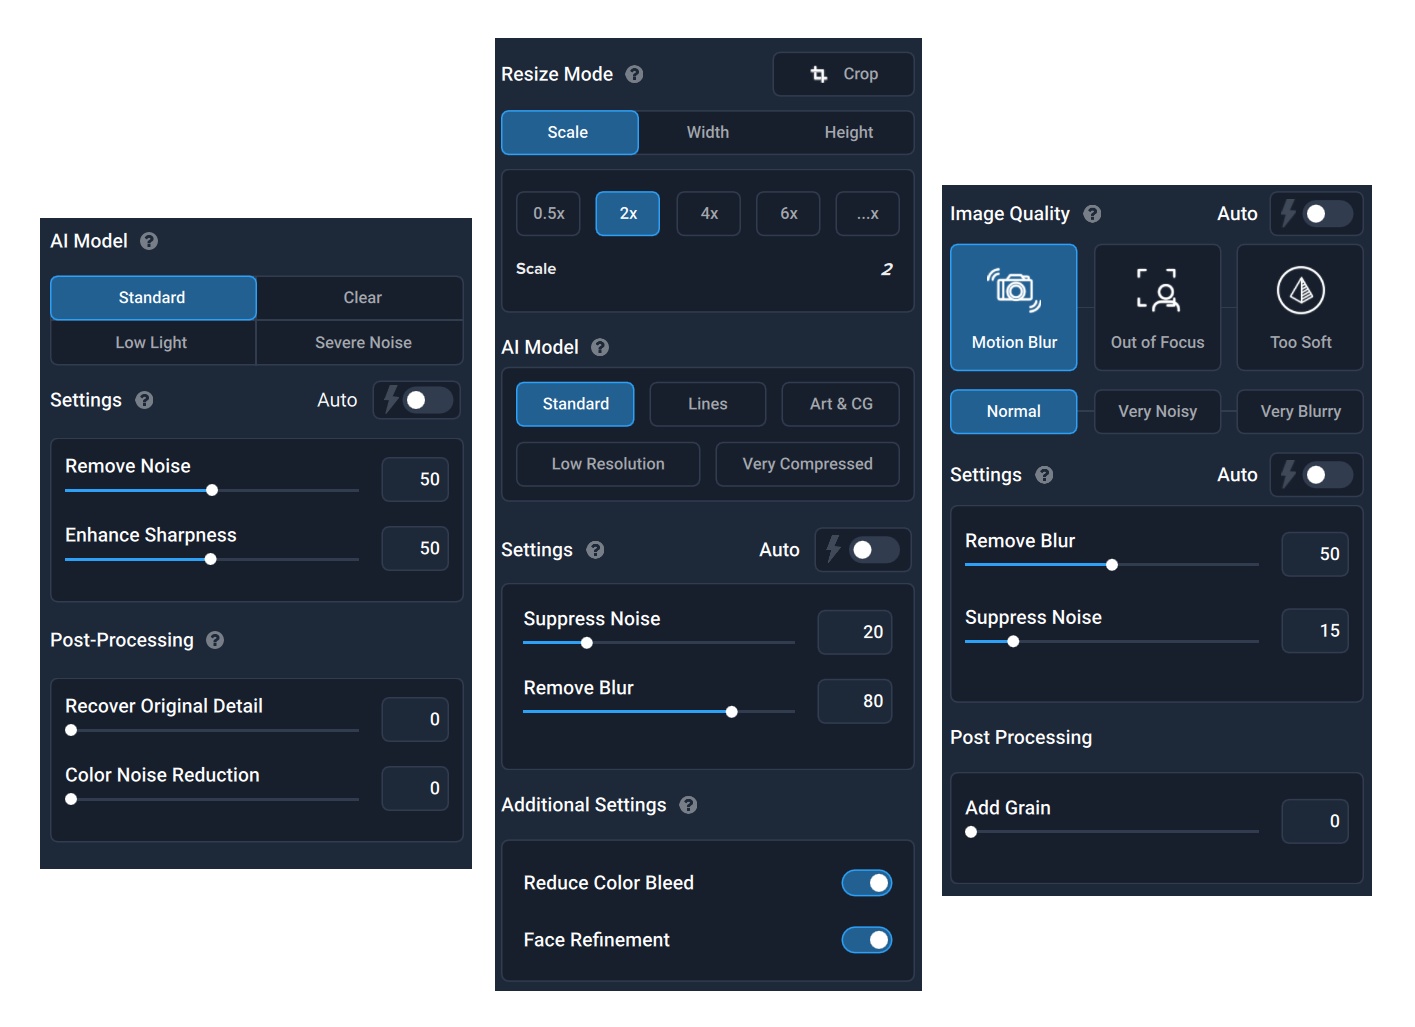
Test environment: As part of batch editing, 42 photos with a lower resolution of 1920 × 1280 px are processed, with the settings from the images above. DeNoise AI is in version 3.1.2, Gigapixel in 5.5.2 and Sharpen AI in 3.1.2.
XnViewMP

Test environment: XnViewMP is finally a photo-editor for which you don’t have to pay. At the same time, it uses hardware very efficiently. In order to achieve more reasonable comparison times, we had to create an archive of up to 1024 photos, where we reduce the original resolution of 5472 × 3648 px to 1980 × 1280 px and filters with automatic contrast enhancement and noise reduction are also being applied during this process. We use 64-bit portable version 0.98.4.
Zoner Photo Studio X
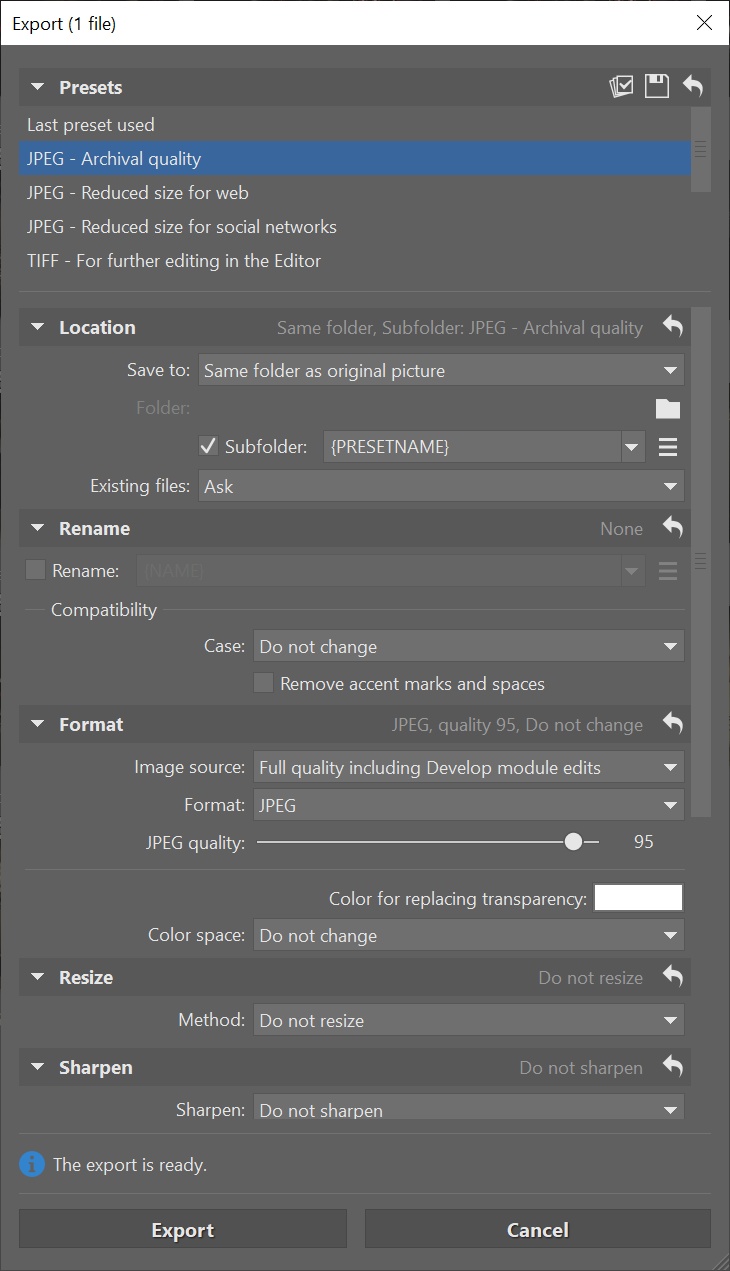
Test environment: In Zoner Photo Studio X we convert 42 .CR2 (RAW Canon) photos to JPEG while keeping the original resolution (5472 × 3648 px) at the lowest possible compression, with the ZPS X profile ”high quality for archival”.


