


Measuring the same value twice in a row is difficult
In our tests, you will increasingly encounter measurements of the “frequency response” of the sound of PC components. These are useful and rare measurements. As one of our readers has pointed out – for those who can read spectrographs, they are a gem. It’s worse if you don’t understand them. Then they won’t tell you much, and that’s a shame if you also care about the exact “noise” value of computer components, or their sound expression.
Measuring the same value twice in a row is difficult
If you hold your breath while measuring the noise level with a standard sound level meter, you’ll go crazy when measuring the frequency response. It is not at all easy to measure the same values of the same sound repeatedly. Purposely choose a constant sound source and record its frequency response several times during the day. All you need is a regular microphone and one octave, which is available in the free version of TrueRTA (you can download it here).
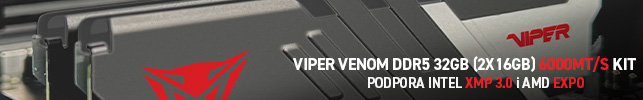
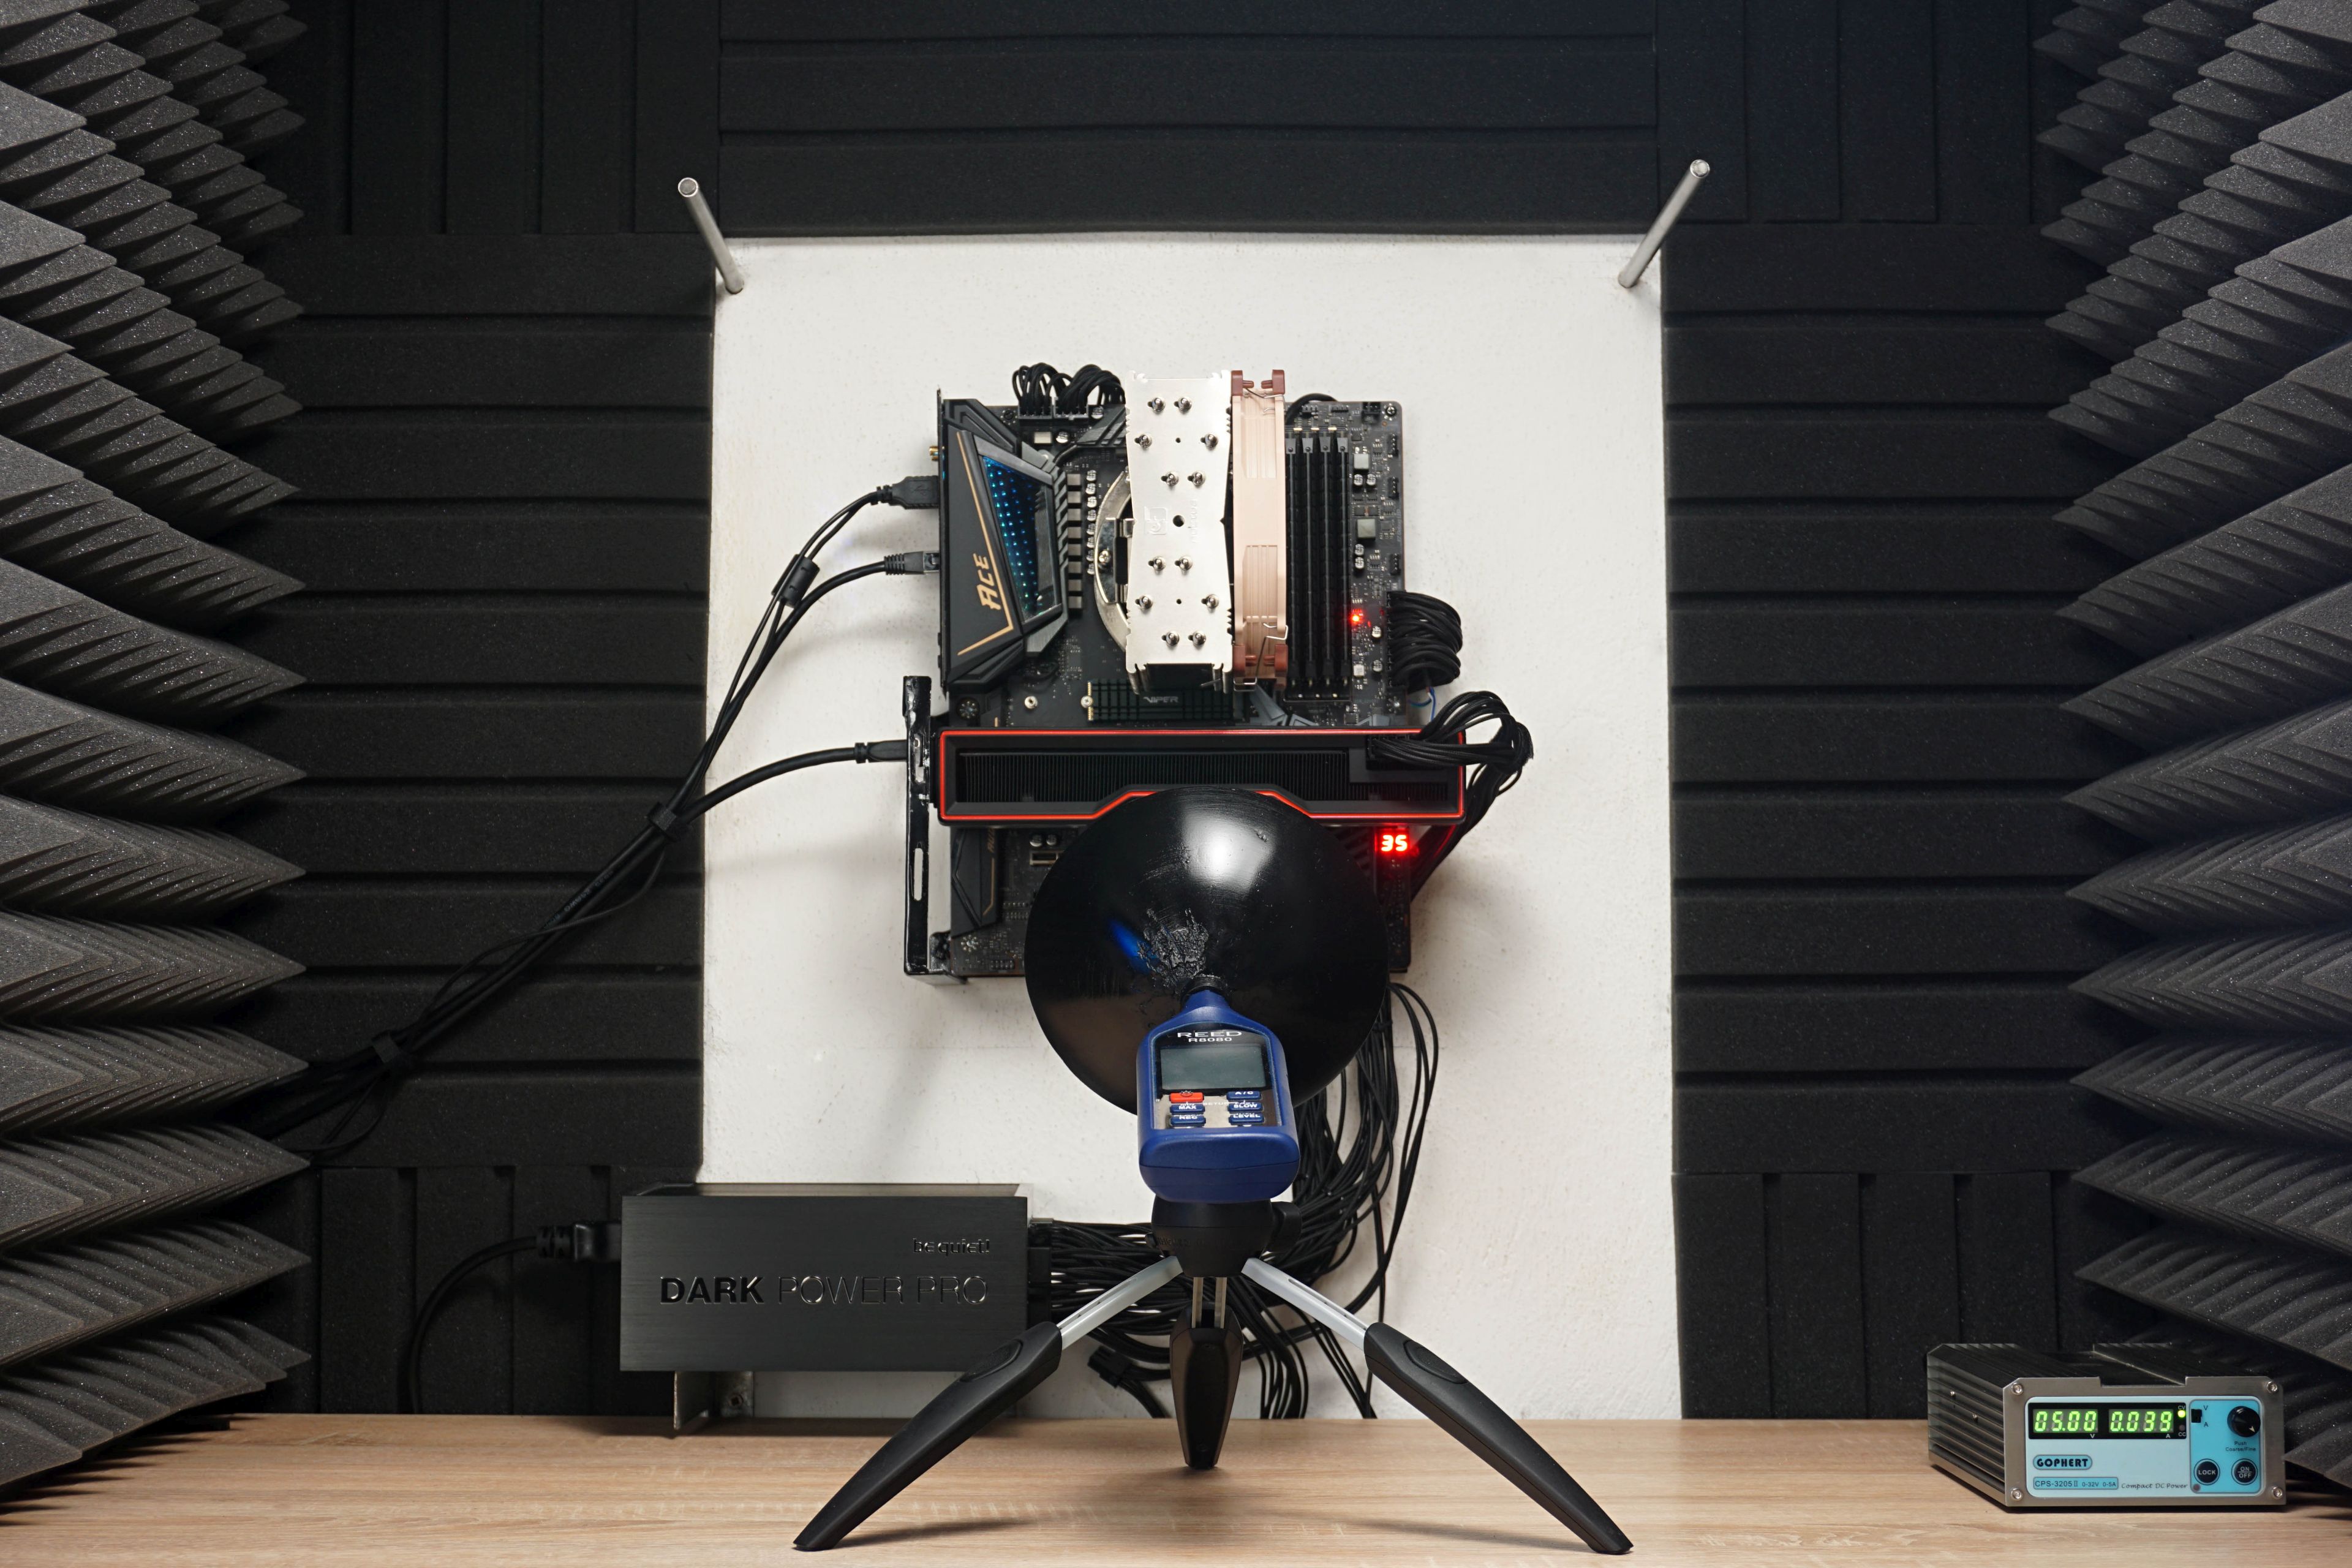
You can’t easily get completely identical graphs across measurements, and we were frustrated by that too. However, with the help of various gimmicks, we reached a very small, negligible measurement error, which fits below 2%. It is important to create completely identical conditions here, in which only the sound of the measured device changes. Around the test rig, we had to place acoustic panels from three sides (from the sides and above), which prevent the sound from bouncing differently into the microphone sensor. Whether the sound from the measured device or from the room. After all, it is quite uncomfortable to commit that nothing will change in the testlab dispositionally just because it would have a negative effect on the accuracy of the measurements.
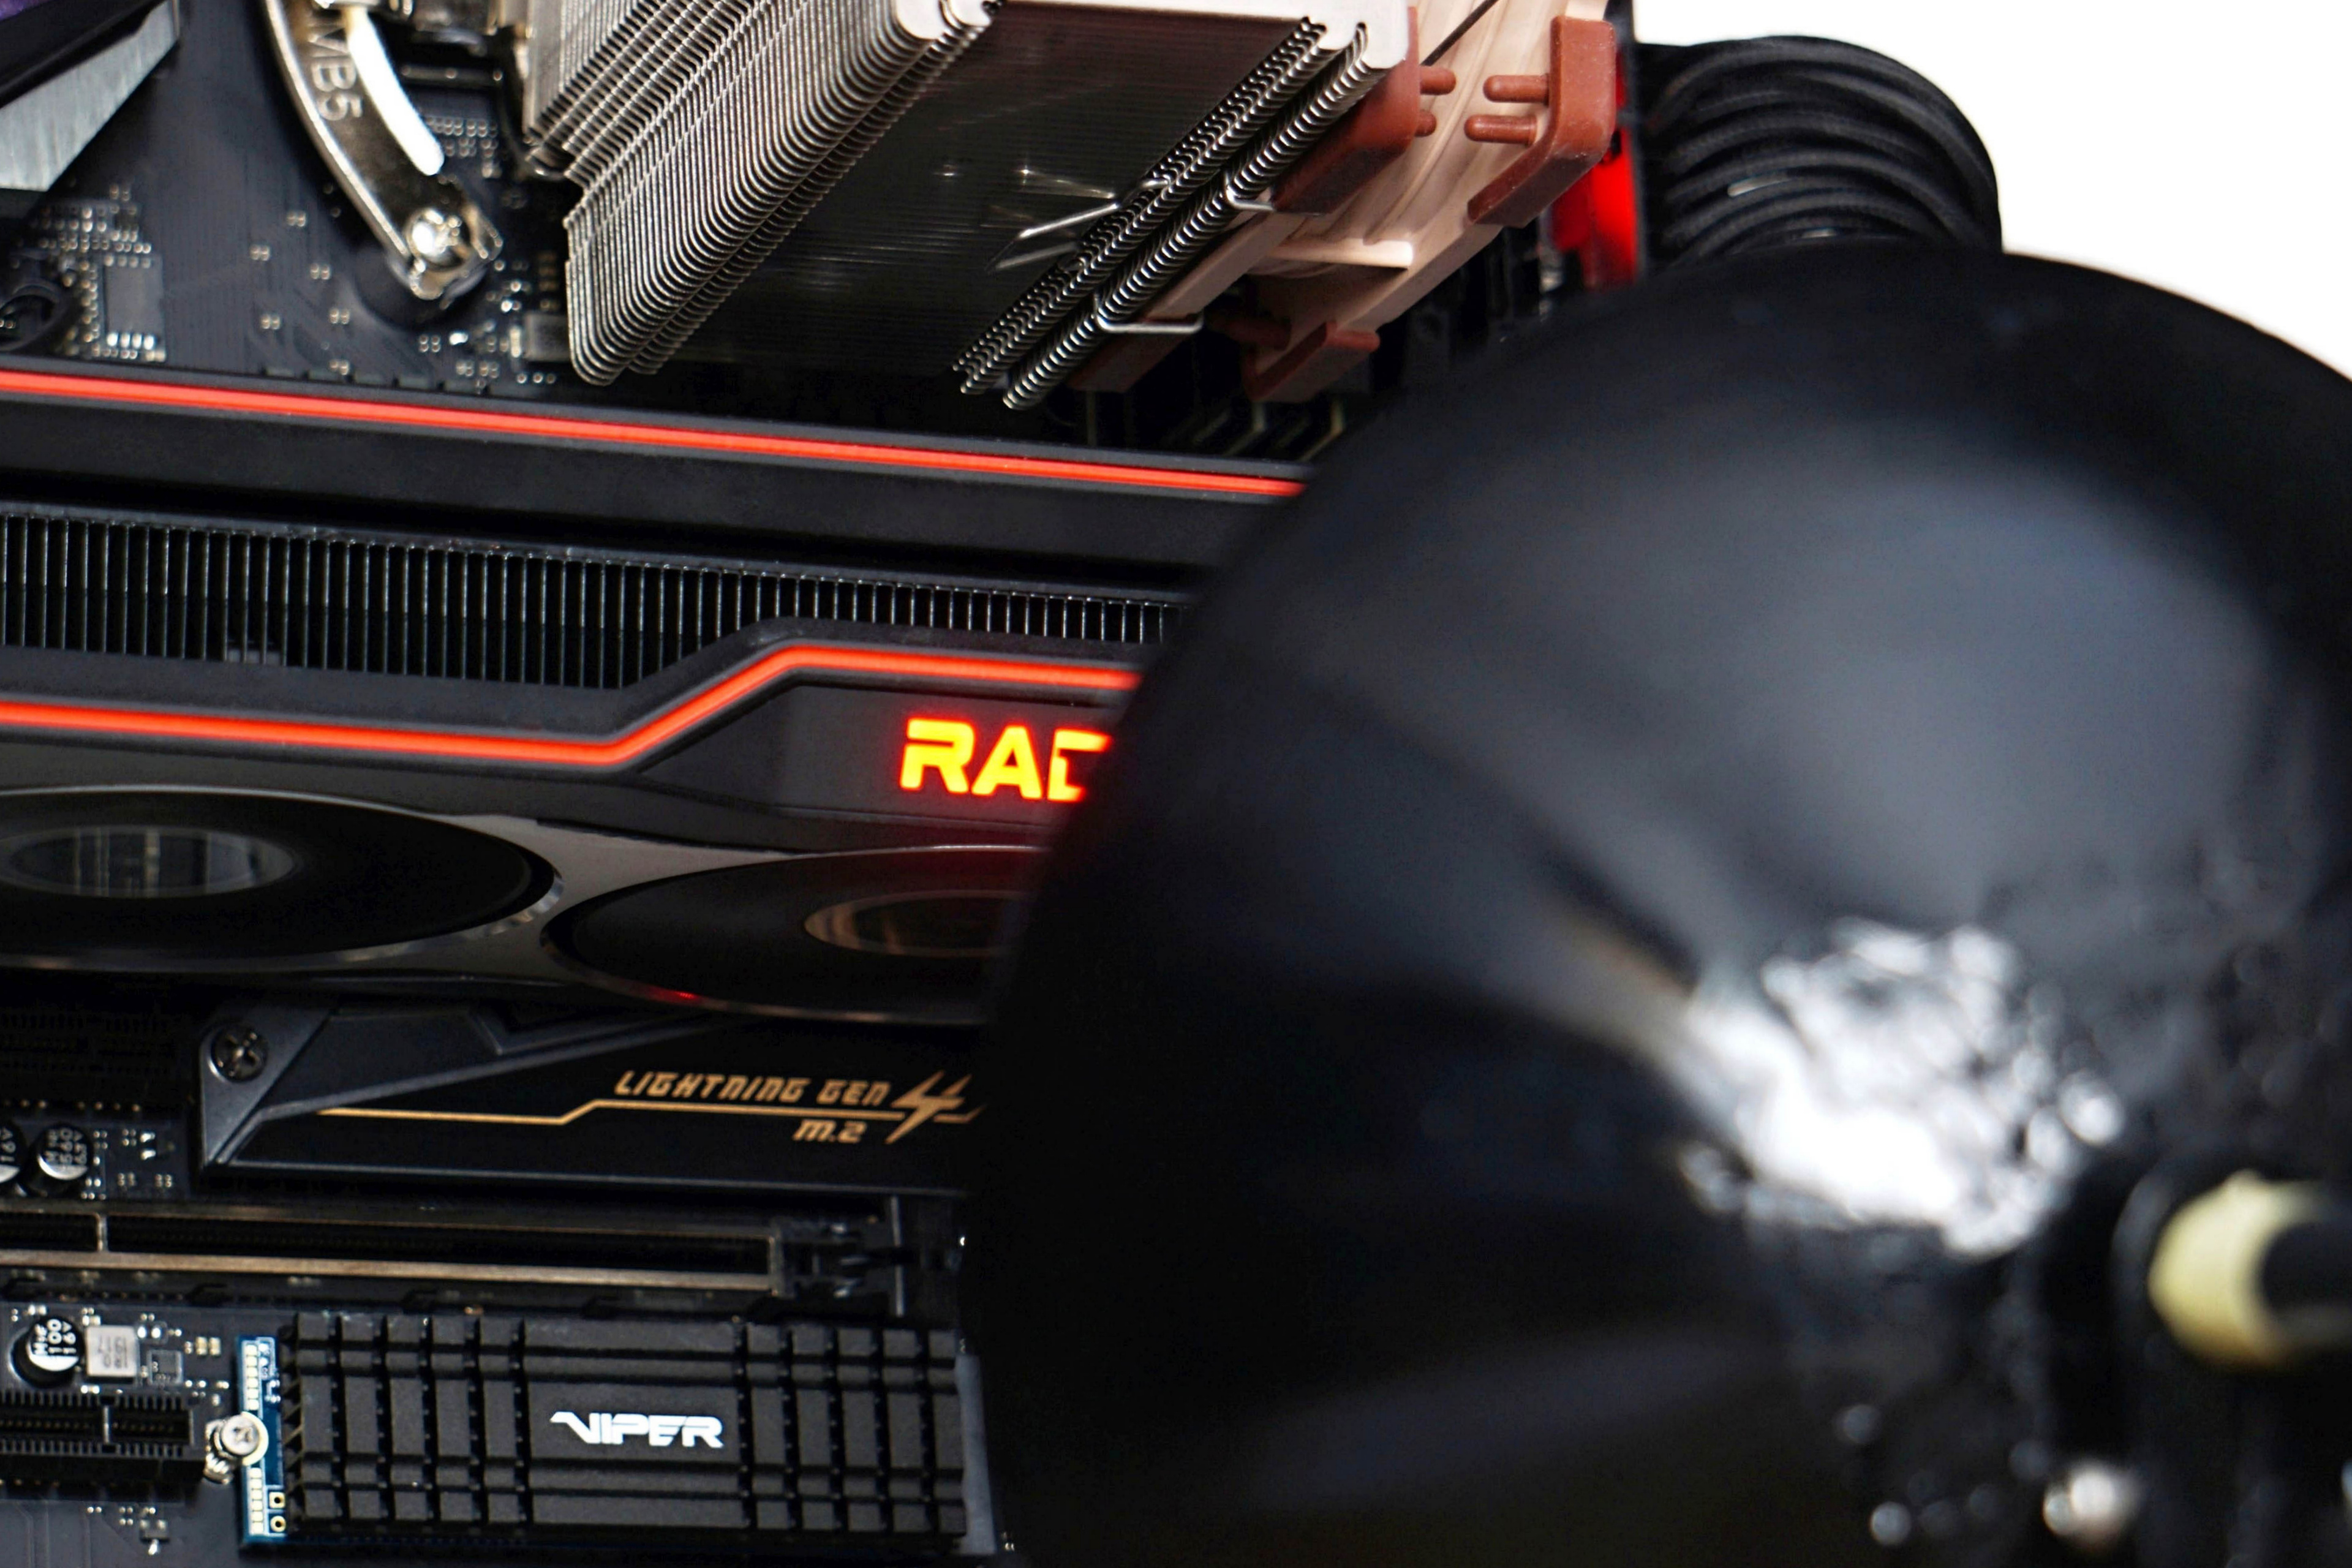
There is then a parabola-shaped collar around the sensor, one of the tasks of which is to amplify the measured values. This makes it possible to distinguish even really quiet frequencies and also so that the spurious tones coming from behind are bounced outside the sensor. Thus, for example, the breathing, which I unfortunately cannot avoid, is possible to filter out in this way.
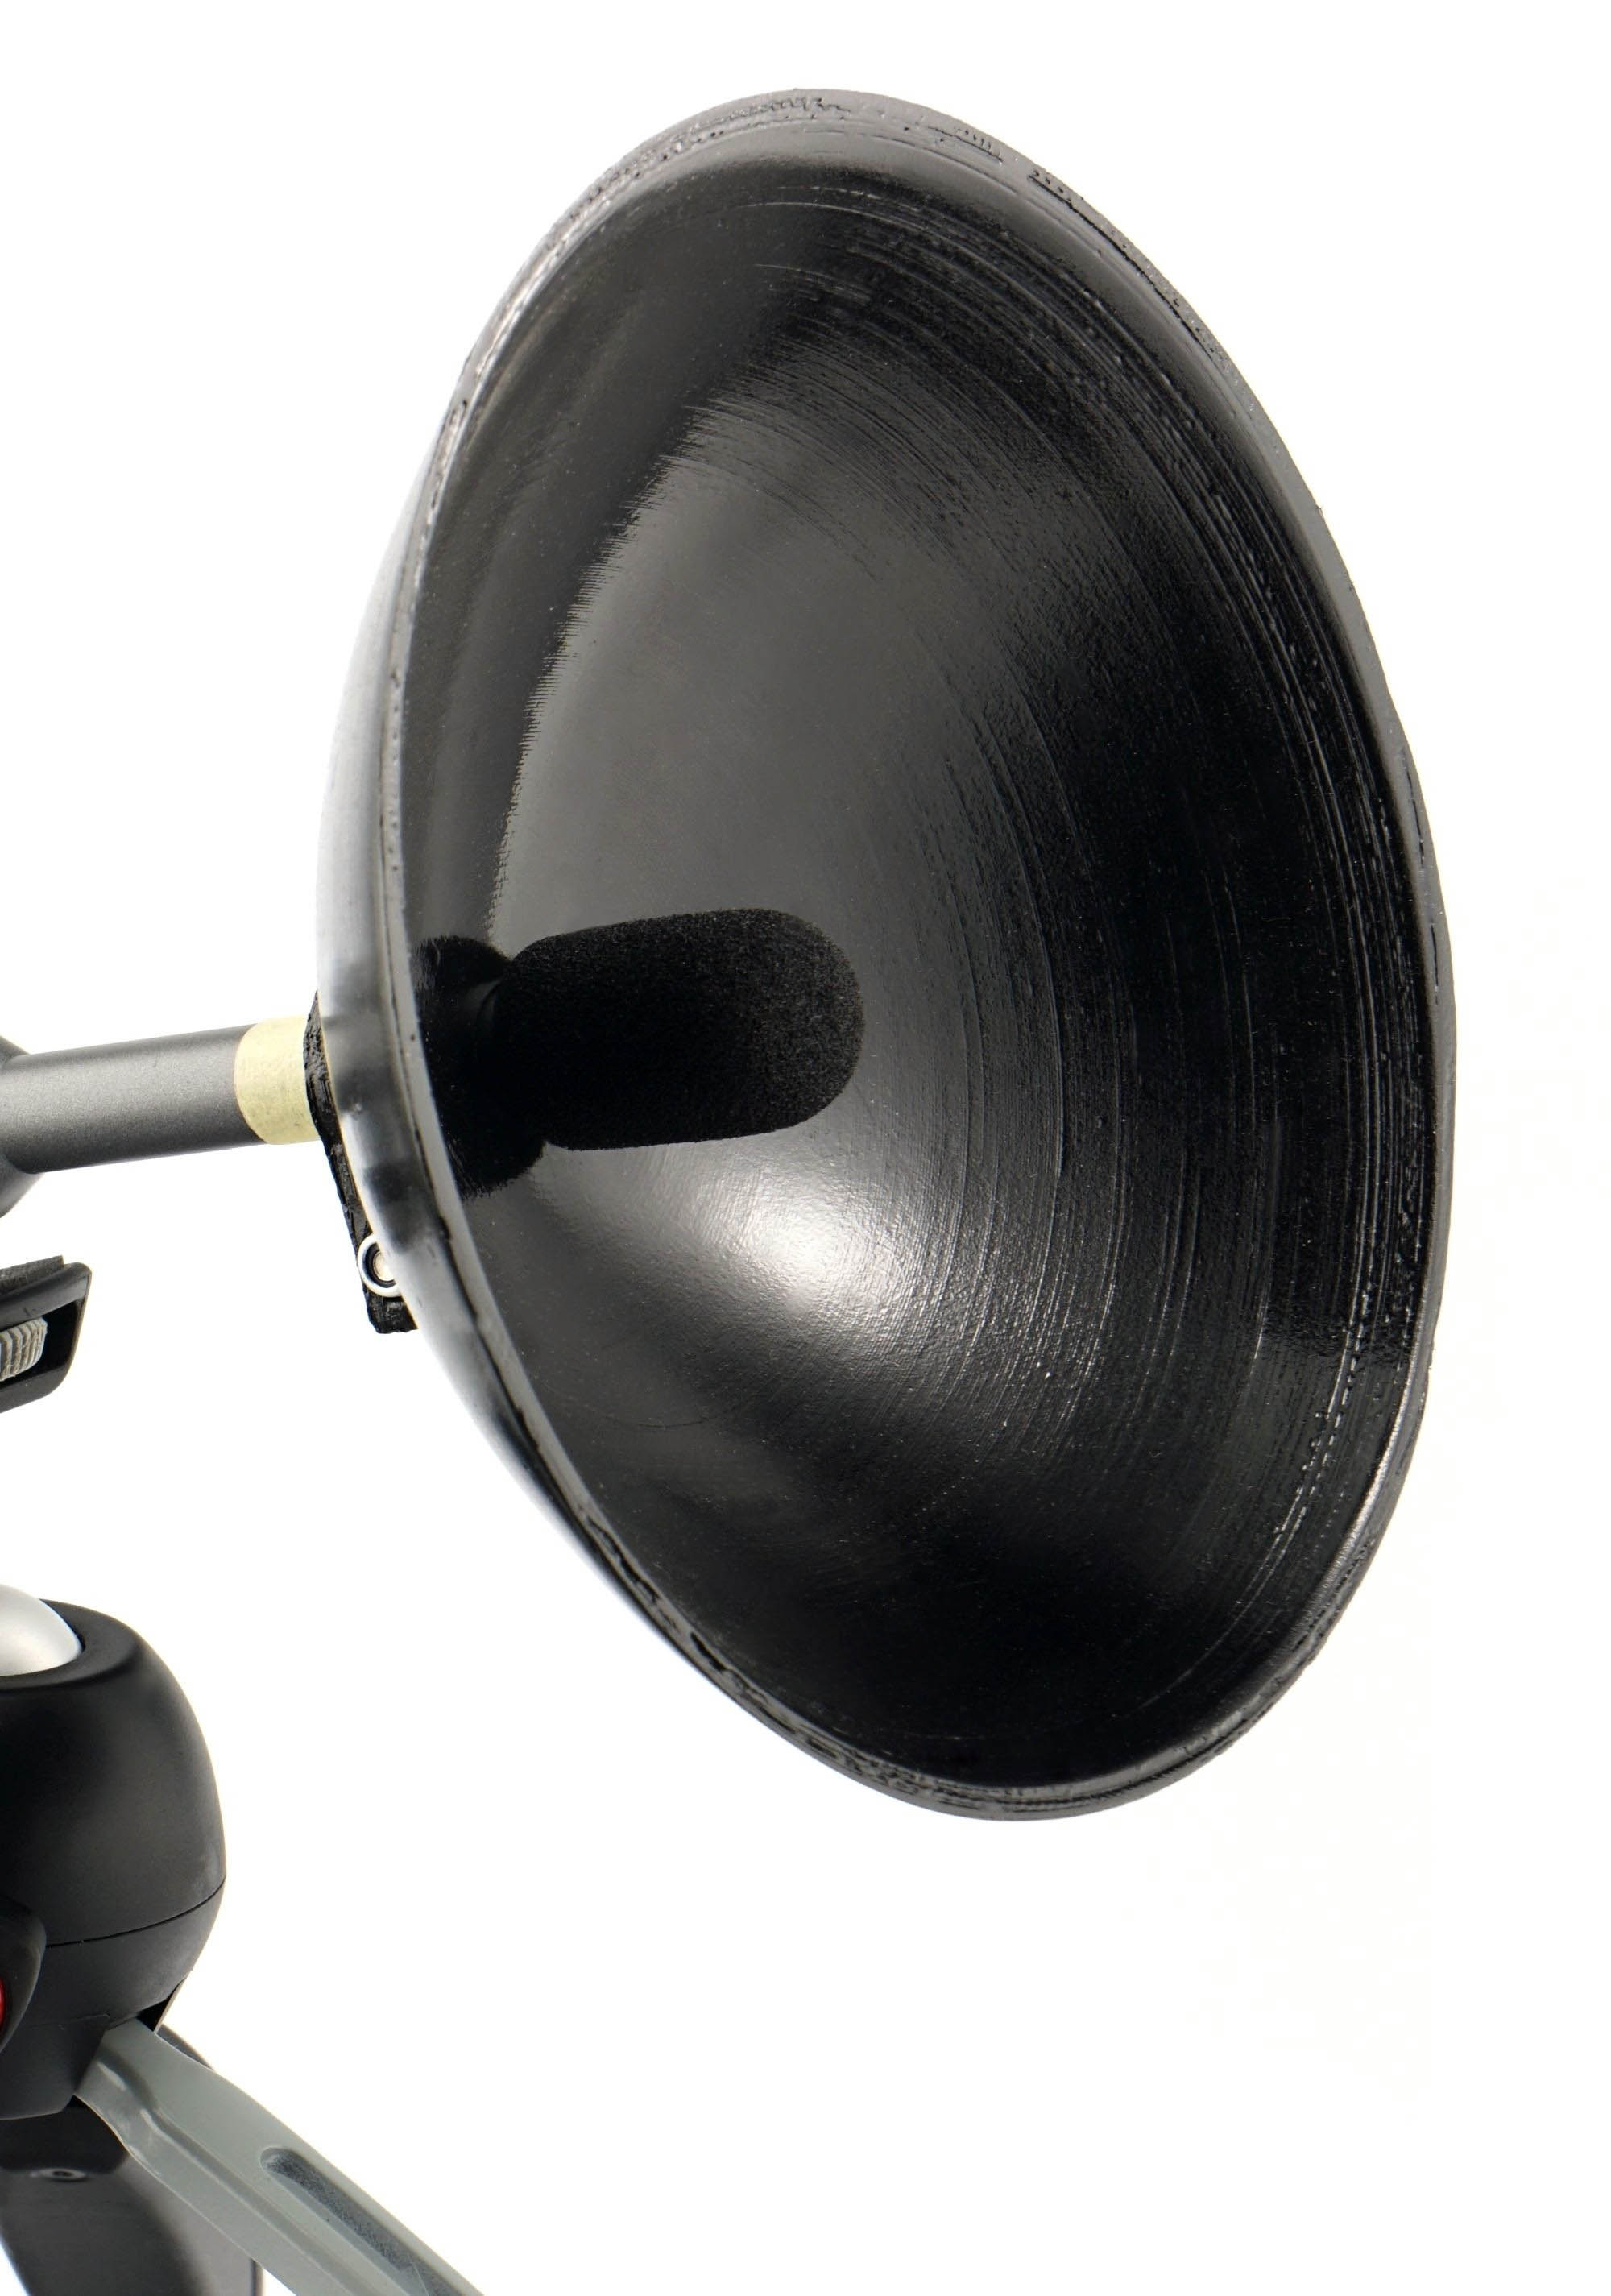
The same mutual distances of the microphone from the measured device, the scanning angle (15°) are always important, too. We always set the angle exactly with the inclinometer. The fixed distance is indicated by the marks for the tripod legs.
Of course, the key is to filter out all spurious frequencies that do not relate to the device being measured (such as a graphics card), so this requires passive operation of other components, while the results may be distorted by whistling coils on the motherboard or the power supply. However, we managed to eliminate all this. We will also state the intensity of the dominant frequencies. Again, in three bandwidths of low (20–200 Hz), mid (201–2,000 Hz) and high (2,001–20,000 Hz) tones. The last test of graphics cards already includes this methodology and new results will snowball with each new test.
| Graphics card | Dominant sound freq. and noise level in SOTTR@2160p | NF-F12 PWM | NF-A15 PWM | ||||
| Low range | Mid range | High range | |||||
| Frequency [Hz] | Noise level [dBu] | Frequency [Hz] | Noise level [dBu] | Frequency [Hz] | Noise level [dBu] | ||
| AMD Radeon RX 6800 XT | Ložisko | 100,794 | -73,170 | 1107,887 | -75,262 | 10848,902 | -75,397 |
| Asus TUF RTX 3080 O10G Gaming | Výška (bez ventilátoru) | 100,794 | -75,410 | 1076,347 | -72,321 | 7240,773 | -74,199 |
| AMD Radeon RX 6800 | 100,794 | -71,603 | 1140,350 | -67,765 | 9665,273 | -80,642 |
Maybe you are interested in one more thing that has not been said in the text so far. Namely, at which point we read the values that are inserted into the tables. Of course, the noise level of graphics cards changes over time according to the load. Therefore, the measured values are based on the average of the last 100 samples, which have a more or less stable form. We always read this data just before the end of the test scenes in games F1 2020, Shadow of the Tomb Raider, CS:GO and apps Blender (Cycles), Classroom. Then the fan speed is already stable and no longer increases.
So ladies and gentlemen, don’t believe in one value measured by a sound level meter so much. It’s enough for a rough orientation and an idea of how noisy a particular component is, but you will have to study its frequency analysis for accurate sound. However, you will receive all the materials for studying these properties from us. Even in the tests of coolers and measurement of the frequency response of sound, you will of course soon find in in the fan tests, which we can no longer wait for ourselves and we believe that you feel the same way.
I apologize for the potential inaccuracy of expression and incorrect terminology or imperfect technical implementation of some aspects to all sound engineers and people more erudite in acoustics than I am (I certainly do not consider myself a sound master 🙂 ). The aim of this all was to achieve the highest possible sound distinction and satisfactory repeatability of measurements with the least possible error. In addition, it was all aimed at ensuring that the results were of relevant quality, which was successful.
- Contents
- How to read spectrographs and tables correctly
- Measuring the same value twice in a row is difficult


I’ve been playing around with spectral analysis app on my phone to estimate RPM of various fans, by checking frequency peaks and calculate RPM via the formula RPM ≈ sound frequency of strongest peak/number of blades*60. From PC fans to floor fans, estimation by this method seem reasonably accurate.
So the first question, how accurate is this actually? What are some factors that will make it deviate from the actual RPM as measured by laser tachometers?
Going through multiple fan reviews, it is clear to me that one of the things that separates the best fans from the average fan is the supression of tonal peaks, and these peaks most often correspond to the blade pass frequency. I bet it’ll be near impossible to estimate RPM of the A12x25 using the frequency method…
Next is an observation and suggestion to potential improvement of frequency analysis. Both by observing the app and by my ear, some very cheap 140 mm fans I have not only have an annoying whine, but they also fluctuate in intensity, especially apparent at certain speeds. The sound comes in waves which is extremely annoying compared to a static noise level. It’s also apparent on noise samples of the Arctic P12/P14 I can find online, for example in this video (https://www.youtube.com/watch?v=nt8Ao4GDmzY).
I wonder if this is something that you can capture in the frequency analysis plots. I am sure it’s also something that separates the best fans from the others, but is barely mentioned in any reviews. If I understand the charts correctly, HW busters have been doing this since this August, so it might be something worth looking into.
P.S. I have come across a paper that describes and investigates this phenomenon (https://www.mb.uni-siegen.de/iftsm/forschung/veroeffentlichungen_pdf/136_2014.pdf), which you may find interesting.
To tell you the truth, we have not dealt with this issue too much. I consider the measurement of rpm with a laser tachometer to be sufficiently accurate. Anyway, the things you describe seem to be really interesting from a scientific point of view. I’ll definitely study the PDF in my spare time, thanks for the materials! 🙂