


Methodology: performance tests
In the Raptor Lake Refresh generation, Intel has gone a bit harder and increased the clock speeds in the Core i5 class. This has led to higher application and gaming performance, but by pushing the manufacturing process to its limits, power draw has naturally increased, and with it comes poorer efficiency. The latter may not be that important for someone and the main thing is that the processor can be comfortably operated even with a “normal” cooler.
Gaming tests
We test performance in games in four resolutions with different graphics settings. To warm up, there is more or less a theoretical resolution of 1280 × 720 px. We had been tweaking graphics settings for this resolution for a long time. We finally decided to go for the lowest possible (Low, Lowest, Ultra Low, …) settings that a game allows.
One could argue that a processor does not calculate how many objects are drawn in such settings (so-called draw calls). However, with high detail at this very low resolution, there was not much difference in performance compared to FHD (which we also test). On the contrary, the GPU load was clearly higher, and this impractical setting should demonstrate the performance of a processor with the lowest possible participation of a graphics card.
At higher resolutions, high settings (for FHD and QHD) and highest (for UHD) are used. In Full HD it’s usually with Anti-Aliasing turned off, but overall, these are relatively practical settings that are commonly used.

The selection of games was made considering the diversity of genres, player popularity and processor performance requirements. For a complete list, see Chapters 7–16. A built-in benchmark is used when a game has one, otherwise we have created our own scenes, which we always repeat with each processor in the same way. We use OCAT to record fps, or the times of individual frames, from which fps are then calculated, and FLAT to analyze CSV. Both were developed by the author of articles (and videos) from GPUreport.cz. For the highest possible accuracy, all runs are repeated three times and the average values of average and minimum fps are drawn in the graphs. These multiple repetitions also apply to non-gaming tests.
Computing tests
Let’s start lightly with PCMark 10, which tests more than sixty sub-tasks in various applications as part of a complete set of “benchmarks for a modern office”. It then sorts them into fewer thematic categories and for the best possible overview we include the gained points from them in the graphs. Lighter test tasks are also represented by tests in a web browser – Speedometer and Octane. Other tests usually represent higher load or are aimed at advanced users.
We test the 3D rendering performance in Cinebench. In R20, where the results are more widespread, but mainly in R23. Rendering in this version takes longer with each processor, cycles of at least ten minutes. We also test 3D rendering in Blender, with the Cycles render in the BMW and Classroom projects. You can also compare the latter with the test results of graphics cards (contains the same number of tiles).
We test how processors perform in video editing in Adobe Premiere Pro and DaVinci Resolve Studio 17. We use a PugetBench plugin, which deals with all the tasks you may encounter when editing videos. We also use PugetBench services in Adobe After Effects, where the performance of creating graphic effects is tested. Some subtasks use GPU acceleration, but we never turn it off, as no one will do it in practice. Some things don’t even work without GPU acceleration, but on the contrary, it’s interesting to see that the performance in the tasks accelerated by the graphics card also varies as some operations are still serviced by the CPU.

We test video encoding under SVT-AV1, in HandBrake and benchmarks (x264 HD and HWBot x265). x264 HD benchmark works in 32-bit mode (we did not manage to run 64-bit consistently on W10 and in general on newer OS’s it may be unstable and show errors in video). In HandBrake we use the x264 processor encoder for AVC and x265 for HEVC. Detailed settings of individual profiles can be found in the corresponding chapter 25. In addition to video, we also encode audio, where all the details are also stated in the chapter of these tests. Gamers who record their gameplay on video can also have to do with the performance of processor encoders. Therefore, we also test the performance of “processor broadcasting” in two popular applications OBS Studio and Xsplit.
We also have two chapters dedicated to photo editing performance. Adobe has a separate one, where we test Photoshop via PugetBench. However, we do not use PugetBench in Lightroom, because it requires various OS modifications for stable operation, and overall we rather avoided it (due to the higher risk of complications) and create our own test scenes. Both are CPU intensive, whether it’s exporting RAW files to 16-bit TIFF with ProPhotoRGB color space or generating 1:1 thumbnails of 42 lossless CR2 photos.
However, we also have several alternative photo editing applications in which we test CPU performance. These include Affinity Photo, in which we use a built-in benchmark, or XnViewMP for batch photo editing or ZPS X. Of the truly modern ones, there are three Topaz Labz applications that use AI algorithms. DeNoise AI, Gigapixel AI and Sharpen AI. Topaz Labs often and happily compares its results with Adobe applications (Photoshop and Lightroom) and boasts of better results. So we’ll see, maybe we’ll get into it from the image point of view sometime. In processor tests, however, we are primarily focused on performance.

We test compression and decompression performance in WinRAR, 7-Zip and Aida64 (Zlib) benchmarks, decryption in TrueCrypt and Aida64, where in addition to AES there are also SHA3 tests. In Aida64, we also test FPU in the chapter of mathematical calculations. From this category you may also be interested in the results of Stockfish 13 and the number of chess combinations achieved per unit time. We perform many tests that can be included in the category of mathematics in SPECworkstation 3.1. It is a set of professional applications extending to various simulations, such as LAMMPS or NAMD, which are molecular simulators. A detailed description of the tests from SPECworkstation 3.1 can be found at spec.org. We do not test 7-zip, Blender and HandBrake from the list for redundancy, because we test performance in them separately in applications. A detailed listing of SPECWS results usually represents times or fps, but we graph “SPEC ratio”, which represents gained points—higher means better.
Processor settings…
We test processors in the default settings, without active PBO2 (AMD) or ABT (Intel) technologies, but naturally with active XMP 2.0.
… and app updates
The tests should also take into account that, over time, individual updates may affect performance comparisons. Some applications are used in portable versions, which are not updated or can be kept on a stable version, but this is not the case for some others. Typically, games update over time. On the other hand, even intentional obsolescence (and testing something out of date that already behaves differently) would not be entirely the way to go.
In short, just take into account that the accuracy of the results you are comparing decreases a bit over time. To make this analysis easier for you, we indicate when each processor was tested. You can find this in the dialog box, where there is information about the test date of each processor. This dialog box appears in interactive graphs, just hover the mouse cursor over any bar.
- Contents
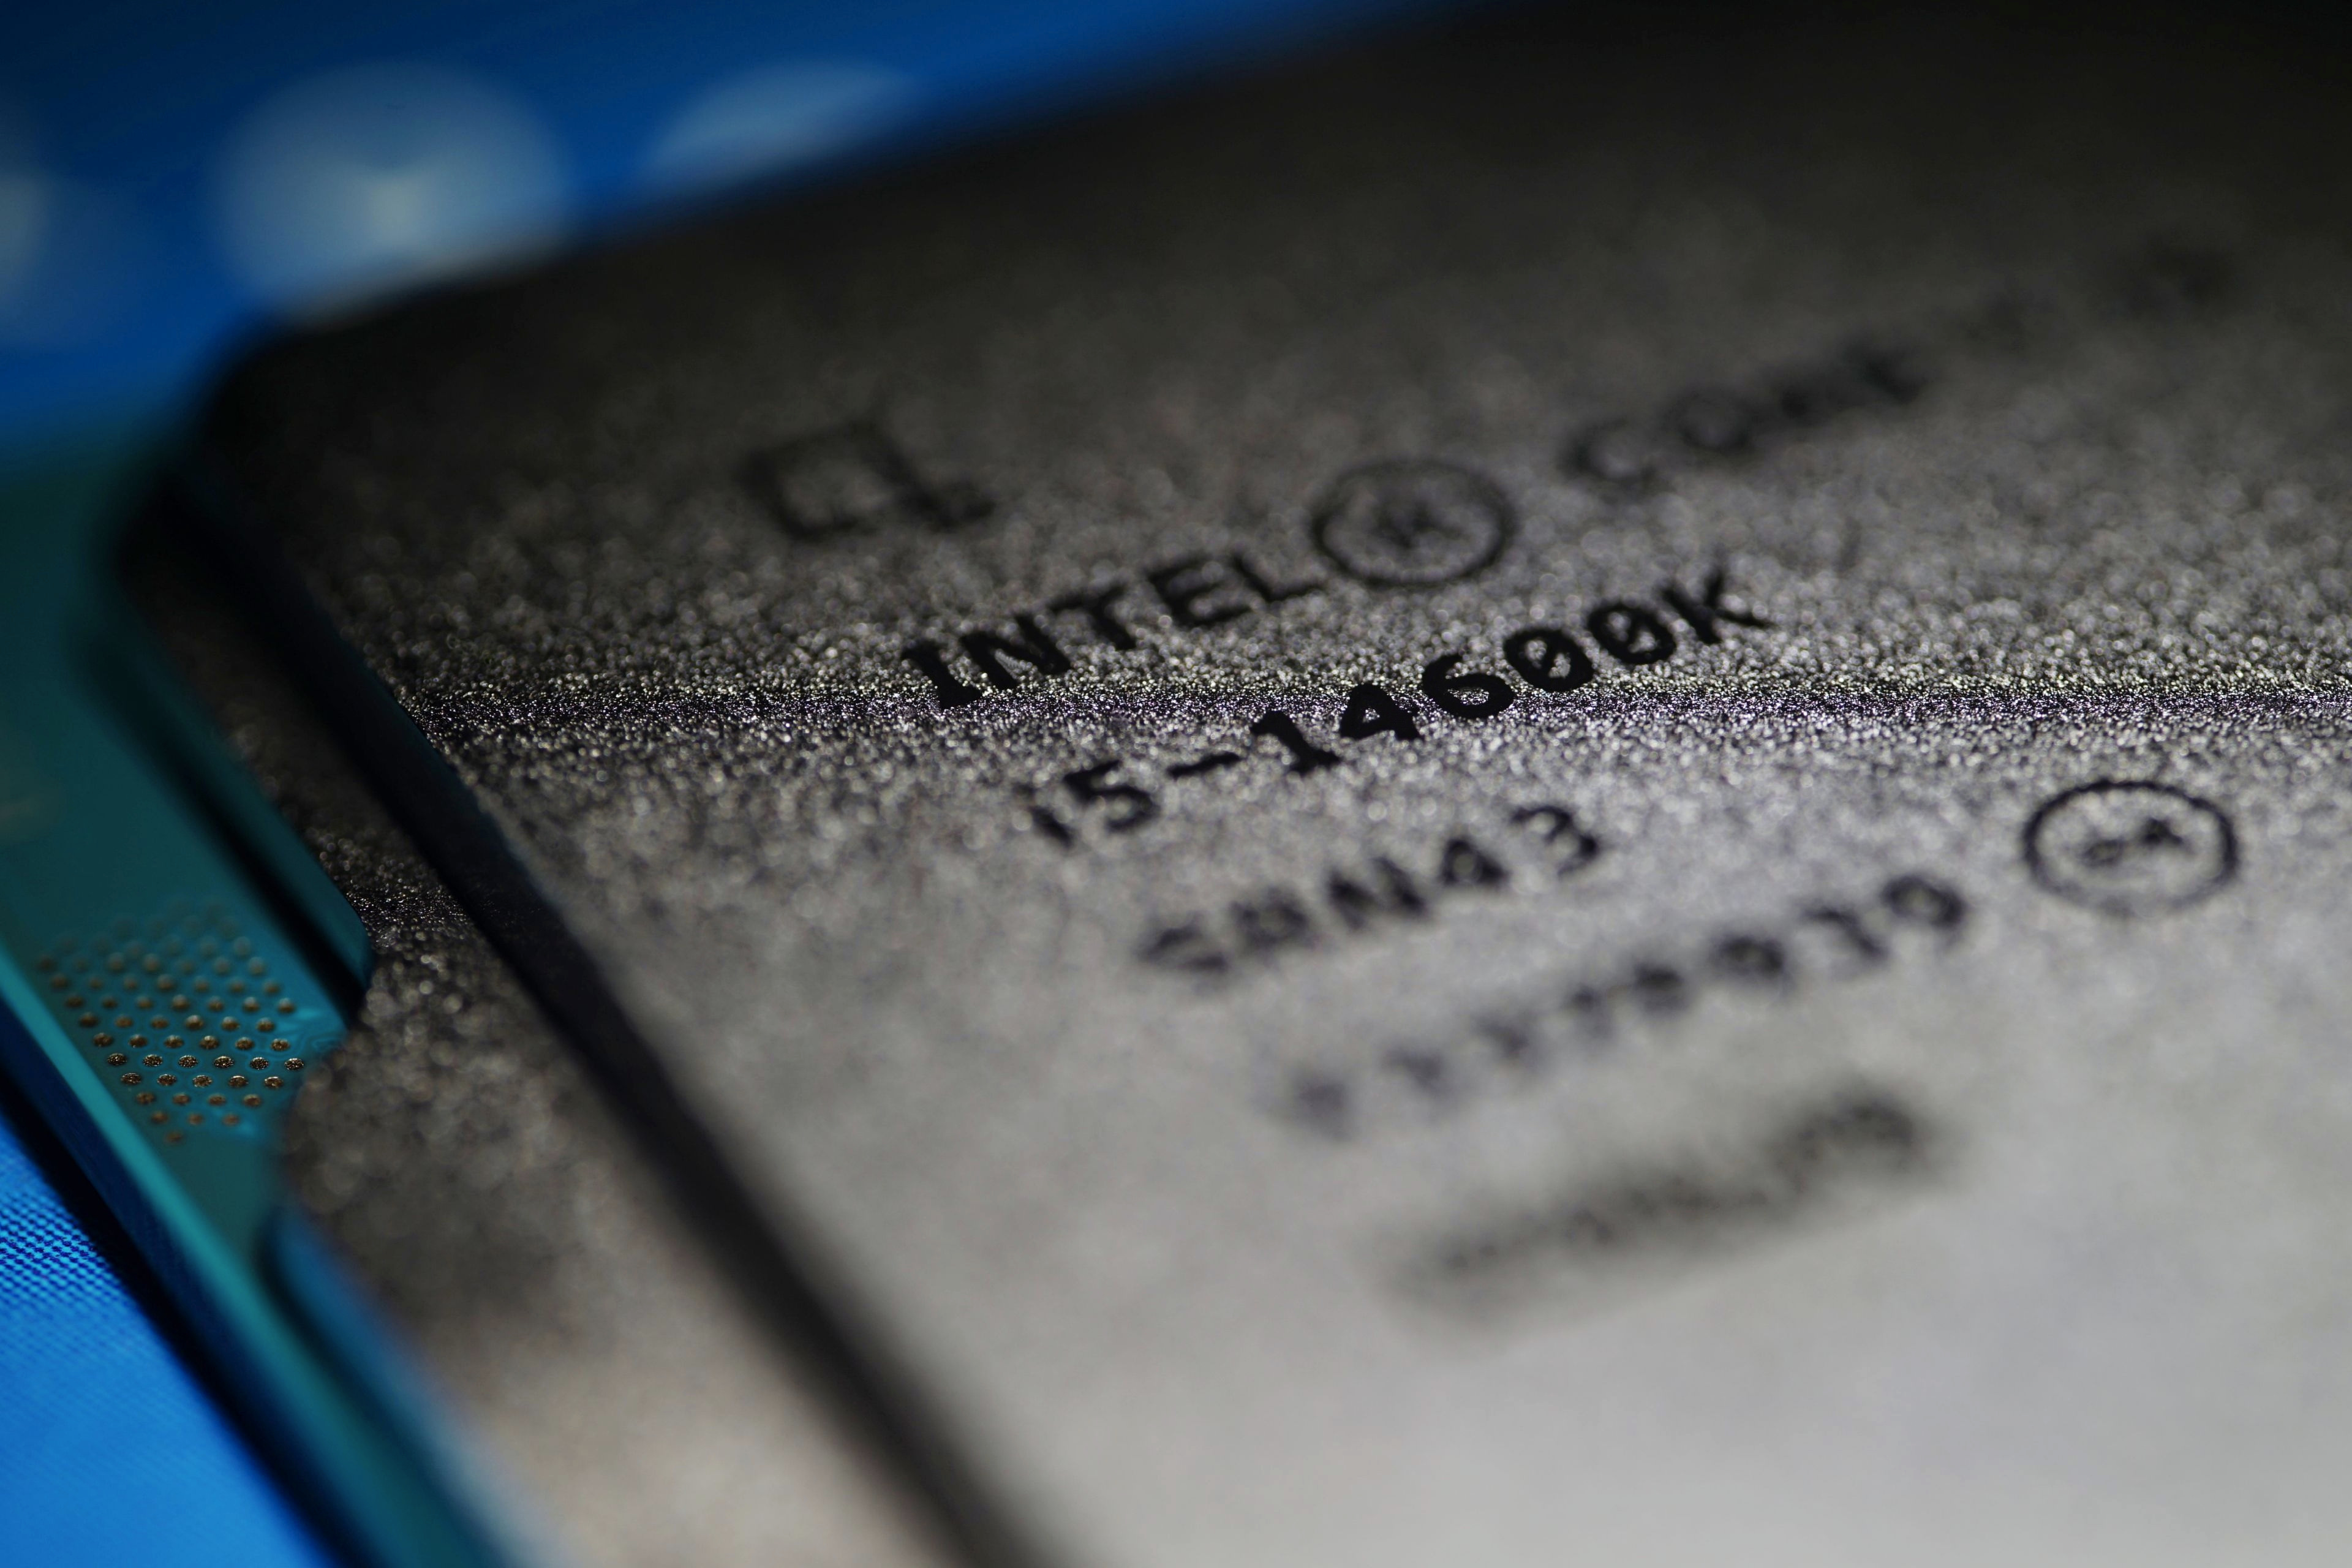
- Intel Core i5-14600K in detail
- Methodology: performance tests
- Methodology: how we measure power draw
- Methodology: temperature and clock speed tests
- Test setup
- 3DMark
- Assassin’s Creed: Valhalla
- Borderlands 3
- Counter-Strike: GO
- Cyberpunk 2077
- DOOM Eternal
- F1 2020
- Metro Exodus
- Microsoft Flight Simulator
- Shadow of the Tomb Raider
- Total War Saga: Troy
- Overall gaming performance
- Gaming performance per euro
- PCMark and Geekbench
- Web performance
- 3D rendering: Cinebench, Blender, ...
- Video 1/2: Adobe Premiere Pro
- Video 2/2: DaVinci Resolve Studio
- Graphics effects: Adobe After Effects
- Video encoding
- Audio encoding
- Broadcasting (OBS and Xsplit)
- Photos 1/2: Adobe Photoshop and Lightroom
- Photos 2/2: Affinity Photo, Topaz Labs AI Apps, ZPS X, ...
- (De)compression
- (De)encryption
- Numerical computing
- Simulations
- Memory and cache tests
- Processor power draw curve
- Average processor power draw
- Performance per watt
- Achieved CPU clock speed
- CPU temperature
- Conclusion


What’s up with the power draw curves (page 35)? 14600k is nowhere to be seen there… But it is interesting that both i5-x400 draw pretty much exactly the same power, despite 13600 having 4 e-cores.
The line graphs in chapter 35 are correct for the Core i5-14600K. Thanks for the heads up! Originally we forgot to rewrite the path, but they are always there in the editorial system. They can be found at processor-name-g342 to g346. The whole link looks like this: https://www.hwcooling.net/wp-content/uploads/2023/11/intel-core-i5-14600k-g342.png Of course we will try to get the charts to display correctly in the article, but if you see different ones there, you know about this system. 🙂
When testing the modern powerful CPUs, we run into the problem that it basically pulls all the power it can. So testing is also quite a bit about how much power are we willing to deliver, and how much heat are we able to remove.
Looking at the Cinebench 23MT figure: 14600k lags r7900x by ~10% there. Hence its performance is comparable to 7900 (non-x), or equivalently, 7900x capped at 90W. You do not show 7900 on this graph, but there are other test sites that report its performance being 5-10% below that of the 7900x. But importantly, Ryzen 7900 only pulls half of the power of 14600k.
I would like to understand if intel is actually less power efficient than ryzen. Would it be possible to test 14600k capped to 90W as well? I’d guess it is actually rather similar to ryzen in such a setup, with multi-threaded performance falling somewhere between 7700 and 7900, but I have never seen a test.
The efficiency of equivalent processors when tuned for comparable power draw is very similar. Note in our motherboard tests the comparison of the Core i9-13900K with the R9 7950X with power limits (with Intel’s PL2 at 125 W/”IPL” and AMD’s TDP at 105 W/”AMD Eco”) in a 10-minute pass of Cinebench R23. Sure, it’s not a completely equivalent situation if only because of the short Tau time interval used for Intel from the start with PL2 at 253 W and AMD’s 105-watt TPD means a PPT constant of 142 W, but in the end, the calculated performance per watt is very similar when you divide the CB R23 score by the average power draw of the entire test. Naturally, depending on the board (and its aggressiveness of power supply) it can always be a bit different and the results will also differ depending on the processor used, but after manual tuning all current AMD and Intel processors have the potential to achieve comparable efficiency. Of course, if we take into account the default settings, Intel achieves significantly lower efficiency than competitive AMD processors, but those do it with higher power draw, which isn’t emphasized that much with Ryzens. During gaming load, where all processors have marginal power draw (compared to the power draw at maximum performance), the efficiency across equivalent processors is also fairly even.
And the answer to the question if it would be possible to test the Ci5-14600K at 90 W. Some more extensive tests are certainly beyond our current time possibilities, but if only the result of one or two selected tests would be useful for you, then of course I can measure it. So if you let me know what would be of interest, by Wednesday of next week the latest. Then I will have to test Raptor Lake Refresh and switch to other topics again.