


Test setup
In the Raptor Lake Refresh generation, Intel has gone a bit harder and increased the clock speeds in the Core i5 class. This has led to higher application and gaming performance, but by pushing the manufacturing process to its limits, power draw has naturally increased, and with it comes poorer efficiency. The latter may not be that important for someone and the main thing is that the processor can be comfortably operated even with a “normal” cooler.
Test setup
| Test configuration | |
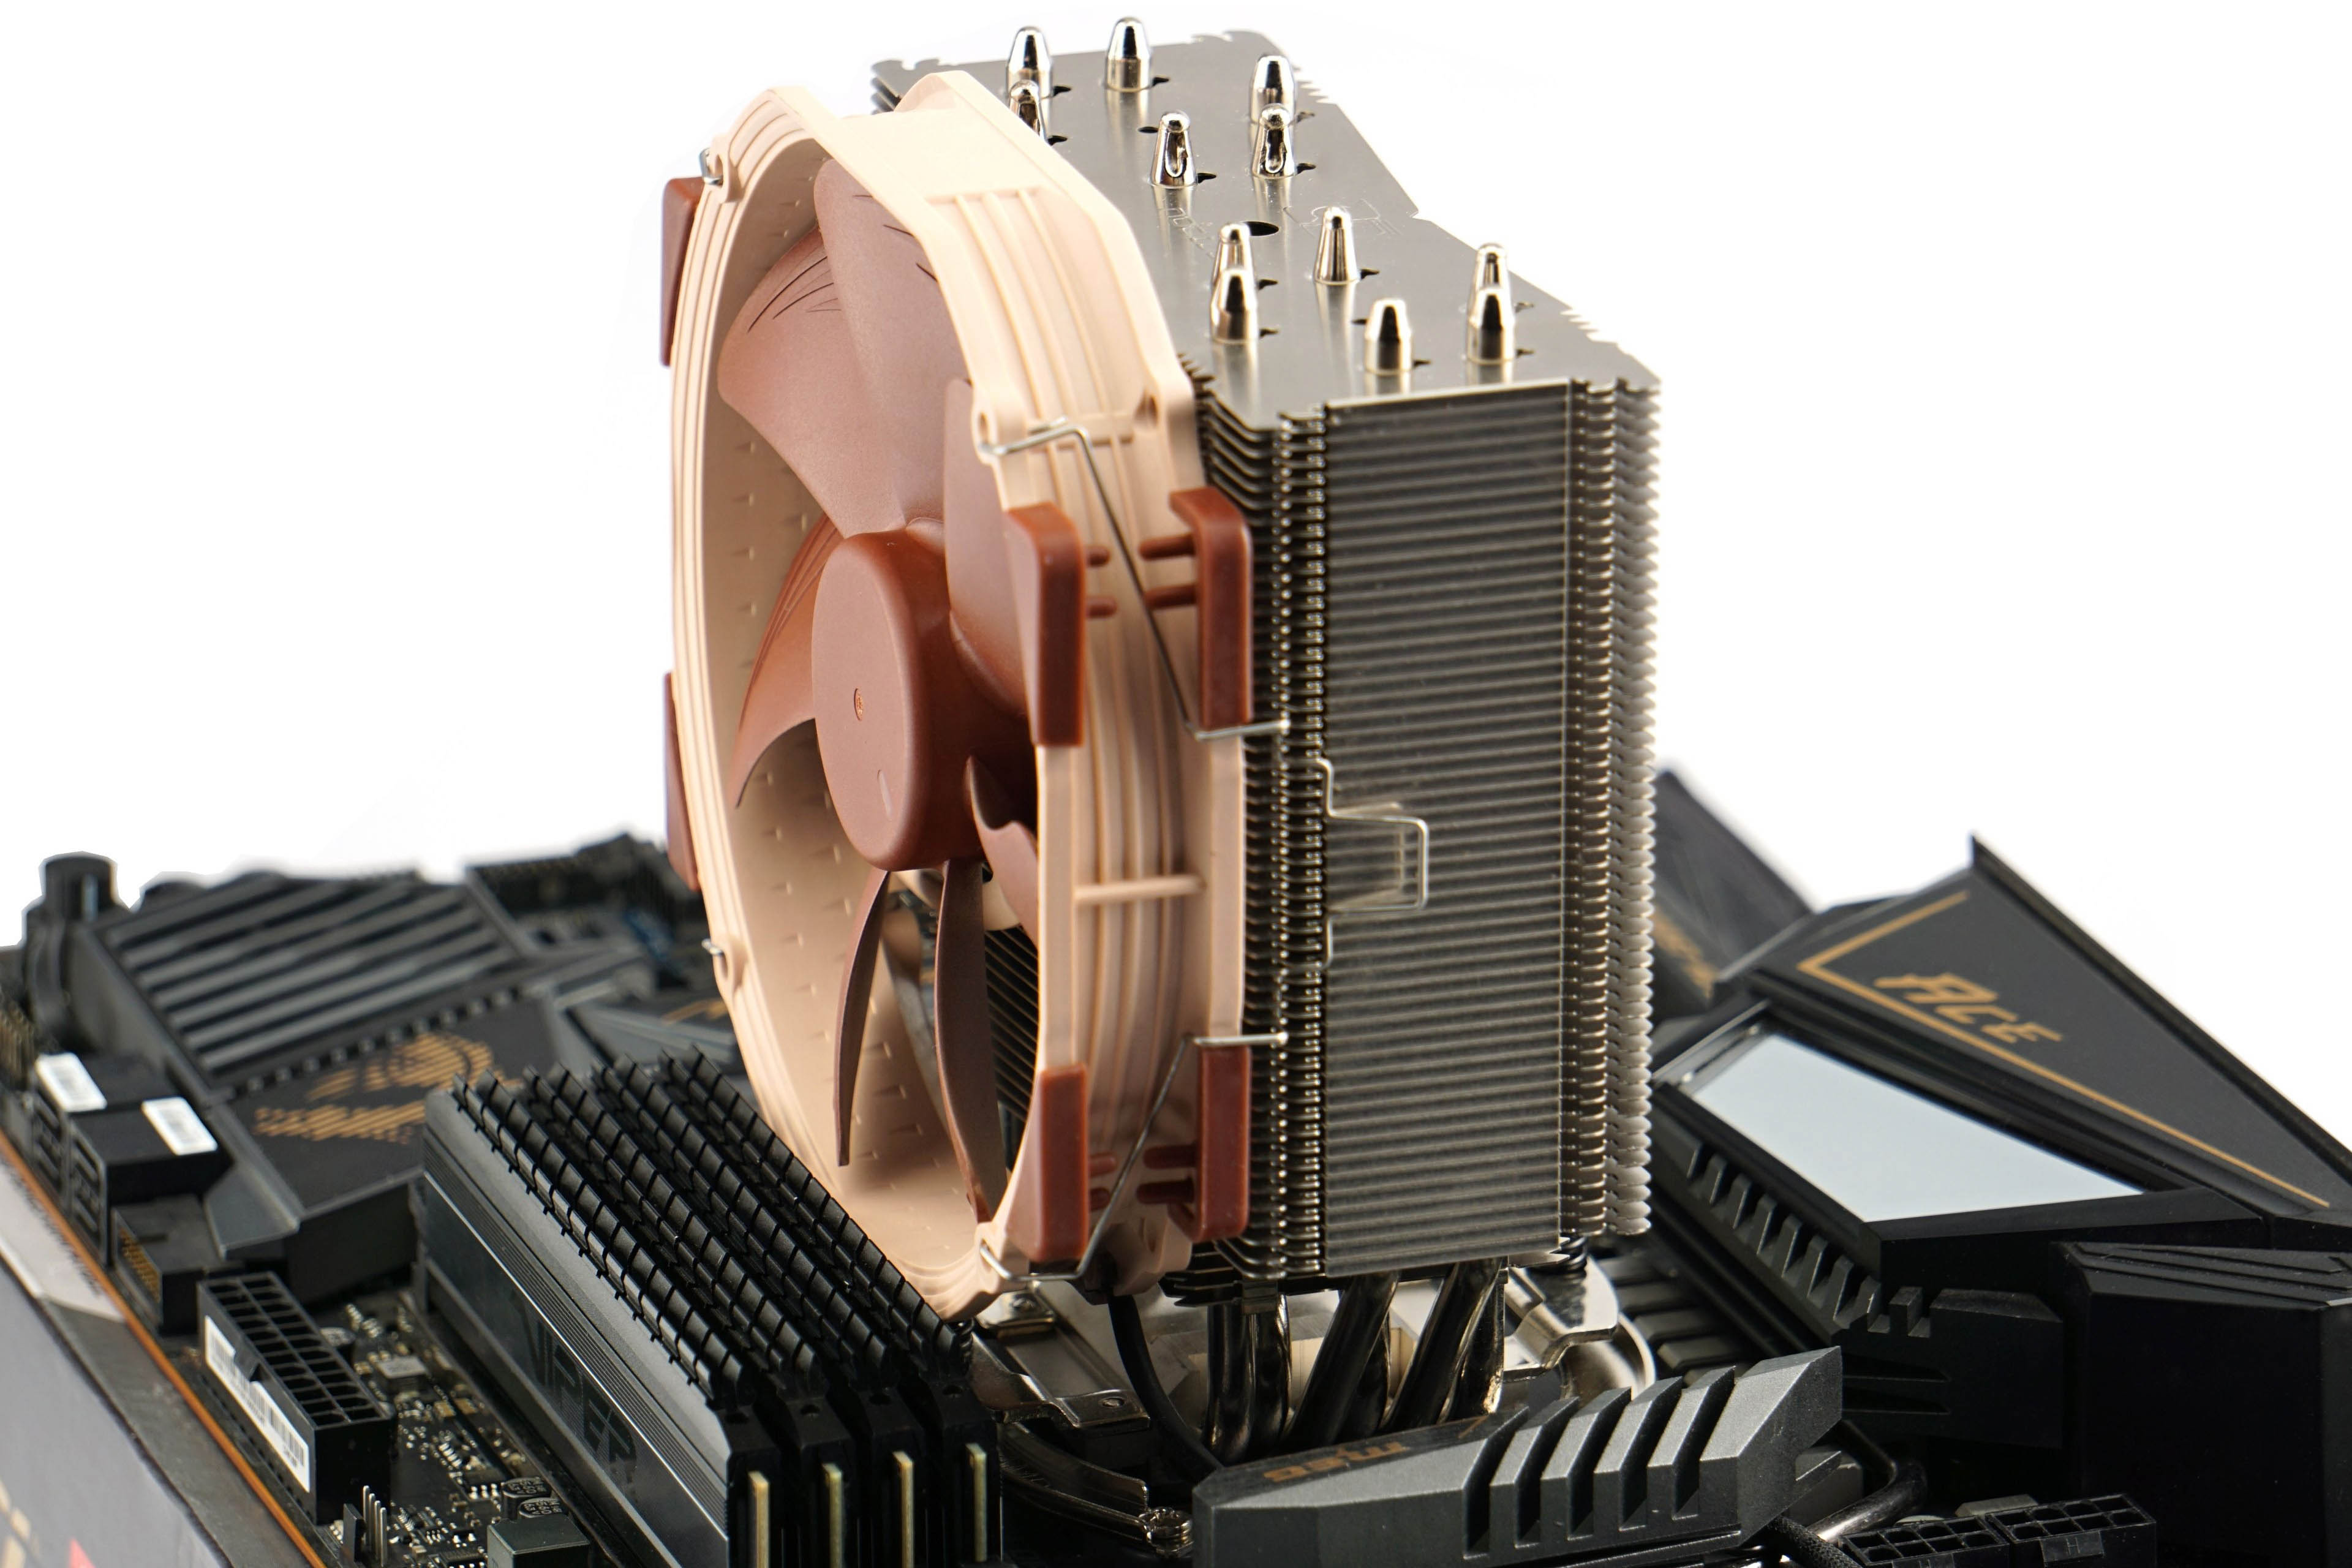
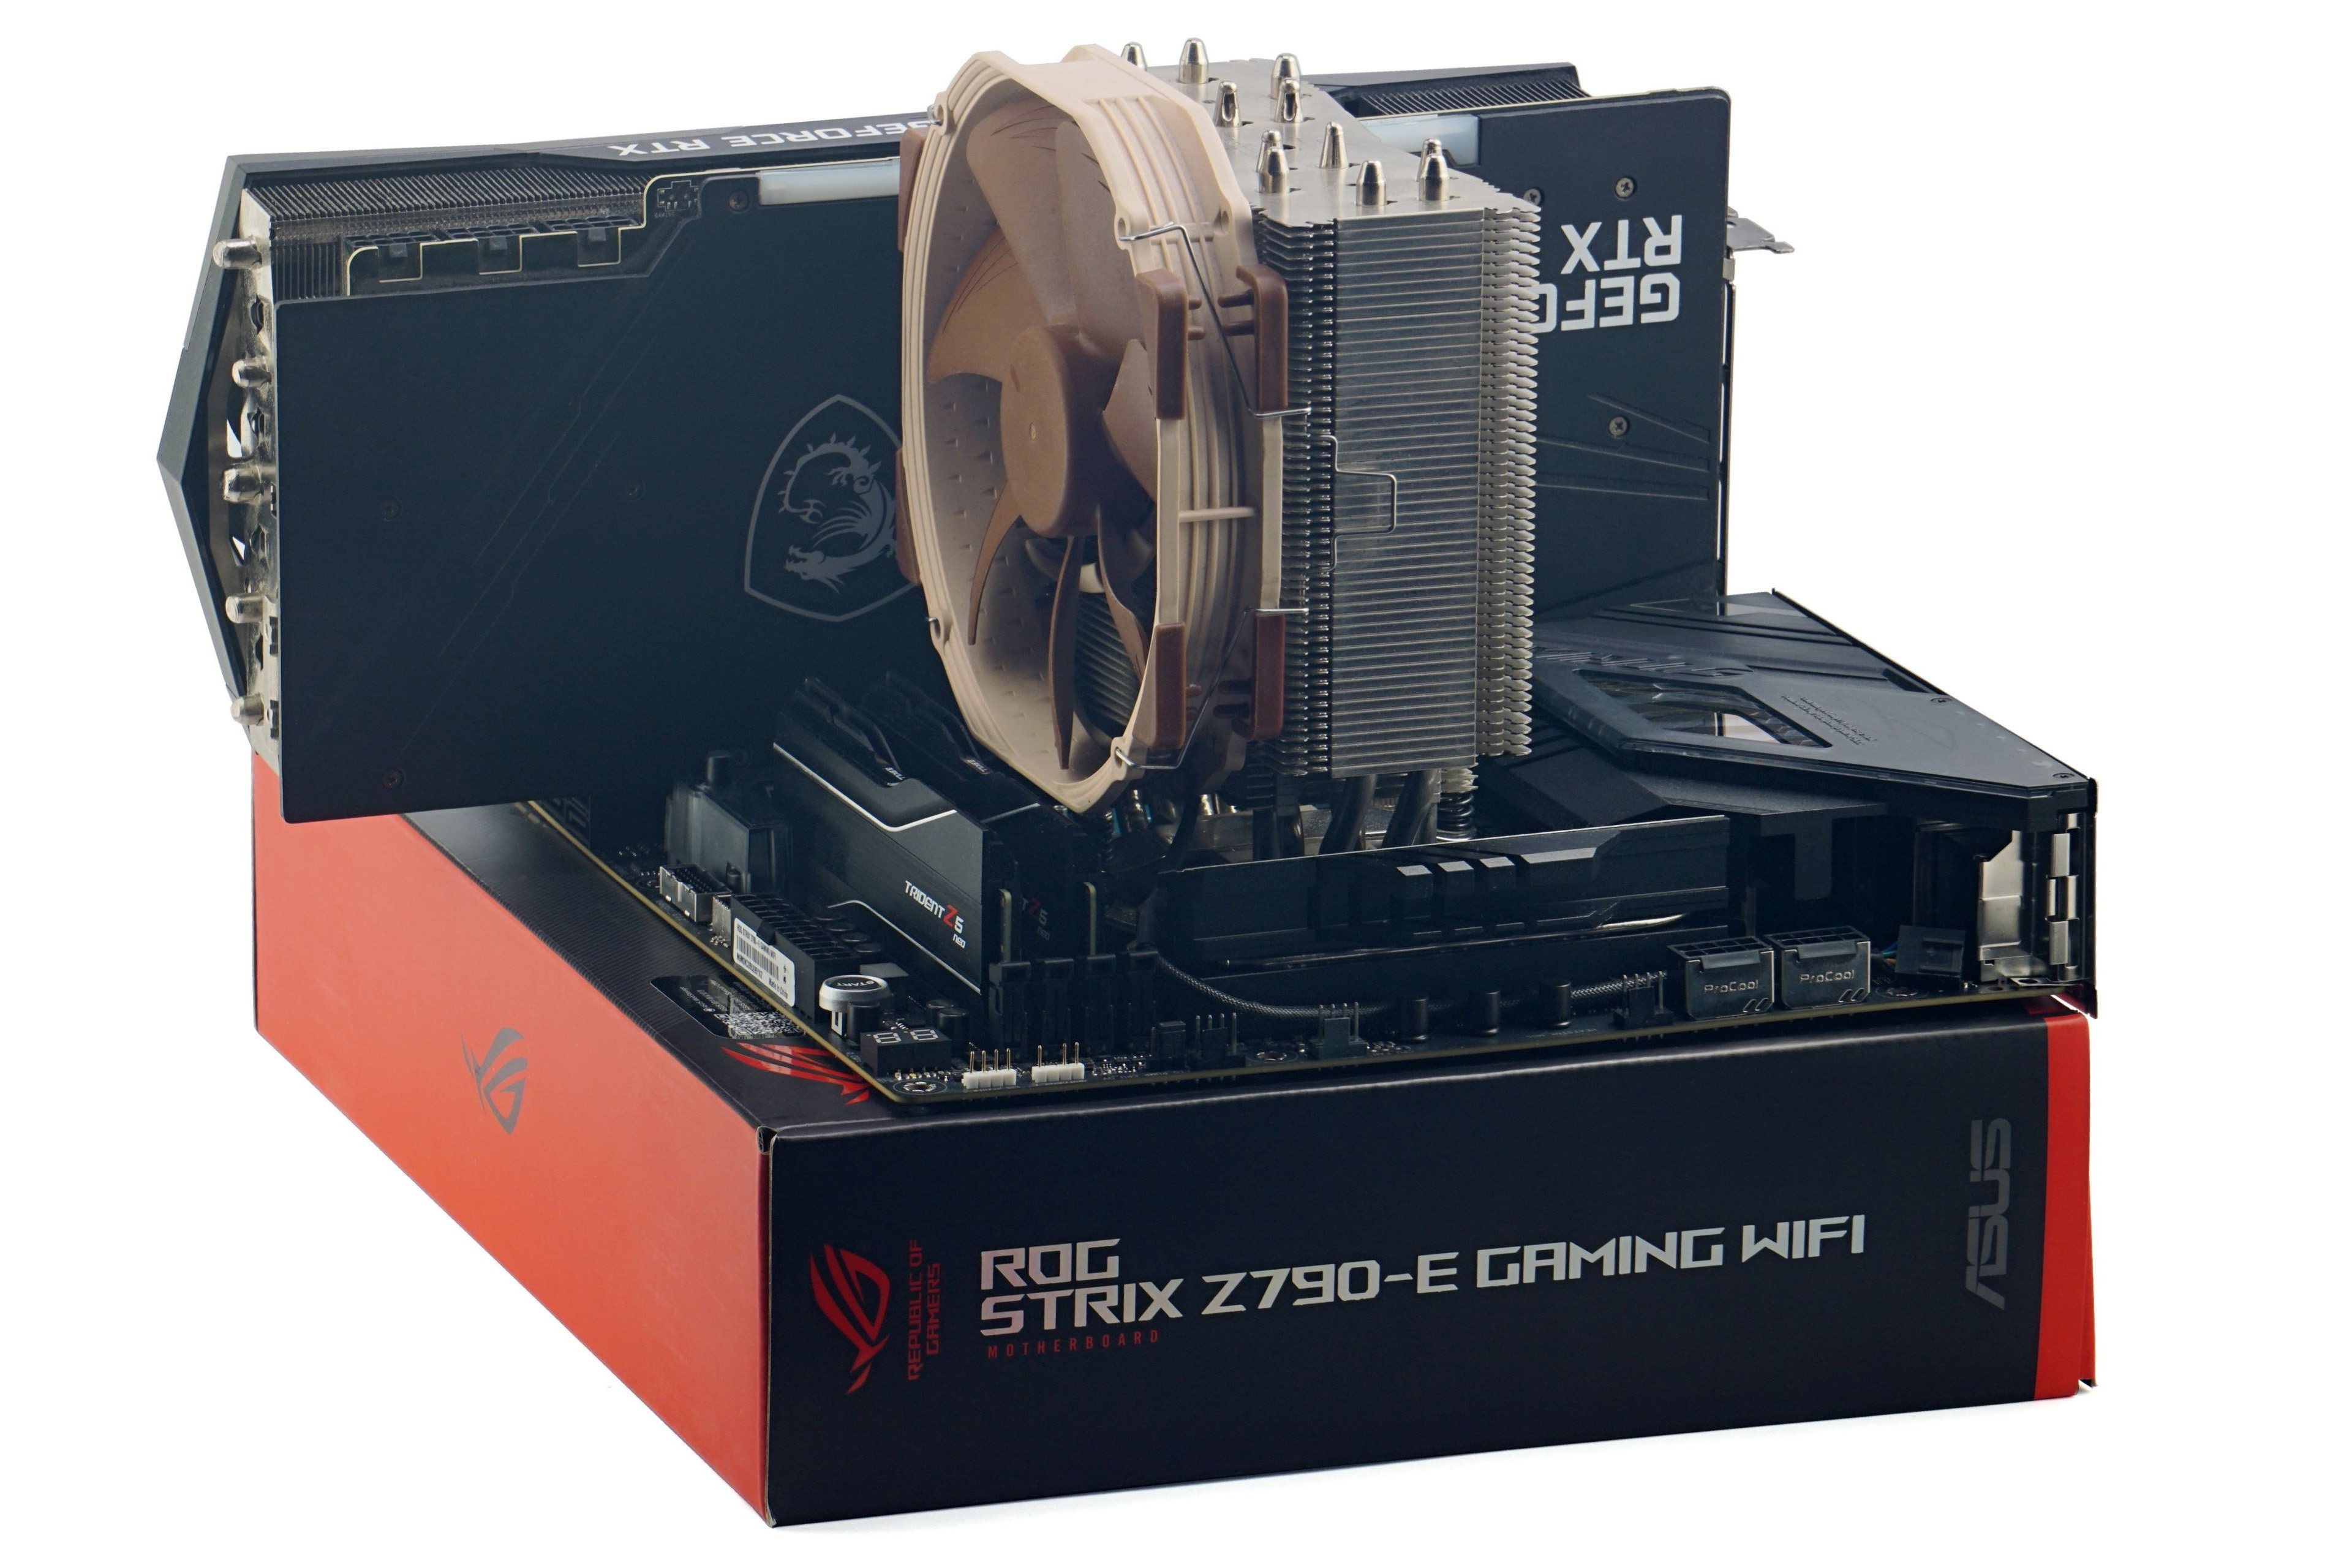
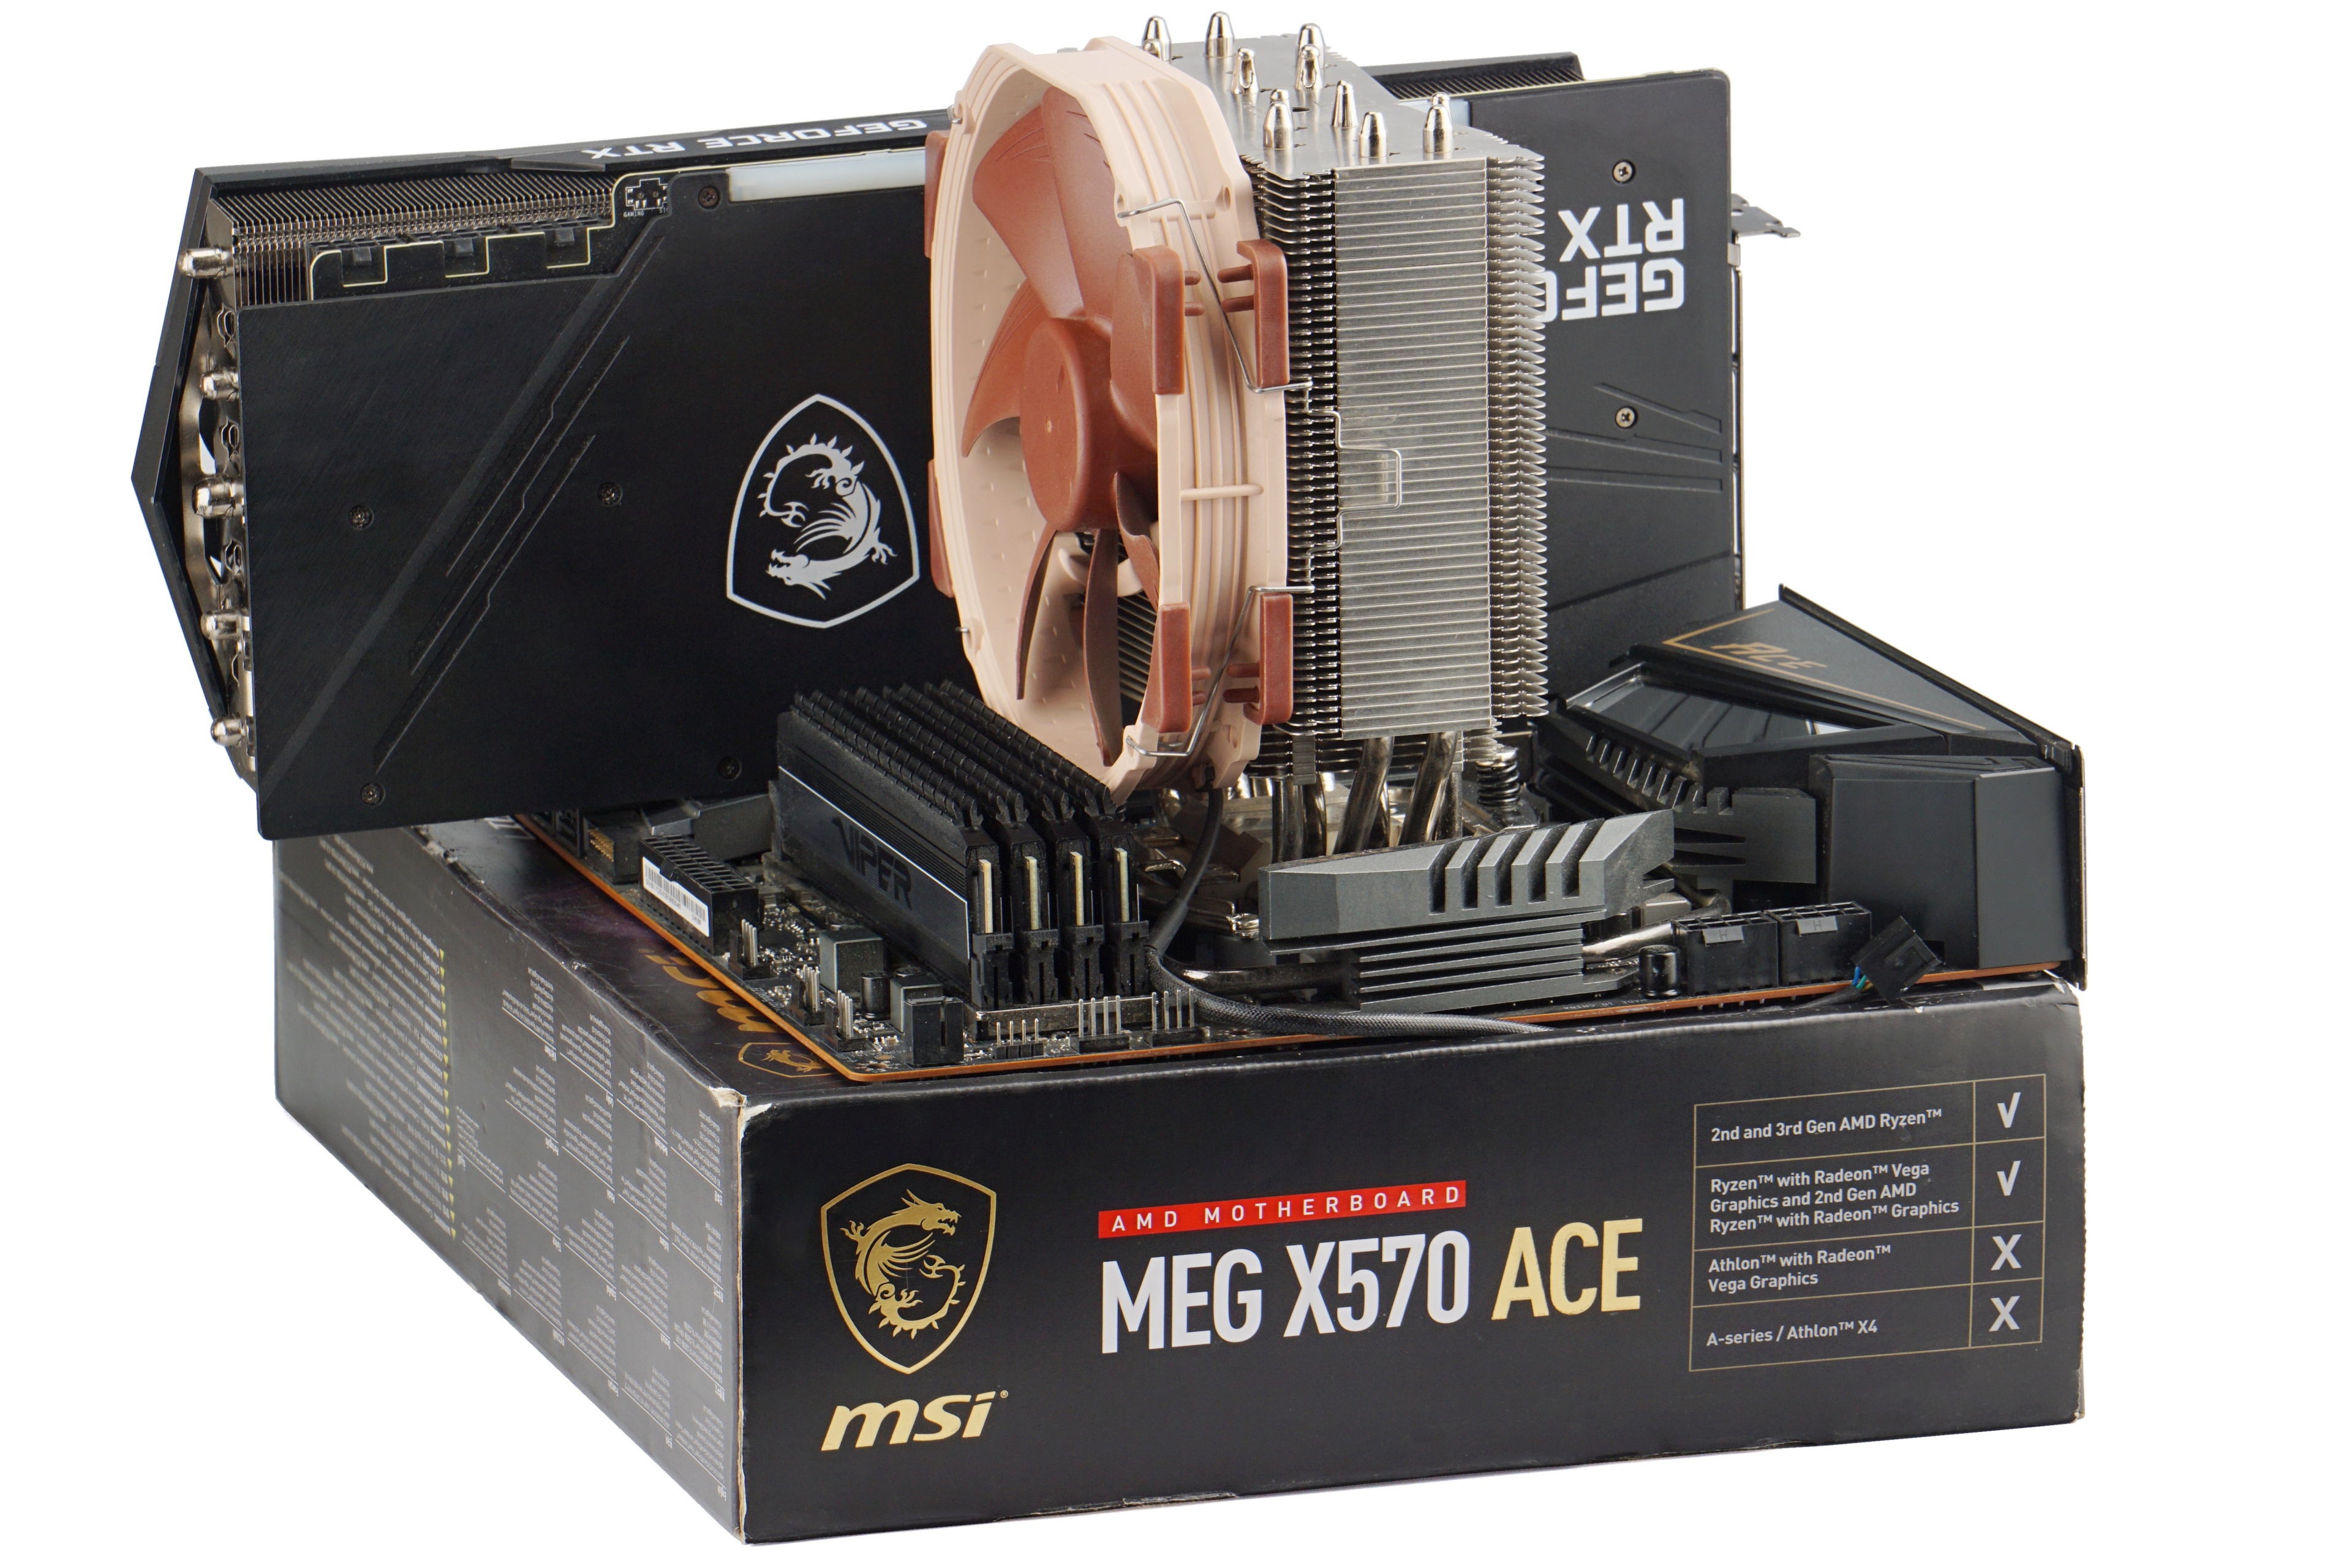
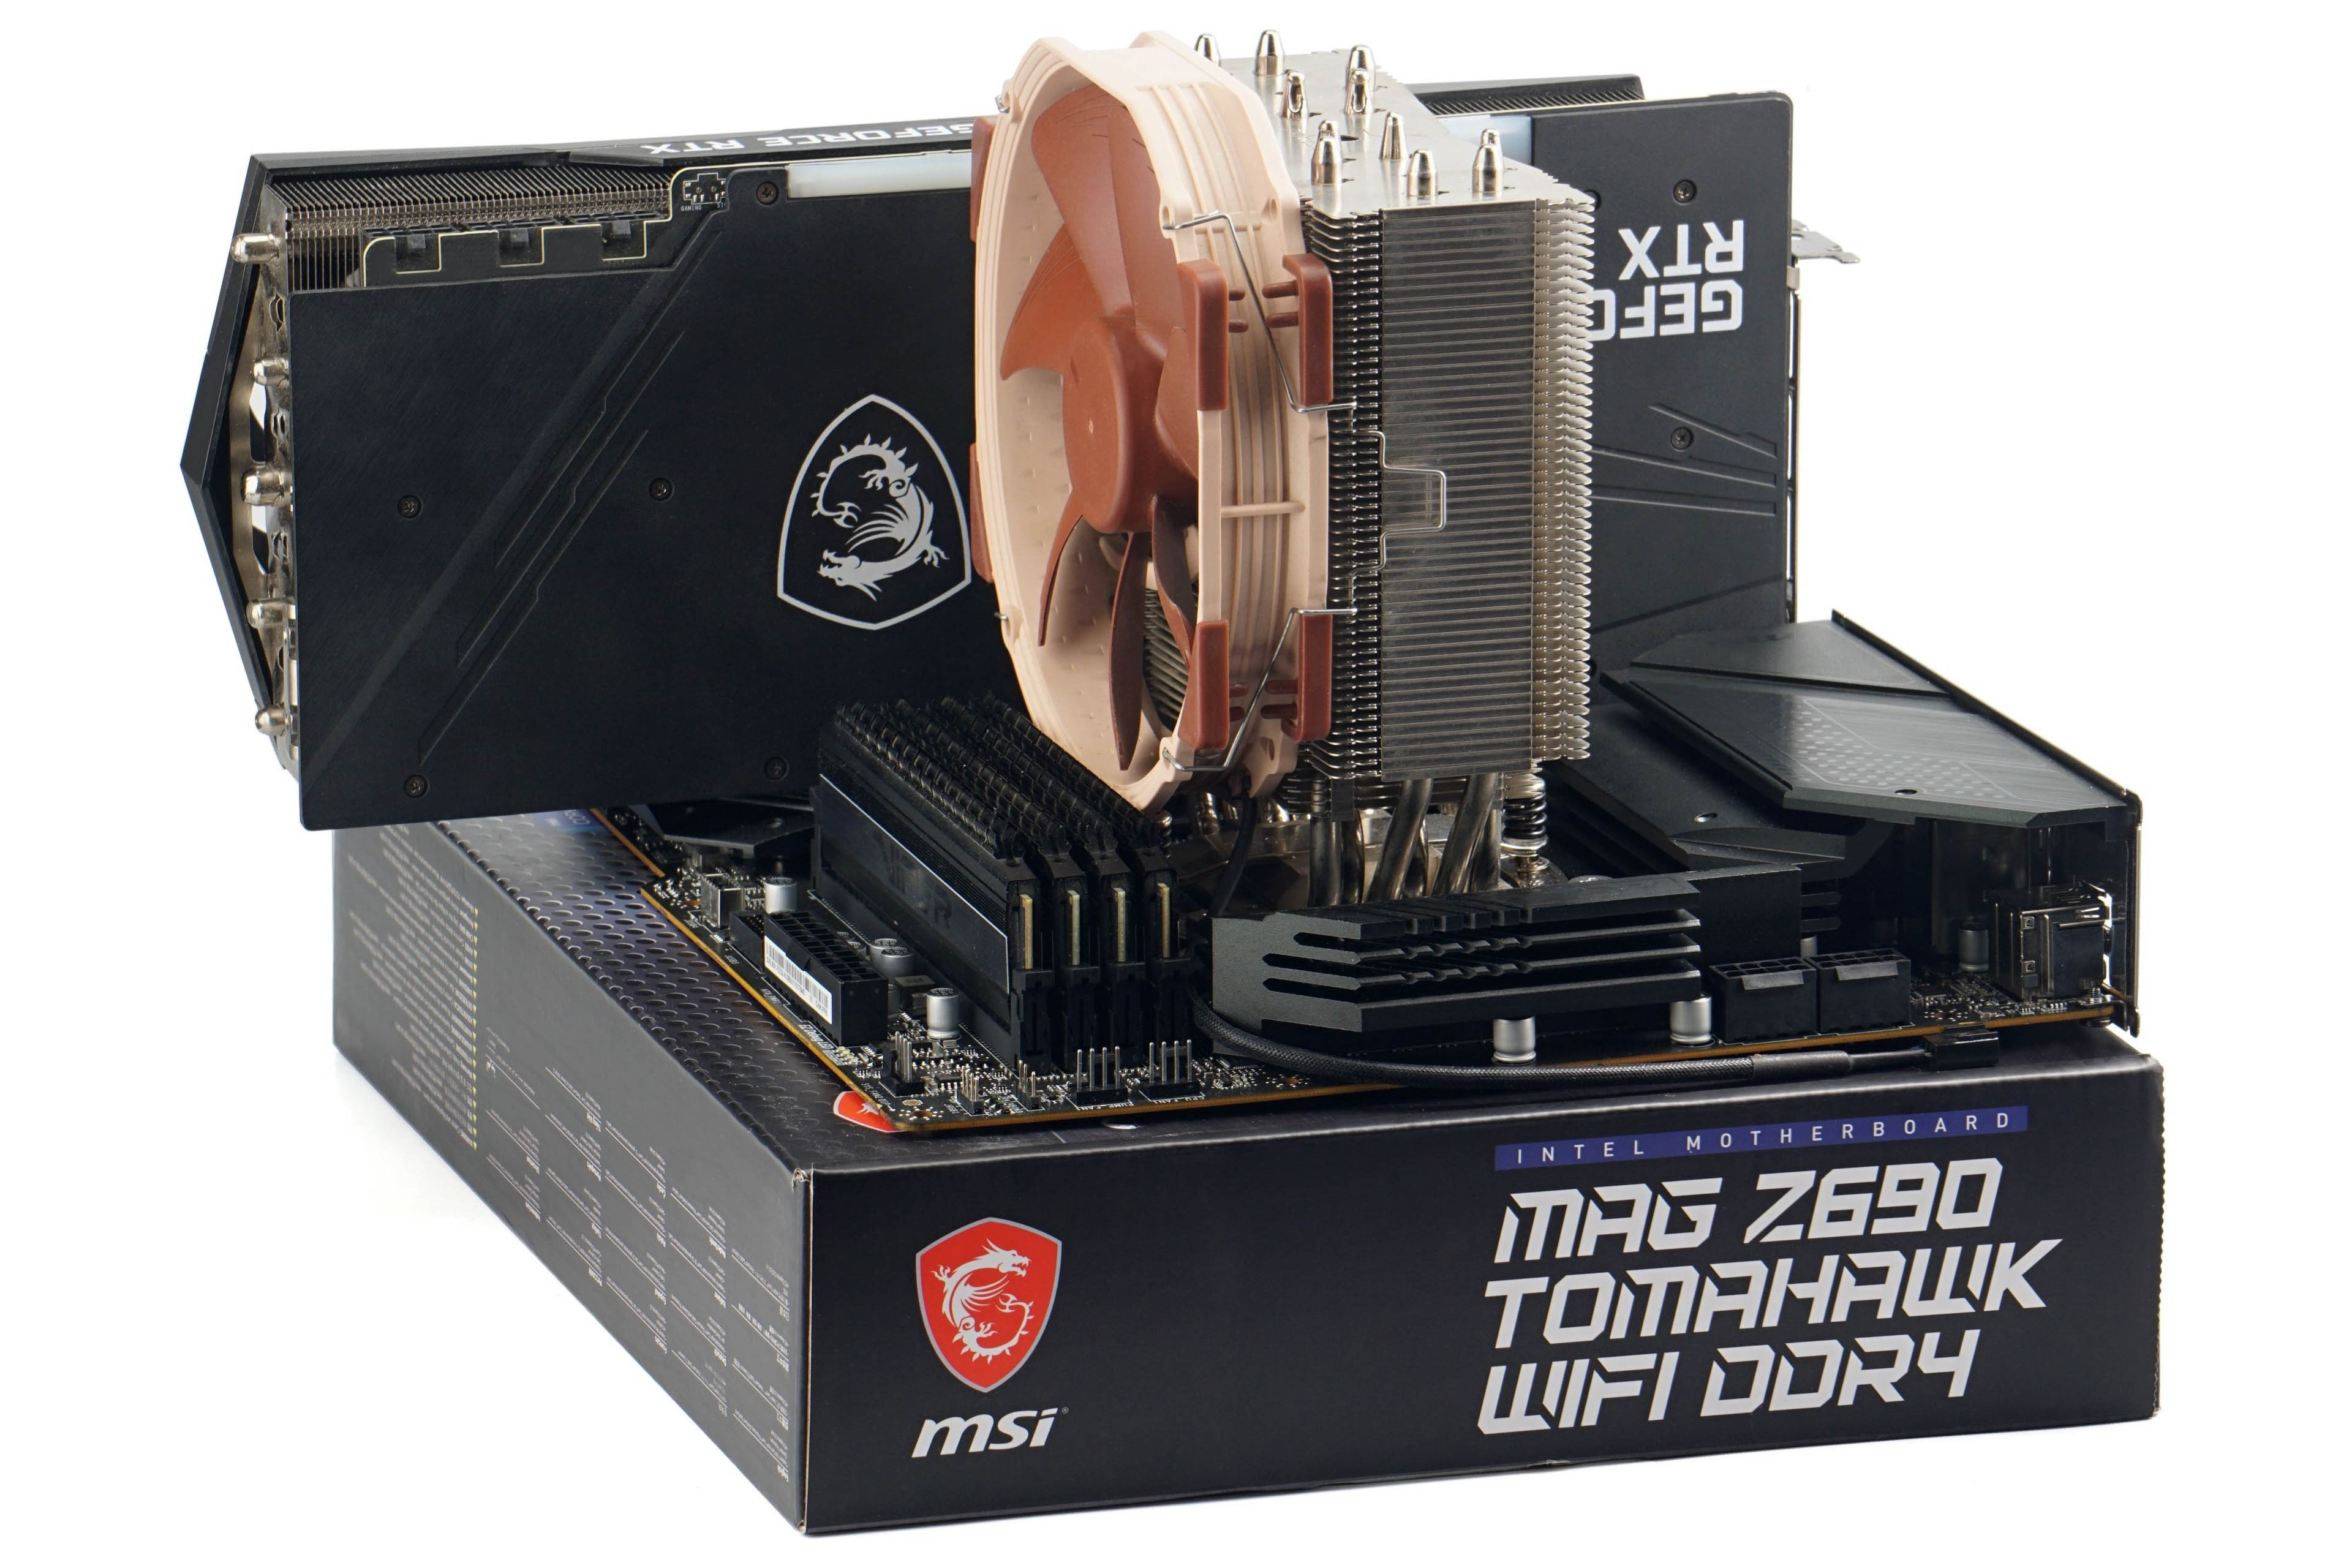
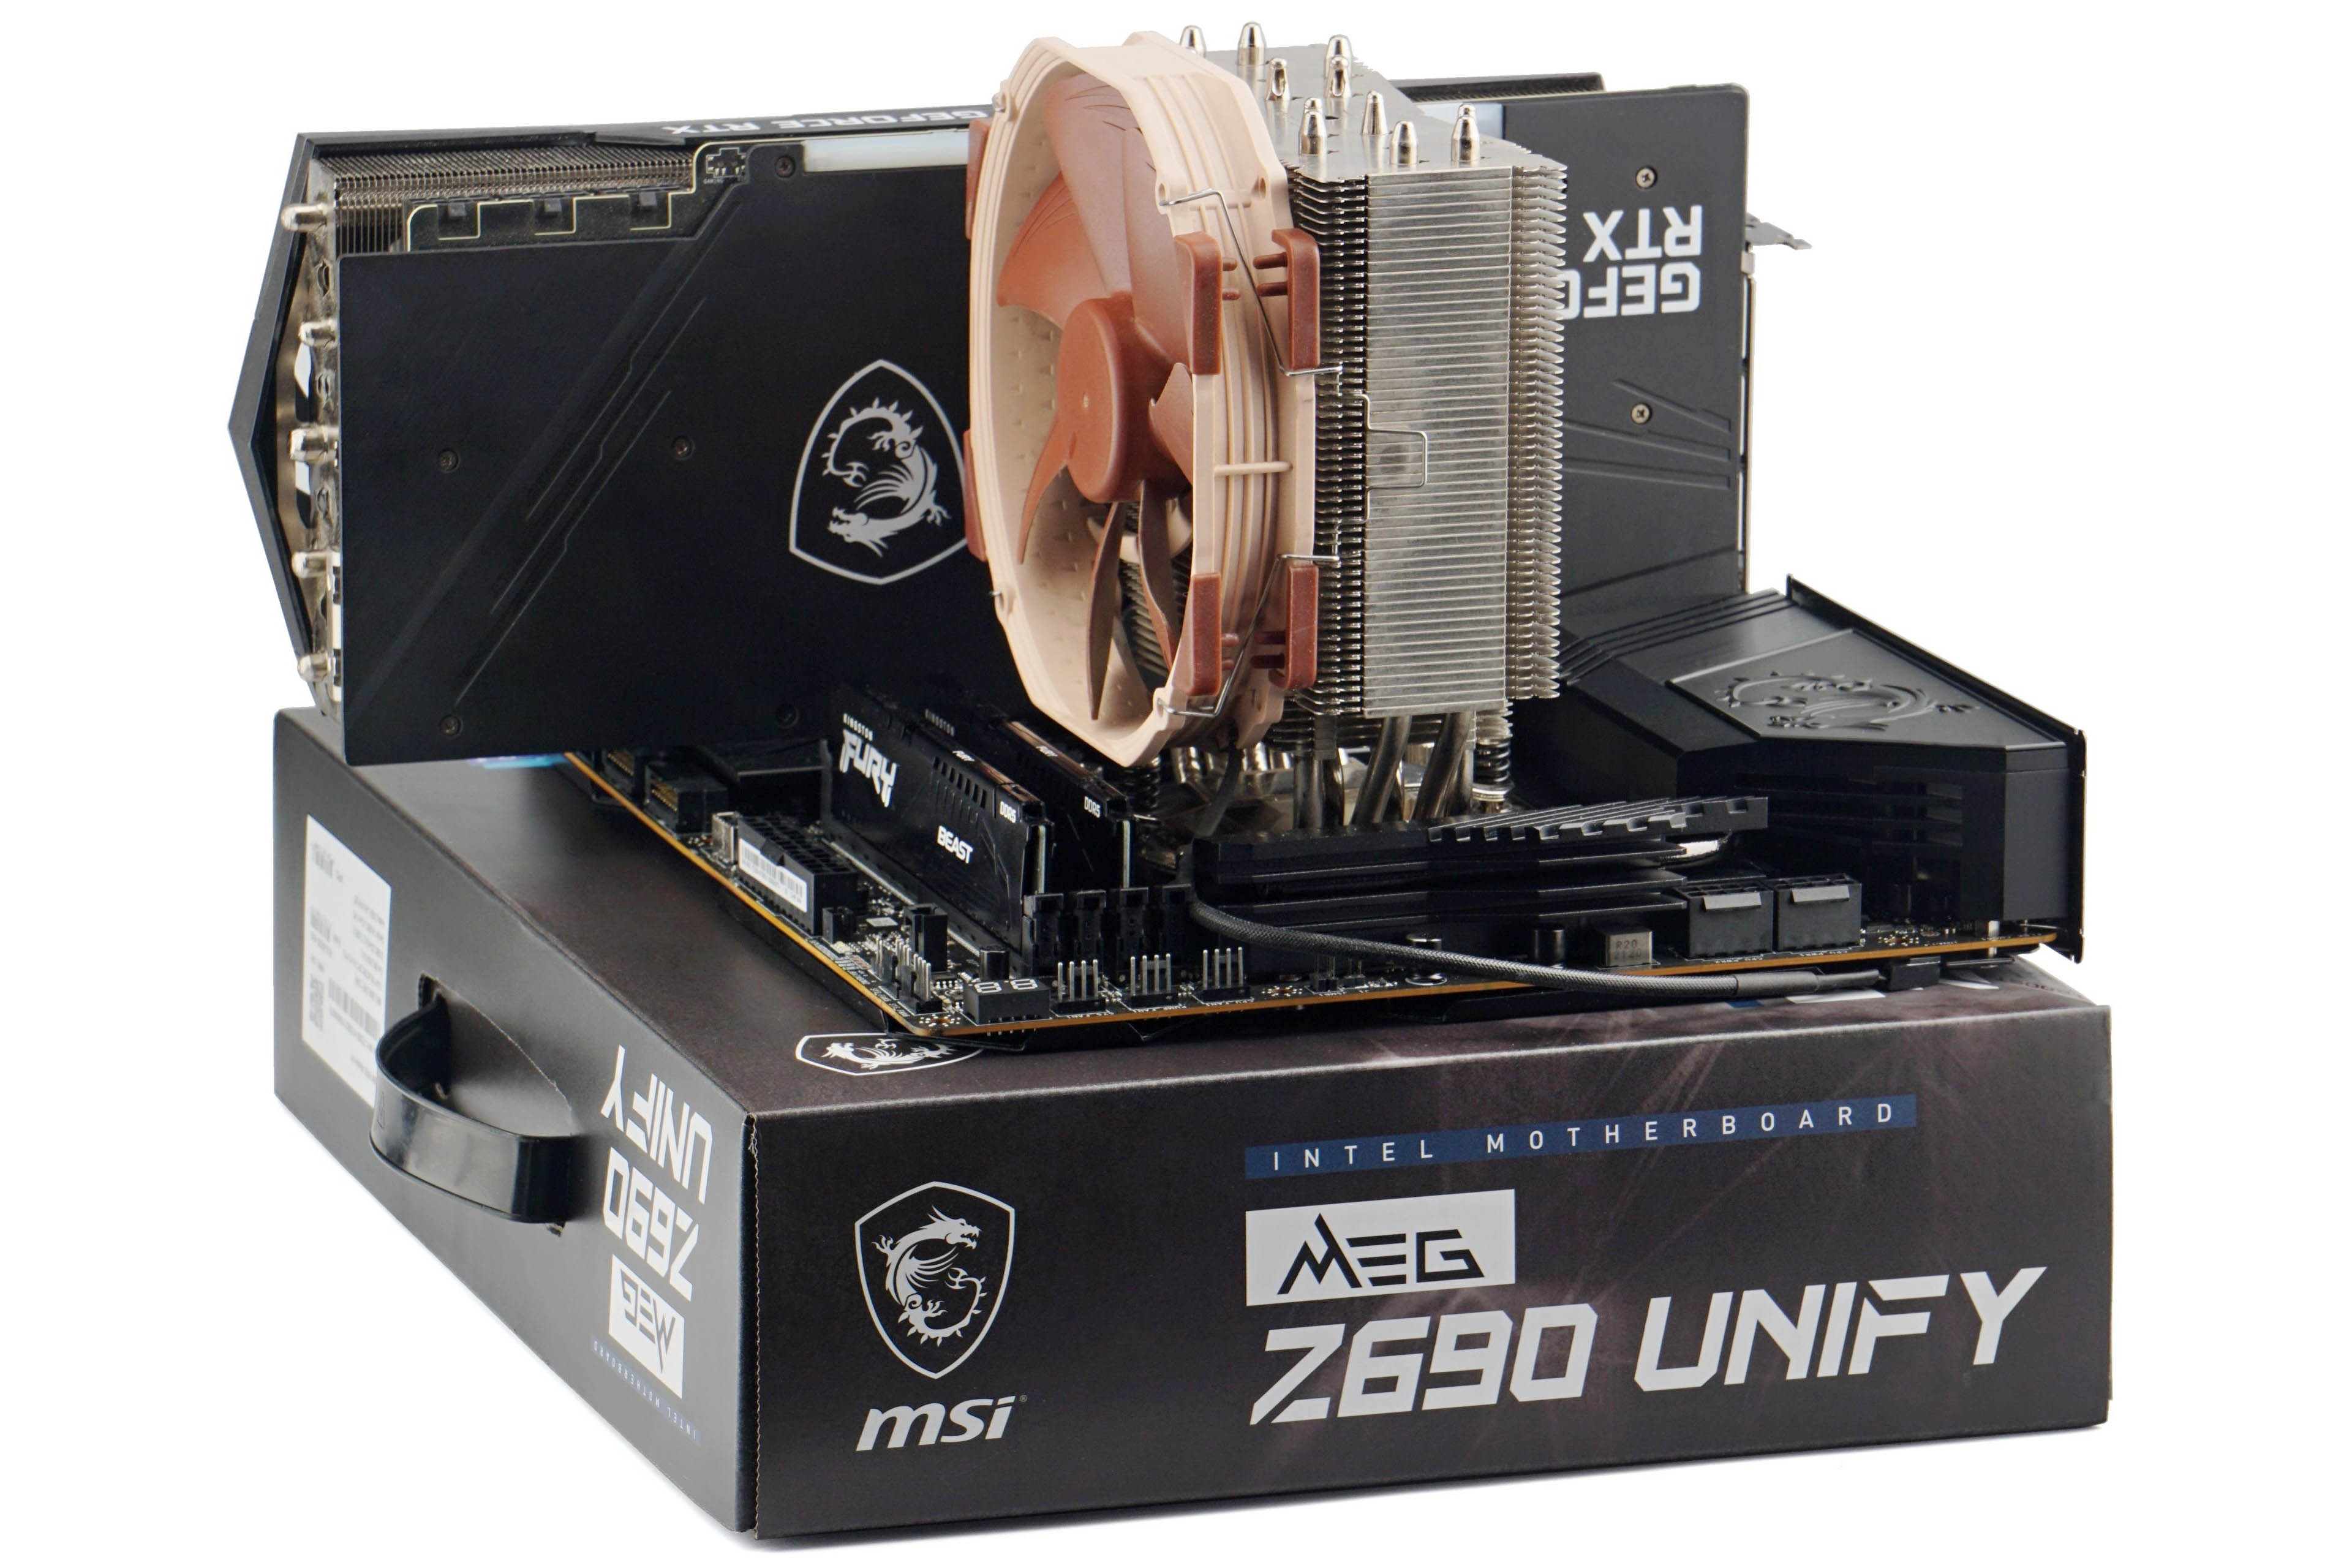
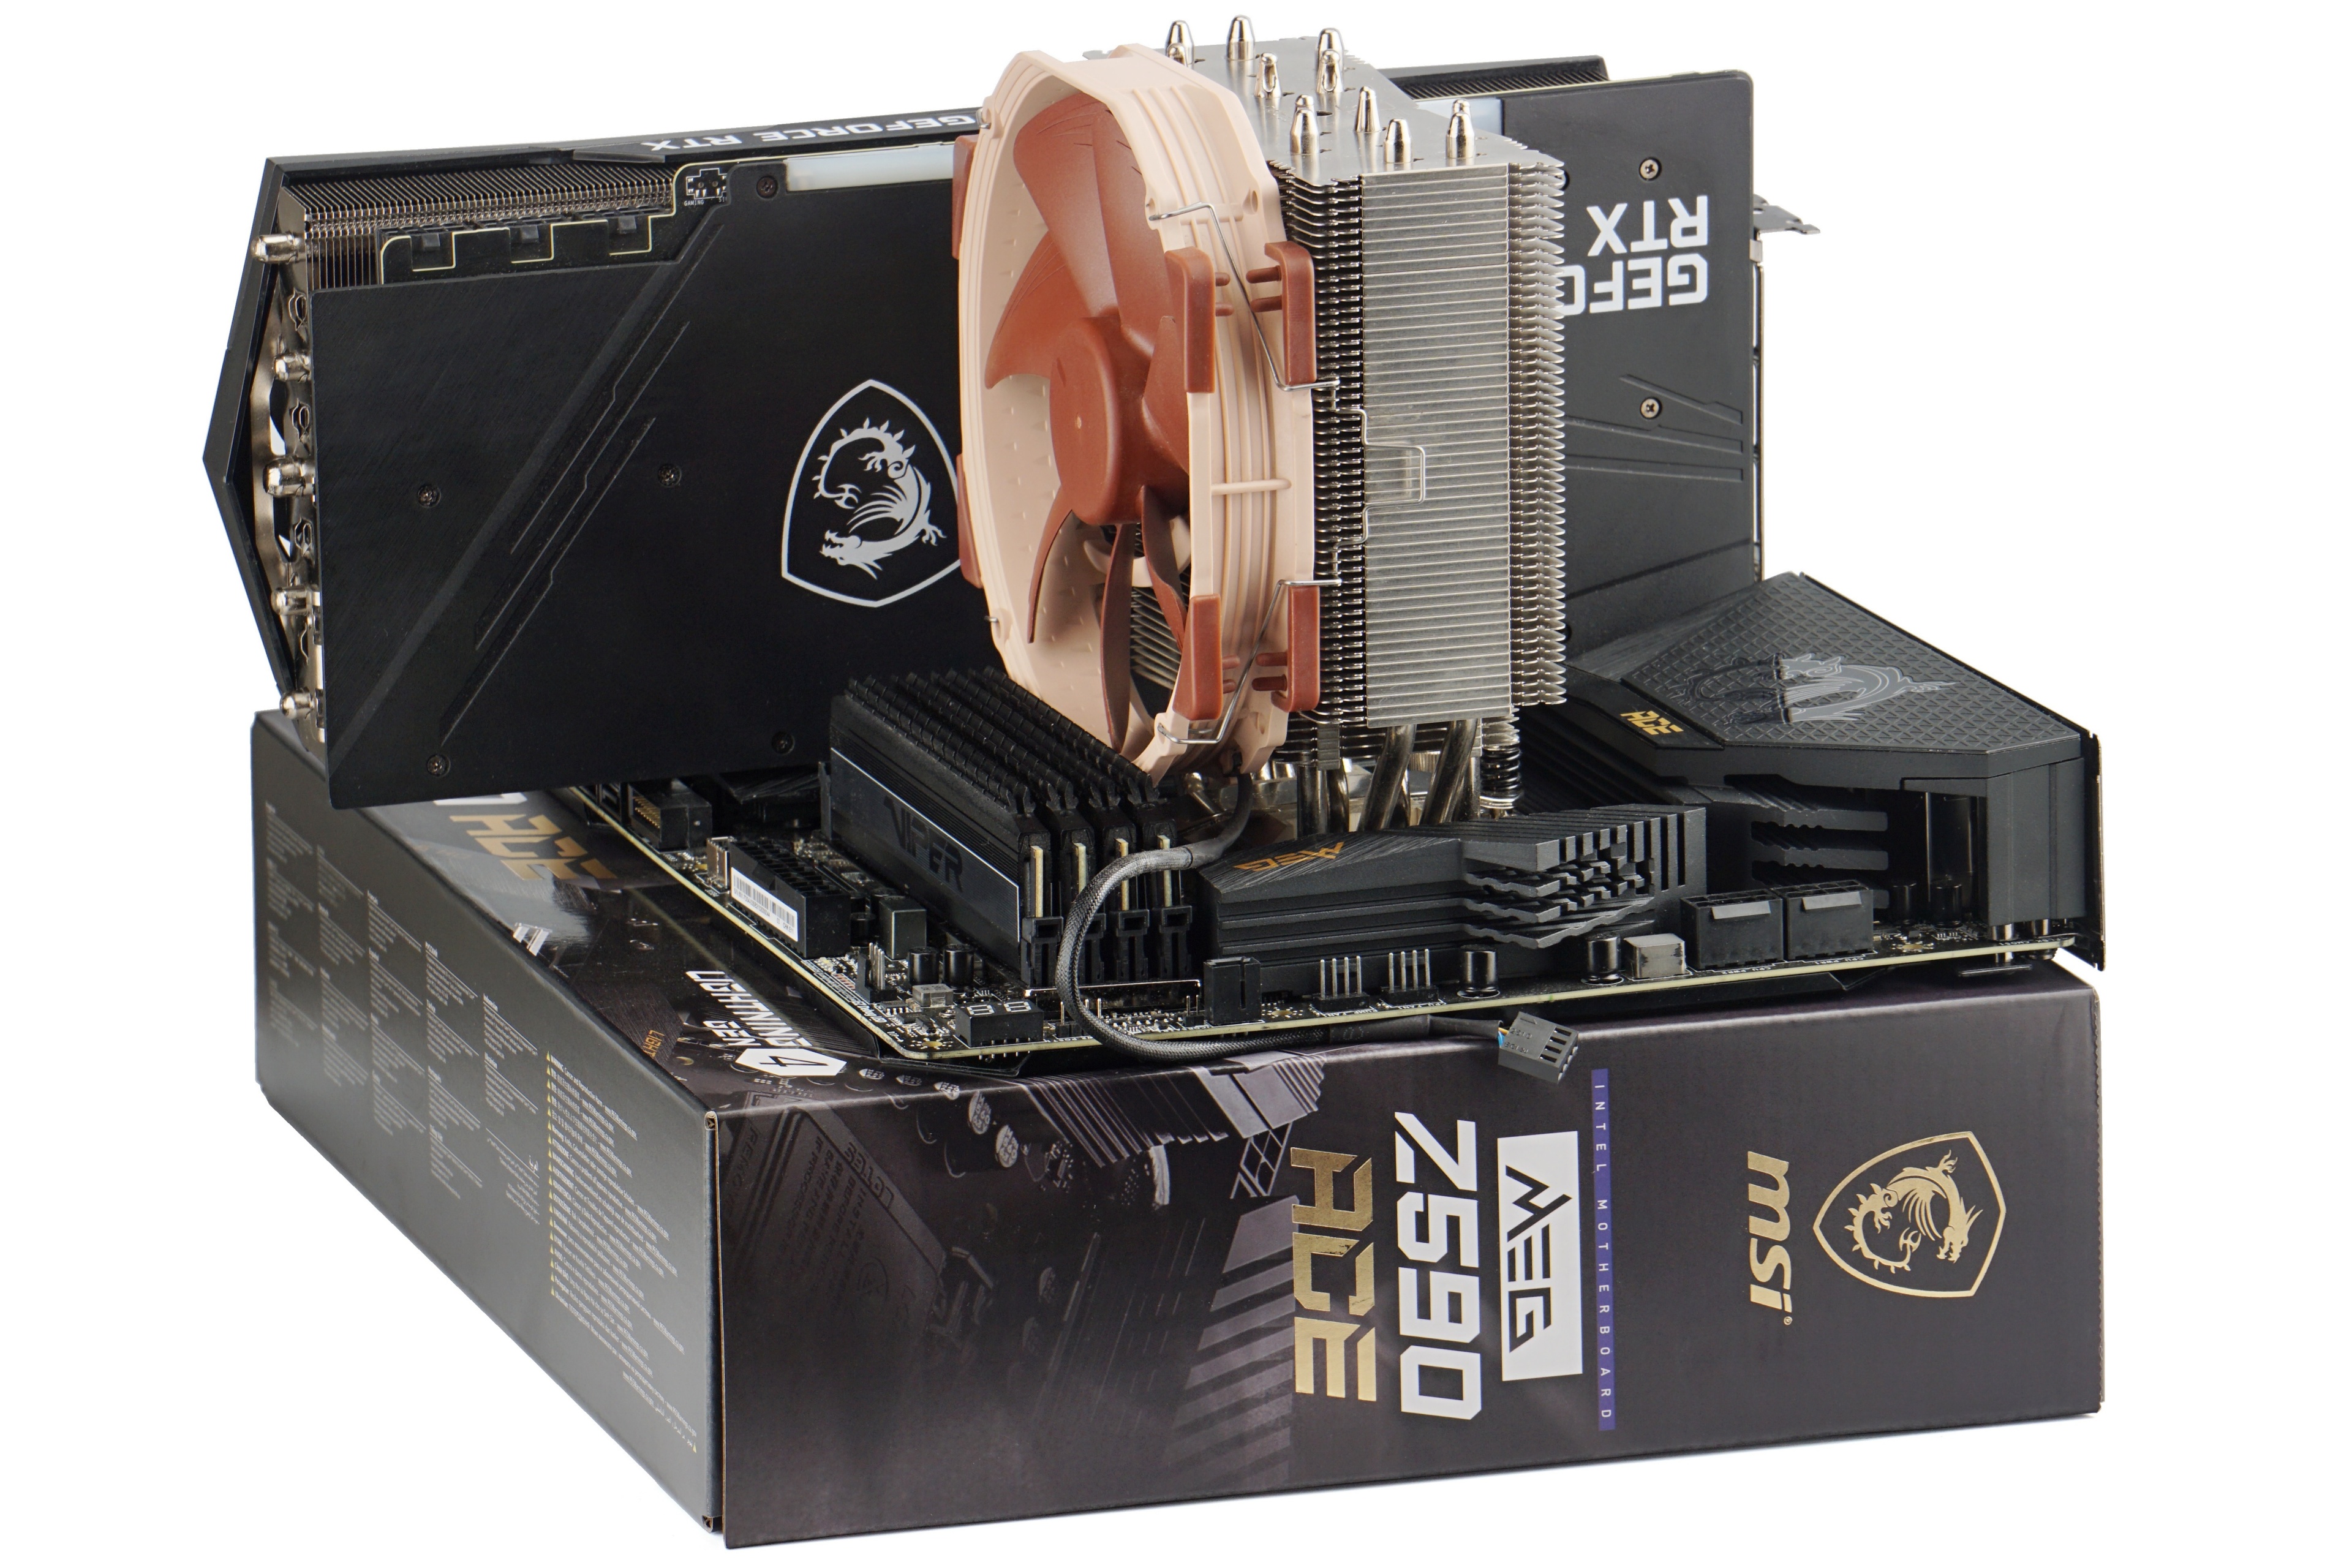
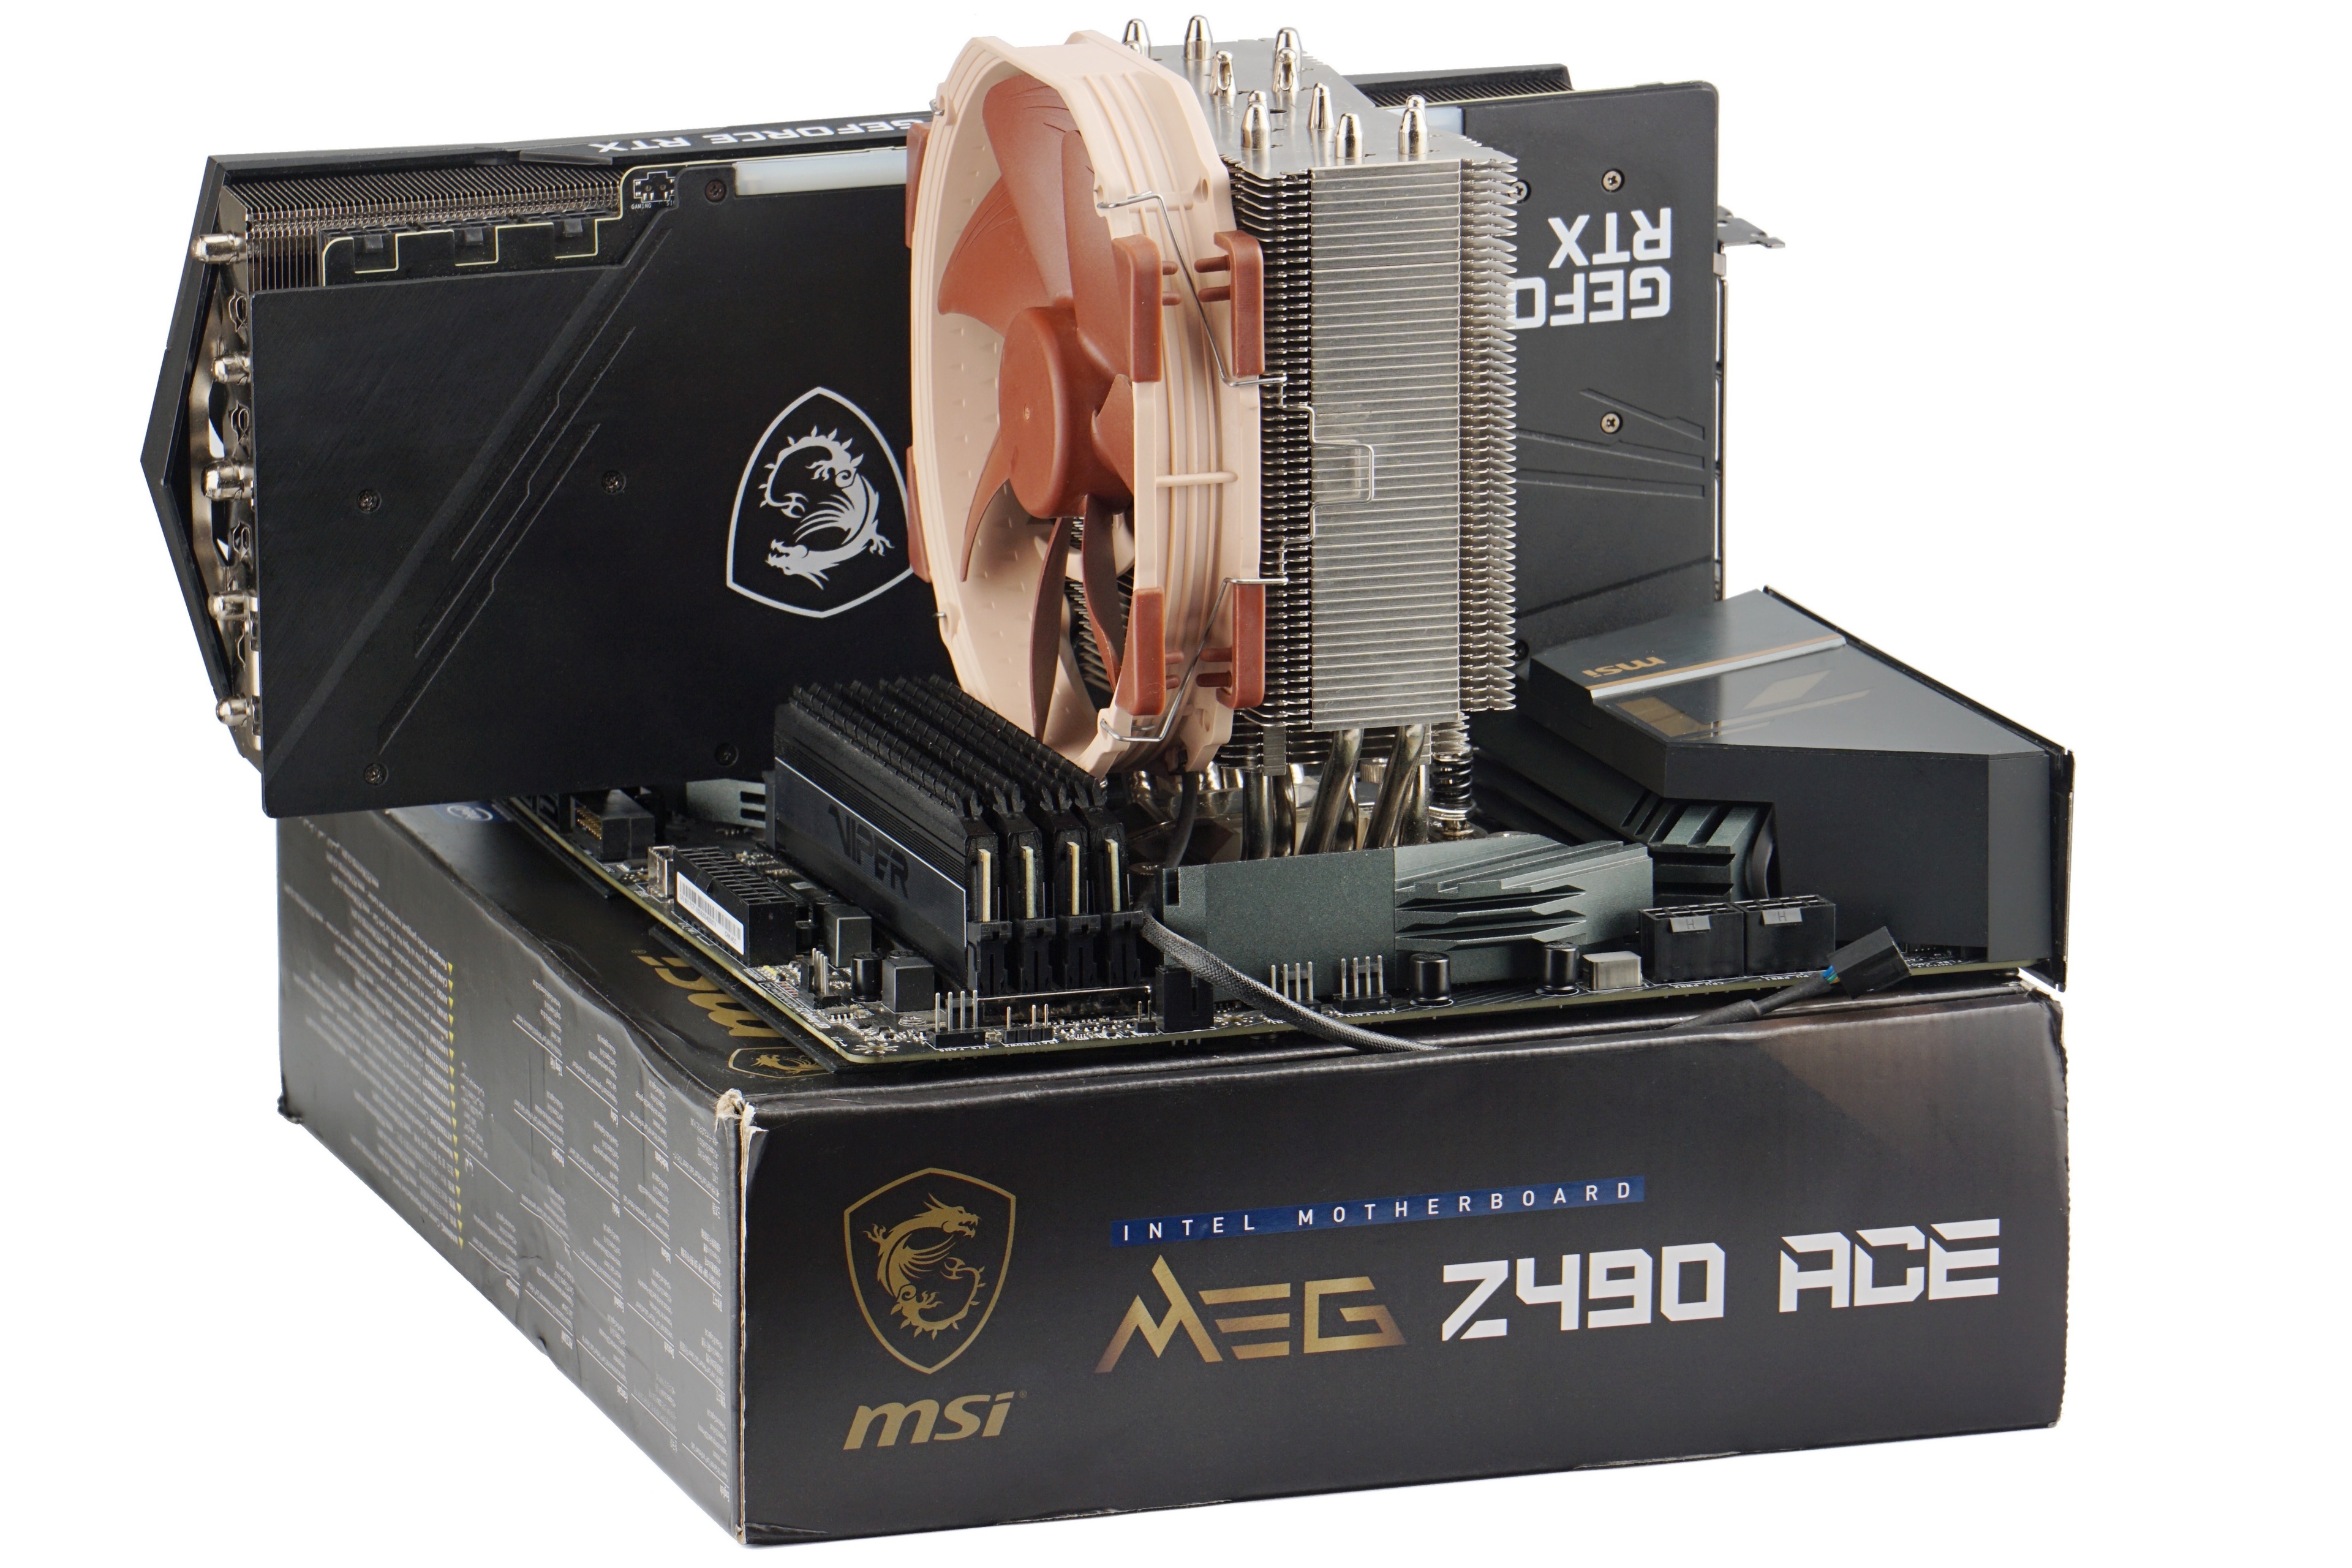
| CPU cooler | Noctua NH-U14S@12 V |
| Thermal compound | Noctua NT-H2 |
| Motherboard * | Acc. to processor: ASRock B650E Taichi, MSI MEG X670E Ace, Asus ROG Strix Z790-E Gaming WiFi, MEG X570 Ace, MEG Z690 Unify, MAG Z690 Tomahawk WiFi DDR4, Z590 Ace, MSI MEG X570 Ace alebo MSI MEG Z490 Ace |
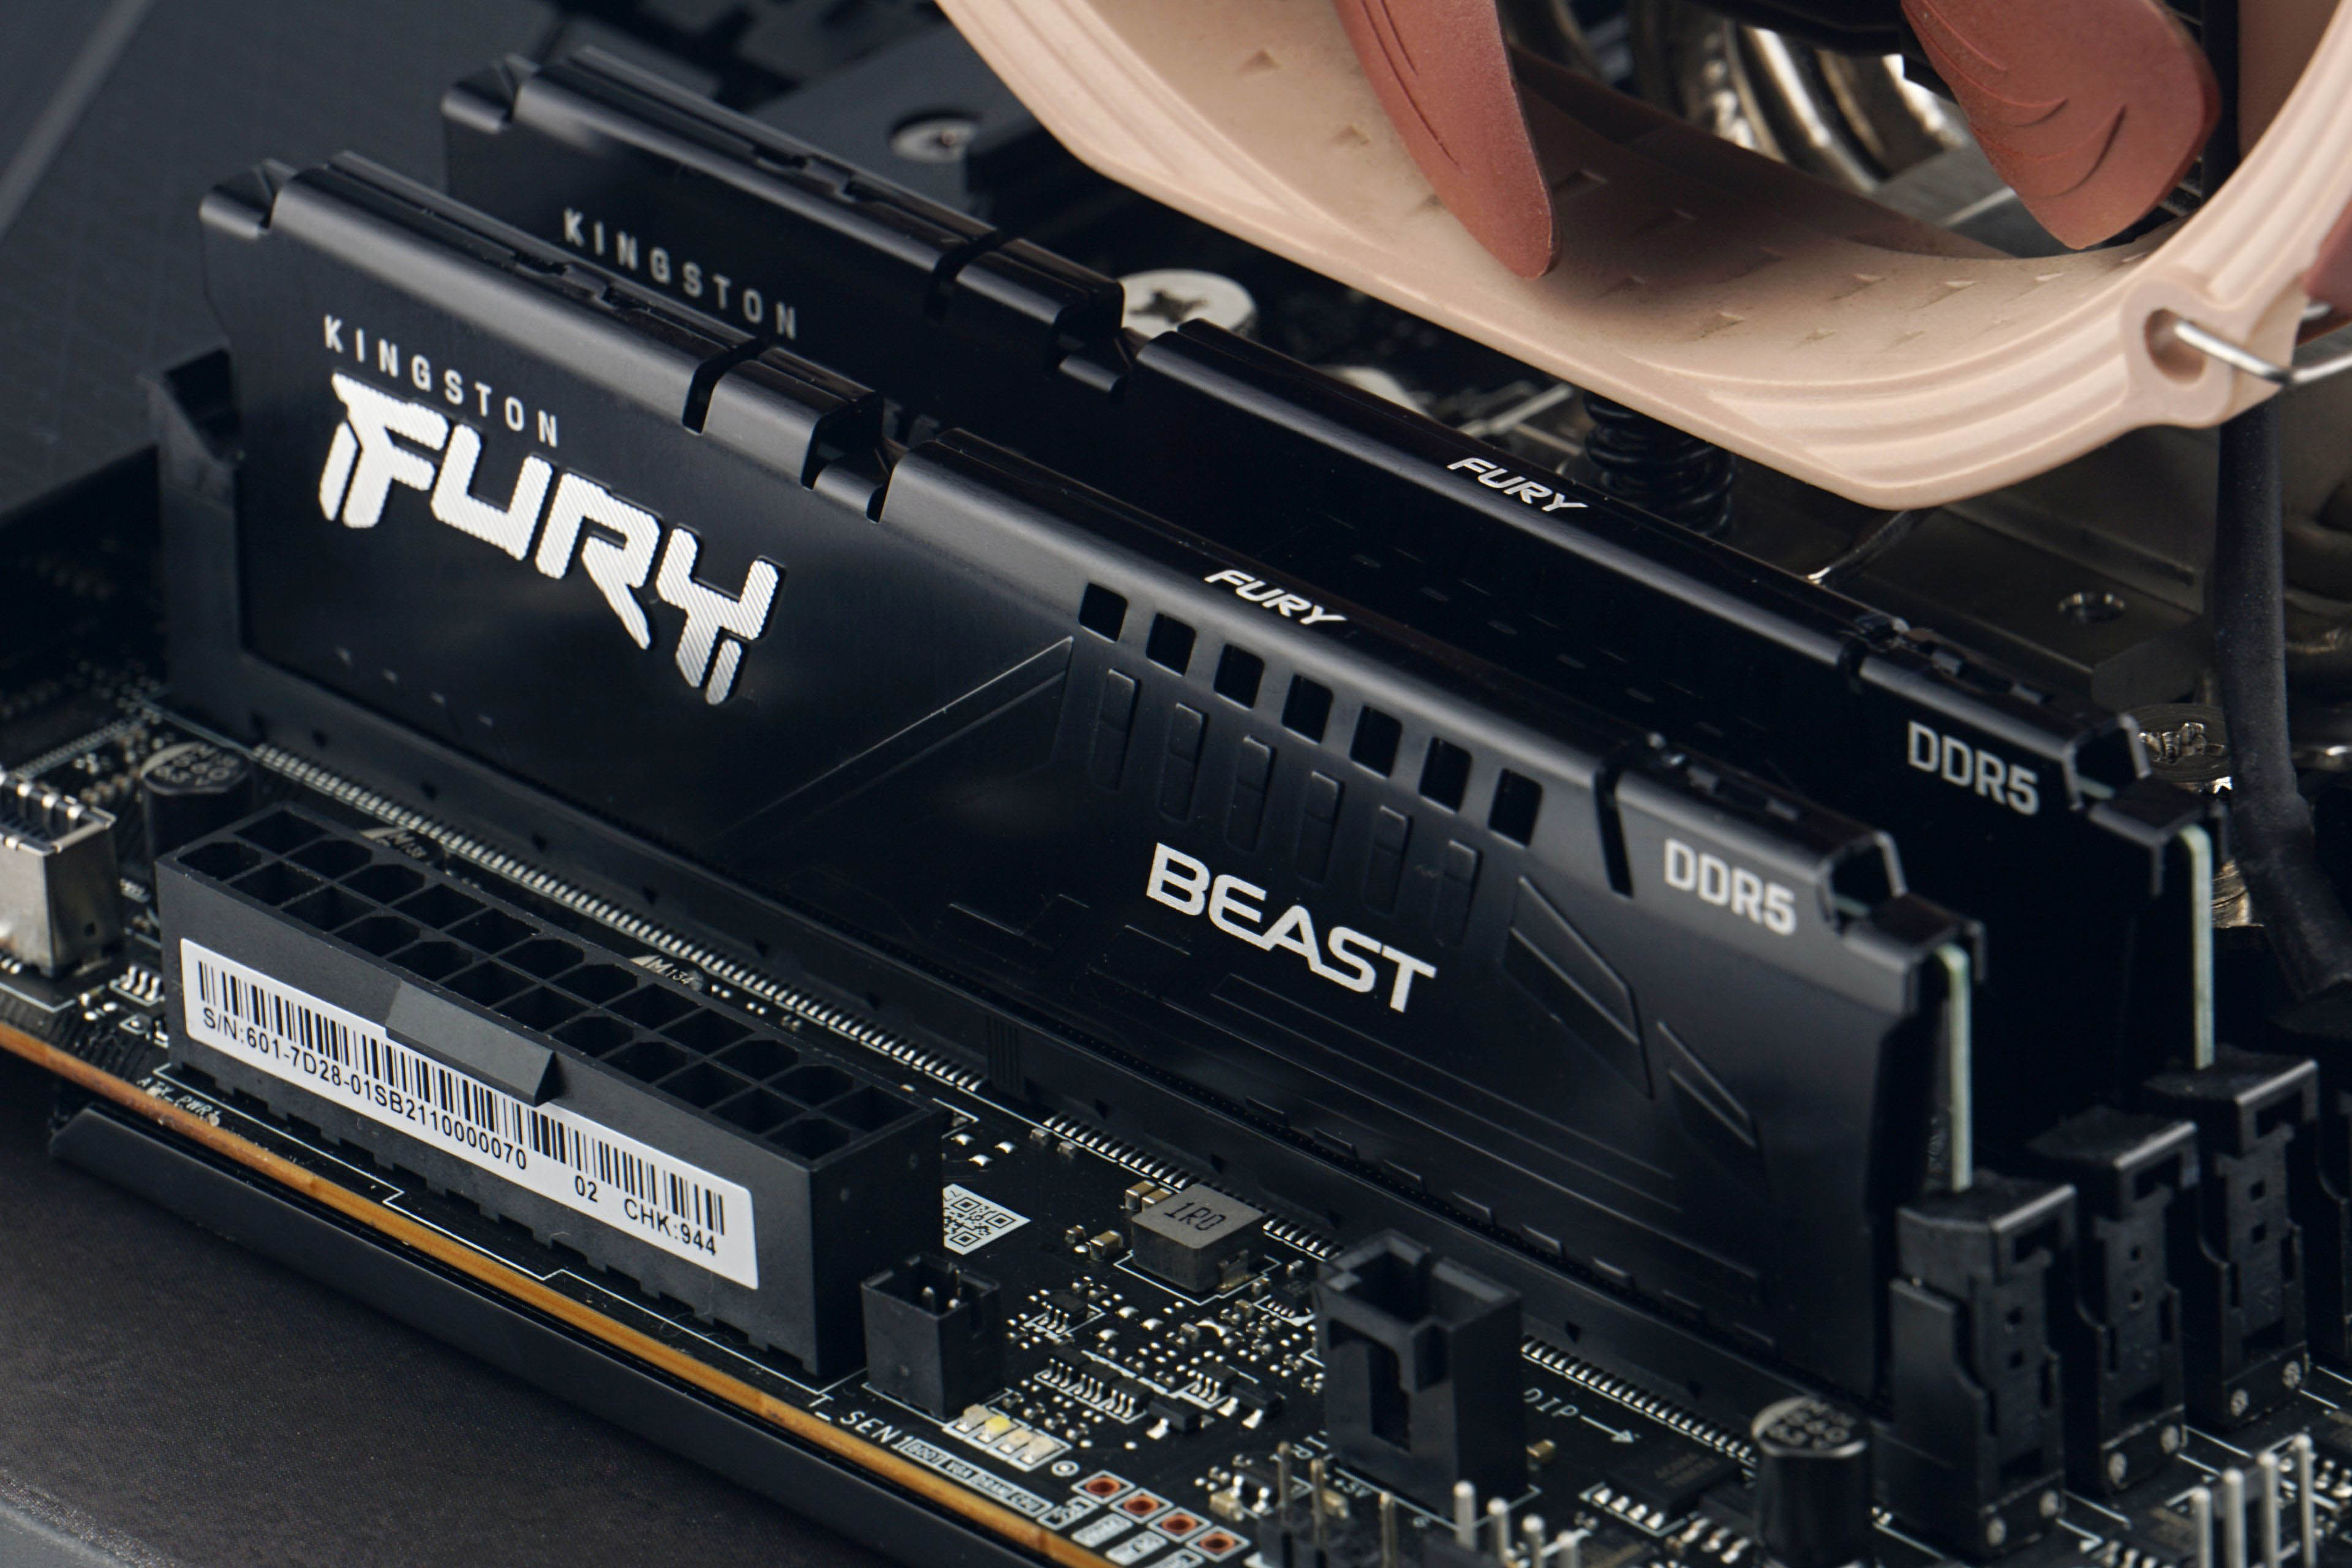
| Memory (RAM) | Acc. to platform: z DDR5 G.Skill Trident Z5 Neo (2× 16 GB, 6000 MHz/CL30) a Kingston Fury Beast (2× 16 GB, 5200 MHz/CL40) a DDR4 Patriot Blackout, (4× 8 GB, 3600 MHz/CL18) |
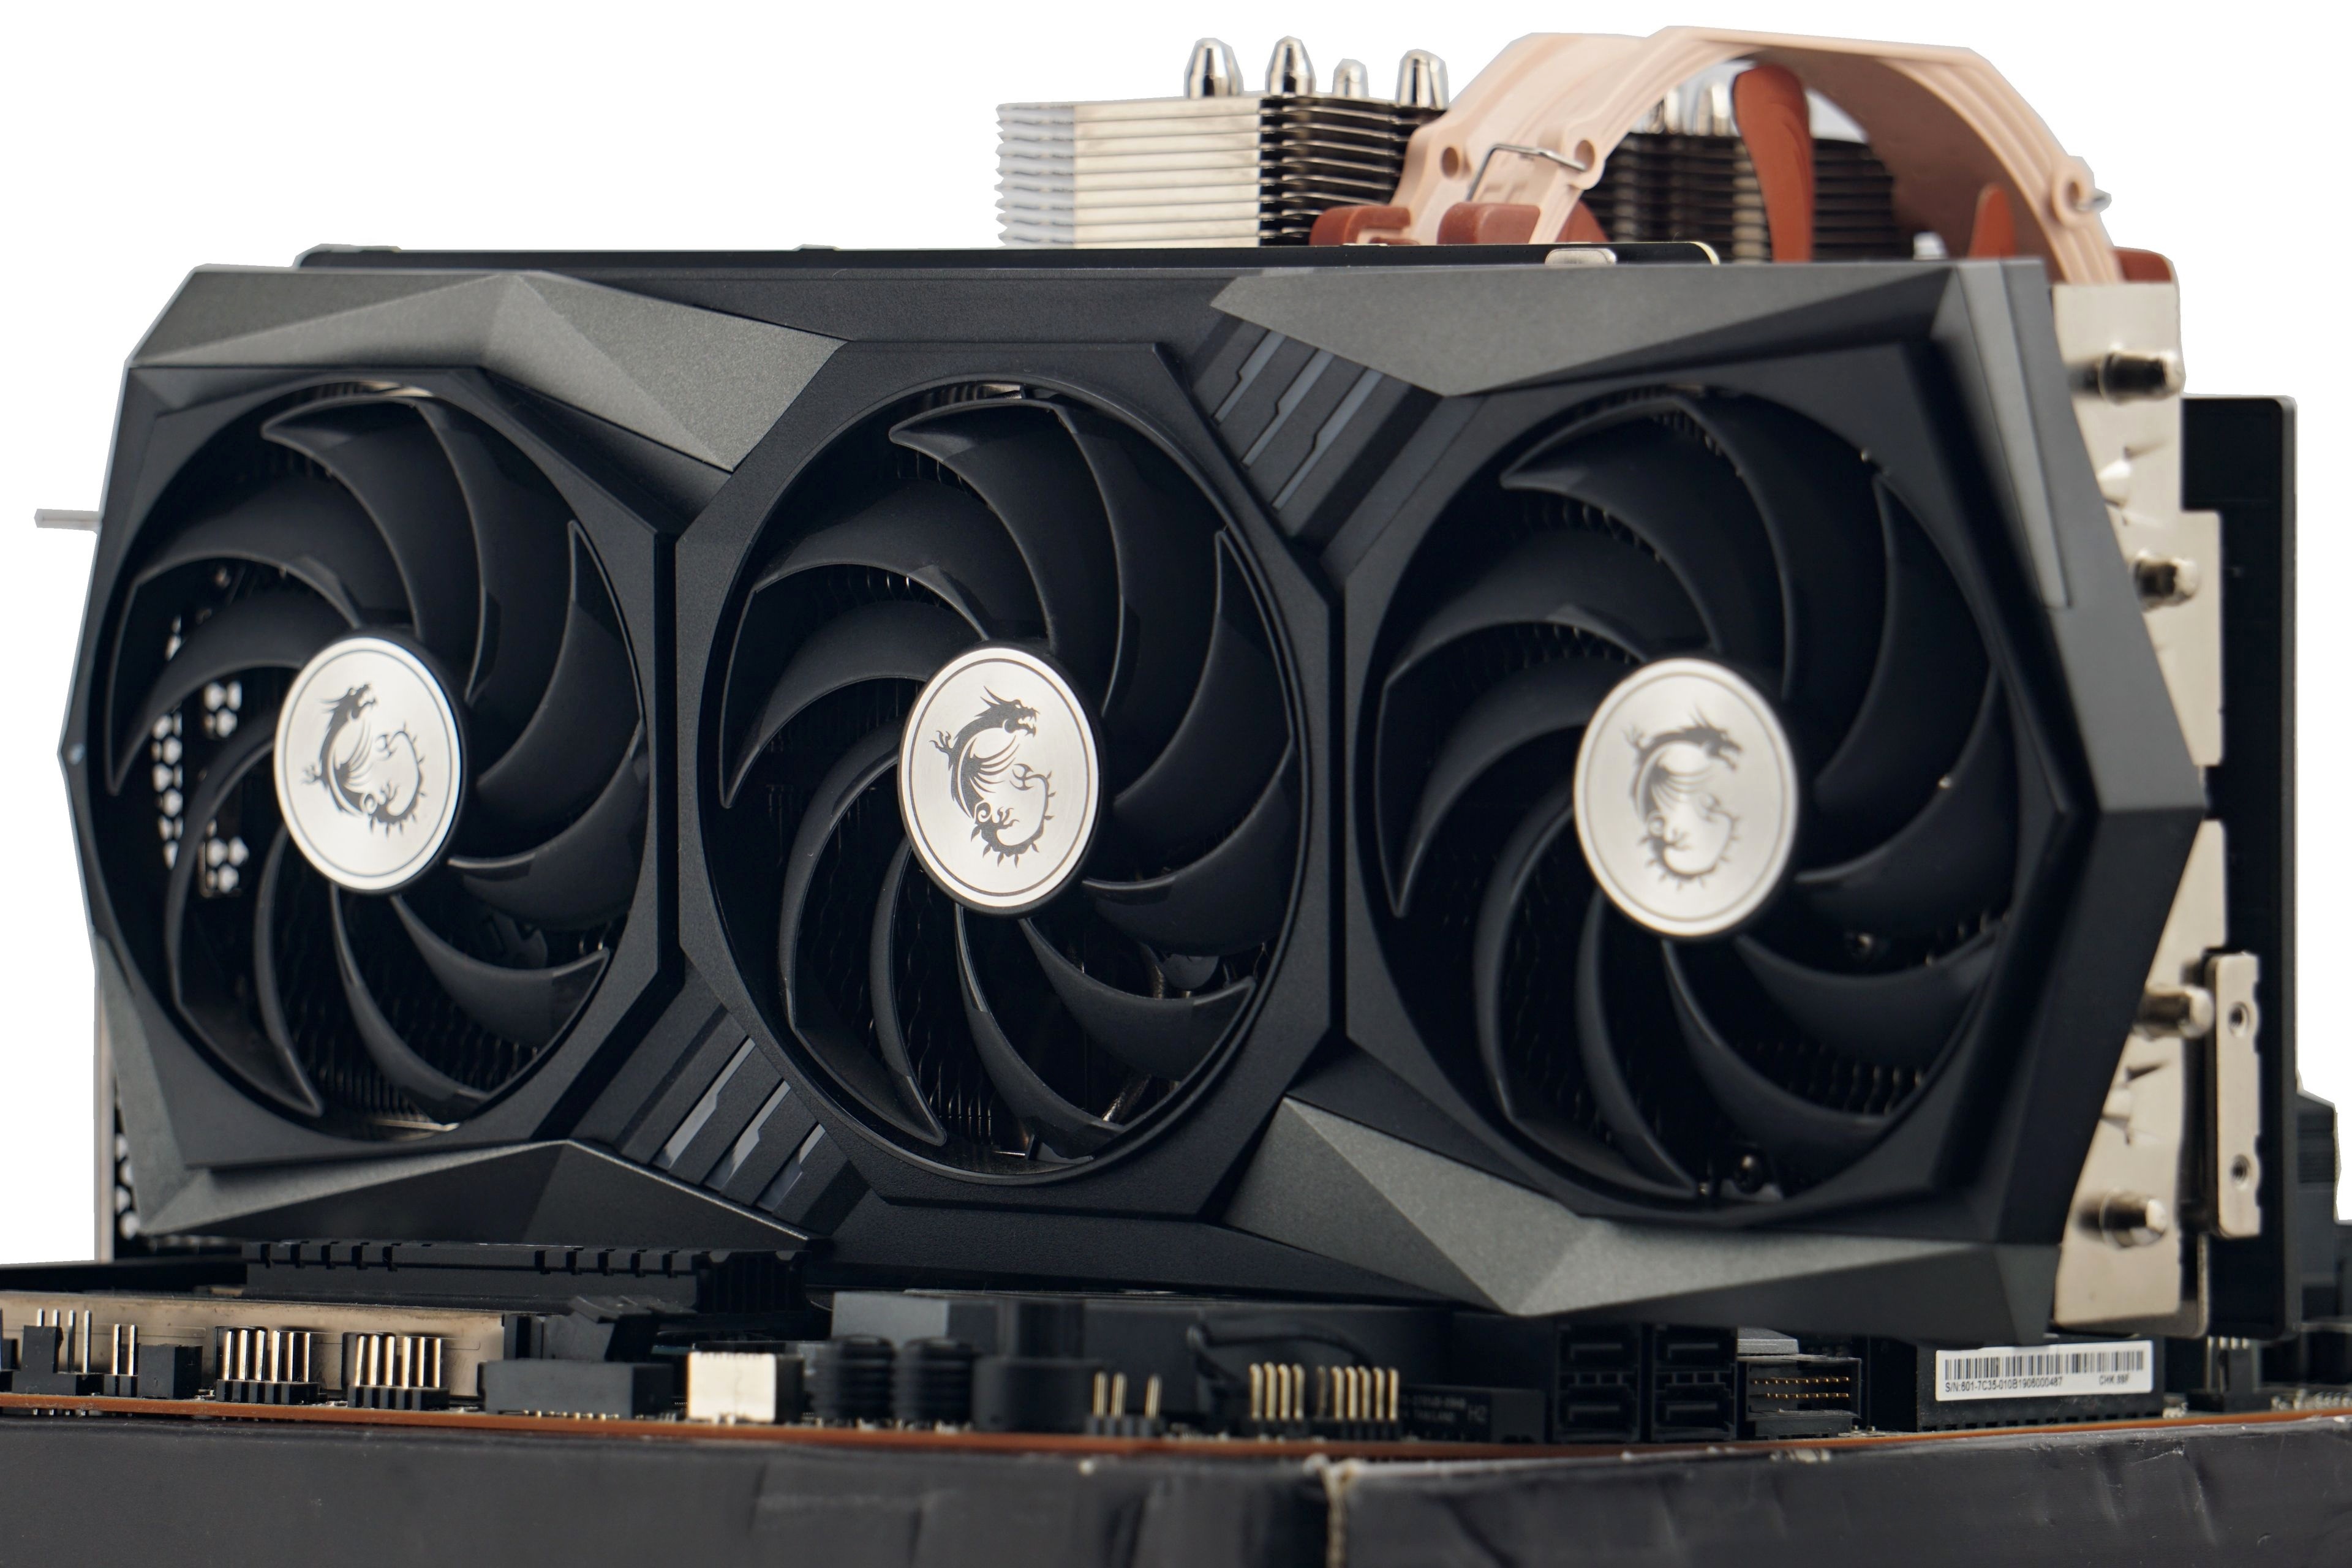
| Graphics card | MSI RTX 3080 Gaming X Trio w/o Resizable BAR |
| SSD | 2× Patriot Viper VPN100 (512 GB + 2 TB) |
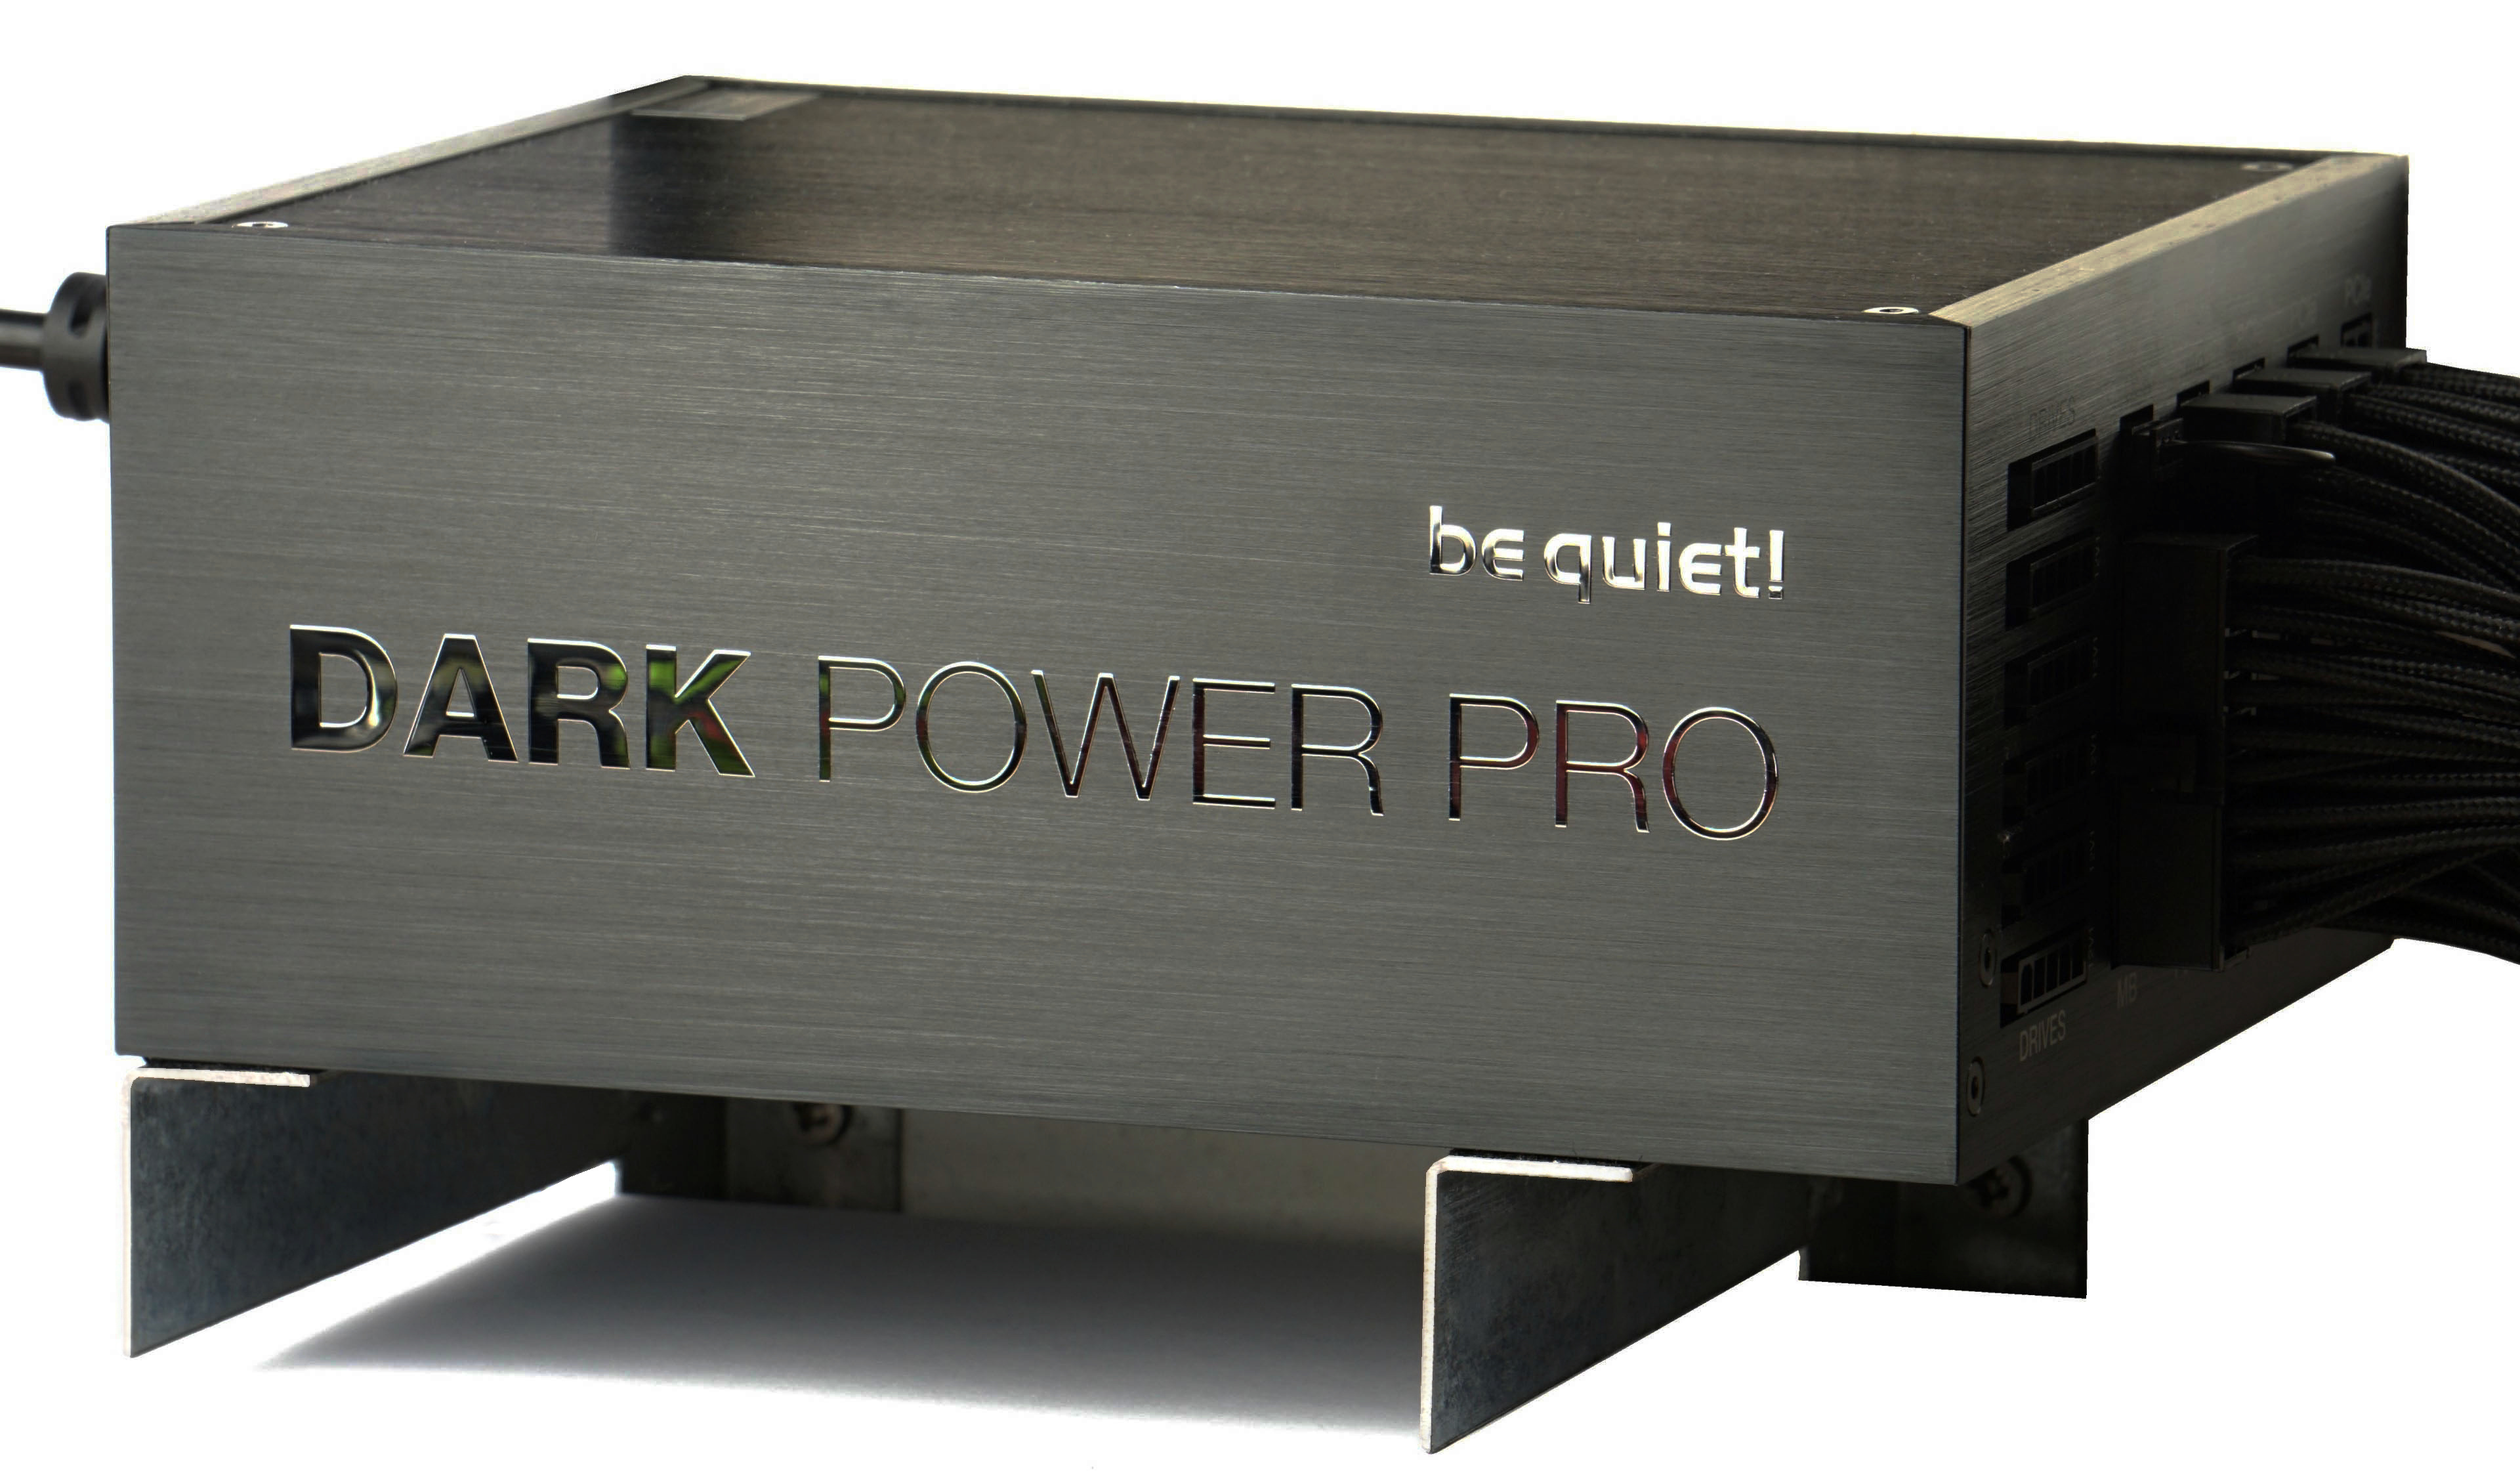
| PSU | BeQuiet! Dark Power Pro 12 (1200 W) |
* We use the following BIOSes on motherboards. For Asus ROG Strix Z790-E Gaming WiFi v0502 – Intel Raptor Lake/v1501 – Intel Raptor Lake Refresh, MSI MEG X670E Ace v1.10NPRP, for MEG X570 Ace v1E, for MEG Z690 Unify v10, for MAG Z690 Tomahawk WiFi DDR4 v11, for MEG Z590 Ace v1.14 and for MEG Z490 Ace v17.
Note: The graphics drivers we use are Nvidia GeForce 466.77 and the Windows 10 OS build is 19045 at the time of testing.
Processors of other platforms are tested on MSI MEG Z690 Unify, MAG Z490 Tomahawk WiFi DDR4, Z590 Ace and Z490 Ace motherboards, MEG Z690 Unify (all Intel) and MEG X570 Ace, MEG X670E Ace (AMD).

On platforms supporting DDR5 memory, we use two different sets of modules. For more powerful processors with an “X” (AMD) or “K” (Intel) in the name, we use the faster G.Skill Trident Z5 Neo memory (2×16 GB, 6000 MHz/CL30). In the case of cheaper processors (without X or K at the end of the name), the slower Kingston Fury Beast modules (2×16 GB, 5200 MHz/CL40). But this is more or less just symbolic, the bandwidth is very high for both kits, it is not a bottleneck, and the difference in processor performance is very small, practically negligible, across the differently fast memory kits.
- Contents
- Intel Core i5-14600K in detail
- Methodology: performance tests
- Methodology: how we measure power draw
- Methodology: temperature and clock speed tests
- Test setup
- 3DMark
- Assassin’s Creed: Valhalla
- Borderlands 3
- Counter-Strike: GO
- Cyberpunk 2077
- DOOM Eternal
- F1 2020
- Metro Exodus
- Microsoft Flight Simulator
- Shadow of the Tomb Raider
- Total War Saga: Troy
- Overall gaming performance
- Gaming performance per euro
- PCMark and Geekbench
- Web performance
- 3D rendering: Cinebench, Blender, ...
- Video 1/2: Adobe Premiere Pro
- Video 2/2: DaVinci Resolve Studio
- Graphics effects: Adobe After Effects
- Video encoding
- Audio encoding
- Broadcasting (OBS and Xsplit)
- Photos 1/2: Adobe Photoshop and Lightroom
- Photos 2/2: Affinity Photo, Topaz Labs AI Apps, ZPS X, ...
- (De)compression
- (De)encryption
- Numerical computing
- Simulations
- Memory and cache tests
- Processor power draw curve
- Average processor power draw
- Performance per watt
- Achieved CPU clock speed
- CPU temperature
- Conclusion


What’s up with the power draw curves (page 35)? 14600k is nowhere to be seen there… But it is interesting that both i5-x400 draw pretty much exactly the same power, despite 13600 having 4 e-cores.
The line graphs in chapter 35 are correct for the Core i5-14600K. Thanks for the heads up! Originally we forgot to rewrite the path, but they are always there in the editorial system. They can be found at processor-name-g342 to g346. The whole link looks like this: https://www.hwcooling.net/wp-content/uploads/2023/11/intel-core-i5-14600k-g342.png Of course we will try to get the charts to display correctly in the article, but if you see different ones there, you know about this system. 🙂
When testing the modern powerful CPUs, we run into the problem that it basically pulls all the power it can. So testing is also quite a bit about how much power are we willing to deliver, and how much heat are we able to remove.
Looking at the Cinebench 23MT figure: 14600k lags r7900x by ~10% there. Hence its performance is comparable to 7900 (non-x), or equivalently, 7900x capped at 90W. You do not show 7900 on this graph, but there are other test sites that report its performance being 5-10% below that of the 7900x. But importantly, Ryzen 7900 only pulls half of the power of 14600k.
I would like to understand if intel is actually less power efficient than ryzen. Would it be possible to test 14600k capped to 90W as well? I’d guess it is actually rather similar to ryzen in such a setup, with multi-threaded performance falling somewhere between 7700 and 7900, but I have never seen a test.
The efficiency of equivalent processors when tuned for comparable power draw is very similar. Note in our motherboard tests the comparison of the Core i9-13900K with the R9 7950X with power limits (with Intel’s PL2 at 125 W/”IPL” and AMD’s TDP at 105 W/”AMD Eco”) in a 10-minute pass of Cinebench R23. Sure, it’s not a completely equivalent situation if only because of the short Tau time interval used for Intel from the start with PL2 at 253 W and AMD’s 105-watt TPD means a PPT constant of 142 W, but in the end, the calculated performance per watt is very similar when you divide the CB R23 score by the average power draw of the entire test. Naturally, depending on the board (and its aggressiveness of power supply) it can always be a bit different and the results will also differ depending on the processor used, but after manual tuning all current AMD and Intel processors have the potential to achieve comparable efficiency. Of course, if we take into account the default settings, Intel achieves significantly lower efficiency than competitive AMD processors, but those do it with higher power draw, which isn’t emphasized that much with Ryzens. During gaming load, where all processors have marginal power draw (compared to the power draw at maximum performance), the efficiency across equivalent processors is also fairly even.
And the answer to the question if it would be possible to test the Ci5-14600K at 90 W. Some more extensive tests are certainly beyond our current time possibilities, but if only the result of one or two selected tests would be useful for you, then of course I can measure it. So if you let me know what would be of interest, by Wednesday of next week the latest. Then I will have to test Raptor Lake Refresh and switch to other topics again.