


Methodology: how we measure power draw
In the Raptor Lake Refresh generation, Intel has gone a bit harder and increased the clock speeds in the Core i5 class. This has led to higher application and gaming performance, but by pushing the manufacturing process to its limits, power draw has naturally increased, and with it comes poorer efficiency. The latter may not be that important for someone and the main thing is that the processor can be comfortably operated even with a “normal” cooler.
Methodology: how we measure power draw
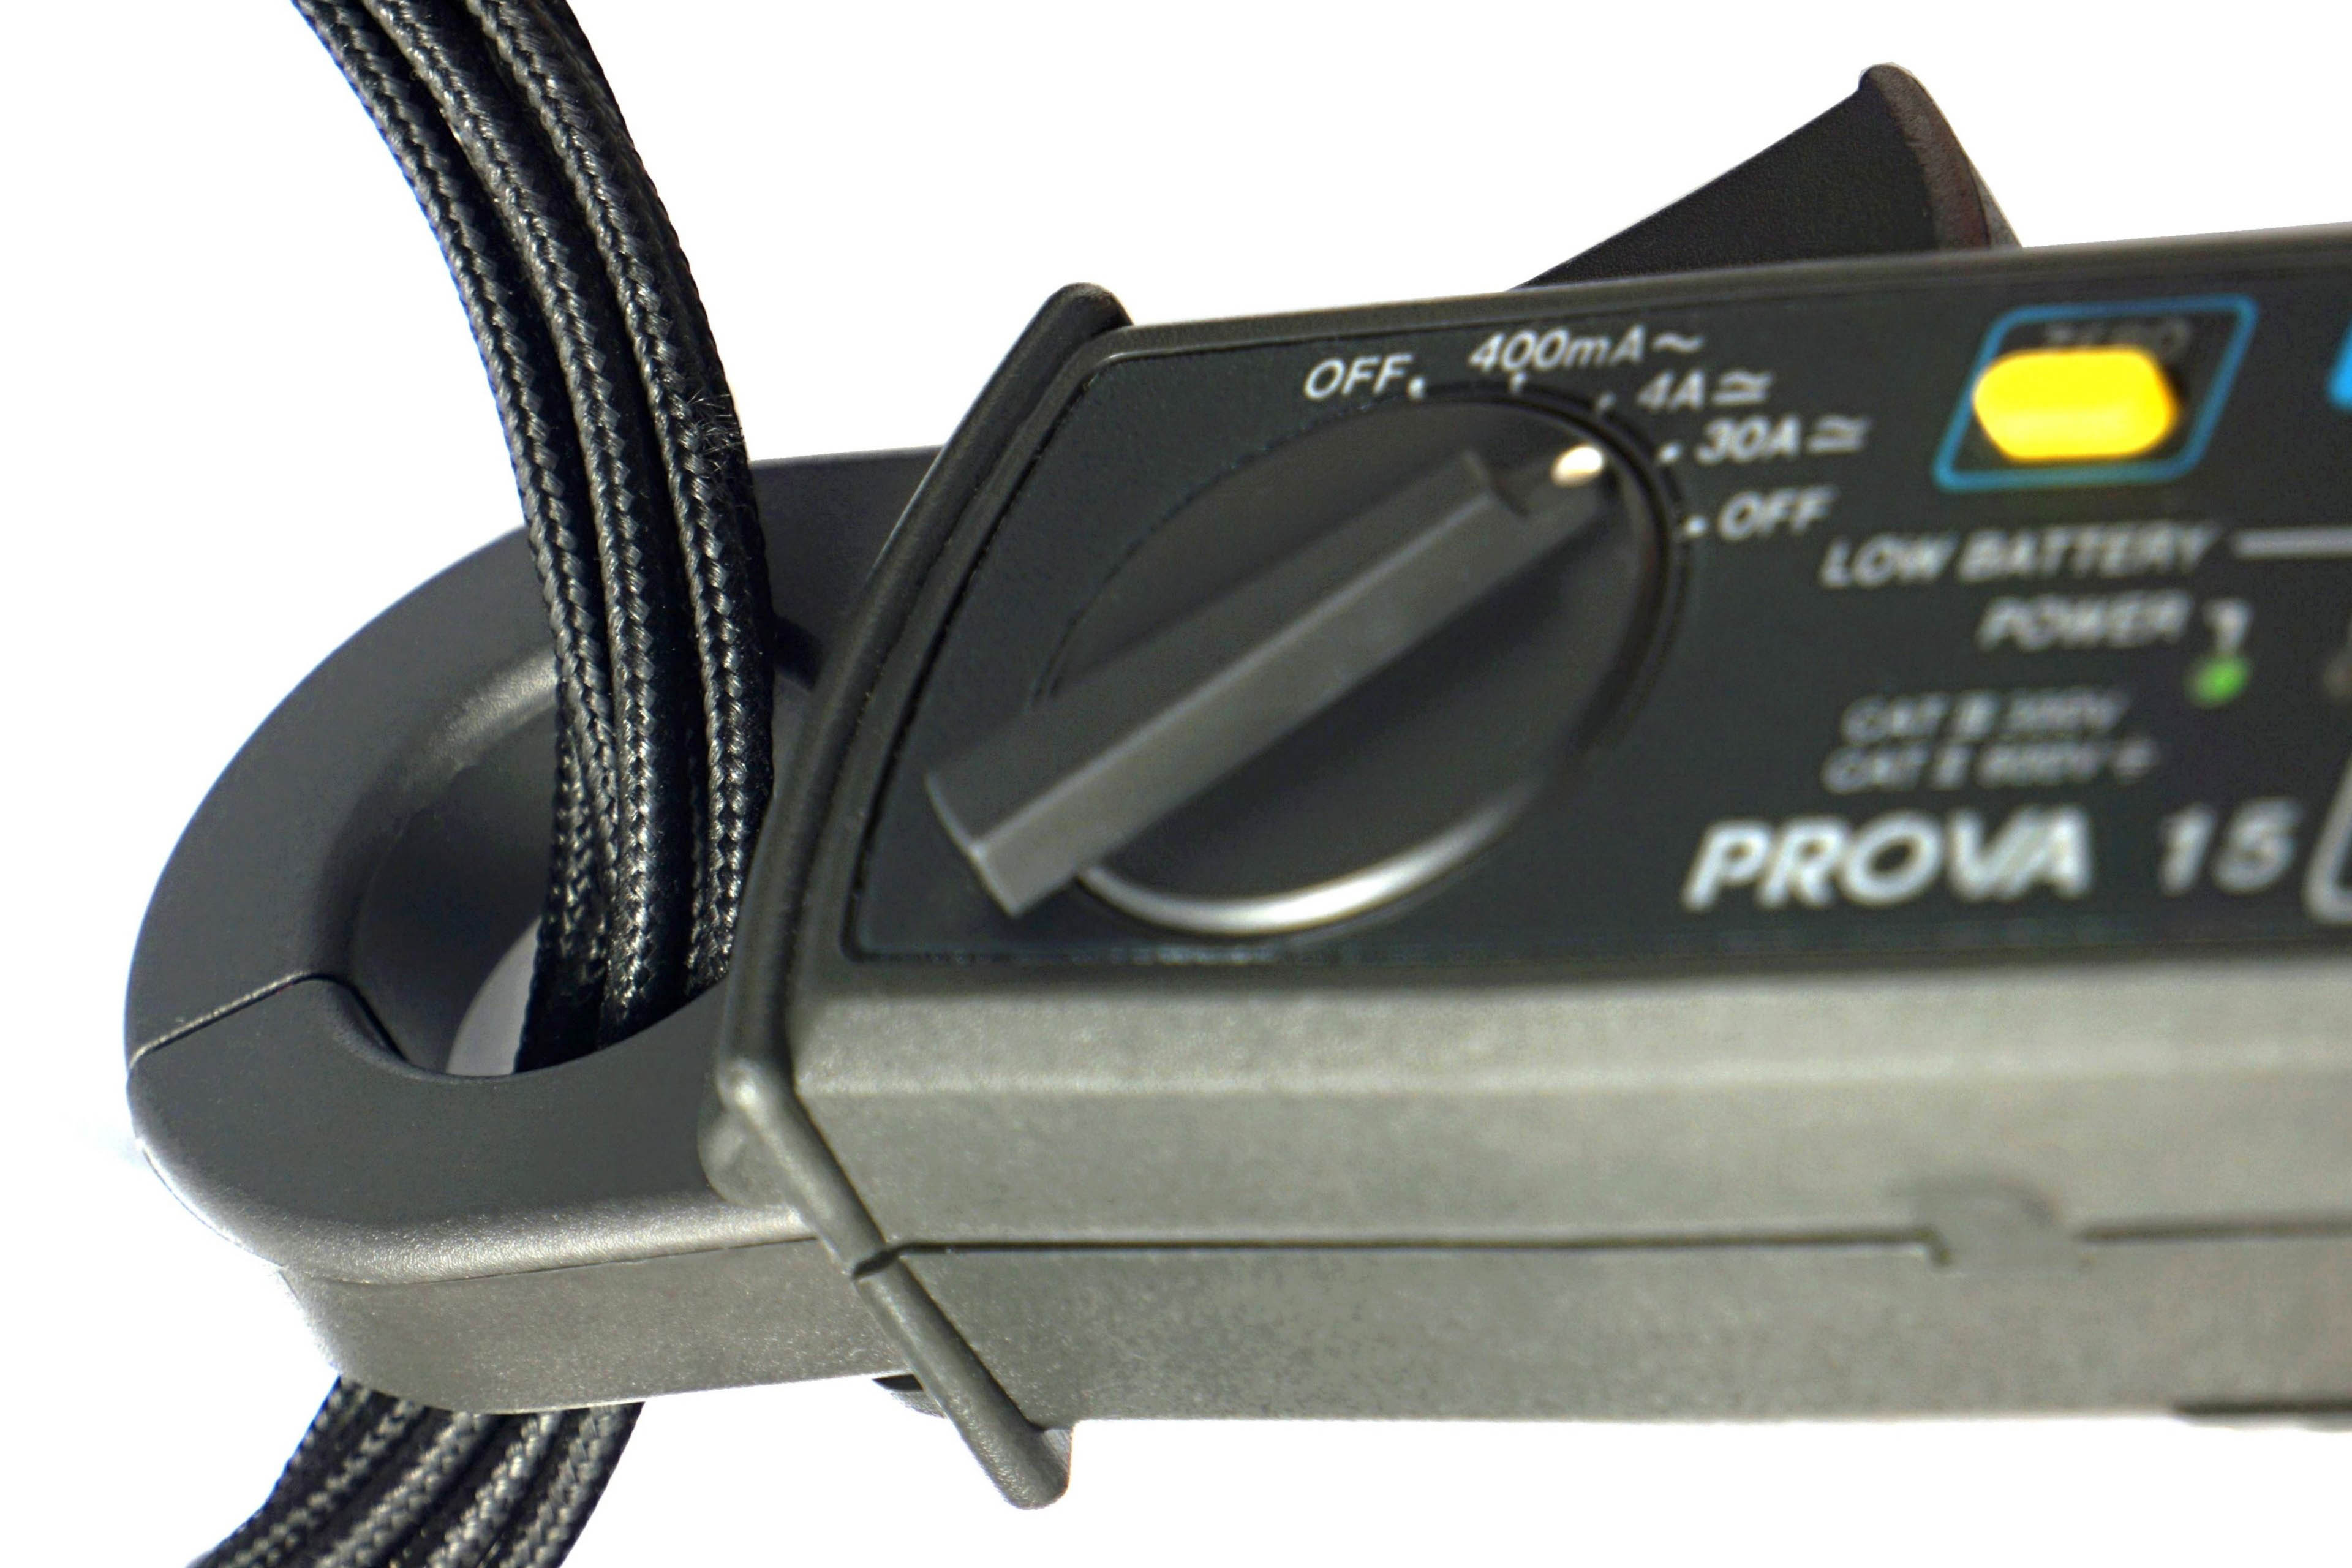
Measuring CPU power consumption is relatively simple, much easier than with graphics cards. All power goes through one or two EPS cables. We also use two to increase the cross-section, which is suitable for high performance AMD processors up to sTR(X)4 or for Intel HEDT, and in fact almost for mainstream processors as well. We have Prova 15 current probes to measure current directly on the wires. This is a much more accurate and reliable way of measuring than relying on internal sensors.
The only limitation of our current probes may be when testing the most powerful processors. These already exceed the maximum range of 30 A, at which high accuracy is guaranteed. For most processors, the range is optimal (even for measuring a lower load, when the probes can be switched to a lower and more accurate range of 4 A), but we will test models with power consumption over 360 W on our own device, a prototype of which we have already built. Its measuring range will no longer be limiting, but for the time being we will be using the Prova probes in the near future.
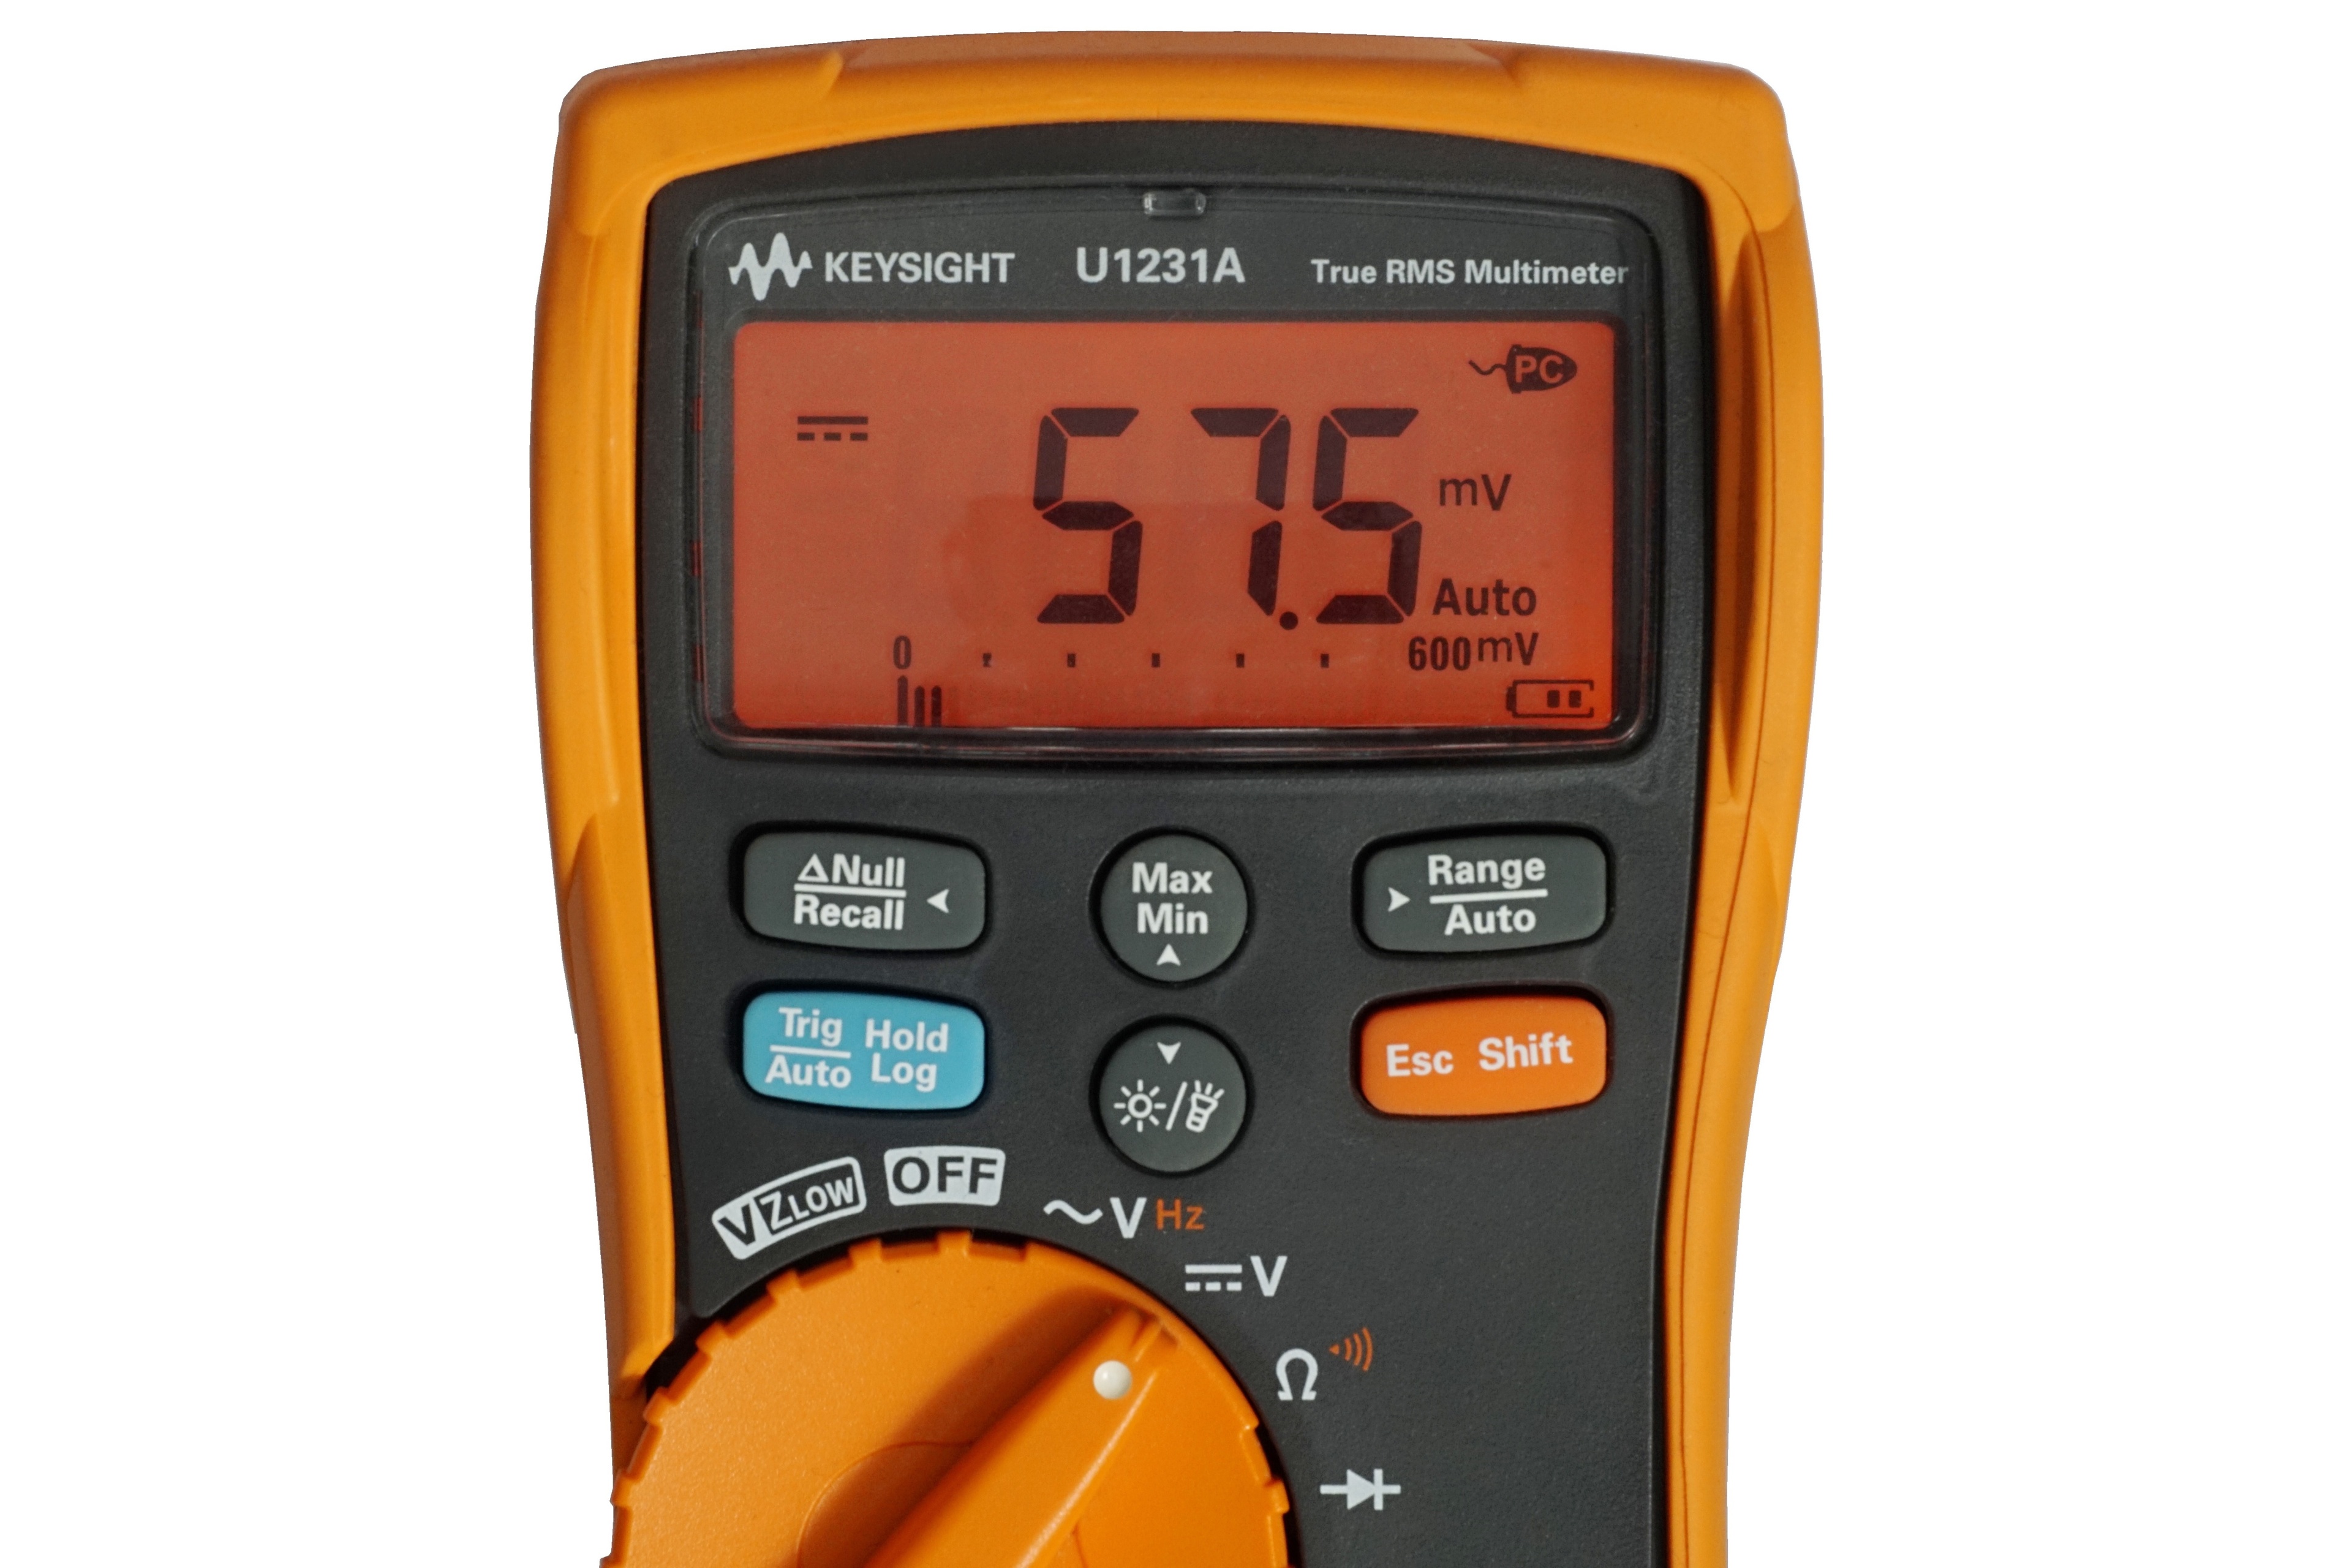
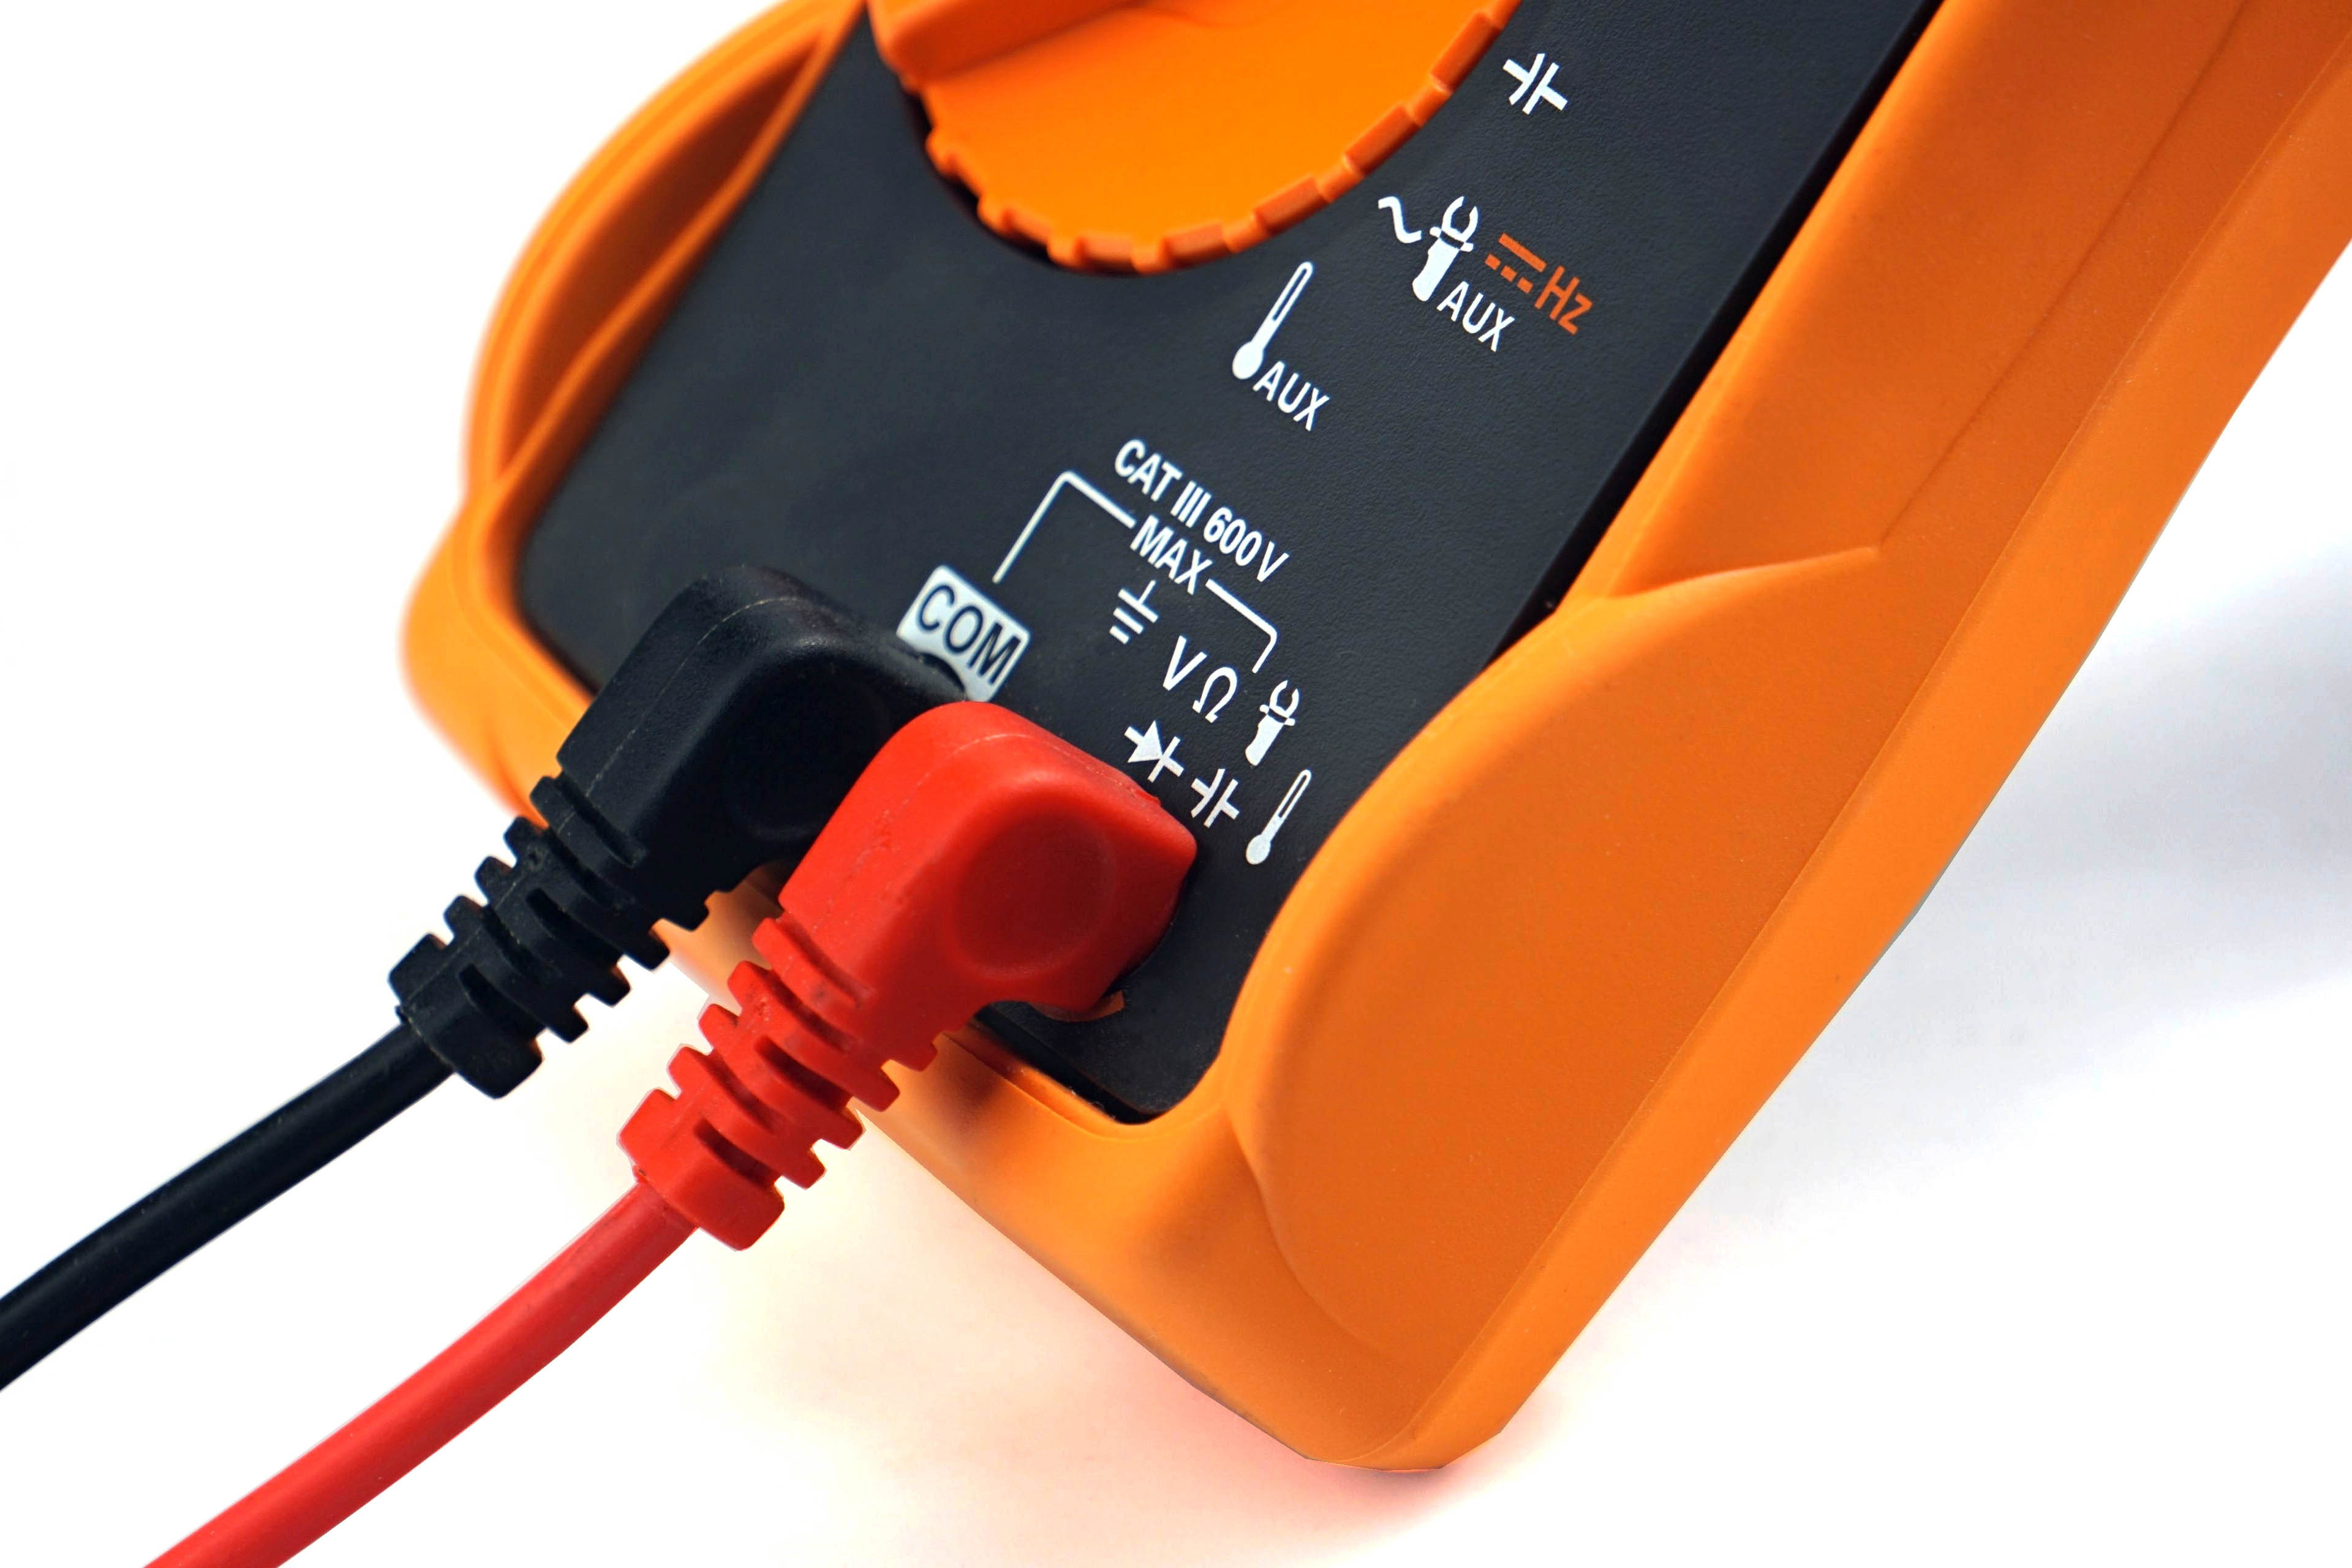
The probes are properly set to zero and connected to a UNI-T UT71E multimeter before each measurement. It records samples of current values during the tests via the IR-USB interface and writes them in a table at one-second intervals. We can then create bar graphs with power consumption patterns. But we always write average values in bar graphs. Measurements take place in various load modes. The lowest represents an idle Windows 10 desktop. This measurement takes place on a system that had been idle for quite some time.
Audio encoding (FLAC) represents a higher load, but processors use only one core or one thread for this. Higher loads, where more cores are involved, are games. We test power consumption in F1 2020, Shadow of the Tomb Raider and Total War Saga: Troy in 1920 × 1080 px. In this resolution, the power consumption is usually the highest or at least similar to that in lower or higher resolutions, where in most cases the CPU power draw rather decreases due to its lower utilization.
Like most motherboard manufacturers, we too ignore the time limit for “Tau”, after which the power consumption is to be reduced from the PL2 boost limit (when it exceeds the TDP) to the TDP/PL1 value, recommended by Intel, in our tests. This means that neither the power draw nor the clock speed after 56 seconds of higher load does not decrease and the performance is kept stable with just small fluctuations. We had been considering whether or not to respect the Tau. In the end, we decided not to because the vast majority of users won’t either, and therefore the results and comparisons would be relatively uninteresting. The solution would be to test with and without a power limit, but this is no longer possible due to time requirements.
We will pay more attention to the behavior of PL2 in motherboard tests, where it makes more sense. We always use motherboards with extremely robust, efficient VRM, so that the losses on MOSFETs distort the measured results as little as possible and the test setups are powered by a high-end 1200 W BeQuiet! Dark Power Pro 12 power supply. It is strong enough to supply every processor, even with a fully loaded GeForce RTX 3080, and at the same time achieves above-standard efficiency even at lower load. For a complete overview of test setup components, see Chapter 5 of this article.
- Contents
- Intel Core i5-14600K in detail
- Methodology: performance tests
- Methodology: how we measure power draw
- Methodology: temperature and clock speed tests
- Test setup
- 3DMark
- Assassin’s Creed: Valhalla
- Borderlands 3
- Counter-Strike: GO
- Cyberpunk 2077
- DOOM Eternal
- F1 2020
- Metro Exodus
- Microsoft Flight Simulator
- Shadow of the Tomb Raider
- Total War Saga: Troy
- Overall gaming performance
- Gaming performance per euro
- PCMark and Geekbench
- Web performance
- 3D rendering: Cinebench, Blender, ...
- Video 1/2: Adobe Premiere Pro
- Video 2/2: DaVinci Resolve Studio
- Graphics effects: Adobe After Effects
- Video encoding
- Audio encoding
- Broadcasting (OBS and Xsplit)
- Photos 1/2: Adobe Photoshop and Lightroom
- Photos 2/2: Affinity Photo, Topaz Labs AI Apps, ZPS X, ...
- (De)compression
- (De)encryption
- Numerical computing
- Simulations
- Memory and cache tests
- Processor power draw curve
- Average processor power draw
- Performance per watt
- Achieved CPU clock speed
- CPU temperature
- Conclusion


What’s up with the power draw curves (page 35)? 14600k is nowhere to be seen there… But it is interesting that both i5-x400 draw pretty much exactly the same power, despite 13600 having 4 e-cores.
The line graphs in chapter 35 are correct for the Core i5-14600K. Thanks for the heads up! Originally we forgot to rewrite the path, but they are always there in the editorial system. They can be found at processor-name-g342 to g346. The whole link looks like this: https://www.hwcooling.net/wp-content/uploads/2023/11/intel-core-i5-14600k-g342.png Of course we will try to get the charts to display correctly in the article, but if you see different ones there, you know about this system. 🙂
When testing the modern powerful CPUs, we run into the problem that it basically pulls all the power it can. So testing is also quite a bit about how much power are we willing to deliver, and how much heat are we able to remove.
Looking at the Cinebench 23MT figure: 14600k lags r7900x by ~10% there. Hence its performance is comparable to 7900 (non-x), or equivalently, 7900x capped at 90W. You do not show 7900 on this graph, but there are other test sites that report its performance being 5-10% below that of the 7900x. But importantly, Ryzen 7900 only pulls half of the power of 14600k.
I would like to understand if intel is actually less power efficient than ryzen. Would it be possible to test 14600k capped to 90W as well? I’d guess it is actually rather similar to ryzen in such a setup, with multi-threaded performance falling somewhere between 7700 and 7900, but I have never seen a test.
The efficiency of equivalent processors when tuned for comparable power draw is very similar. Note in our motherboard tests the comparison of the Core i9-13900K with the R9 7950X with power limits (with Intel’s PL2 at 125 W/”IPL” and AMD’s TDP at 105 W/”AMD Eco”) in a 10-minute pass of Cinebench R23. Sure, it’s not a completely equivalent situation if only because of the short Tau time interval used for Intel from the start with PL2 at 253 W and AMD’s 105-watt TPD means a PPT constant of 142 W, but in the end, the calculated performance per watt is very similar when you divide the CB R23 score by the average power draw of the entire test. Naturally, depending on the board (and its aggressiveness of power supply) it can always be a bit different and the results will also differ depending on the processor used, but after manual tuning all current AMD and Intel processors have the potential to achieve comparable efficiency. Of course, if we take into account the default settings, Intel achieves significantly lower efficiency than competitive AMD processors, but those do it with higher power draw, which isn’t emphasized that much with Ryzens. During gaming load, where all processors have marginal power draw (compared to the power draw at maximum performance), the efficiency across equivalent processors is also fairly even.
And the answer to the question if it would be possible to test the Ci5-14600K at 90 W. Some more extensive tests are certainly beyond our current time possibilities, but if only the result of one or two selected tests would be useful for you, then of course I can measure it. So if you let me know what would be of interest, by Wednesday of next week the latest. Then I will have to test Raptor Lake Refresh and switch to other topics again.