


Methodology: temperature tests
While someone may find the RX 7900 XT graphics card to be the most attractive within its price range, another may see the RTX 4070 Ti in that position. And both are right, they might just disagree on priorities. Outside of ray-tracing graphics, the Radeon is even attacking the RTX 4080. Admittedly this is at the expense of, say, worse technological balance and also worse power efficiency, but if someone doesn’t appreciate GeForce’s strengths…
Methodology: temperature tests
We’re also bringing you temperature tests. You are at HWCooling after all. However, in order to make it sensible at all to monitor temperatures on critical components not only of the graphics card, but anything in the computer, it is important to simulate a real computer case environment with healthy air circulation. The overall behavior of the graphics card as such then follows from this. In many cases, an open bench-table is inappropriate and results can be distorted. Therefore, during all, not only heat tests, but also measurement of consumption or course of graphics core frequencies, we use a wind tunnel with equilibrium flow.
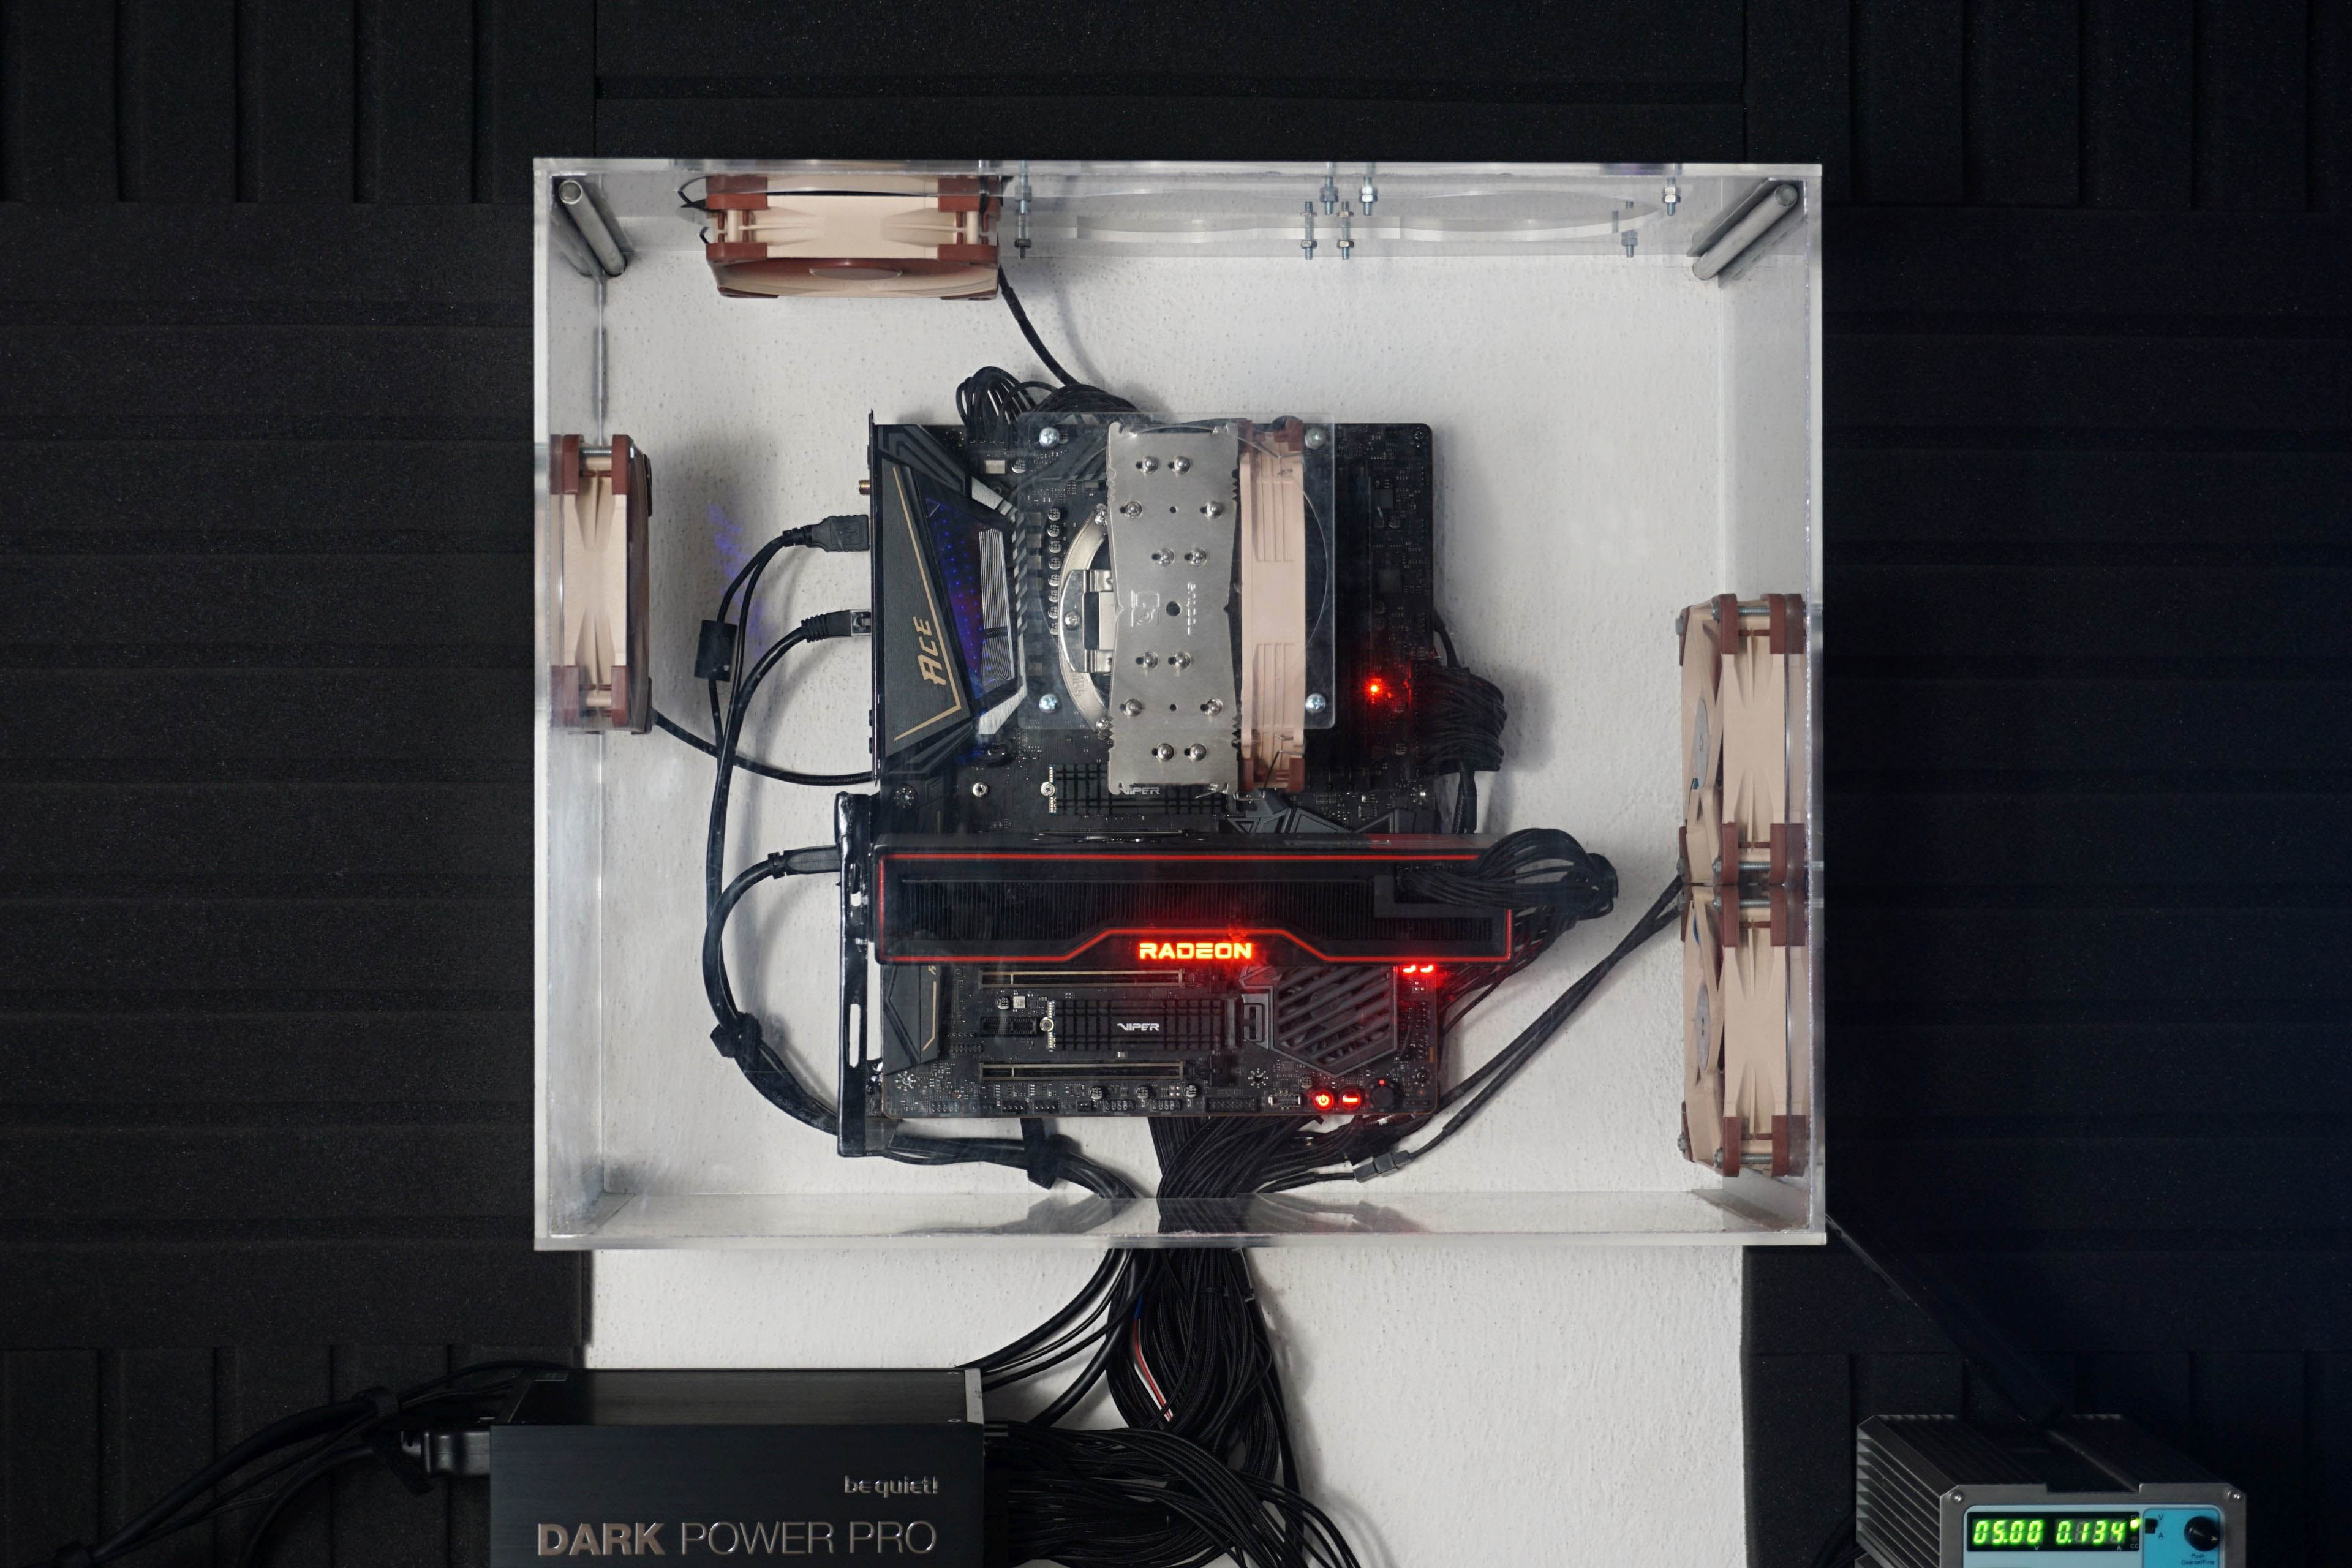
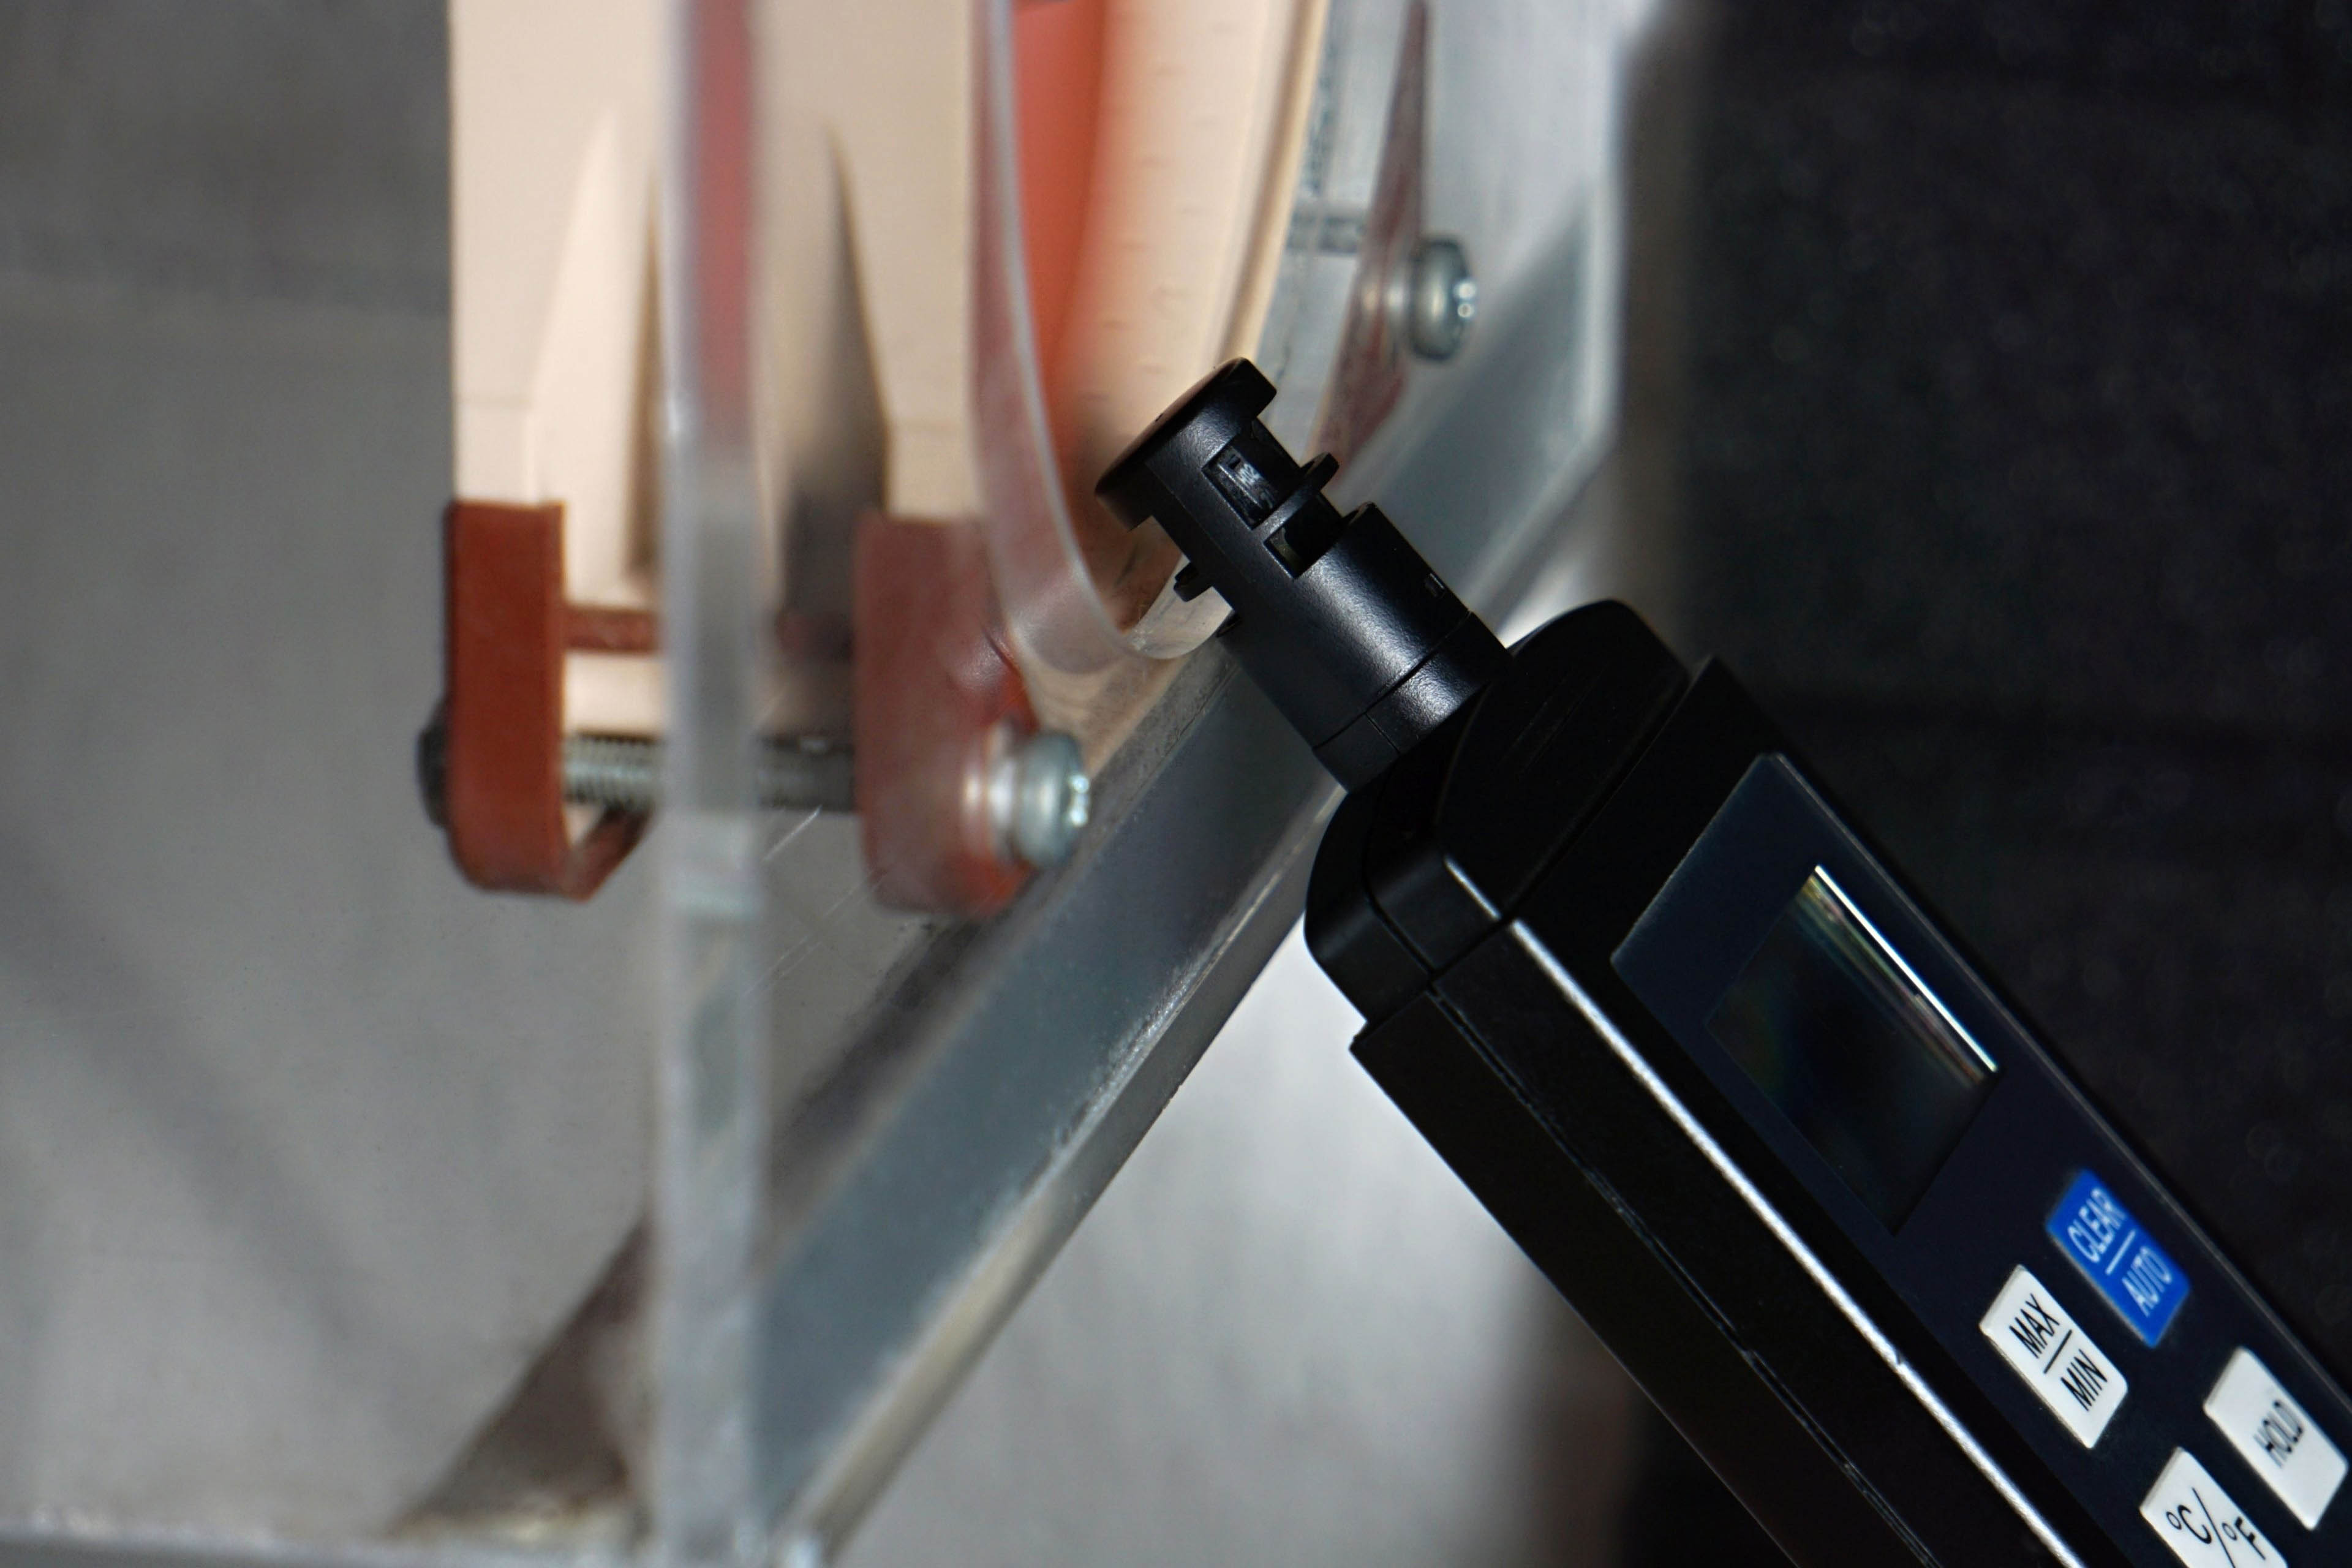
Two Noctua NF-S12A fans are at the inlet and the same number is on the exhaust.When testing various system cooling configurations, this proved to be the most effective solution. The fans are always set to 5 V and the speed corresponds to approx. 550 rpm. The stability of the inlet air is properly controlled during the tests, the temperature being between 21 and 21.3 °C at a humidity of ±40 %.
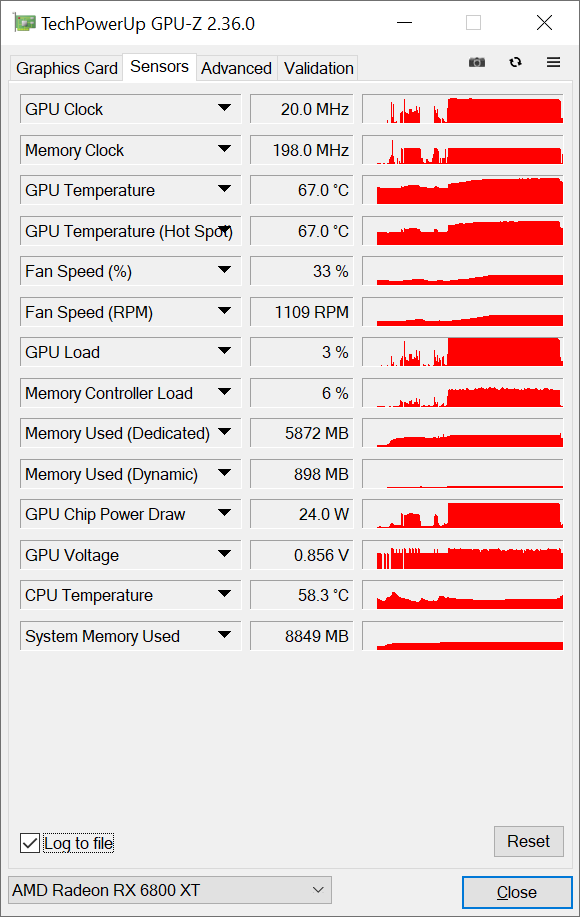
We read the temperature from the internal sensors via GPU-Z. This small, single-purpose application also allows you to record samples from sensors in a table. From the table, it is then easy to create line graphs with waveforms or the average value into bar graphs. We will not use the thermal camera very much here, as most graphics cards have a backplate, which makes it impossible to measure the PCB heating. The key for the heating graphs will be the temperature reading by internal sensors, according to which, after all, the GPU frequency control also takes place. It will always be the heating of the graphics core, and if the sensors are also on VRAM and VRM, we will extract these values into the article as well.
- Contents
- Sapphire RX 7900 XT Pulse in detail
- Parameter chart
- Methodology: performance tests
- Methodology: how we measure power draw
- Methodology: noise and sound measurement
- Methodology: temperature tests
- Test Setup
- 3DMark
- Age of Empires II: DE
- Assassin’s Creed: Valhalla
- Battlefield V
- Battlefield V with DXR
- Borderlands 3
- Control
- Control with DXR
- Counter-Strike: GO
- Cyberpunk 2077
- Cyberpunk 2077 with DXR
- DOOM Eternal
- F1 2020
- FIFA 21
- Forza Horizon 4
- Mafia: DE
- Metro Exodus
- Metro Exodus with DXR
- Microsoft Flight Simulator
- Red Dead Redemption 2 (Vulkan)
- Red Dead Redemption 2 (Dx12)
- Shadow of the Tomb Raider
- Shadow of the Tomb Raider with DXR
- Total War Saga: Troy
- Wasteland 3
- Overall gaming performance per euro
- CompuBench (OpenCL)
- SPECviewperf 2020 and SPECworkstation 3
- FLOPS, IOPS and memory speed tests
- 3D rendering 1/2 (LuxMark a Blender@Cycles)
- 3D rendering 2/2 (Blender@Radeon ProRender and Eevee)
- Photo editing (Adobe Photoshop, Lightroom and Affinity Photo)
- Broadcasting (OBS and Xsplit)
- Password cracking
- GPU clock speed
- GPU and VRAM temperatures
- Net graphics card power draw and performance per watt
- Analysis of 12 V branch power supply (higher load)
- Analysis of 12 V branch power supply (lower load)
- Analysis of 3.3 V branch power supply
- Noise level
- Frequency response of sound
- Conclusion


An interesting thing to look at is a power draw on V-sync 60 or 90 Hz. The 7000 series was obnoxious even compared to 6000 series in this regard, sometimes drawing 2 times the power of Ada GPUs.
Sounds nice, but is there anything to play? I mean, new games. Maybe a Dead Space remaster. What else? OO