Image properties
4K monitors are no longer unusual today. However, when labels like 120 Hz, HDR or FreeSync complement 4K, more than one player will start paying attention. I consider the ROG Strix XG438Q to be one of the most interesting gaming monitors on the market, as it has long been on my personal watchlist, too. Let’s take a look at this oversized breathtaking gaming display.
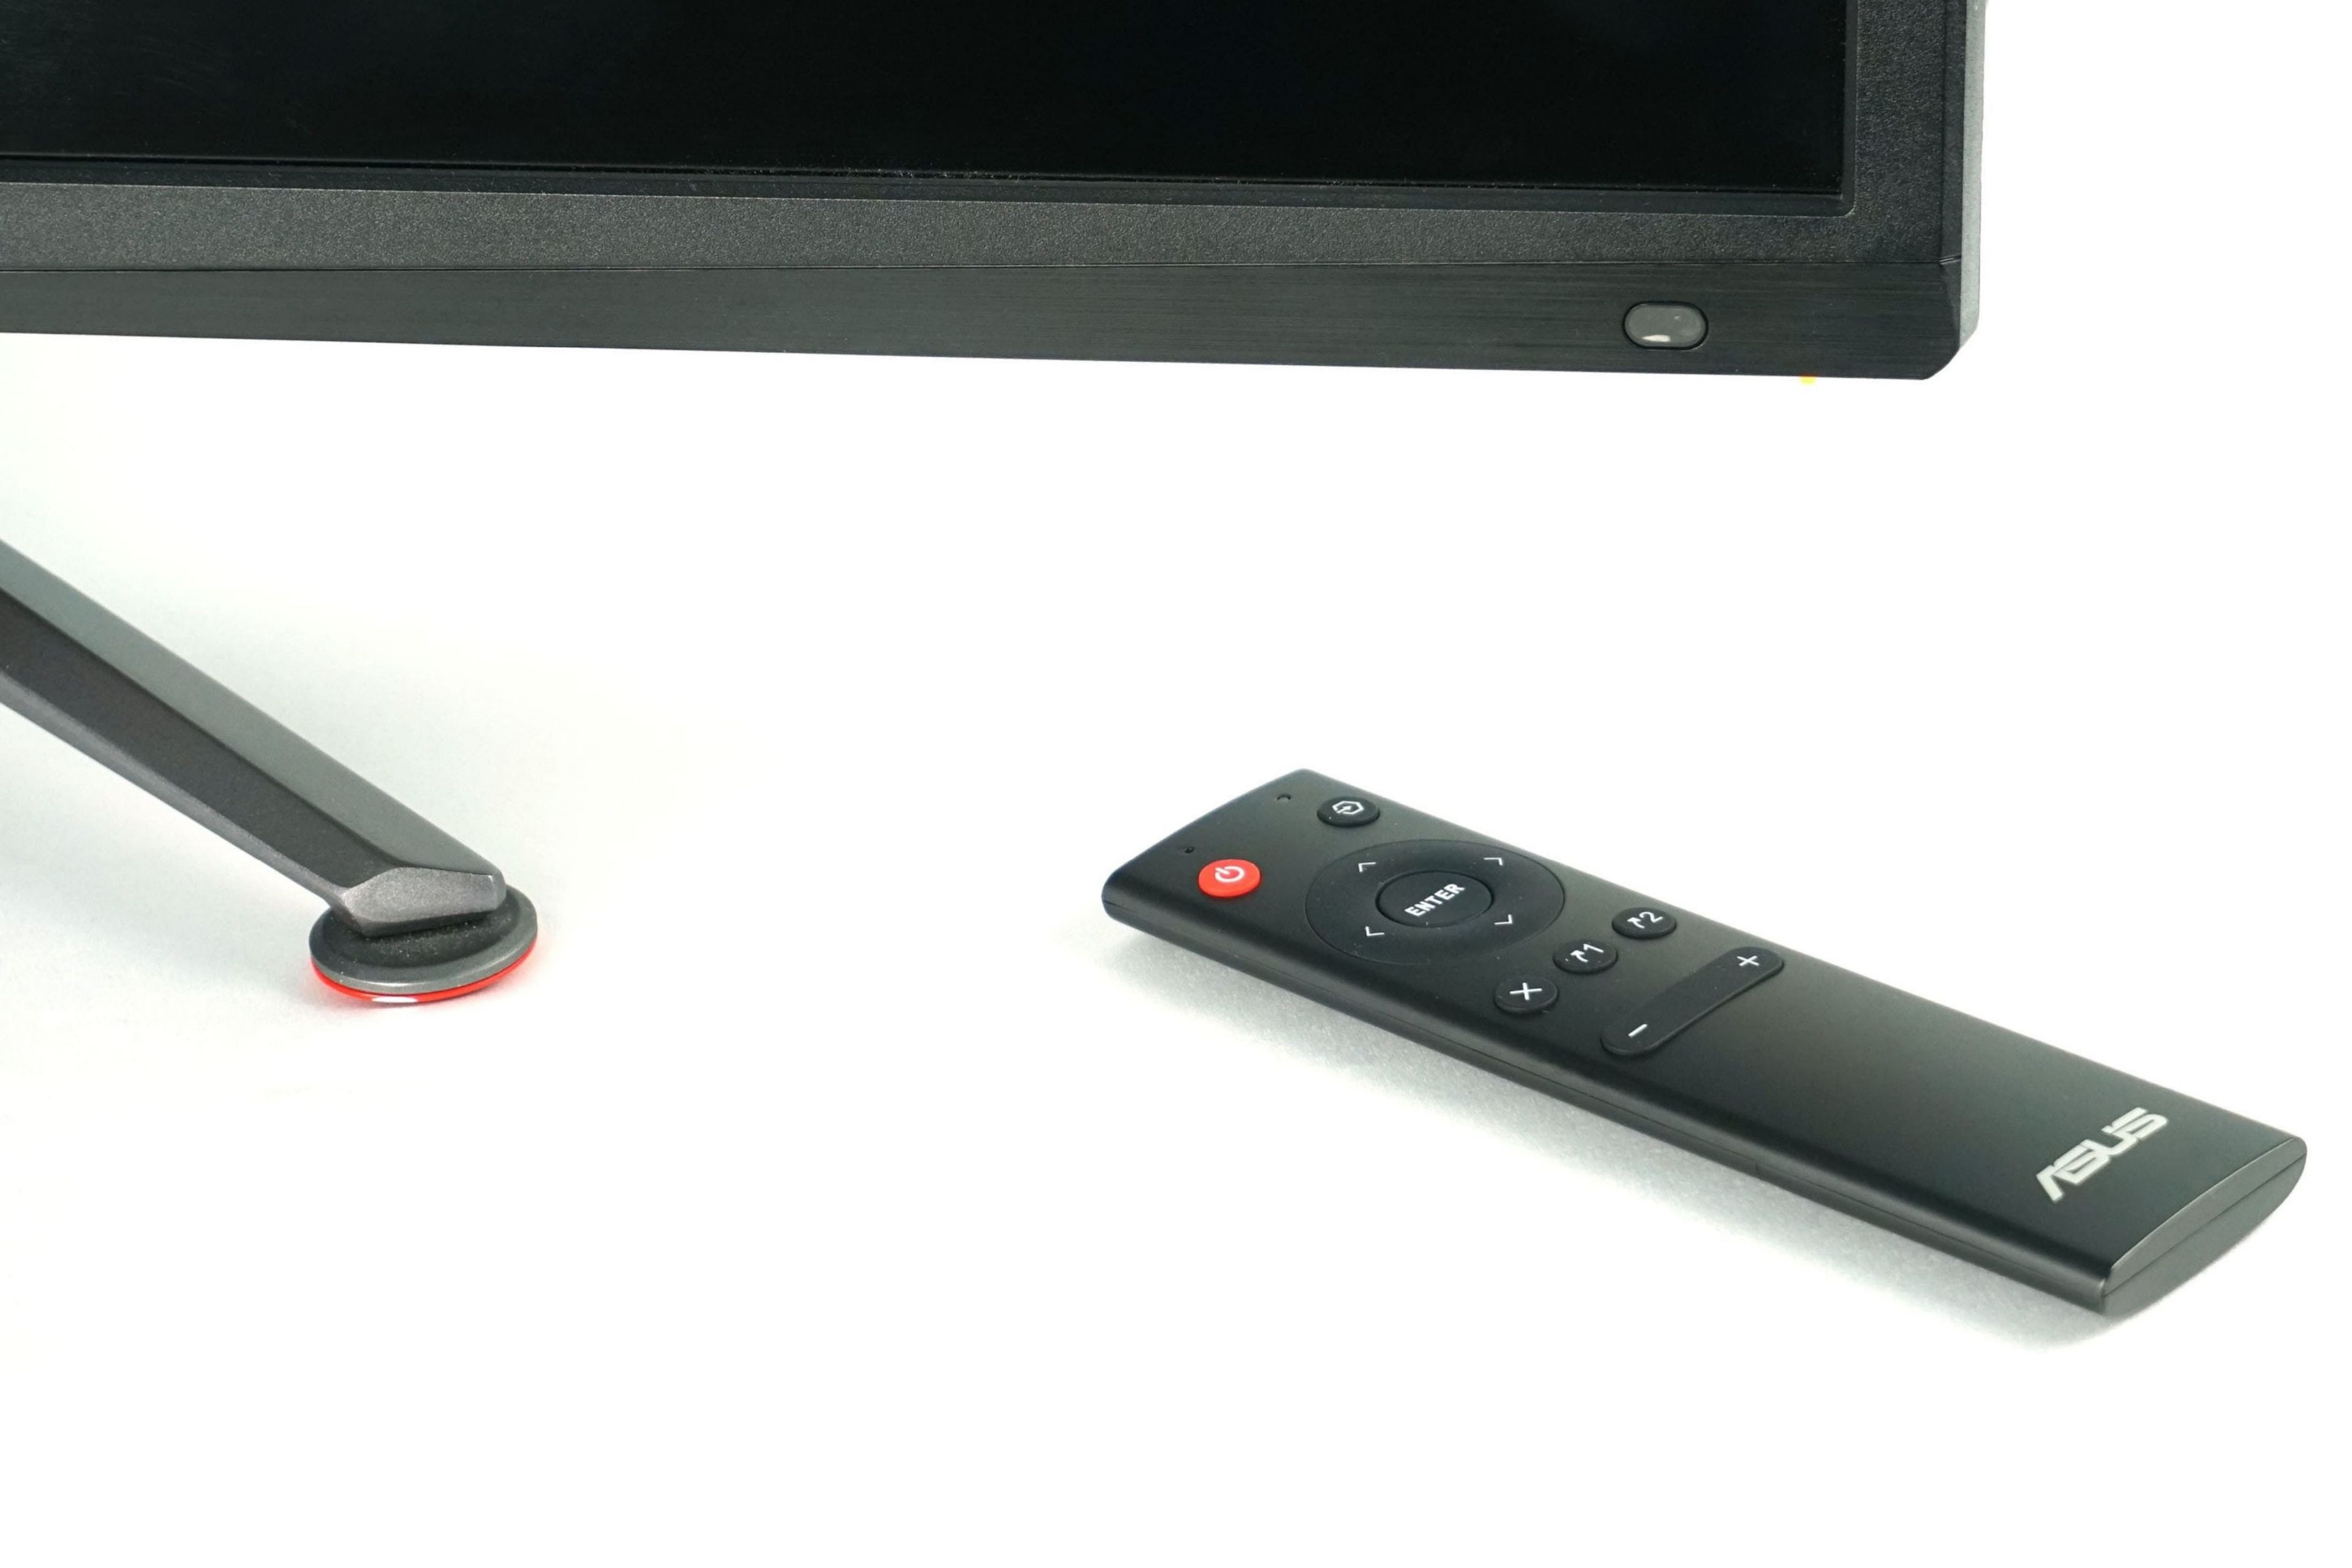
Image properties
We tested the properties of the display using the Datacolor Spyder5Elite color analyzer. The display has a 43″ VA matrix type with a traditional 16:9 aspect ratio, a resolution of 3840 × 2160 px, anti-glare treatment and even frames on three sides. It’s a really big monitor that most users will have to get used to. I used 43″ a year ago after switching from a pair of 27″ monitors. If you have enough space on your desk, I can only recommend large displays. I’m currently using up to a 55″ screen. But back to XG438Q. In addition to the large size, the monitor is particularly interesting for its gaming features and thus the 120 Hz refresh rate and support for AMD FreeSync 2. I can also confirm the compatibility with G-Sync, which I have tested. The display also boasts of VESA DisplayHDR 600 certification, which is a higher version of the traditional 400 that we see on most monitors.
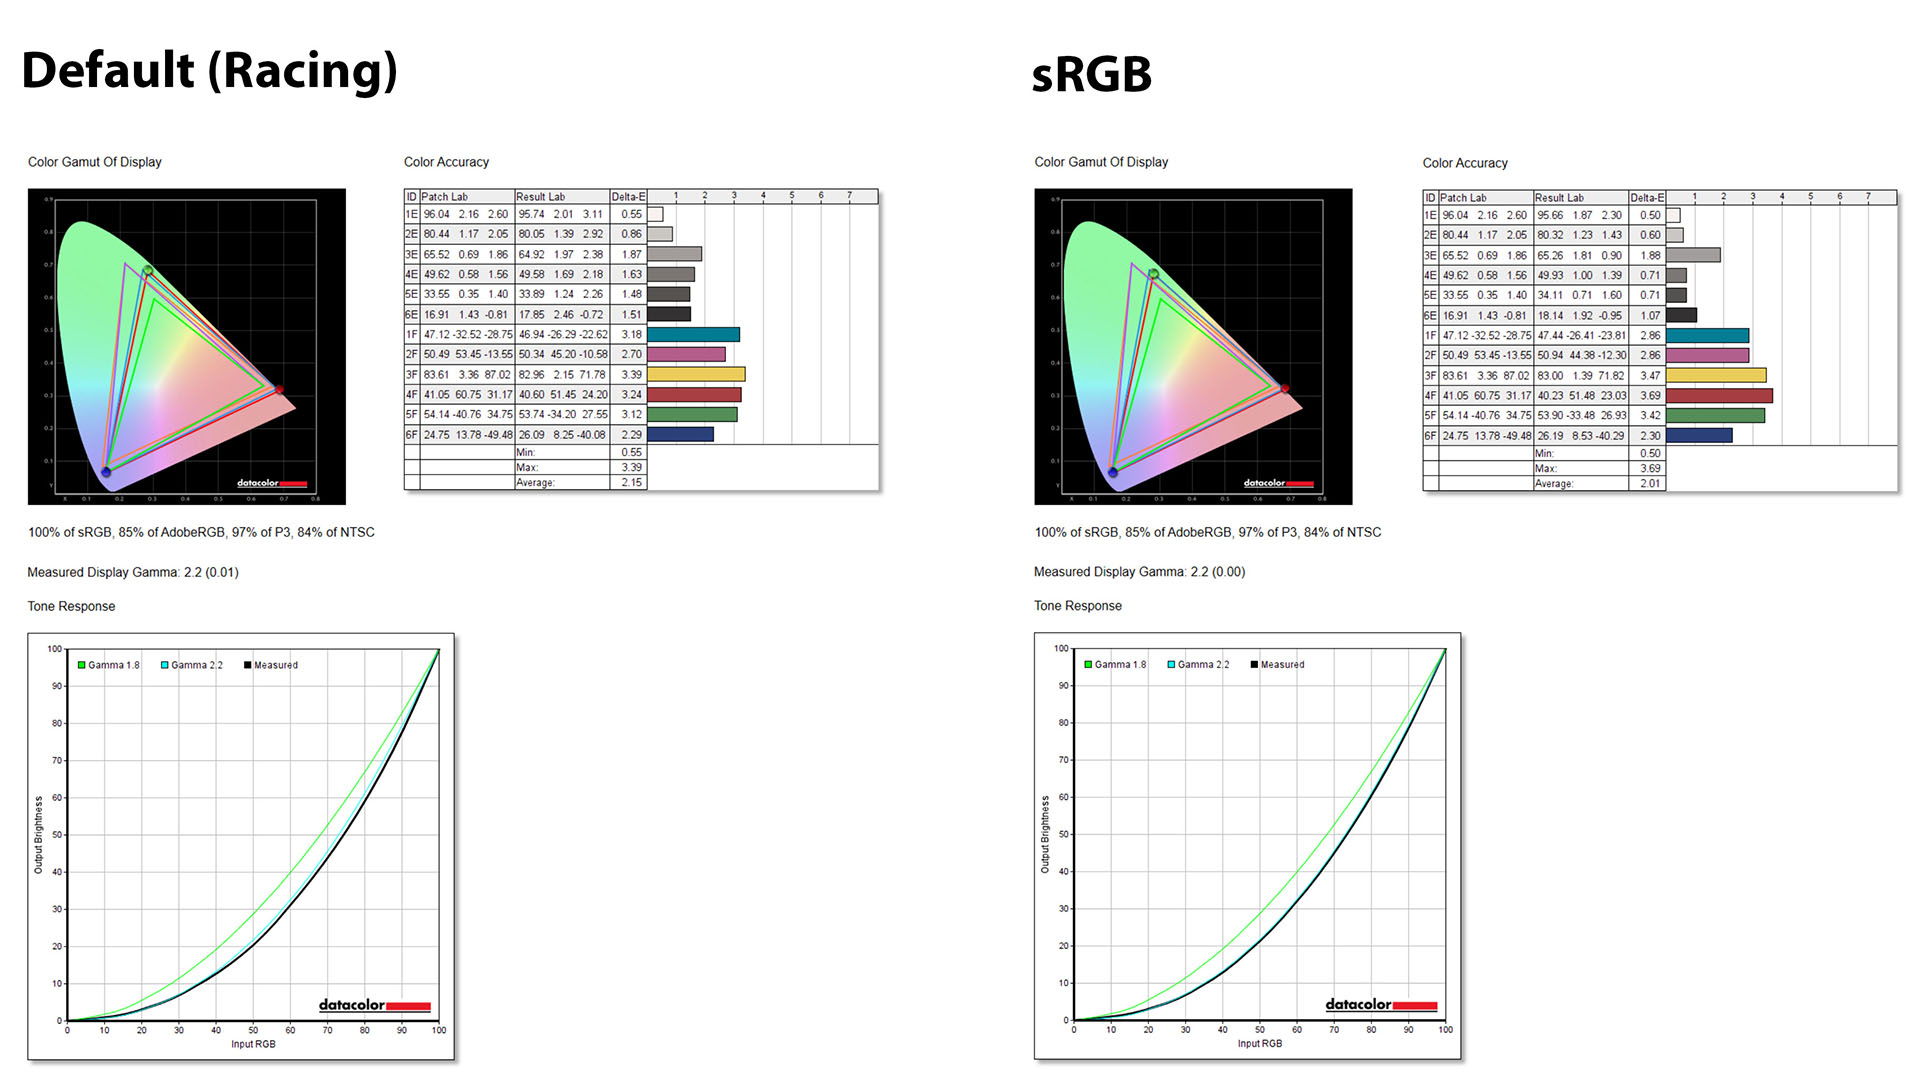
We compared the display quality in the basic mode, i.e. the one in which the monitor will be immediately after unpacking. In this case, it is Racing, i.e. racing mode. We measured over 100% sRGB, 85% AdobeRGB, 97% DCI-P3 and 84% NTSC. These are really good values for a gaming monitor. In particular, the DCI-P3 value is really good. In the dedicated sRGB mode, the values have hardly changed, which is a real surprise. The average color difference of Delta E has changed from 2.15 to 2.01, i.e. to a better value, and also gamma has slightly improved and exactly copies the value of 2.2 with 0 deviation. However, the tax for the sRGB mode is reduced brightness to about 179 nits.
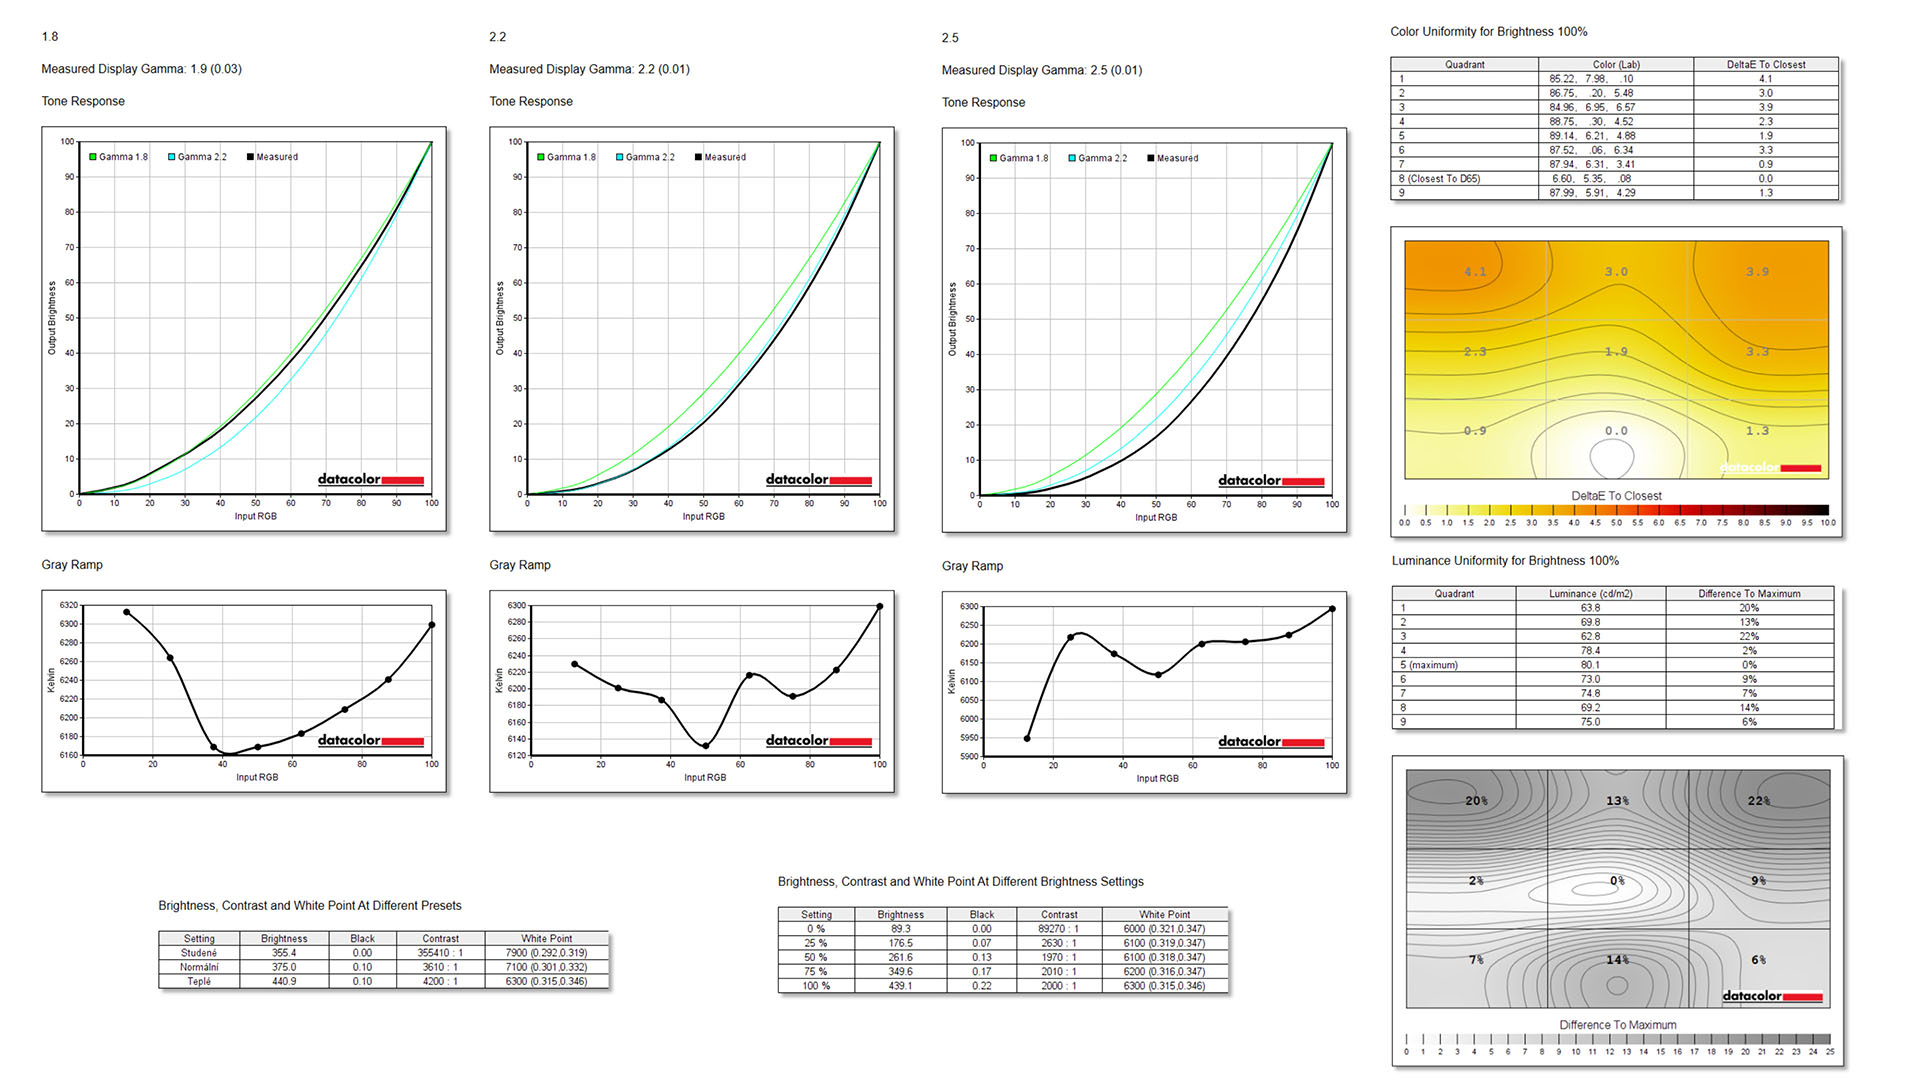
The monitor offers three Gamma modes – 1.8, 2.2 and 2.5. The measured values are 1.9, 2.2, 2.5. The maximum measured brightness is 441 nits in the basic mode, which is only slightly less than the presented 450 nits. Uniformity measurement is difficult due to the zone backlighting, as we showed in the first chapter. The displayed values must therefore be taken with a grain of salt. Also, zones measured by the color analyzer are really big in this case. The reason is the fact that in such a measurement, the area of the display is divided into 9 parts – 3 vertical and 3 horizontal, and measurements are subsequently performed in these areas. However, the area of the display is relatively large, so one part on which it is measured is relatively large. Therefore, minor backlight imperfections during the measurement might not be captured well.
Input Lag and Response Time
We also measured input lag on the monitor in several Overdrive modes.
The default Level 3 setting has an input lag of 15.5 ms. Changing to the lowest Level 0 increases the value to 16.1 ms and, conversely, drops it to 14.9 ms at the highest Level 5. These are not world-class values, we’ve already had monitors with values below 10 ms, but at the same time the values are still in the norm.

On the manufacturer’s website you will find information about 4 ms response time GTG, i.e. pixel recovery speed. The default value of Level 3 is probably the most sensible choice to eliminate ghosting and at the same time to prevent even worse inverse ghosting, which is enormous at Level 5. Personally, I would recommend not to change the OD and leave it at Level 3.