
Methodology: Temperature and frequency measurements
While others have resigned from full-fledged motherboard tests long ago, we’re just kicking it off. Tests with differently powerful processors, without power limits, but also with limits set by Intel. And when we test performance, we also test M.2 slots, USB or Ethernet. Power draw analysis done at the level of individual branches, and thermal imaging with temperature tests (including SSD heatsink efficiency measurements) are a no-brainer.
Methodology: Temperature and frequency measurements
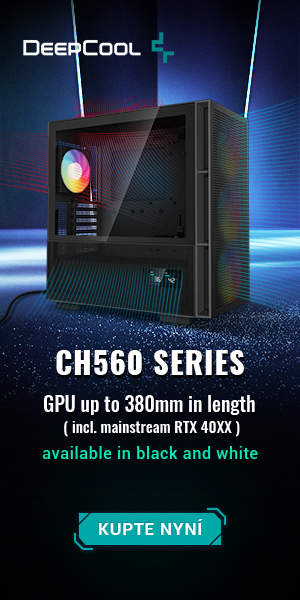
By far the most critical part in terms of temperatures on the motherboard is the power delivery (VRM) for the CPU. This is where we return to the Fluke Ti125 thermal imager, which produces temperature maps that can be used to locate the average temperature, as well as the hottest point. We record both these values (average and maximum temperature on the Vcore) in graphs, and we will later evaluate the efficiency of the VRM heatsinks based on the maximum one. However, we lack a suitable thermometer for that yet. Of course, the thermovision is implemented without a heatsink, and a thermocouple needs to be installed on the hottest MOSFET to detect the reduction of temperature with a heatsink. This will be added soon.
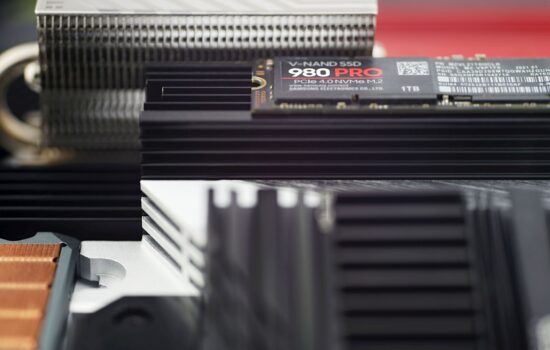
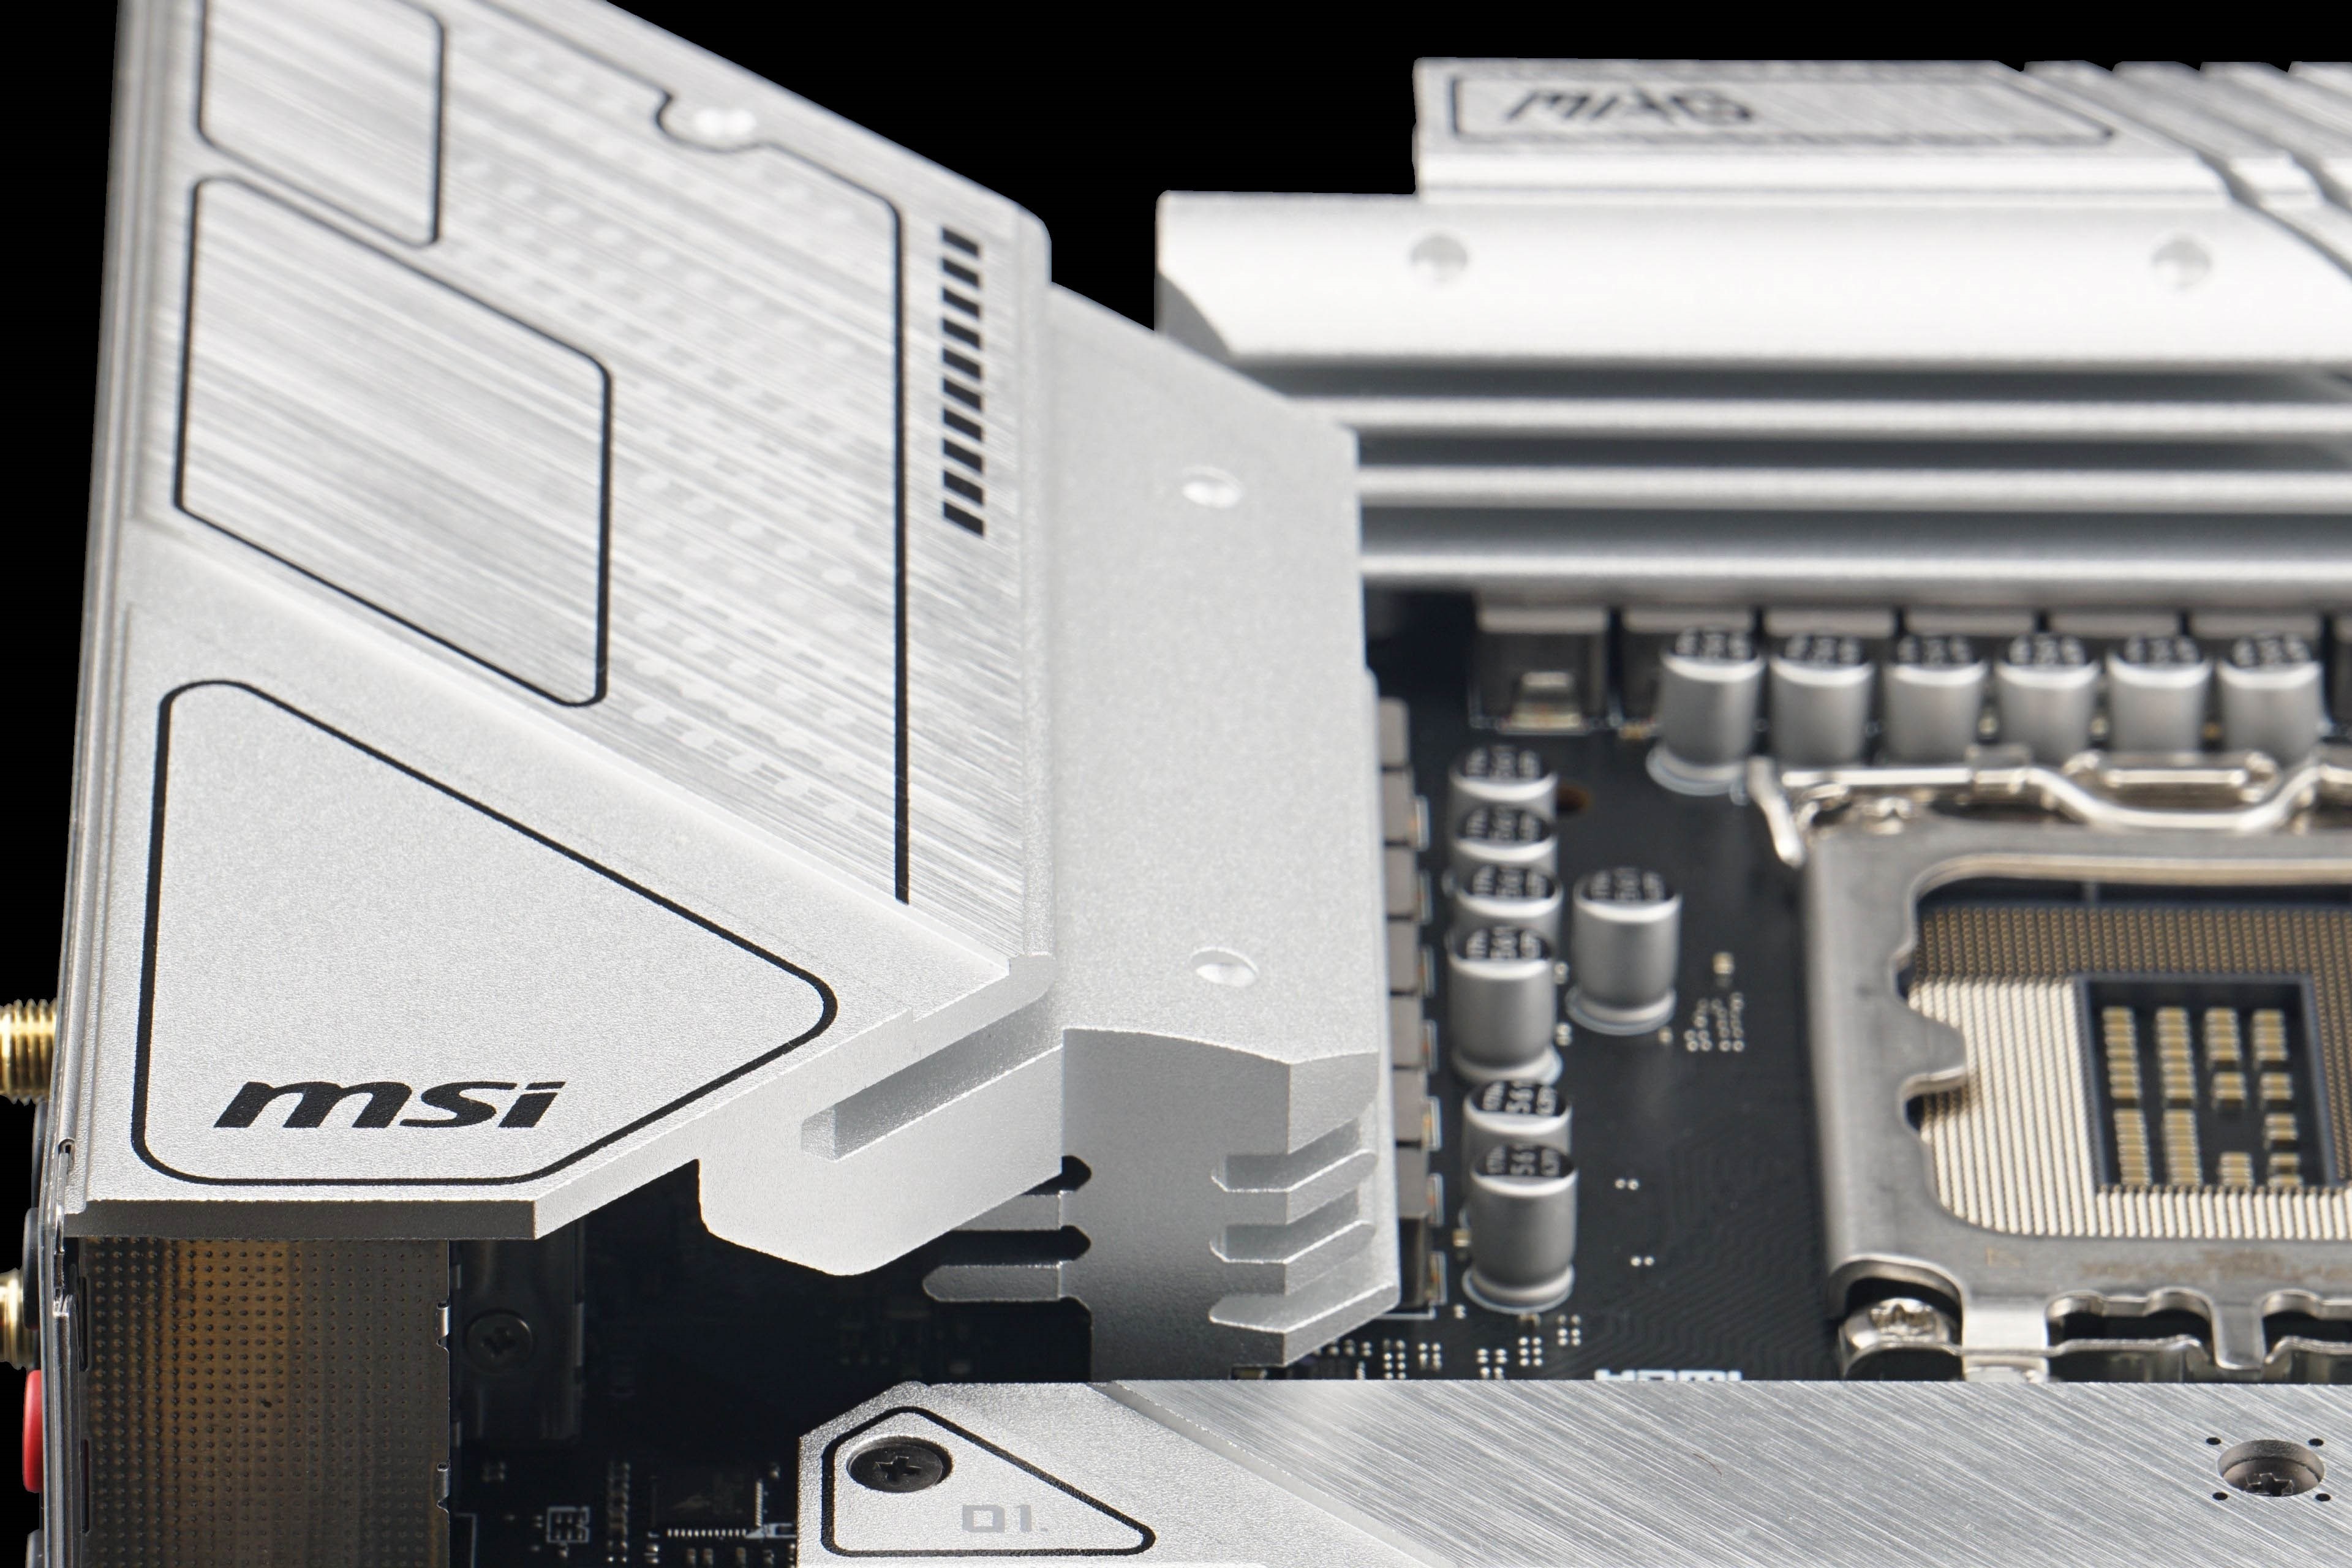
Thermovision always relates to operating with the more powerful of the pair of test processors. With it, the differences and possible limitations or impending risks (for example, even from thermal throttling) become more apparent. In order to have a good view of the VRM, we use an Alphacool Eisbaer Aurora 360 liquid cooler with the fans fixed at full power (12 V) instead of a tower cooler (from the CPU tests). The temperature tests also include CPU temperatures for completeness, and we also test the efficiency of the supplied SSD heatsinks as part of the motherboard tests. These are already included with virtually all better motherboards, and so the question naturally arises whether to use them or replace them with other, more finned ones. We will test these heatsinks on a Samsung 980 Pro SSD during ten minutes of intense load in CrystalDiskMark. Finally, the temperature of the chipset’s southbridge and the cooling efficiency in this direction is noteworthy as well.
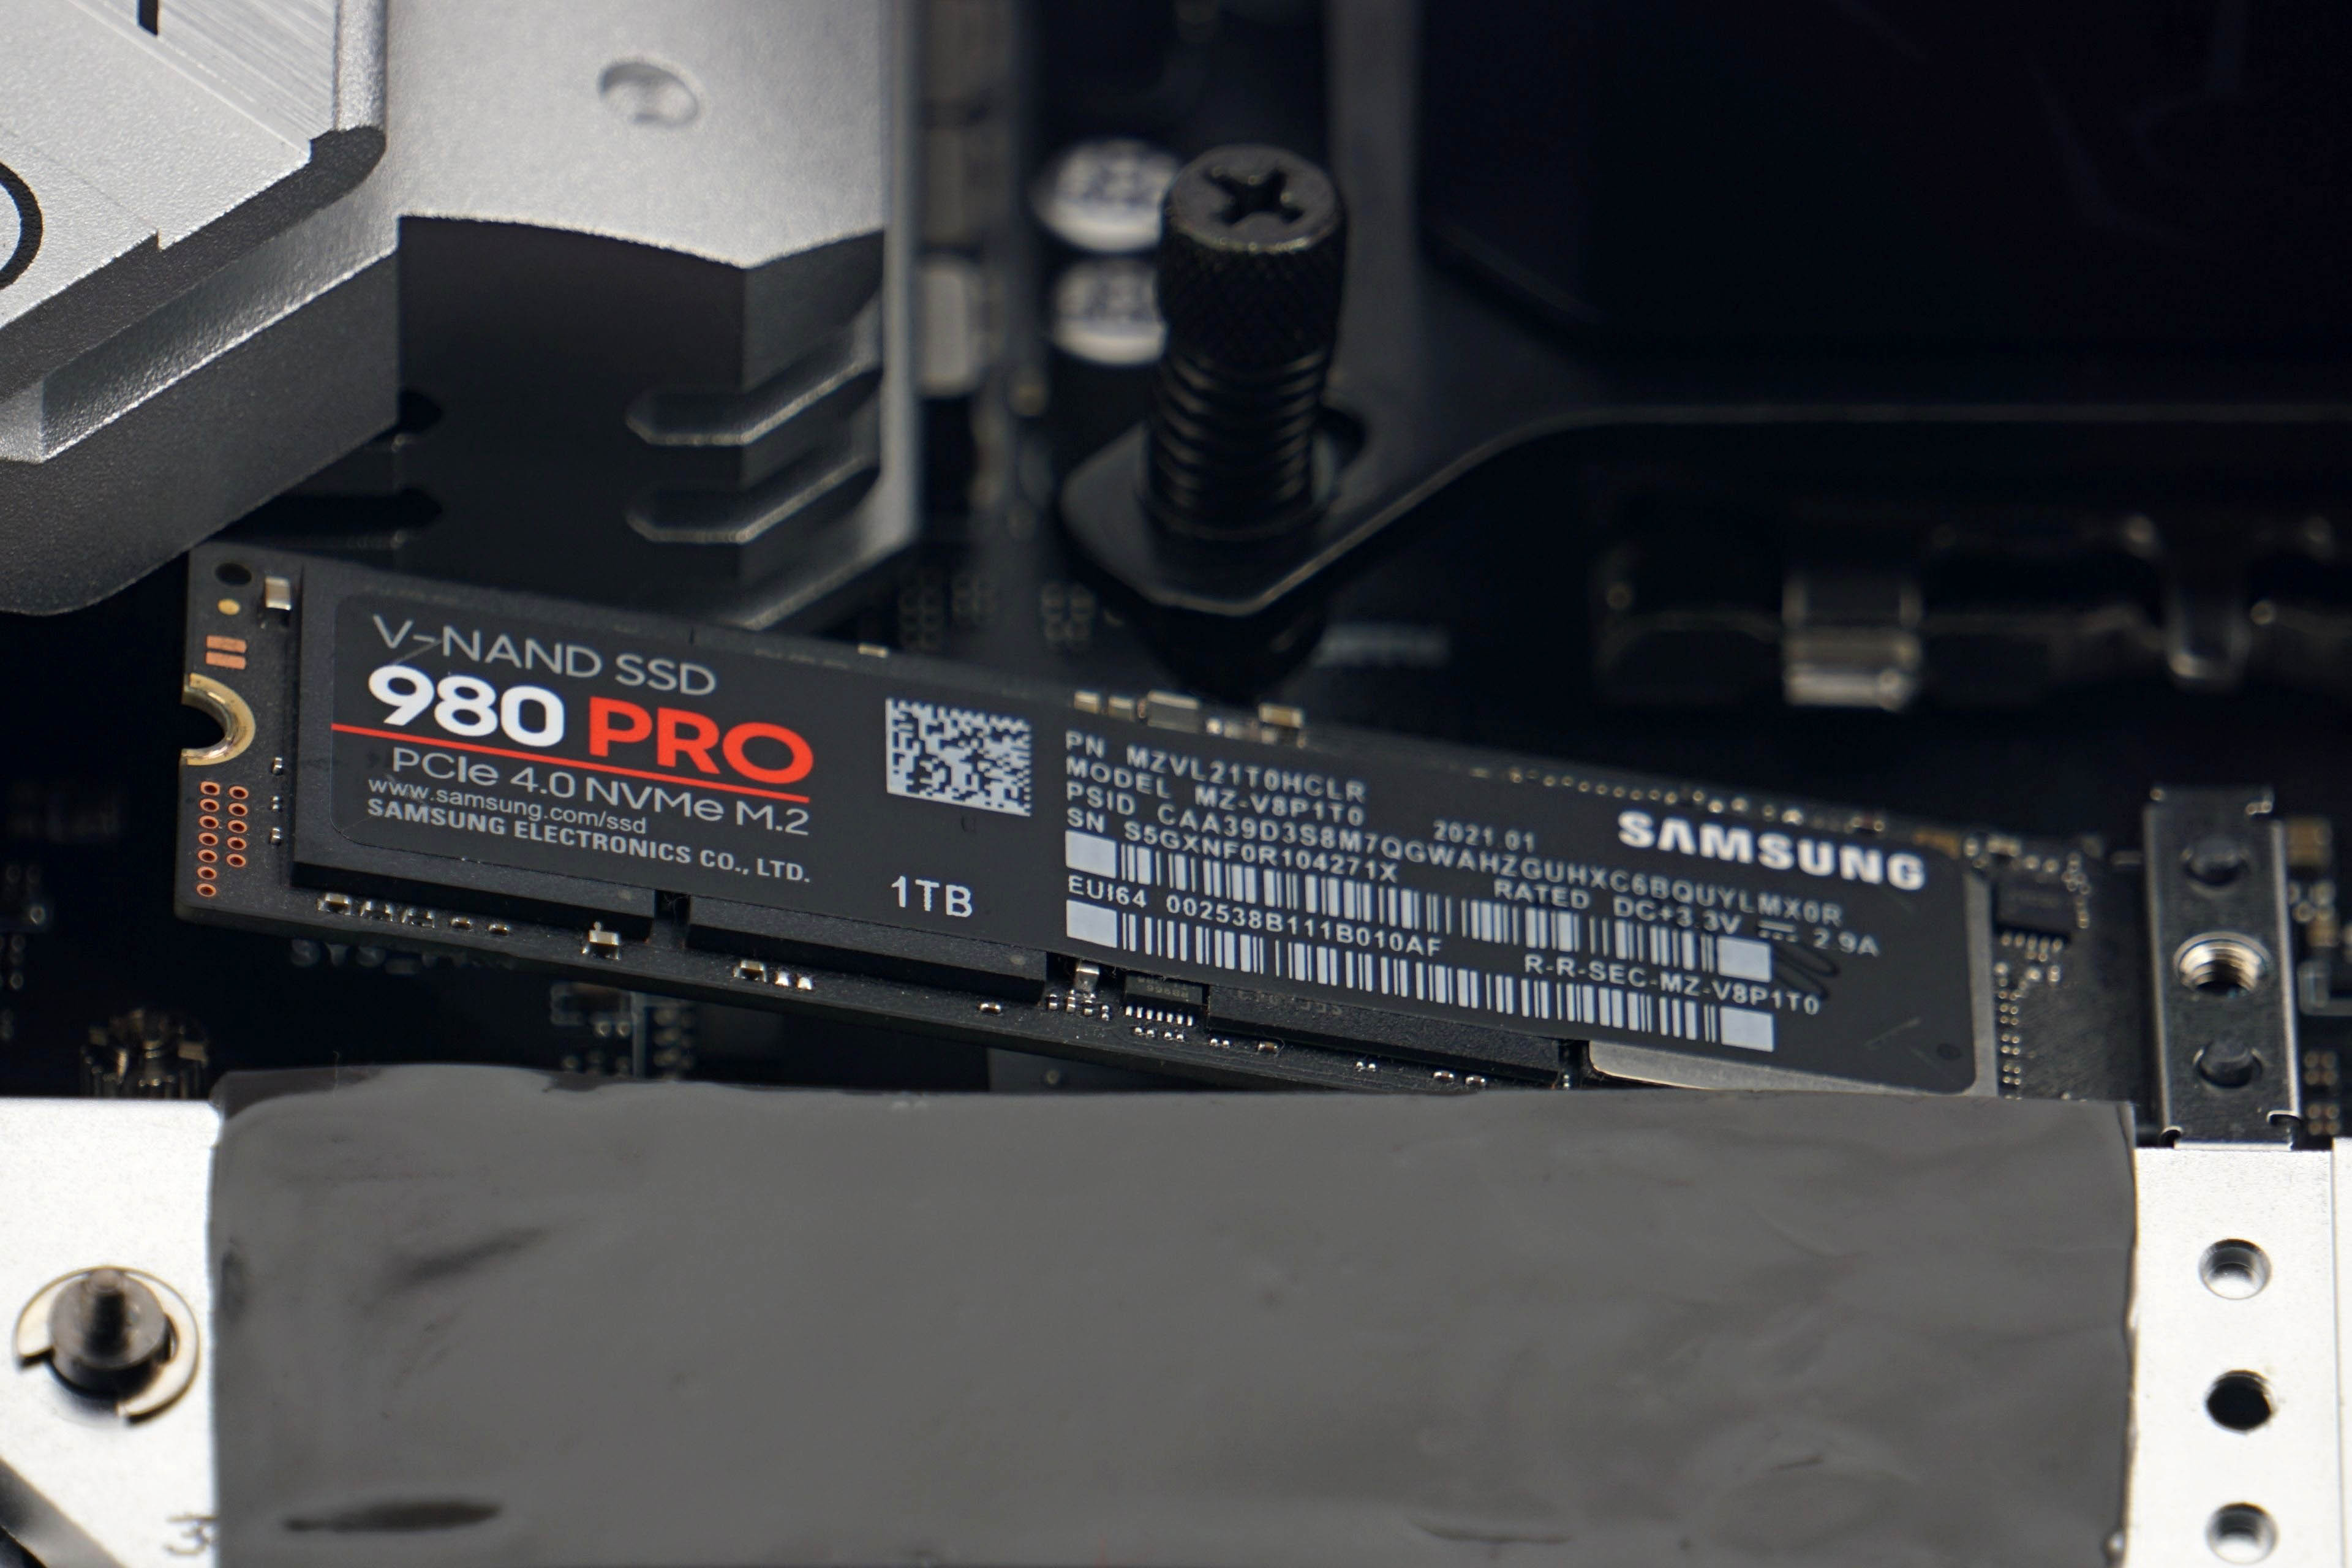
All tests are conducted in a wind tunnel, so full system cooling is provided. This consists of three Noctua NF-S12A PWMs@5V (~550 rpm) . Two of which are intake, one is exhaust. But the three fast AIO fans also function as exhaust fans, so there is a vacuum in the case.
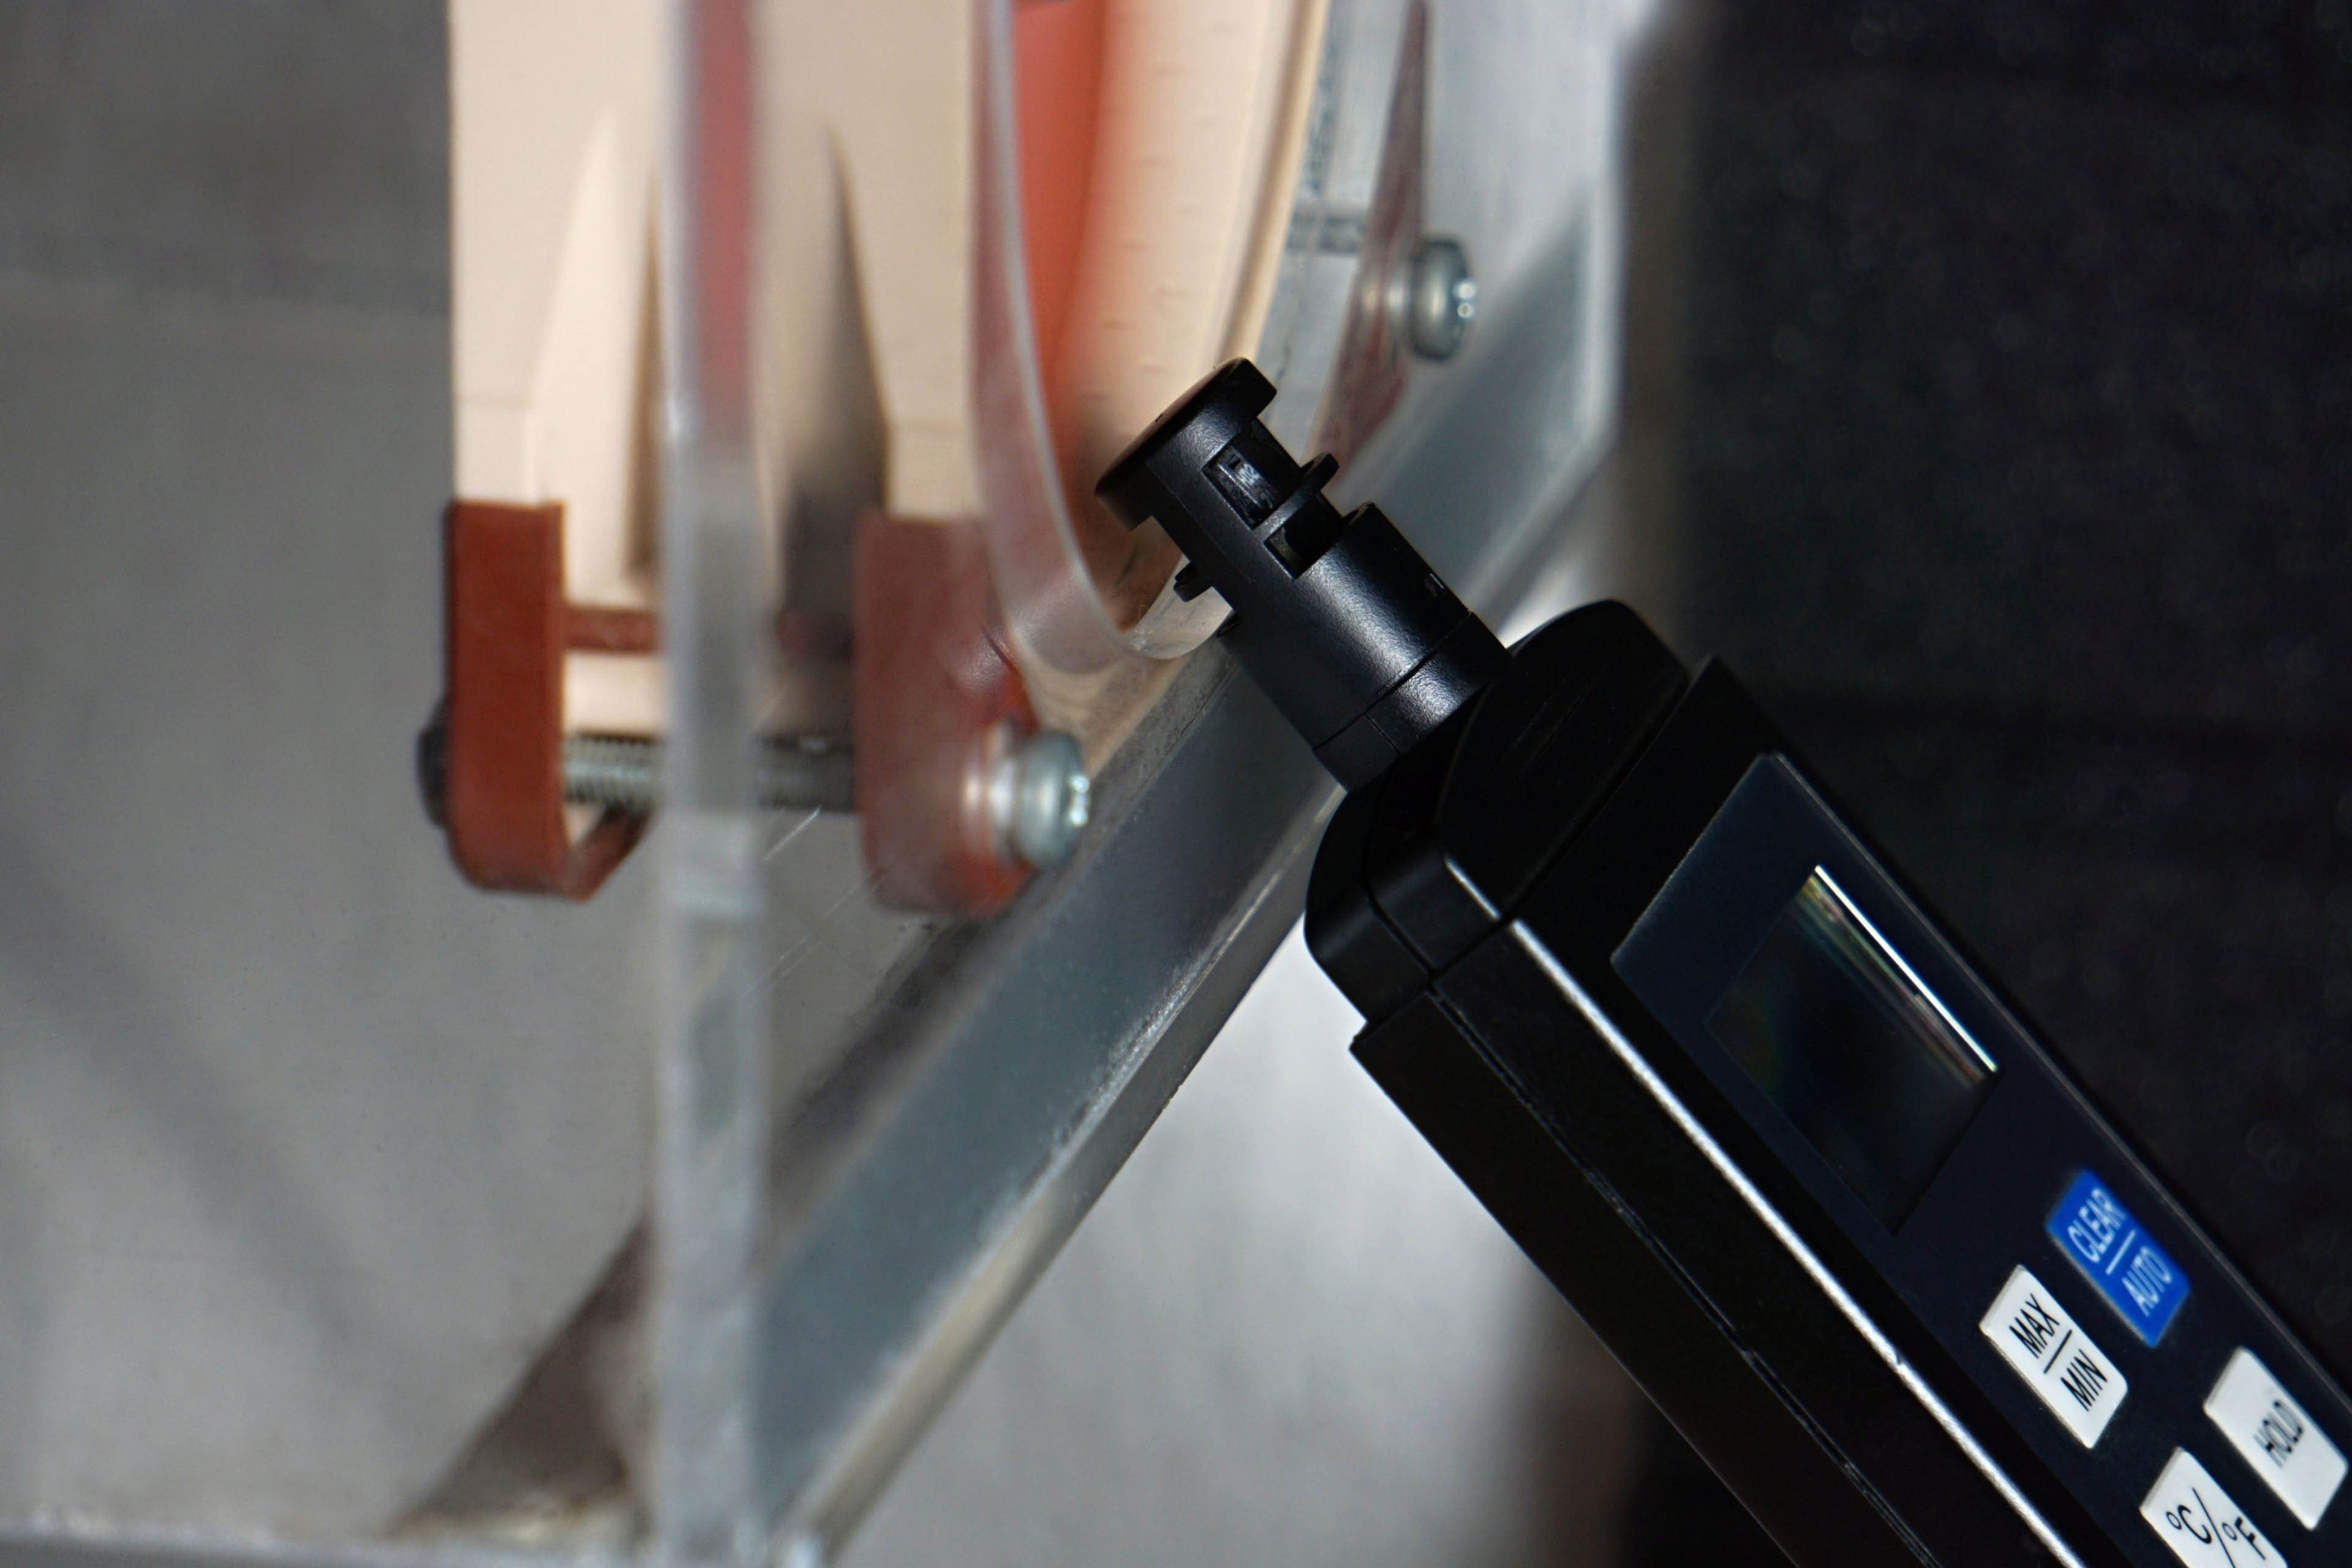
The temperature at the entrance to the tunnel is properly controlled and ranges between 21-21.3 °C. Maintaining a constant temperature at all times during testing is important not only for the accuracy of the temperature measurements, but also because a higher or lower ambient temperature also affects the eventual behaviour of the processors’ boost. And we also properly monitor and compare the frequencies, whether under all-core load or even single-threaded tasks. We use the HWiNFO application to record the frequencies and temperatures of the cores (sampling is set to two seconds).
Maintaining a constant temperature at the intake is necessary not only for a proper comparison of processor temperatures, but especially for objective performance comparisons. The frequency development, and specially the single core boost, is precisely based on the temperature. Typically in summer, at higher temperatures than is normal in living quarters in winter, processors can be slower.
Temperatures are always read as maximum (both from the VRM thermovision and average, but still from the local maximum values at the end of Cinebench R23). For Intel processors, for each test we read the maximum temperature of the cores, usually all of them. These maxima are then averaged and the result represents the final value in the graph. From the single-threaded workload outputs, we extract only the recorded values from the active cores (there are usually two of these, and they alternate between each other during the test). For AMD processors it is a bit different. They don’t have temperature sensors for each core. In order to make the procedure methodically as similar as possible to the one we apply on Intel processors, we define the average temperature of all cores by the highest value reported by the CPU Tdie (average) sensor. However, for single-core workloads we already use the CPU sensor (Tctl/Tdie), which usually reports a slightly higher value that better corresponds to hotspots of one or two cores. However, these values as well as the values from all internal sensors should be taken with a grain of salt, the accuracy of sensors across CPUs varies.
Frequency evaluation is more accurate, each core has its own sensor even on AMD processors. However, unlike the temperatures, we write the average values of the frequencies during the tests in the graphs. We monitor the temperatures and frequencies of the CPU cores in the same tests in which we also measure power draw. Thus, sequentially from the lowest desktop idle load in Windows 10, through audio encoding (single-threaded load), gaming load in Shadow of the Tomb Raider to Cinebench R23.
- Contents
- MSI MAG B660M Mortar WiFi in detail
- What it looks like in the BIOS
- Methodology: Performance tests
- Methodology: How we measure power draw
- Methodology: Temperature and frequency measurements
- Test setup
- 3DMark
- Borderlands 3
- F1 2020
- Metro Exodus
- Shadow of the Tomb Raider
- Total War Saga: Troy
- PCMark a Geekbench
- Web performance
- 3D rendering: Cinebench, Blender, ...
- Video 1/2: Adobe Premiere Pro
- Video 1/2: DaVinci Resolve Studio
- Graphic effects: Adobe After Effects
- Video encoding
- Audio encoding
- Photos: Adobe Photoshop, Affinity Photo, ...
- (De)compression
- (De)encrypting
- Numerical computing
- Simulations
- Memory and cache tests
- M.2 (SSD) slots speed
- USB ports speed
- Ethernet speed
- Power draw curve (EPS + ATX connector) w/o power limits
- Power draw curve (EPS + ATX connector) with Intel's power limits
- Total power draw (EPS + ATX connector)
- Achieved CPU clock speed
- CPU temperatures
- VRM temperatures – thermovision of Vcore and SOC
- SSD temperatures
- Chipset temperatures (south bridge)
- Conclusion