
Frequency response of sound
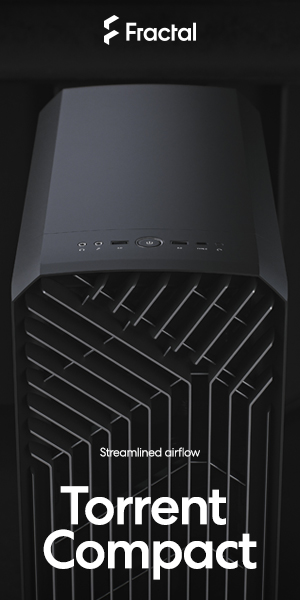
The Radeon RX 6900 XT Toxic LE in the company of other graphics cards will not be overlooked. The 360-millimeter liquid GPU cooling is a rare thing that will definitely attract attention. Still, it’s a rather controversial piece of hardware. There are several reasons to opt for this madness (in a good way). But it is also necessary to know about certain flaws that it has. We need to be demanding and strict in this price category.
Frequency response of sound
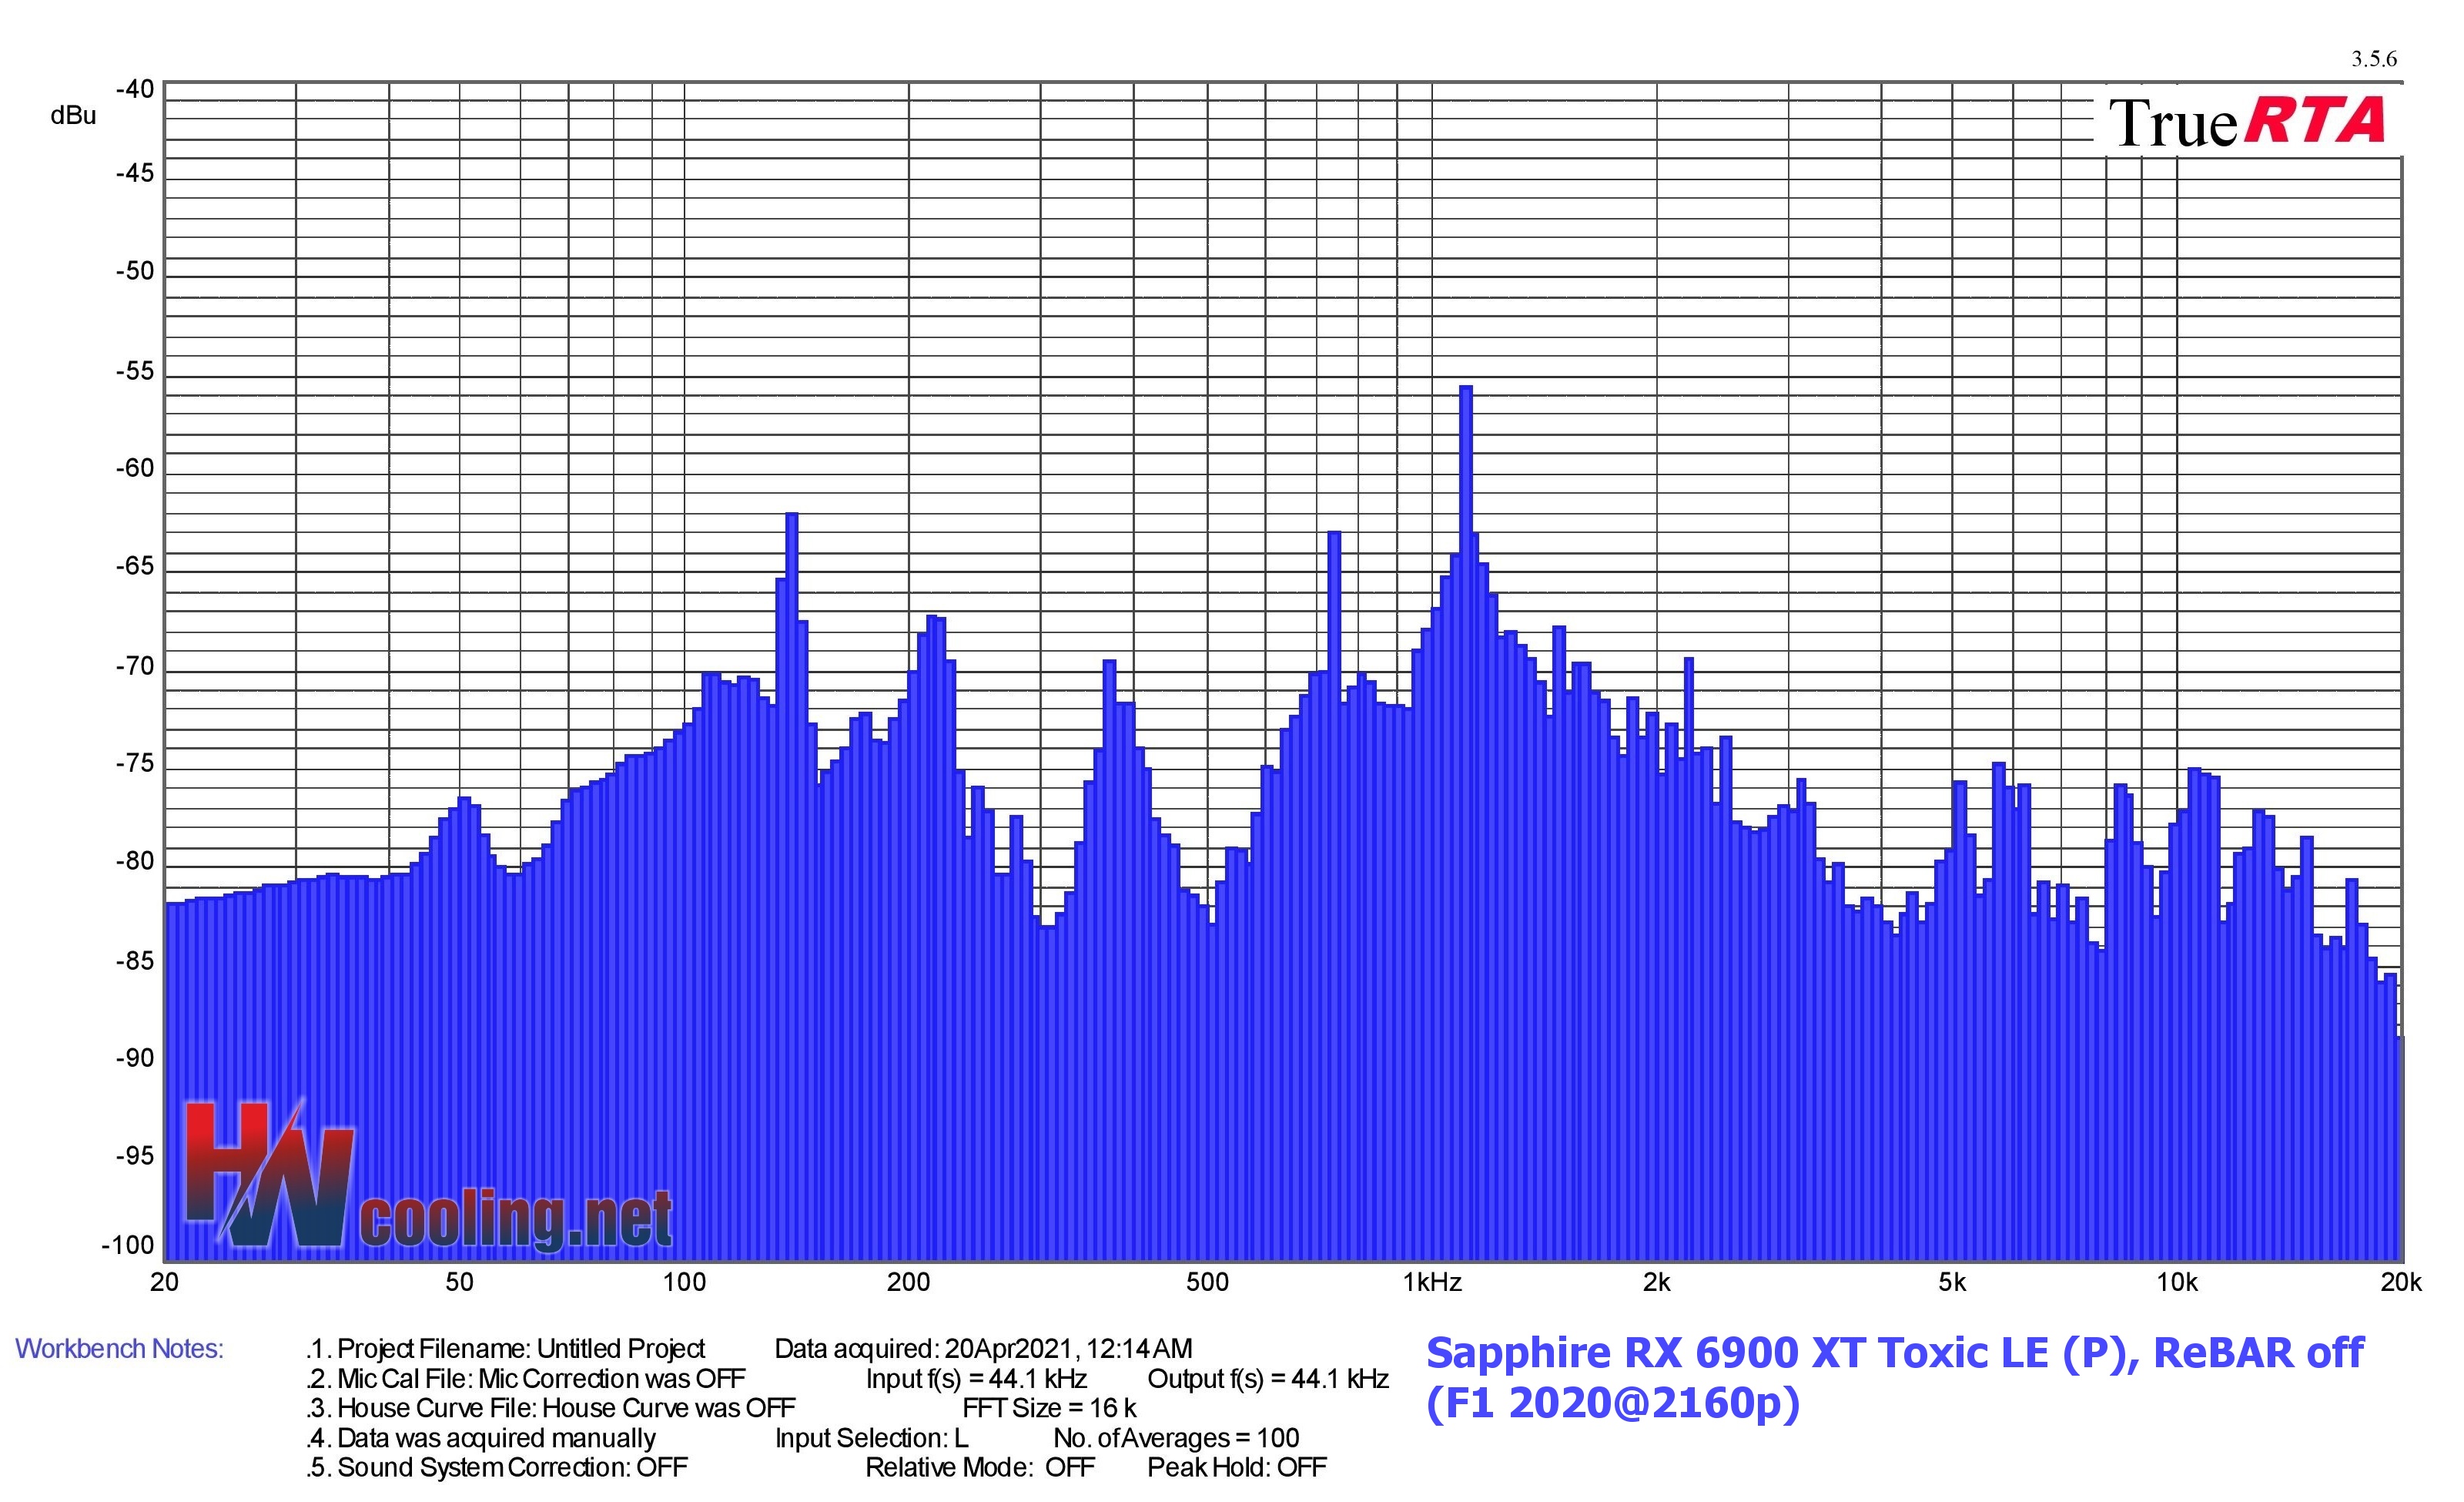
Measurements are performed in the TrueRTA application, which records sound in a range of 240 frequencies in the recorded range of 20–20,000 Hz. For the possibility of comparison across articles, we export the dominant frequency from the low (20–200 Hz), medium (201–2,000 Hz) and high (2,001–20,000 Hz) range to standard bar graphs. However, for an even more detailed analysis of the sound expression, it is important to perceive the overall shape of the graph and the intensity of all frequencies/tones. If you don’t understand something in the graphs or tables below, you’ll find the answers to all your questions in this article. This explains how to read the measured data below correctly.

| Graphics card | Dominant sound freq. and noise level in F1 2020@2160p | NF-F12 PWM | NF-A15 PWM | ||||
| Low range | Mid range | High range | |||||
| Frequency [Hz] | Noise level [dBu] | Frequency [Hz] | Noise level [dBu] | Frequency [Hz] | Noise level [dBu] | ||
| Sapphire RX 6900 XT Toxic LE (P), ReBAR on | Sapphire RX 6900 XT Toxic LE (P), ReBAR on | 138,486 | -62,401 | 1107,887 | -56,563 | 11166,799 | -74,670 |
| Sapphire RX 6900 XT Toxic LE (P), ReBAR off | Sapphire RX 6900 XT Toxic LE (P), ReBAR on | 138,486 | -61,935 | 1107,887 | -55,628 | 5747,006 | -74,735 |
| Sapphire RX 6700 XT Nitro+ (P), ReBAR on | 100,794 | -73,224 | 1076,347 | -71,246 | 7034,643 | -76,524 | |
| Sapphire RX 6700 XT Nitro+ (P), ReBAR off | 100,794 | -75,199 | 1076,347 | -73,483 | 7034,643 | -76,501 | |
| MSI RTX 3060 Ti Gaming X Trio, ReBAR off | 100,794 | -70,608 | 1107,887 | -82,797 | 7034,643 | -83,730 | |
| Gigabyte RTX 3060 Eagle OC 12G, ReBAR off | 100,794 | -71,611 | 213,574 | -64,261 | 2031,873 | -74,162 | |
| MSI RTX 3090 Gaming X Trio, ReBAR off | 100,794 | -72,330 | 1076,347 | -75,992 | 4561,401 | -81,229 | |
| MSI RTX 3070 Gaming X Trio, ReBAR off | 100,794 | -73,926 | 1076,347 | -79,719 | 6267,154 | -85,076 | |
| AMD Radeon RX 6800, ReBAR on | 100,794 | -71,019 | 1076,347 | -66,494 | 9665,273 | -81,252 | |
| AMD Radeon RX 6800, ReBAR off | 100,794 | -71,759 | 1107,887 | -67,416 | 2091,412 | -75,288 | |
| TUF RTX 3080 O10G Gaming, ReBAR off | 100,794 | -76,045 | 1107,887 | -77,850 | 7034,643 | -74,423 | |
| AMD Radeon RX 6800 XT, ReBAR on | 100,794 | -71,589 | 1107,887 | -74,742 | 10848,902 | -76,306 | |
| AMD Radeon RX 6800 XT, ReBAR off | 100,794 | -72,991 | 1107,887 | -74,724 | 10848,902 | -76,519 |


| Graphics card | Dominant sound freq. and noise level in SOTTR@2160p | NF-F12 PWM | NF-A15 PWM | ||||
| Low range | Mid range | High range | |||||
| Frequency [Hz] | Noise level [dBu] | Frequency [Hz] | Noise level [dBu] | Frequency [Hz] | Noise level [dBu] | ||
| Sapphire RX 6900 XT Toxic LE (P), ReBAR on | Sapphire RX 6900 XT Toxic LE (P), ReBAR on | 138,486 | -63,056 | 1140,350 | -57,859 | 5747,006 | -74,678 |
| Sapphire RX 6900 XT Toxic LE (P), ReBAR off | Sapphire RX 6900 XT Toxic LE (P), ReBAR off | 134,543 | -61,709 | 1107,887 | -58,619 | 5747,006 | -74,178 |
| Sapphire RX 6700 XT Nitro+ (P), ReBAR on | 100,794 | -73,918 | 1140,350 | -75,427 | 5915,406 | -77,227 | |
| Sapphire RX 6700 XT Nitro+ (P), ReBAR off | 100,794 | -75,137 | 1107,887 | -75,221 | 5915,406 | -76,482 | |
| MSI RTX 3060 Ti Gaming X Trio, ReBAR off | 100,794 | -70,764 | 1076,347 | -83,630 | 7034,643 | -81,871 | |
| Gigabyte RTX 3060 Eagle OC 12G, ReBAR off | 100,794 | -71,937 | 213,574 | -64,455 | 2031,873 | -73,841 | |
| MSI RTX 3090 Gaming X Trio, ReBAR off | 106,787 | -74,468 | 213,574 | -71,307 | 4561,401 | -79,260 | |
| MSI RTX 3070 Gaming X Trio, ReBAR off | 100,794 | -72,952 | 213,574 | -72,275 | 6267,154 | -84,919 | |
| AMD Radeon RX 6800, ReBAR on | 100,794 | -71,769 | 1140,350 | -66,111 | 9948,487 | -81,293 | |
| AMD Radeon RX 6800, ReBAR off | 100,794 | -71,603 | 1140,350 | -67,765 | 9665,273 | -80,642 | |
| TUF RTX 3080 O10G Gaming, ReBAR off | 100,794 | -75,410 | 1076,347 | -72,321 | 7240,773 | -74,199 | |
| AMD Radeon RX 6800 XT, ReBAR on | 100,794 | -73,222 | 1107,887 | -73,892 | 10848,902 | -76,328 | |
| AMD Radeon RX 6800 XT, ReBAR off | 100,794 | -73,170 | 1107,887 | -75,262 | 10848,902 | -75,397 |
| Graphics card | Dominant sound freq. and noise level in CS:GO@2160p | NF-F12 PWM | NF-A15 PWM | ||||
| Low range | Mid range | High range | |||||
| Frequency [Hz] | Noise level [dBu] | Frequency [Hz] | Noise level [dBu] | Frequency [Hz] | Noise level [dBu] | ||
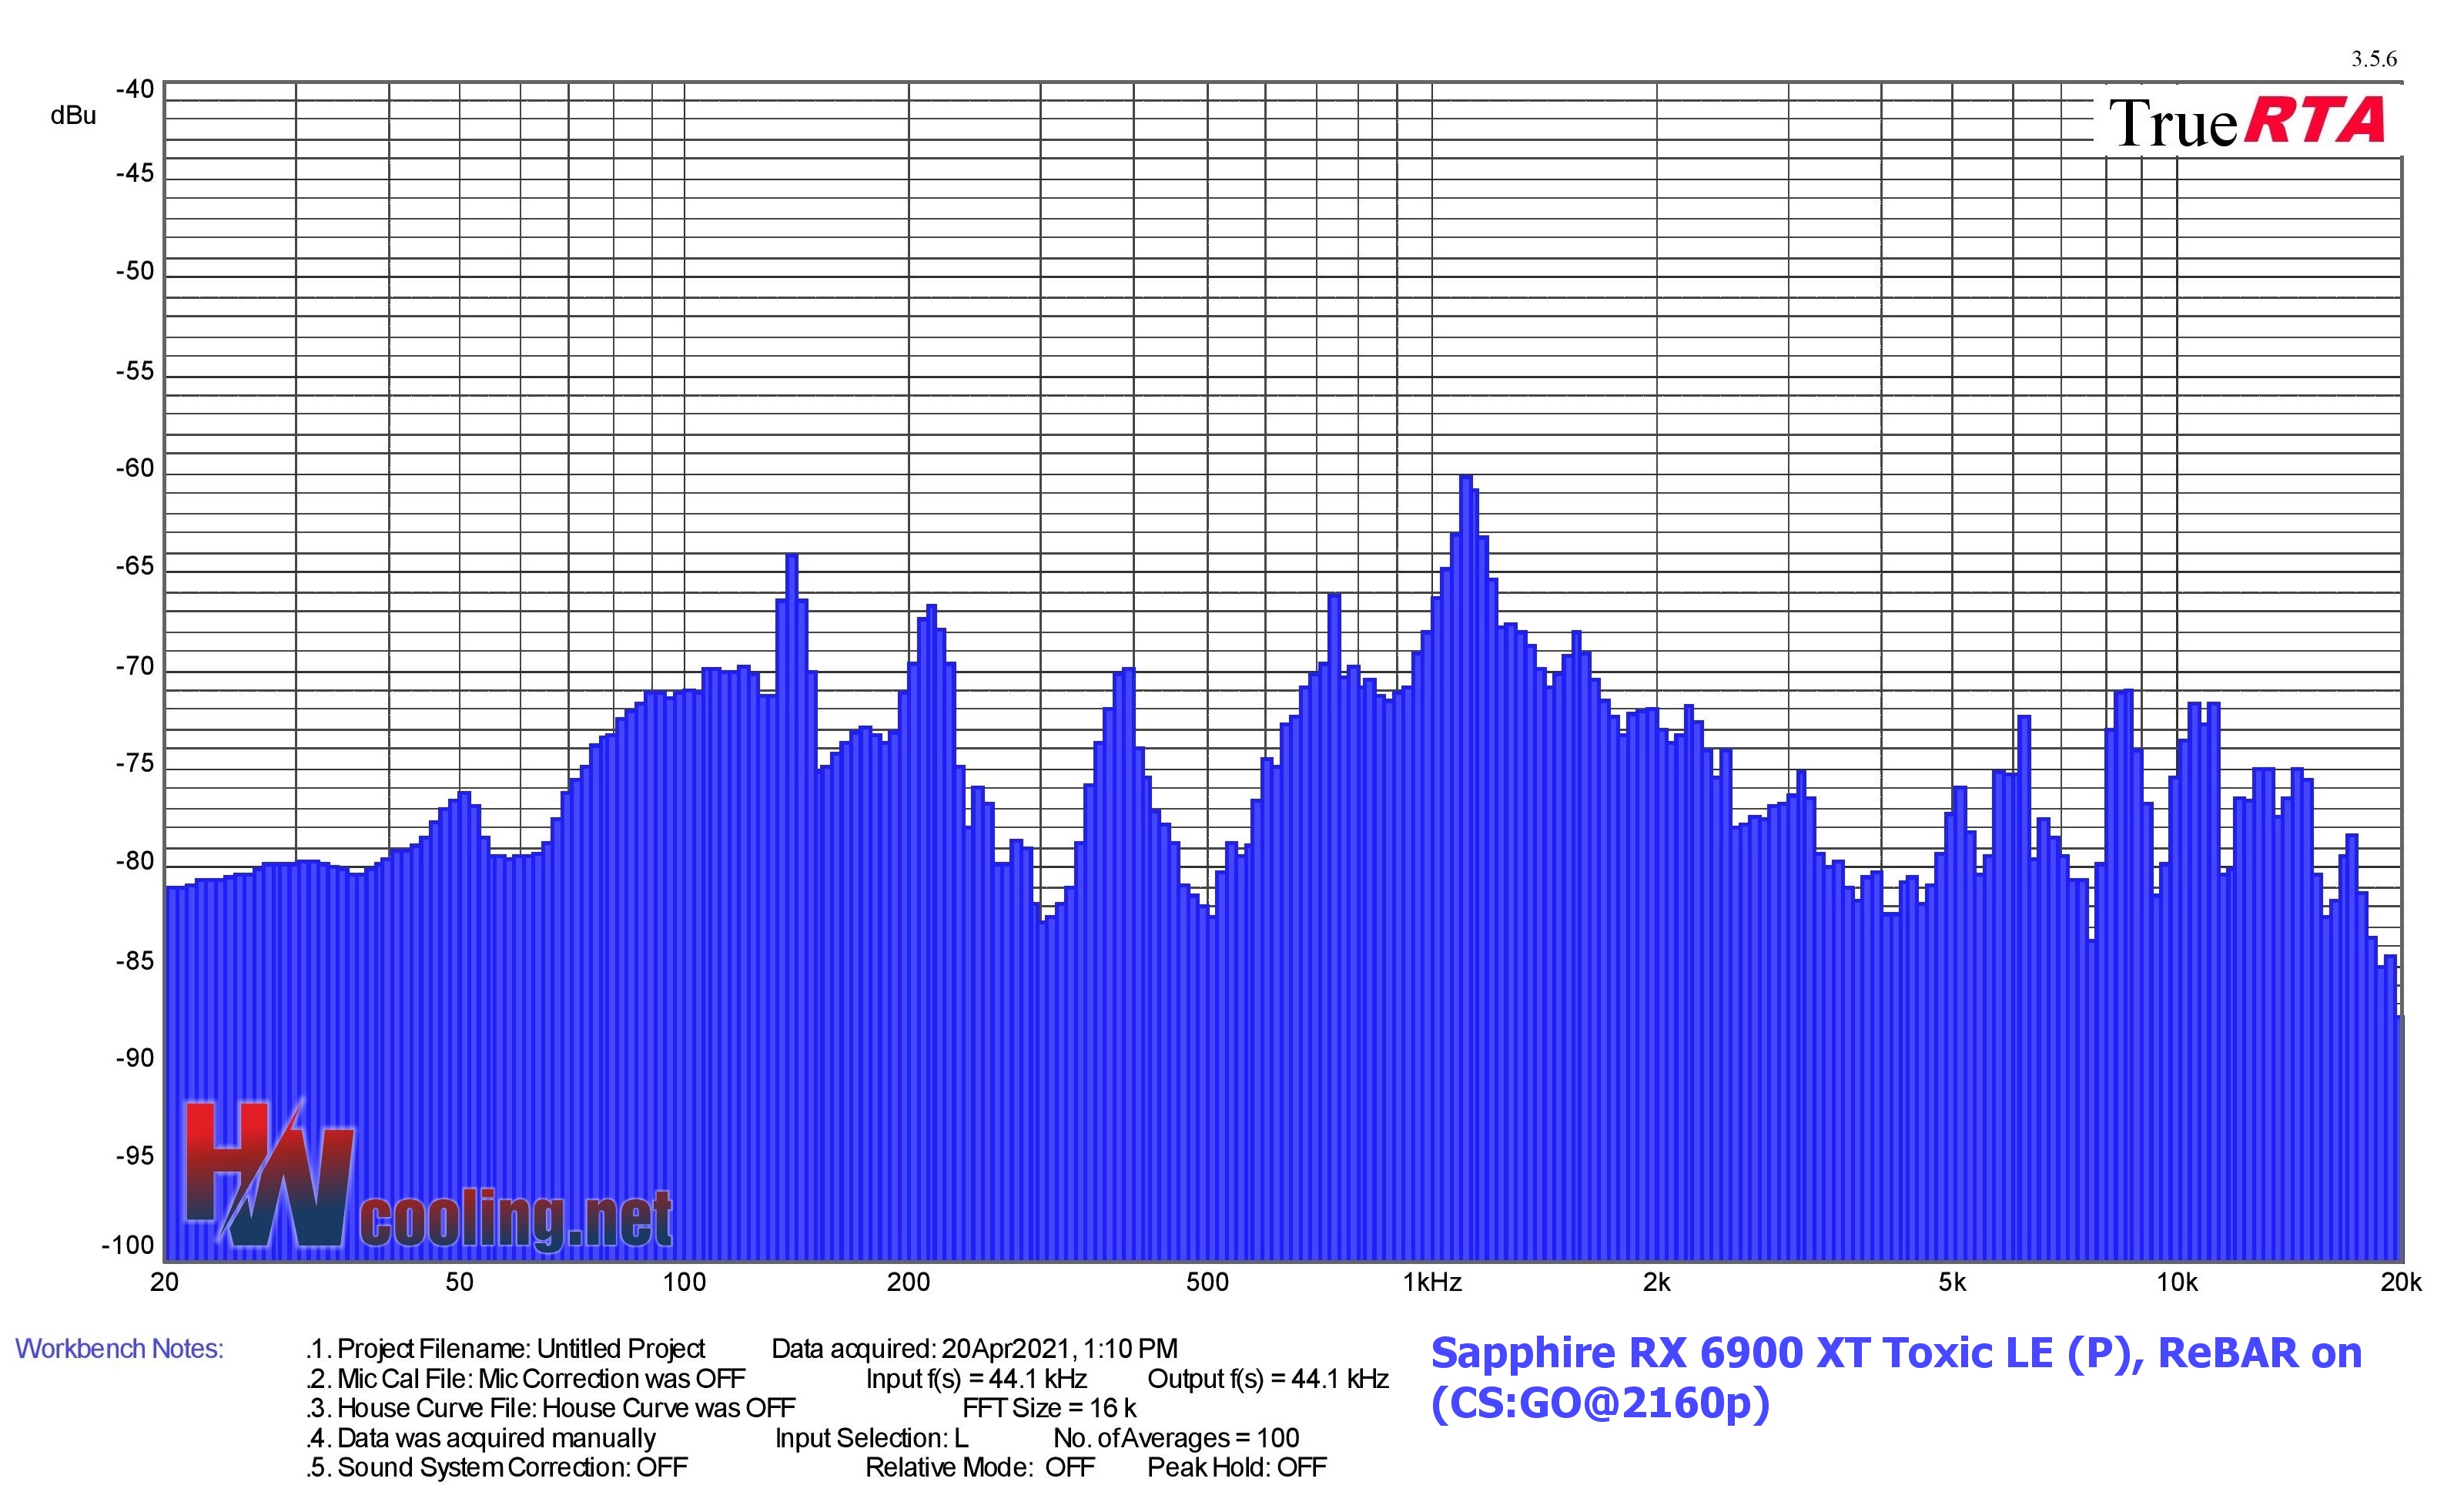
| Sapphire RX 6900 XT Toxic LE (P), ReBAR on | Sapphire RX 6900 XT Toxic LE (P), ReBAR on | 138,486 | -64,084 | 1107,887 | -60,120 | 8610,779 | -70,906 |
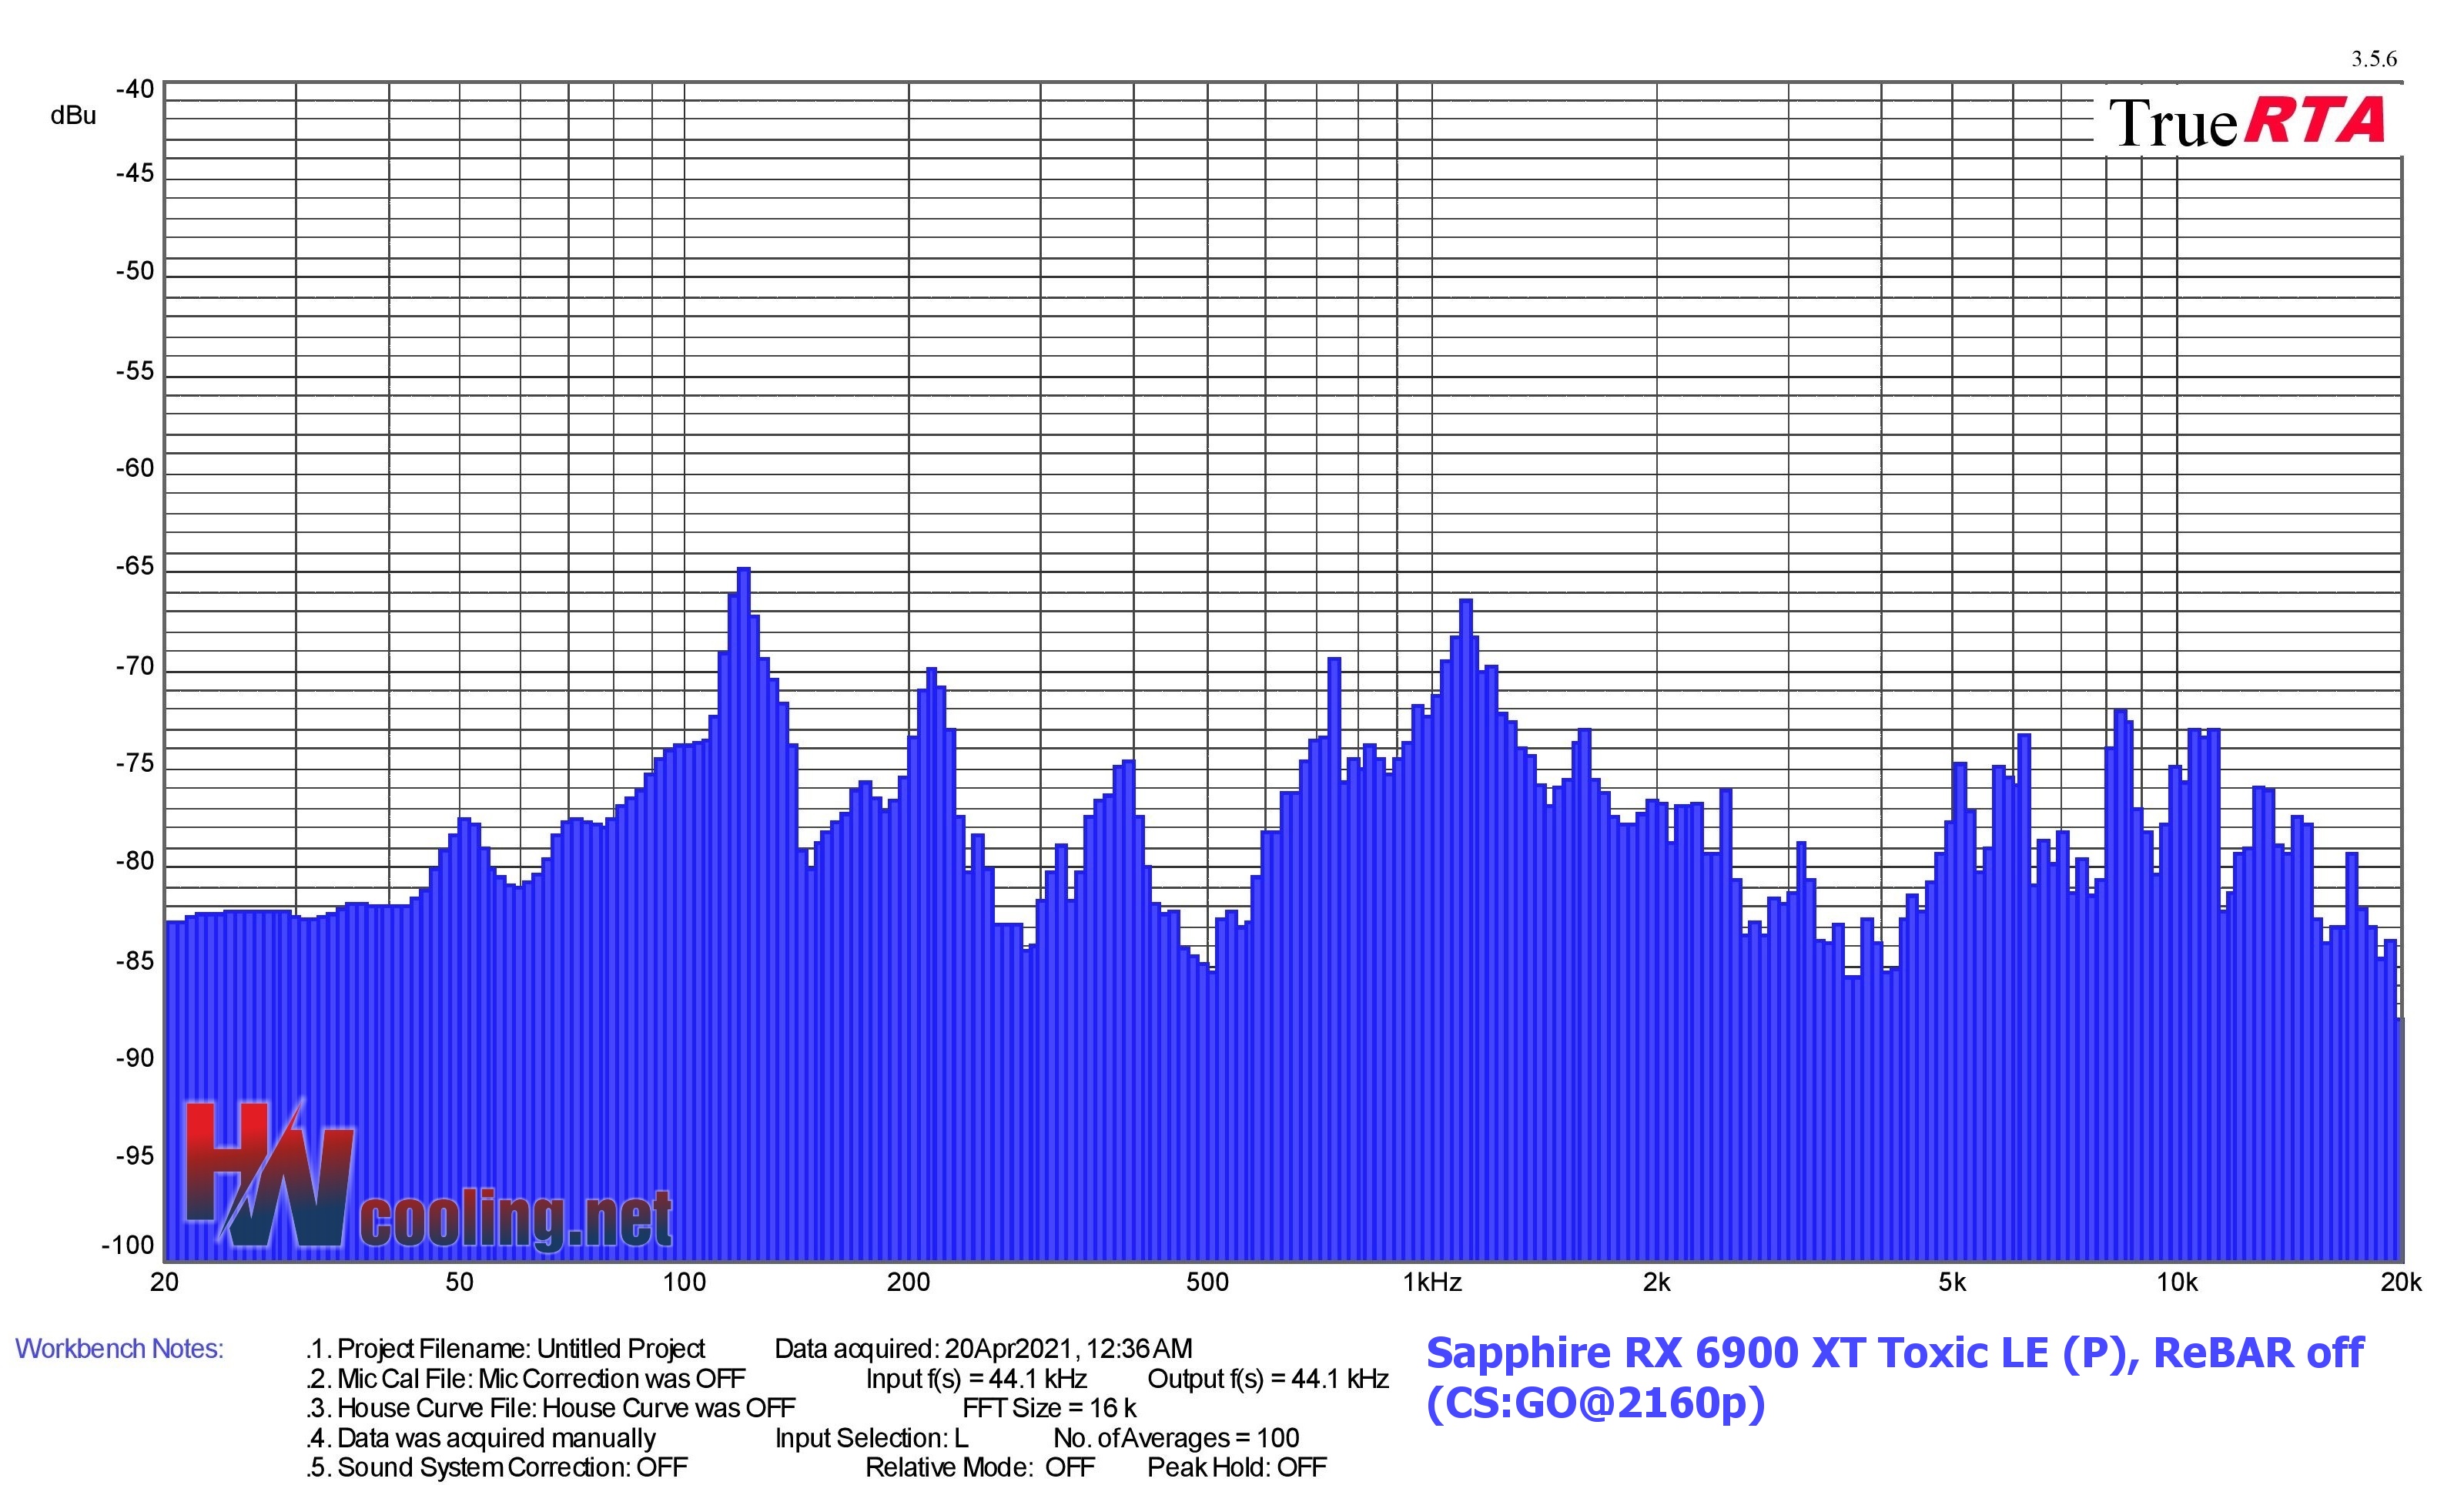
| Sapphire RX 6900 XT Toxic LE (P), ReBAR off | Sapphire RX 6900 XT Toxic LE (P), ReBAR off | 134,543 | -71,636 | 1107,887 | -66,438 | 8365,647 | -72,079 |
| Sapphire RX 6700 XT Nitro+ (P), ReBAR on | 100,794 | -72,597 | 1173,765 | -74,862 | 5915,406 | -74,613 | |
| Sapphire RX 6700 XT Nitro+ (P), ReBAR off | 100,794 | -75,012 | 1107,887 | -73,798 | 5747,006 | -74,232 | |
| MSI RTX 3060 Ti Gaming X Trio, ReBAR off | 100,794 | -71,442 | 1107,887 | -83,097 | 6267,154 | -82,469 | |
| Gigabyte RTX 3060 Eagle OC 12G, ReBAR off | 100,794 | -72,601 | 213,574 | -64,794 | 2031,873 | -73,810 | |
| MSI RTX 3090 Gaming X Trio, ReBAR off | 106,787 | -75,721 | 213,574 | -73,423 | 4695,061 | -77,625 | |
| MSI RTX 3070 Gaming X Trio, ReBAR off | 106,787 | -75,721 | 213,574 | -73,423 | 6267,154 | -82,711 | |
| AMD Radeon RX 6800, ReBAR on | 100,794 | -71,162 | 1107,887 | -66,232 | 9948,487 | -77,428 | |
| AMD Radeon RX 6800, ReBAR off | 100,794 | -71,103 | 1076,347 | -77,328 | 9665,273 | -77,714 | |
| TUF RTX 3080 O10G Gaming, ReBAR off | 100,794 | -74,208 | 1076,347 | -70,919 | 7240,773 | -74,402 | |
| AMD Radeon RX 6800 XT, ReBAR on | 100,794 | -72,999 | 1107,887 | -74,302 | 7671,332 | -72,419 | |
| AMD Radeon RX 6800 XT, ReBAR off | 100,794 | -72,346 | 1107,887 | -73,732 | 10848,902 | -72,534 |

| Graphics card | Dominant sound freq. and noise level in Blender (Cycles), Classroom | NF-F12 PWM | NF-A15 PWM | ||||
| Low range | Mid range | High range | |||||
| Frequency [Hz] | Noise level [dBu] | Frequency [Hz] | Noise level [dBu] | Frequency [Hz] | Noise level [dBu] | ||
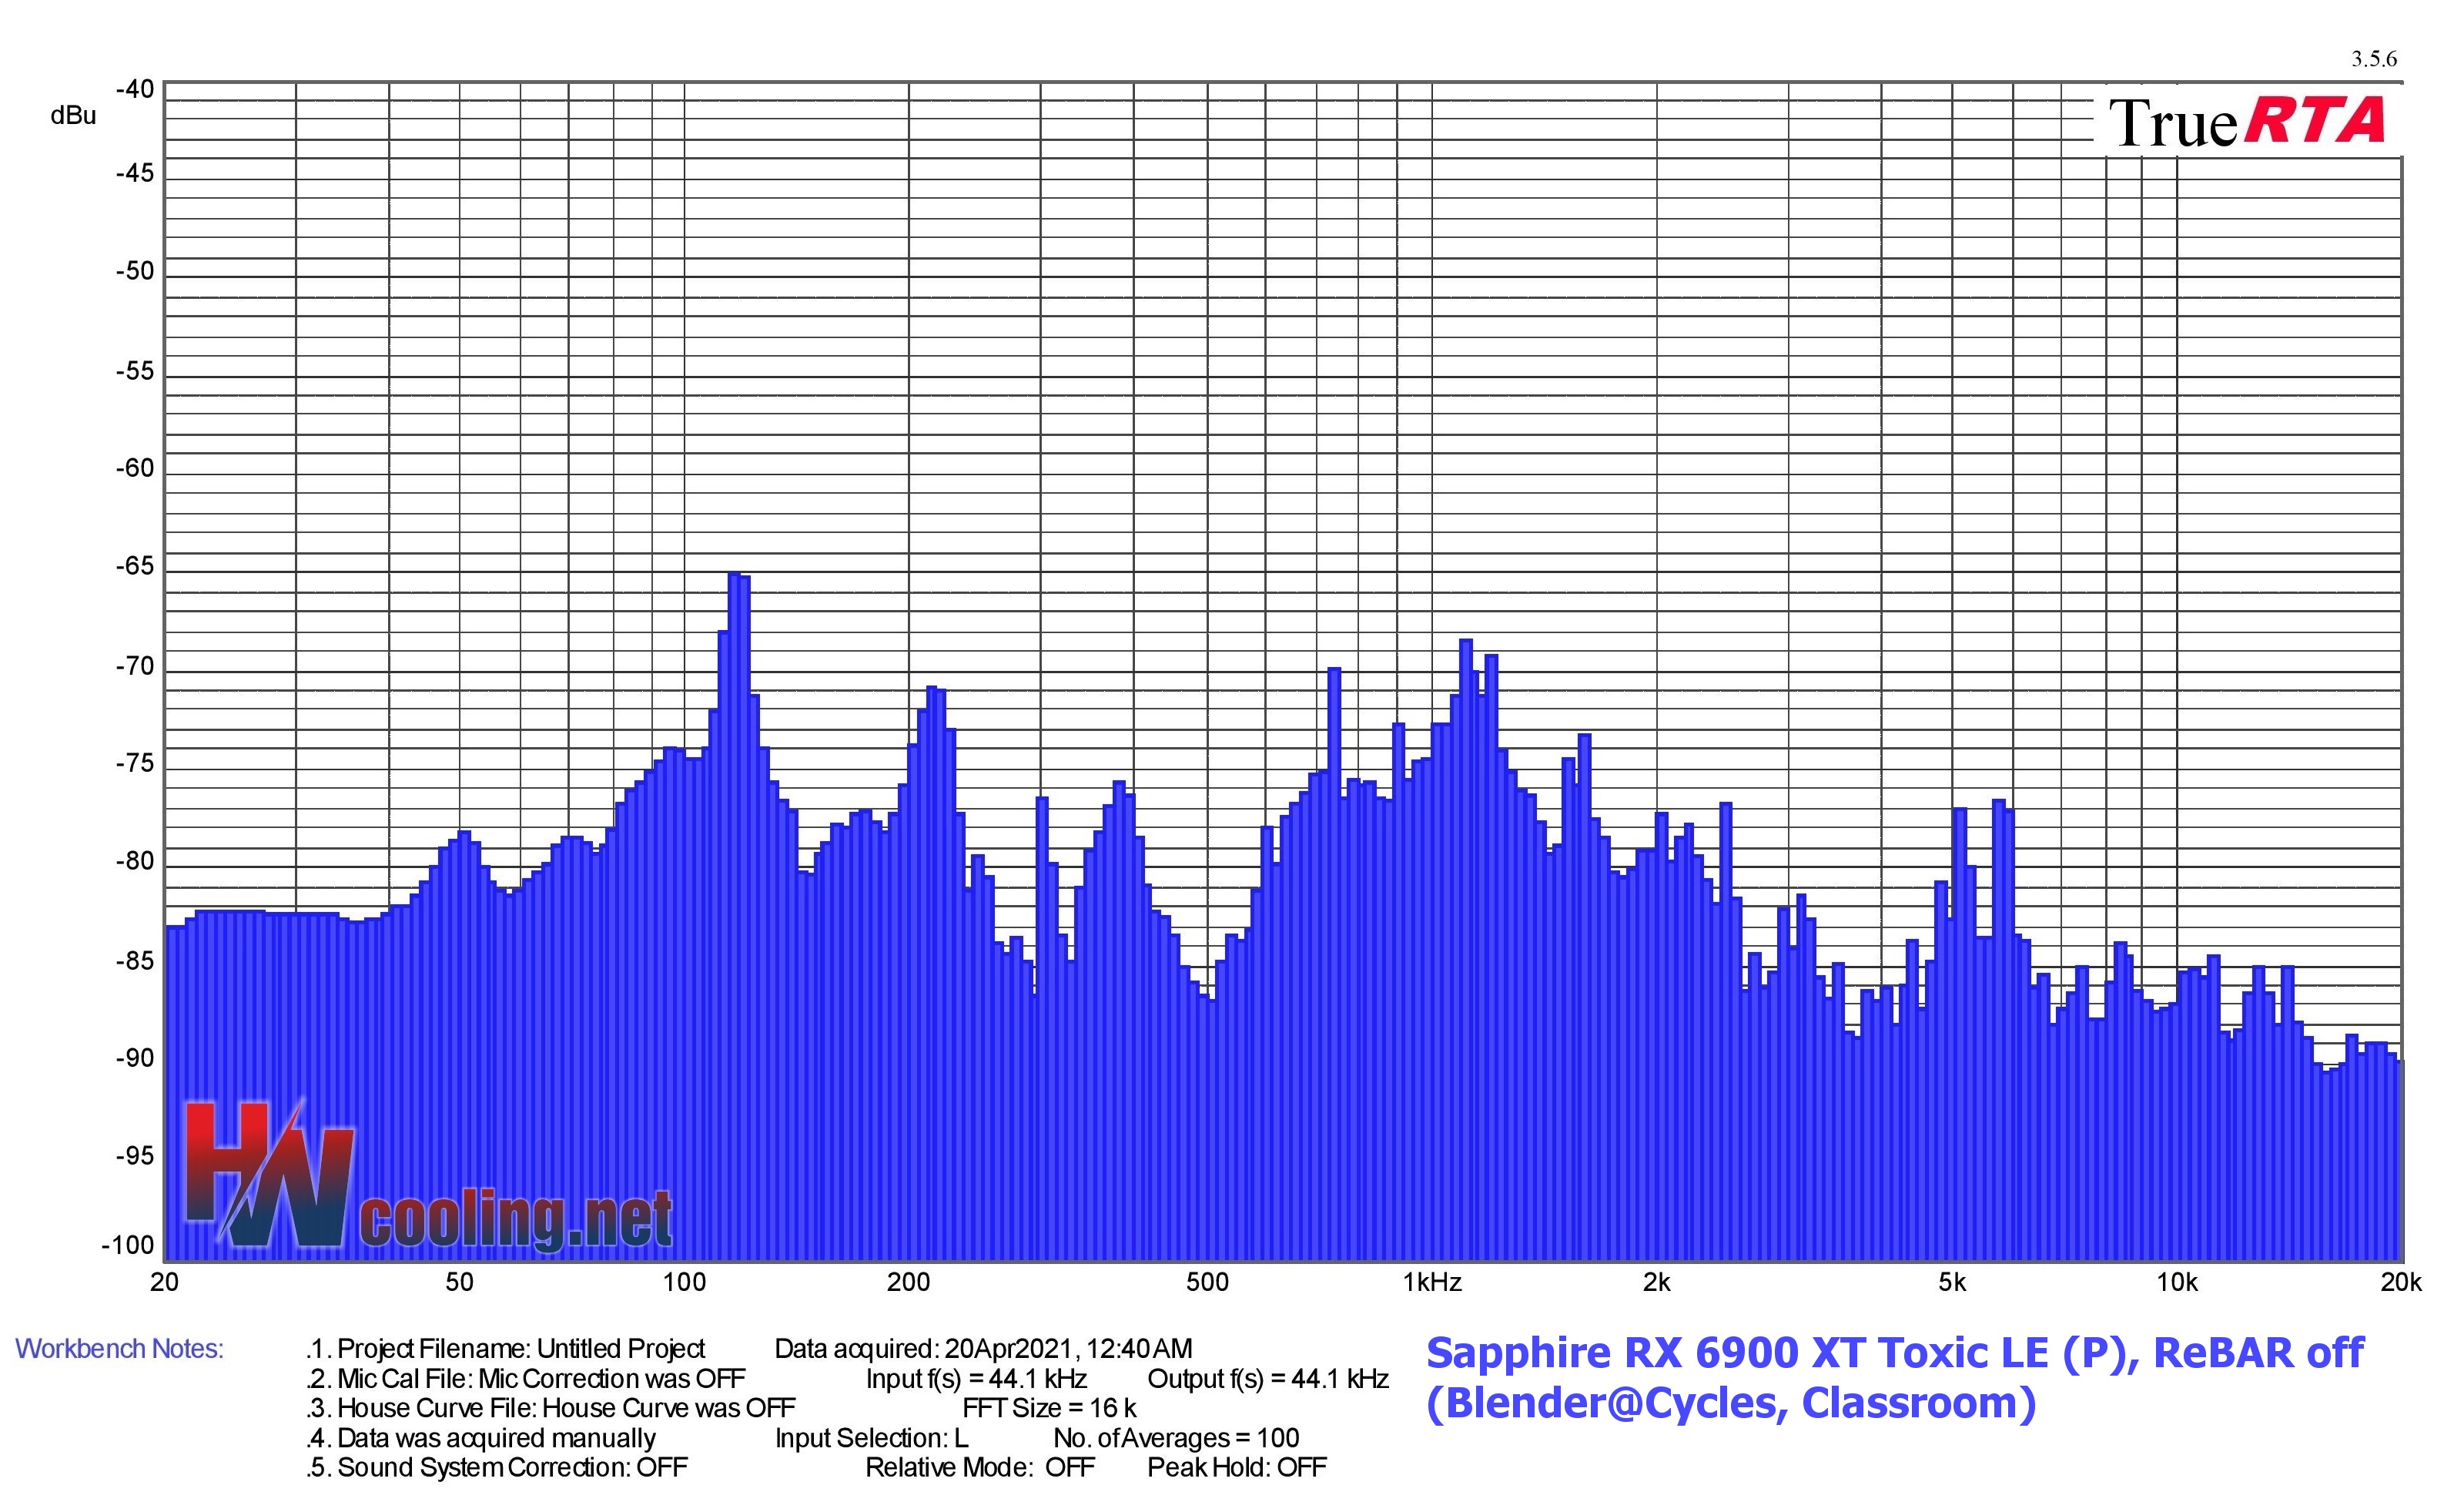
| Sapphire RX 6900 XT Toxic LE (P), ReBAR on | 116,452 | -64,976 | 1107,887 | -68,460 | 5120,000 | -77,286 | |
| Sapphire RX 6900 XT Toxic LE (P), ReBAR off | 116,452 | -65,079 | 1107,887 | -68,368 | 5120,000 | -77,057 | |
| Sapphire RX 6700 XT Nitro+ (P), ReBAR on | 100,794 | -72,645 | 1173,765 | -86,606 | 5915,406 | -82,388 | |
| Sapphire RX 6700 XT Nitro+ (P), ReBAR off | 100,794 | -75,786 | 1076,347 | -87,229 | 5915,406 | -82,066 | |
| MSI RTX 3060 Ti Gaming X Trio, ReBAR off | 100,794 | -70,442 | 987,015 | -89,548 | 6450,796 | -88,958 | |
| Gigabyte RTX 3060 Eagle OC 12G, ReBAR off | 100,794 | -72,605 | 213,574 | -70,007 | 2031,873 | -79,089 | |
| MSI RTX 3090 Gaming X Trio, ReBAR off | 100,794 | -71,224 | 1076,347 | -85,314 | 5915,406 | -91,953 | |
| MSI RTX 3070 Gaming X Trio, ReBAR off | 100,794 | -71,224 | 1076,347 | -85,314 | 18245,606 | -90,785 | |
| AMD Radeon RX 6800, ReBAR on | 100,794 | -71,913 | 987,015 | -89,190 | 7452,944 | -88,332 | |
| AMD Radeon RX 6800, ReBAR off | 100,794 | -71,136 | 987,015 | -89,041 | 7452,944 | -88,237 | |
| TUF RTX 3080 O10G Gaming, ReBAR off | 106,787 | -81,541 | 1659,995 | -80,568 | 6834,380 | -77,967 | |
| AMD Radeon RX 6800 XT, ReBAR on | 97,924 | -79,763 | 1208,159 | -89,625 | 7671,332 | -85,188 | |
| AMD Radeon RX 6800 XT, ReBAR off | 100,794 | -72,980 | 1243,561 | -95,235 | 7671,332 | -84,980 |
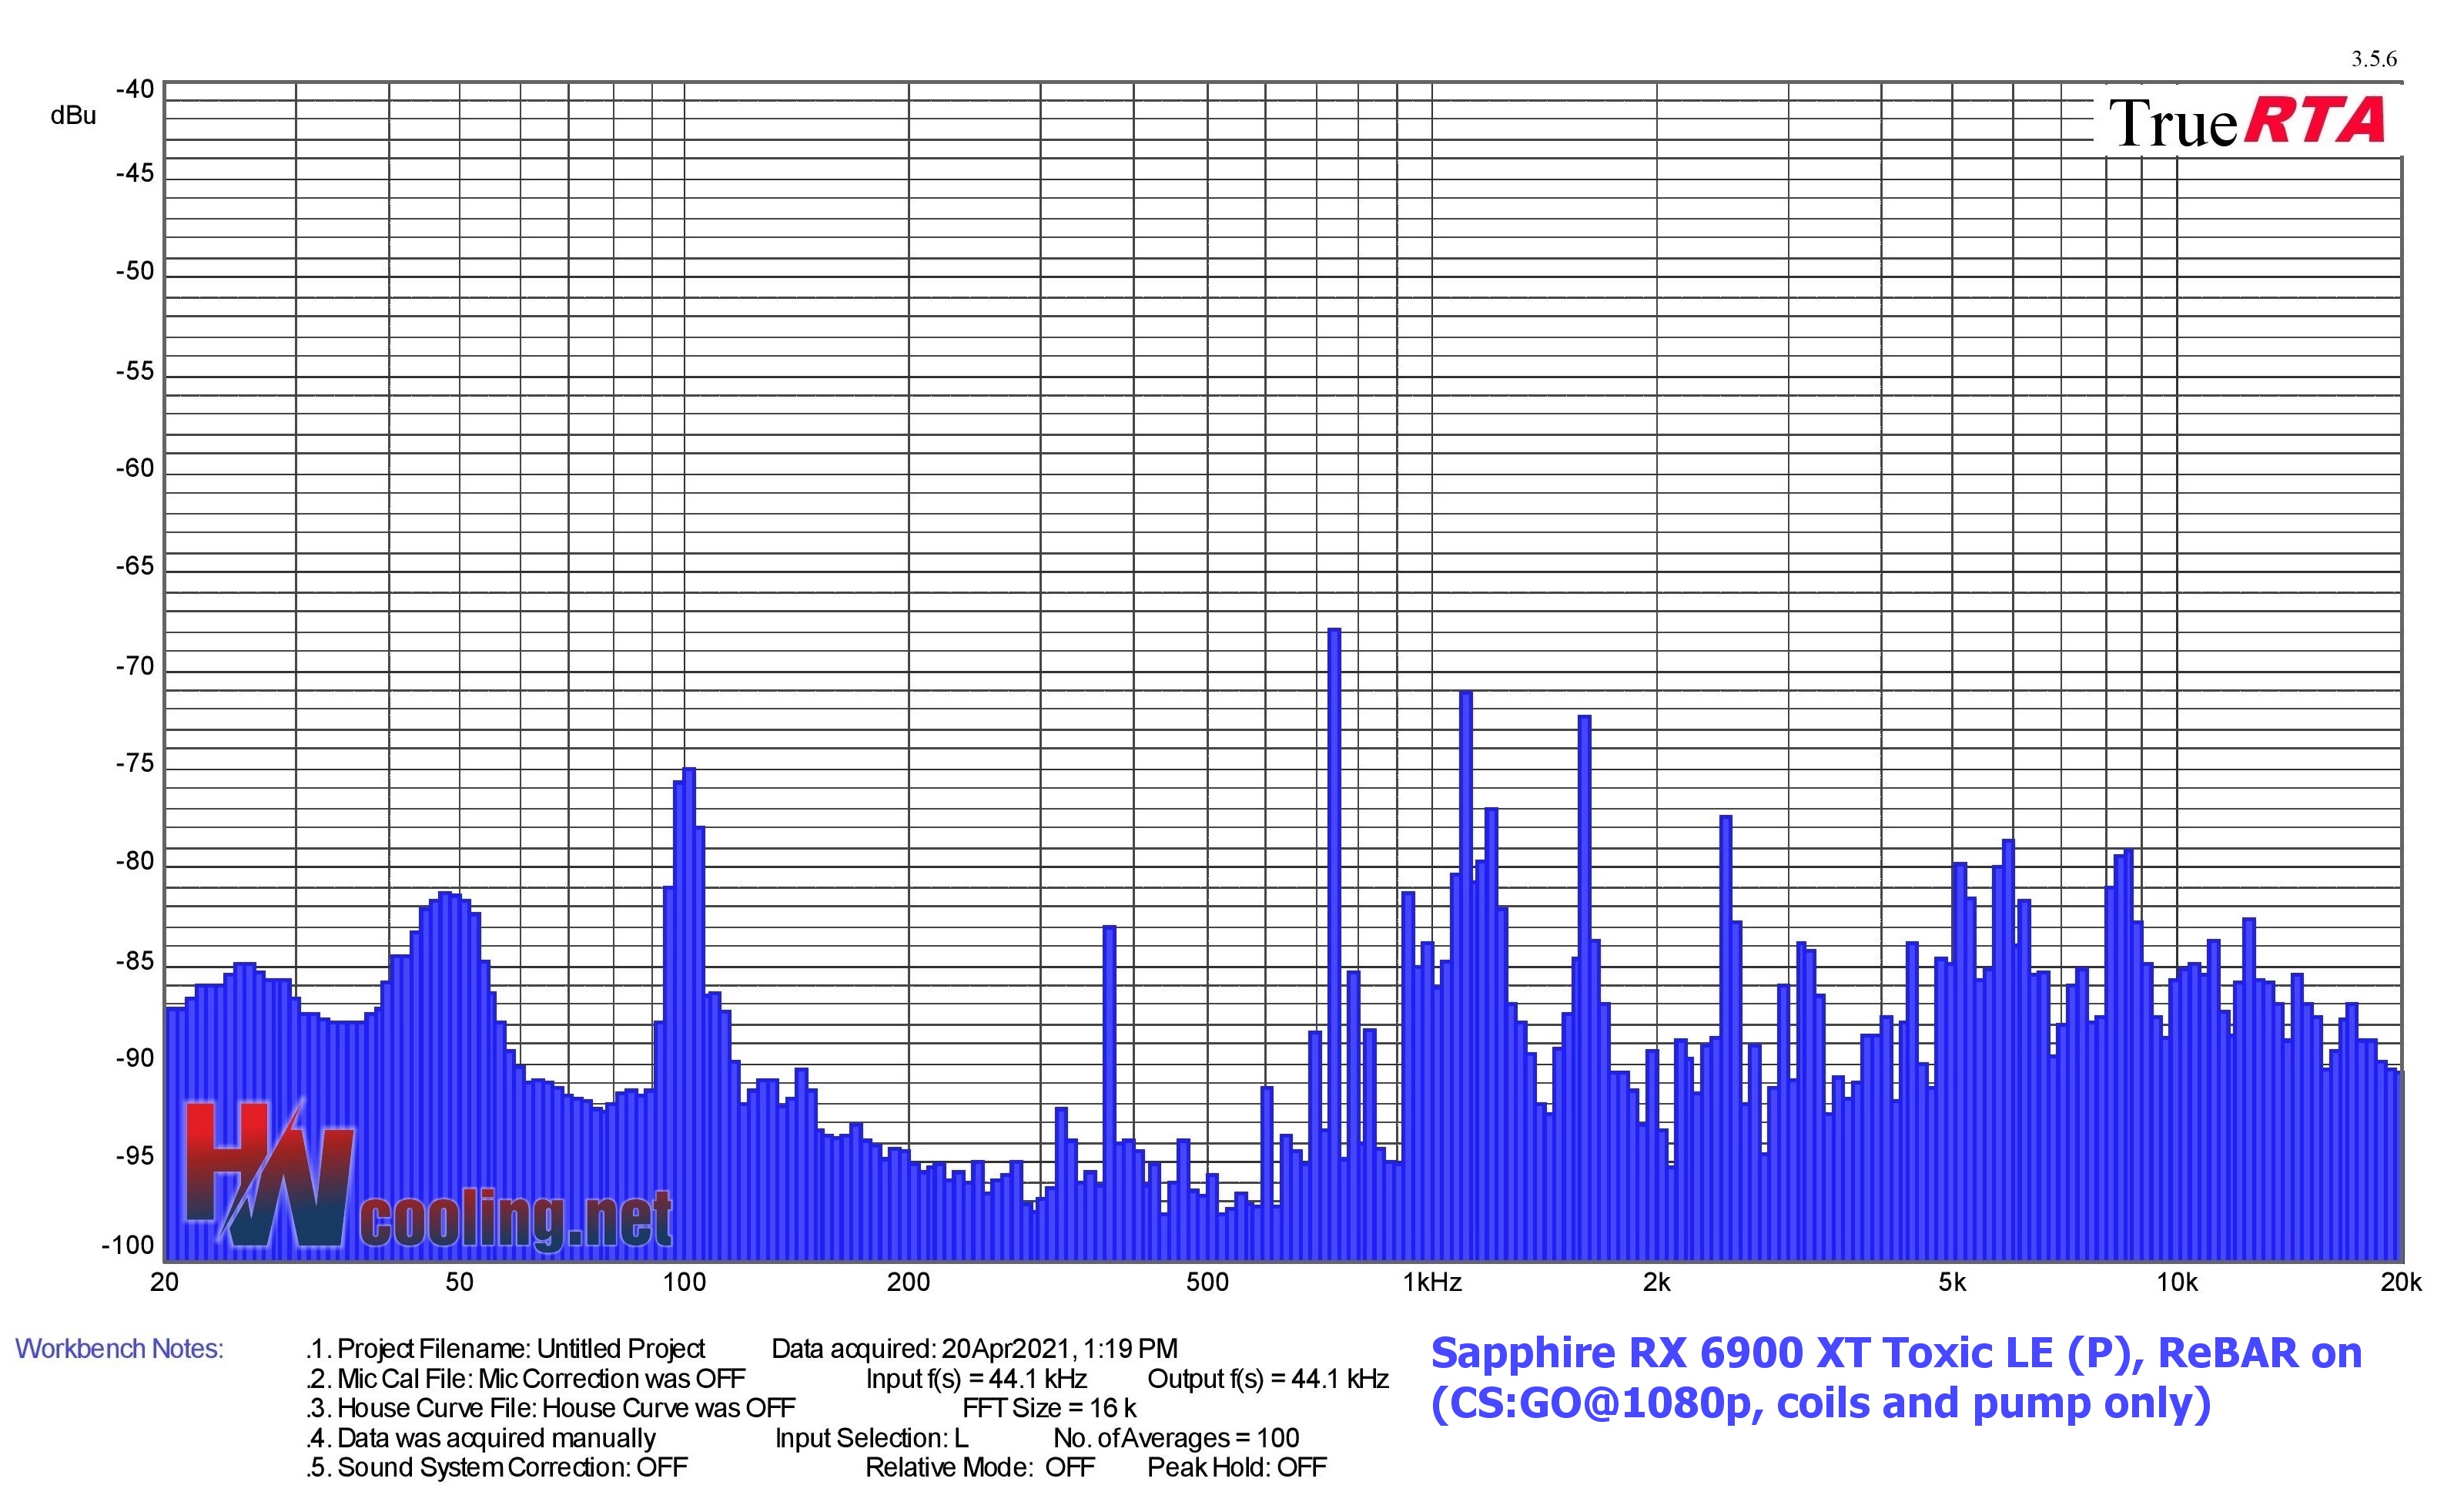
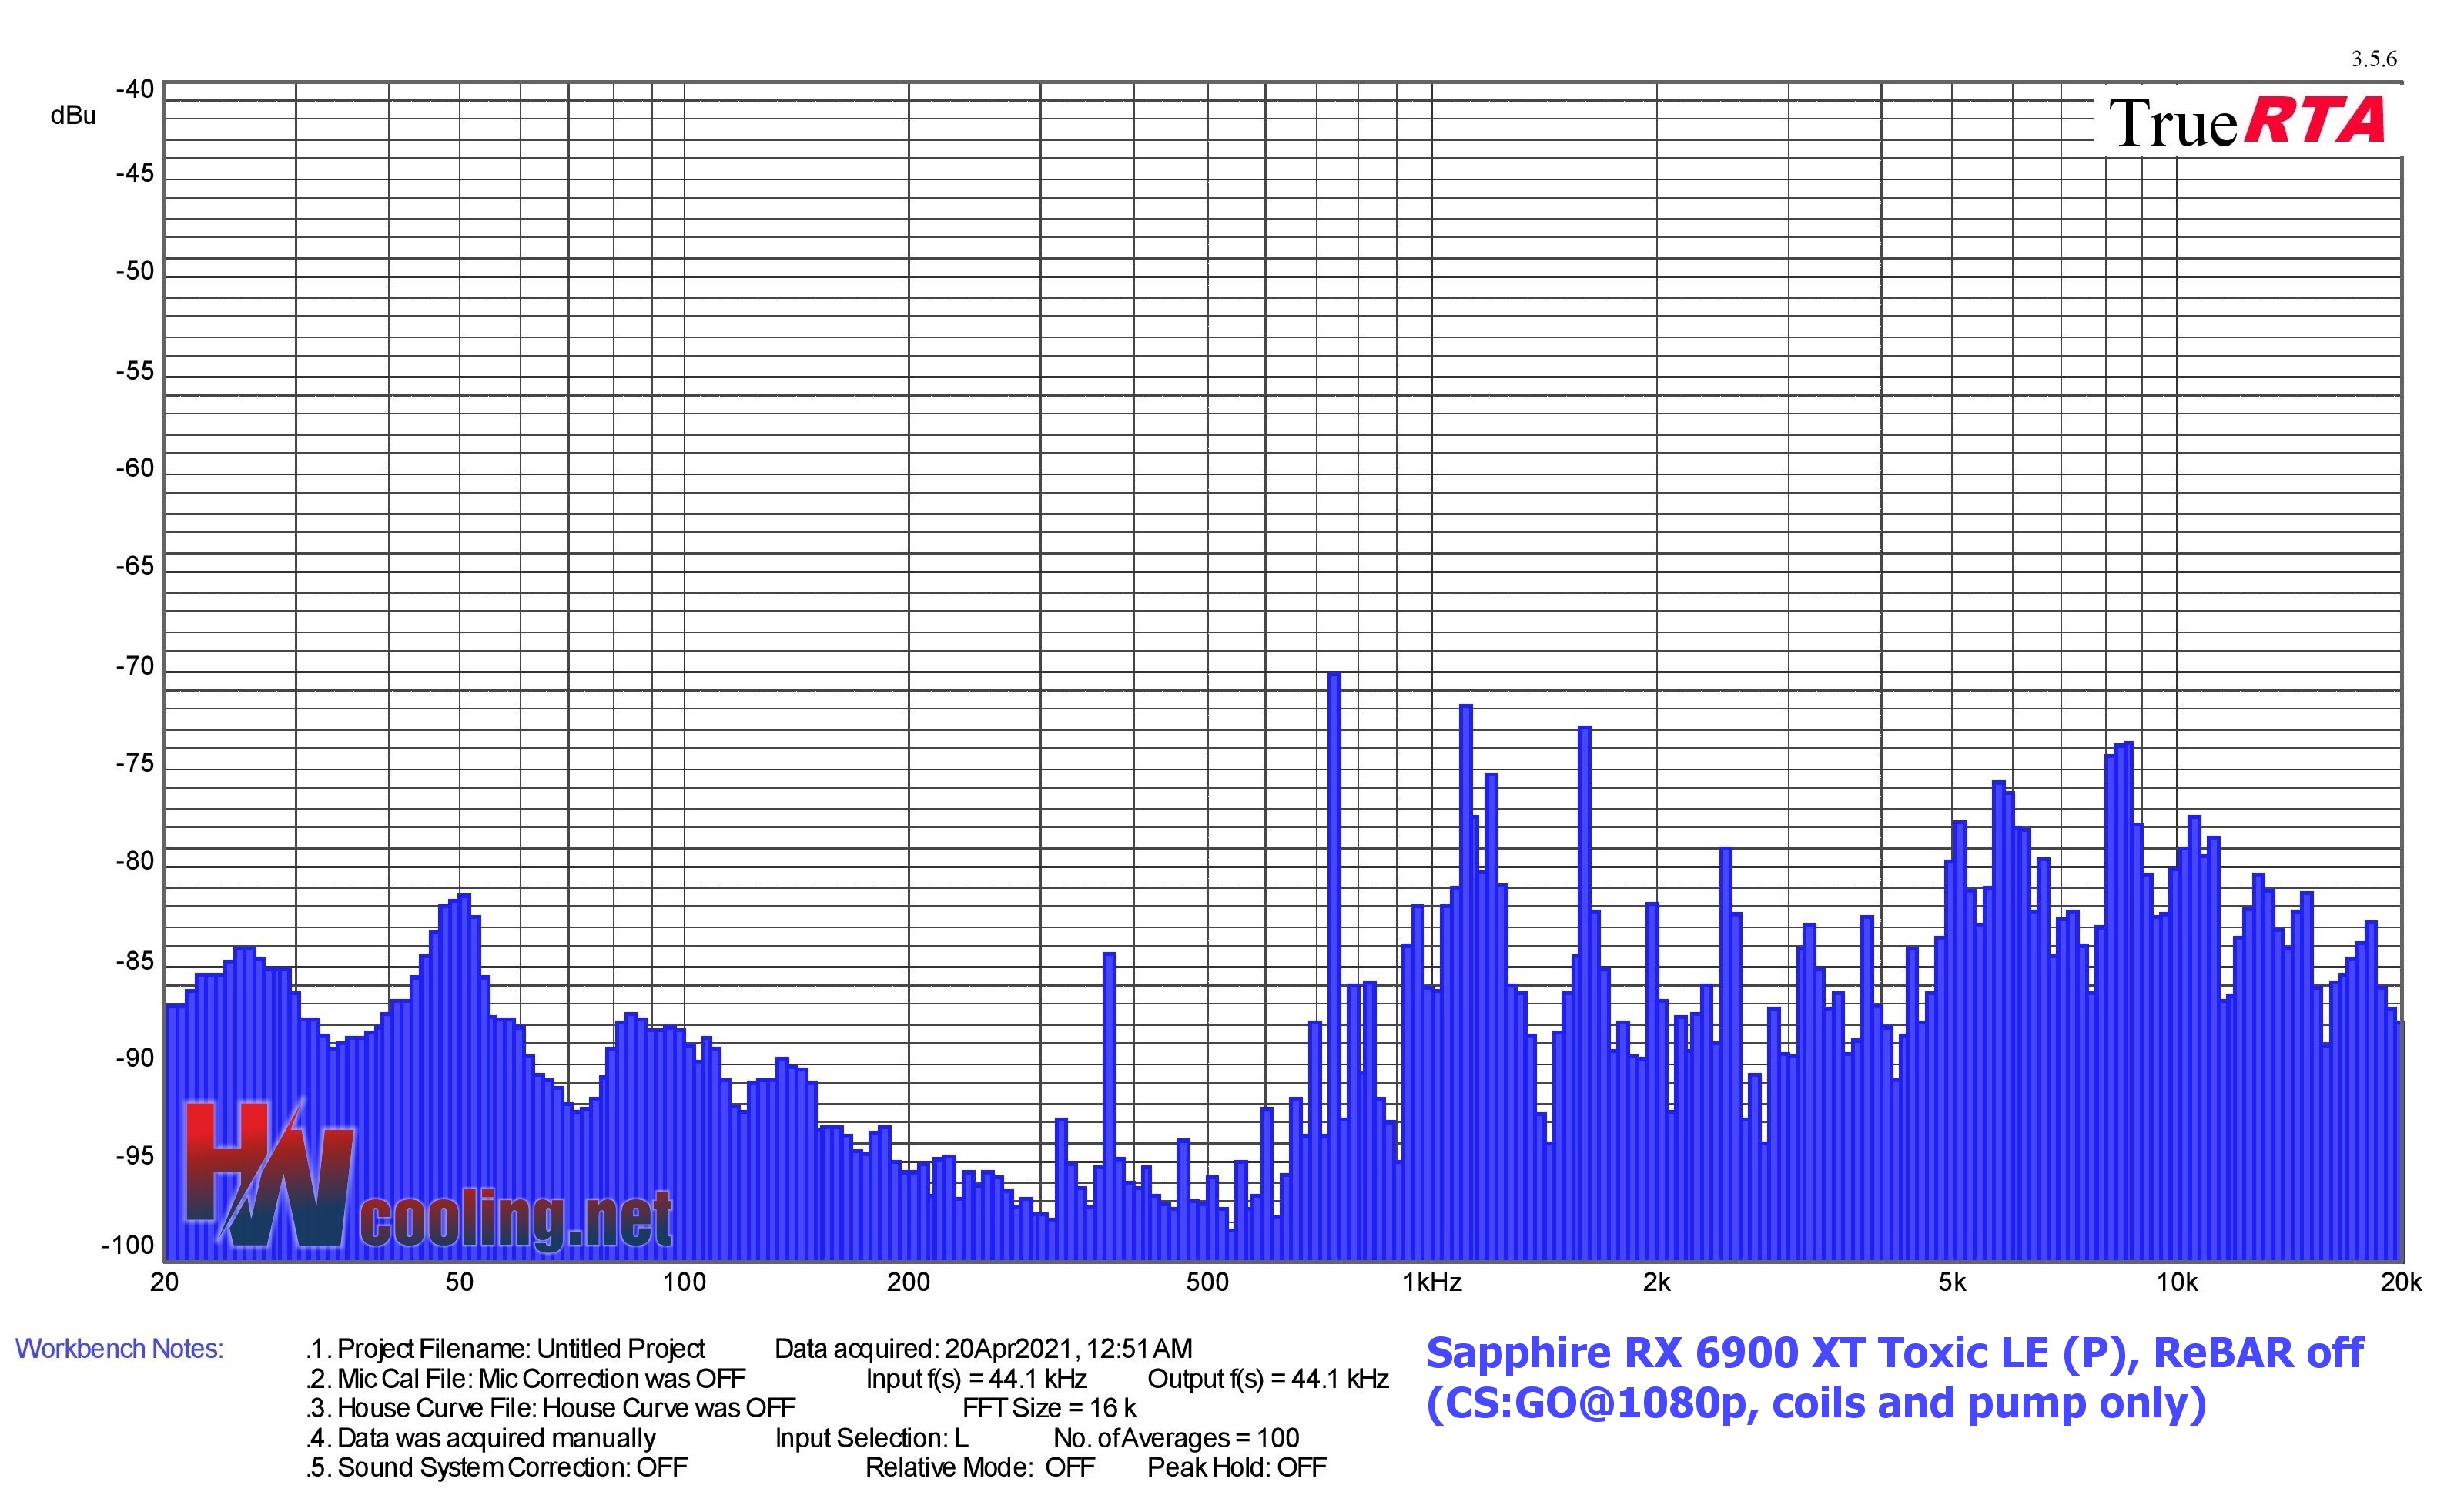
| Graphics card | Dominant sound freq. and noise level in CS:GO@1080p (coils only*) | NF-F12 PWM | NF-A15 PWM | ||||
| Low range | Mid range | High range | |||||
| Frequency [Hz] | Noise level [dBu] | Frequency [Hz] | Noise level [dBu] | Frequency [Hz] | Noise level [dBu] | ||
| Sapphire RX 6900 XT Toxic LE (P), ReBAR on | Sapphire RX 6900 XT Toxic LE (P), ReBAR on | 100,794 | -74,924 | 739,426 | -67,881 | 5915,406 | -78,532 |
| Sapphire RX 6900 XT Toxic LE (P), ReBAR off | Sapphire RX 6900 XT Toxic LE (P), ReBAR off | 50,397 | -81,369 | 739,426 | -70,223 | 8610,779 | -73,597 |
| Sapphire RX 6700 XT Nitro+ (P), ReBAR on | 100,794 | -74,648 | 987,015 | -84,777 | 5747,006 | -69,614 | |
| Sapphire RX 6700 XT Nitro+ (P), ReBAR off | 100,794 | -74,670 | 1395,850 | -88,408 | 5747,006 | -70,289 | |
| MSI RTX 3060 Ti Gaming X Trio, ReBAR off | 100,794 | -73,006 | 2152,695 | -86,379 | 6267,154 | -83,576 | |
| Gigabyte RTX 3060 Eagle OC 12G, ReBAR off | 100,794 | -73,575 | 1974,030 | -90,249 | 6088,740 | -83,145 | |
| MSI RTX 3090 Gaming X Trio, ReBAR off | 50,397 | -76,126 | 987,015 | -84,836 | 5915,406 | -83,323 | |
| MSI RTX 3070 Gaming X Trio, ReBAR off | 100,794 | -74,662 | 1317,507 | -81,448 | 6088,740 | -84,631 | |
| AMD Radeon RX 6800, ReBAR on | 100,794 | -71,813 | 987,015 | -87,658 | 7452,944 | -80,420 | |
| AMD Radeon RX 6800, ReBAR off | 100,794 | -72,013 | 1659,955 | -90,354 | 8863,094 | -84,530 | |
| TUF RTX 3080 O10G Gaming, ReBAR off | 100,794 | -75,576 | 1140,350 | -81,739 | 9948,487 | -78,734 | |
| AMD Radeon RX 6800 XT, ReBAR on | 100,794 | -73,593 | 1659,955 | -79,766 | 7452,944 | -73,997 | |
| AMD Radeon RX 6800 XT, ReBAR off | 100,794 | -73,272 | 1659,955 | -83,327 | 7452,944 | -76,372 |
*With the Sapphire RX 6900 XT Toxic LE, as with the only tested graphics card, the spectral analysis also includes the sound of the water pump.
- Contents
- Sapphire RX 6900 Toxic LE in detail
- Table of specifications
- Methodology: performance tests
- Methodology: how we measure power draw
- Methodology: noise and sound measurement
- Methodology: temperature tests
- Test rig
- 3DMark
- Age of Empires II: DE
- Assassin’s Creed: Valhalla
- Battlefield V
- Battlefield V with DXR
- Borderlands 3
- Control
- Control with DXR
- Counter-Strike: GO
- Cyberpunk 2077
- Cyberpunk 2077 with FidelityFX CAS
- Cyberpunk 2077 with DXR
- DOOM Eternal
- F1 2020
- FIFA 21
- Forza Horizon 4
- Mafia: DE
- Metro Exodus
- Metro Exodus with DXR
- Microsoft Flight Simulator
- Red Dead Redemption 2 (Vulkan)
- Red Dead Redemption 2 (Dx12)
- Shadow of the Tomb Raider
- Shadow of the Tomb Raider with DXR
- Total War Saga: Troy
- Wasteland 3
- Overall game performance and performance per euro
- CompuBench (OpenCL)
- SPECviewperf 2020 and SPECworkstation 3
- FLOPS, IOPS and memory speed tests
- 3D rendering 1/2 (LuxMark and Blender@Cycles)
- 3D rendering 2/2 (Blender@Radeon ProRender and Eevee)
- Photo editing (Adobe Photoshop, Lightroom a Affinity Photo)
- Broadcasting (OBS and Xsplit)
- Password cracking
- GPU clock speed
- GPU temperature
- Net graphics power draw and performance per watt
- Analysis of 12 V subcircuit power supply (higher load)
- Analysis of 12 V subcircuit power supply (lower load)
- Analysis of 3.3 V subcircuit power supply
- Noise level
- Frequency response of sound
- Conclusion