


Measuring the intensity (and power draw) of lighting
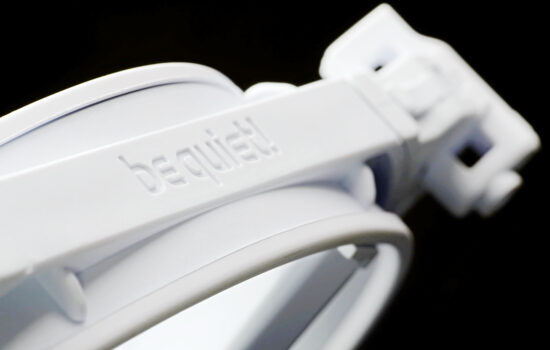
There aren’t many 140mm fans that are more popular than the NF-A14 (PWM). This Noctua model has maintained that for a long time, for over a decade. In the meantime, naturally, a host of newer competing solutions have come along, and the question is how Noctua’s still-flagship 140mm fan will hold up against them in the present day. By analyzing the NF-A14, we’ll also shorten a bit the interminable wait for its successor.
Measuring the intensity (and power draw) of lighting
Modern fans often include lighting. This is no longer a “cooling” parameter, but for some users the presence of (A)RGB LEDs is important. Therefore, we also measure how intense this lighting is in our tests. These tests are the only ones that take place externally, outside the wind tunnel.
We record the luminosity of the fans in a chamber with reflective walls. This internal arrangement is important to increase the resolution for us to measure anything at all with lower luminosity fans. But also so that the readings do not blend together and it is obvious which fan is emitting more light and which one less.
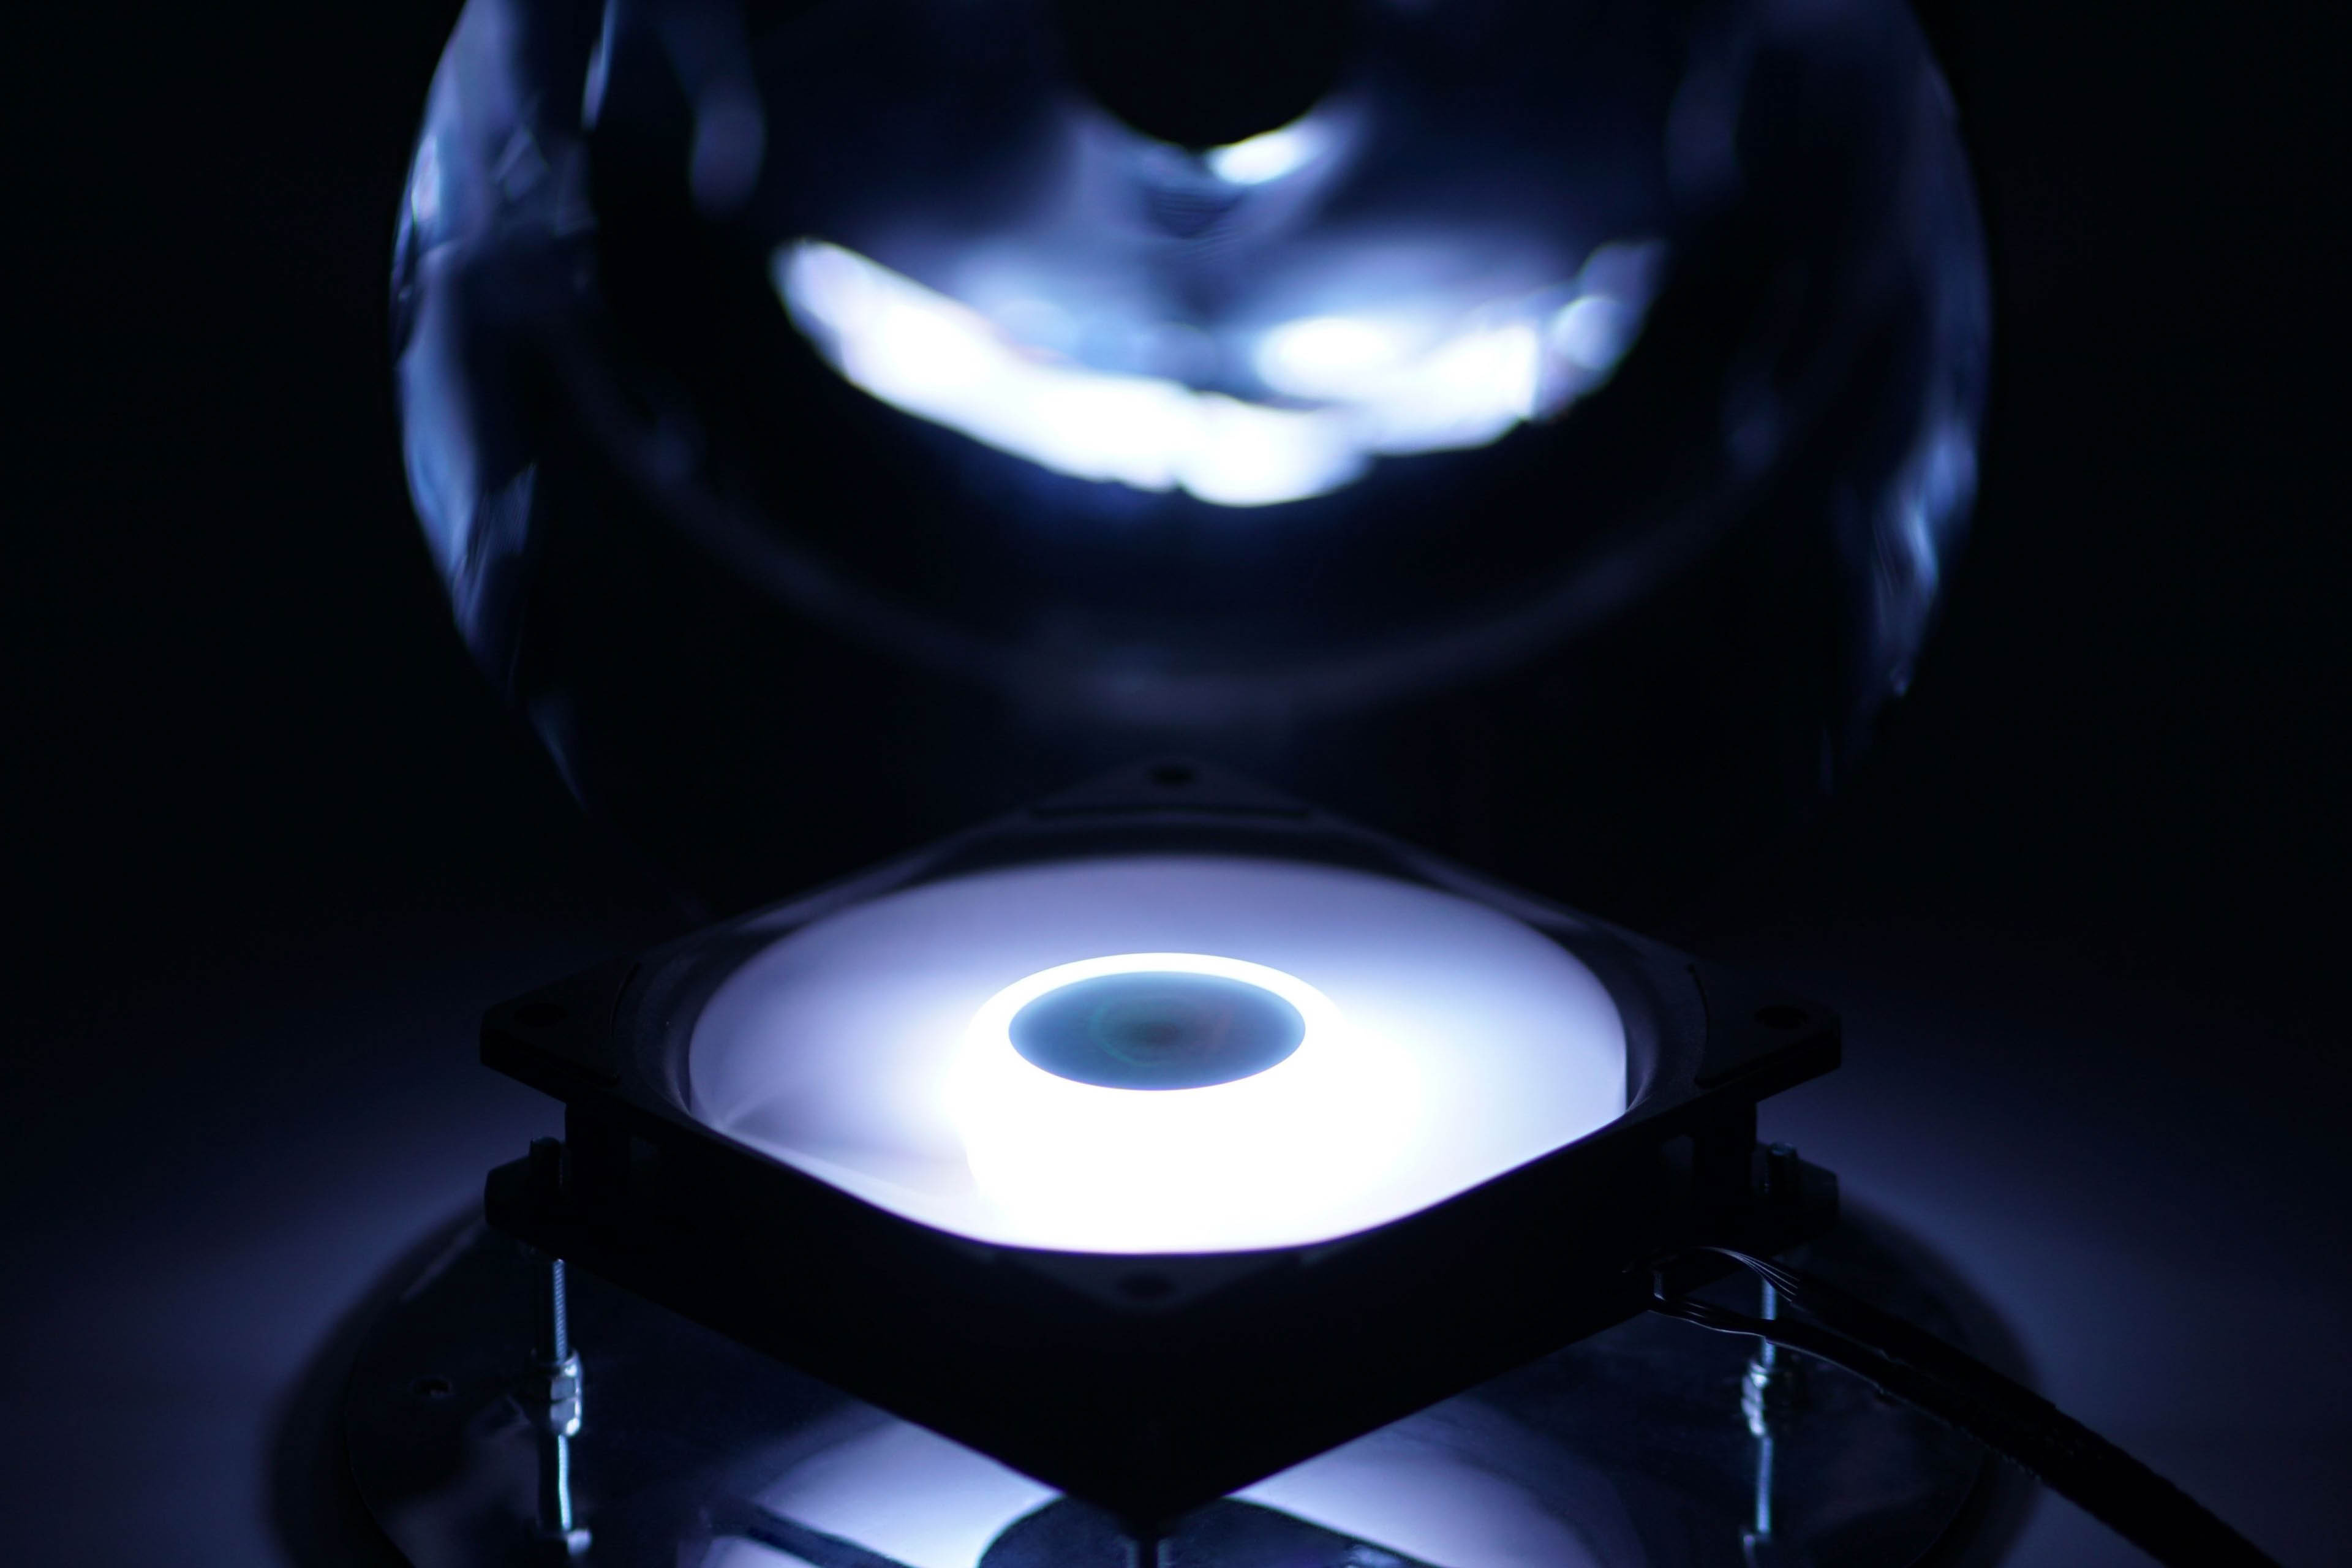
The illumination intensity is measured in the horizontal position of the fan, above which is the lux meter sensor (UNI-T UT383S). This is centered on the illumination intensity sensing chamber.
The illumination is controlled via an IR controller and the hue is set to RGB level 255, 255, 255 (white). We record the brightness at maximum and minimum intensity. According to this, you can easily see if the brightness is high enough, but conversely also if the lower level is low enough for you.
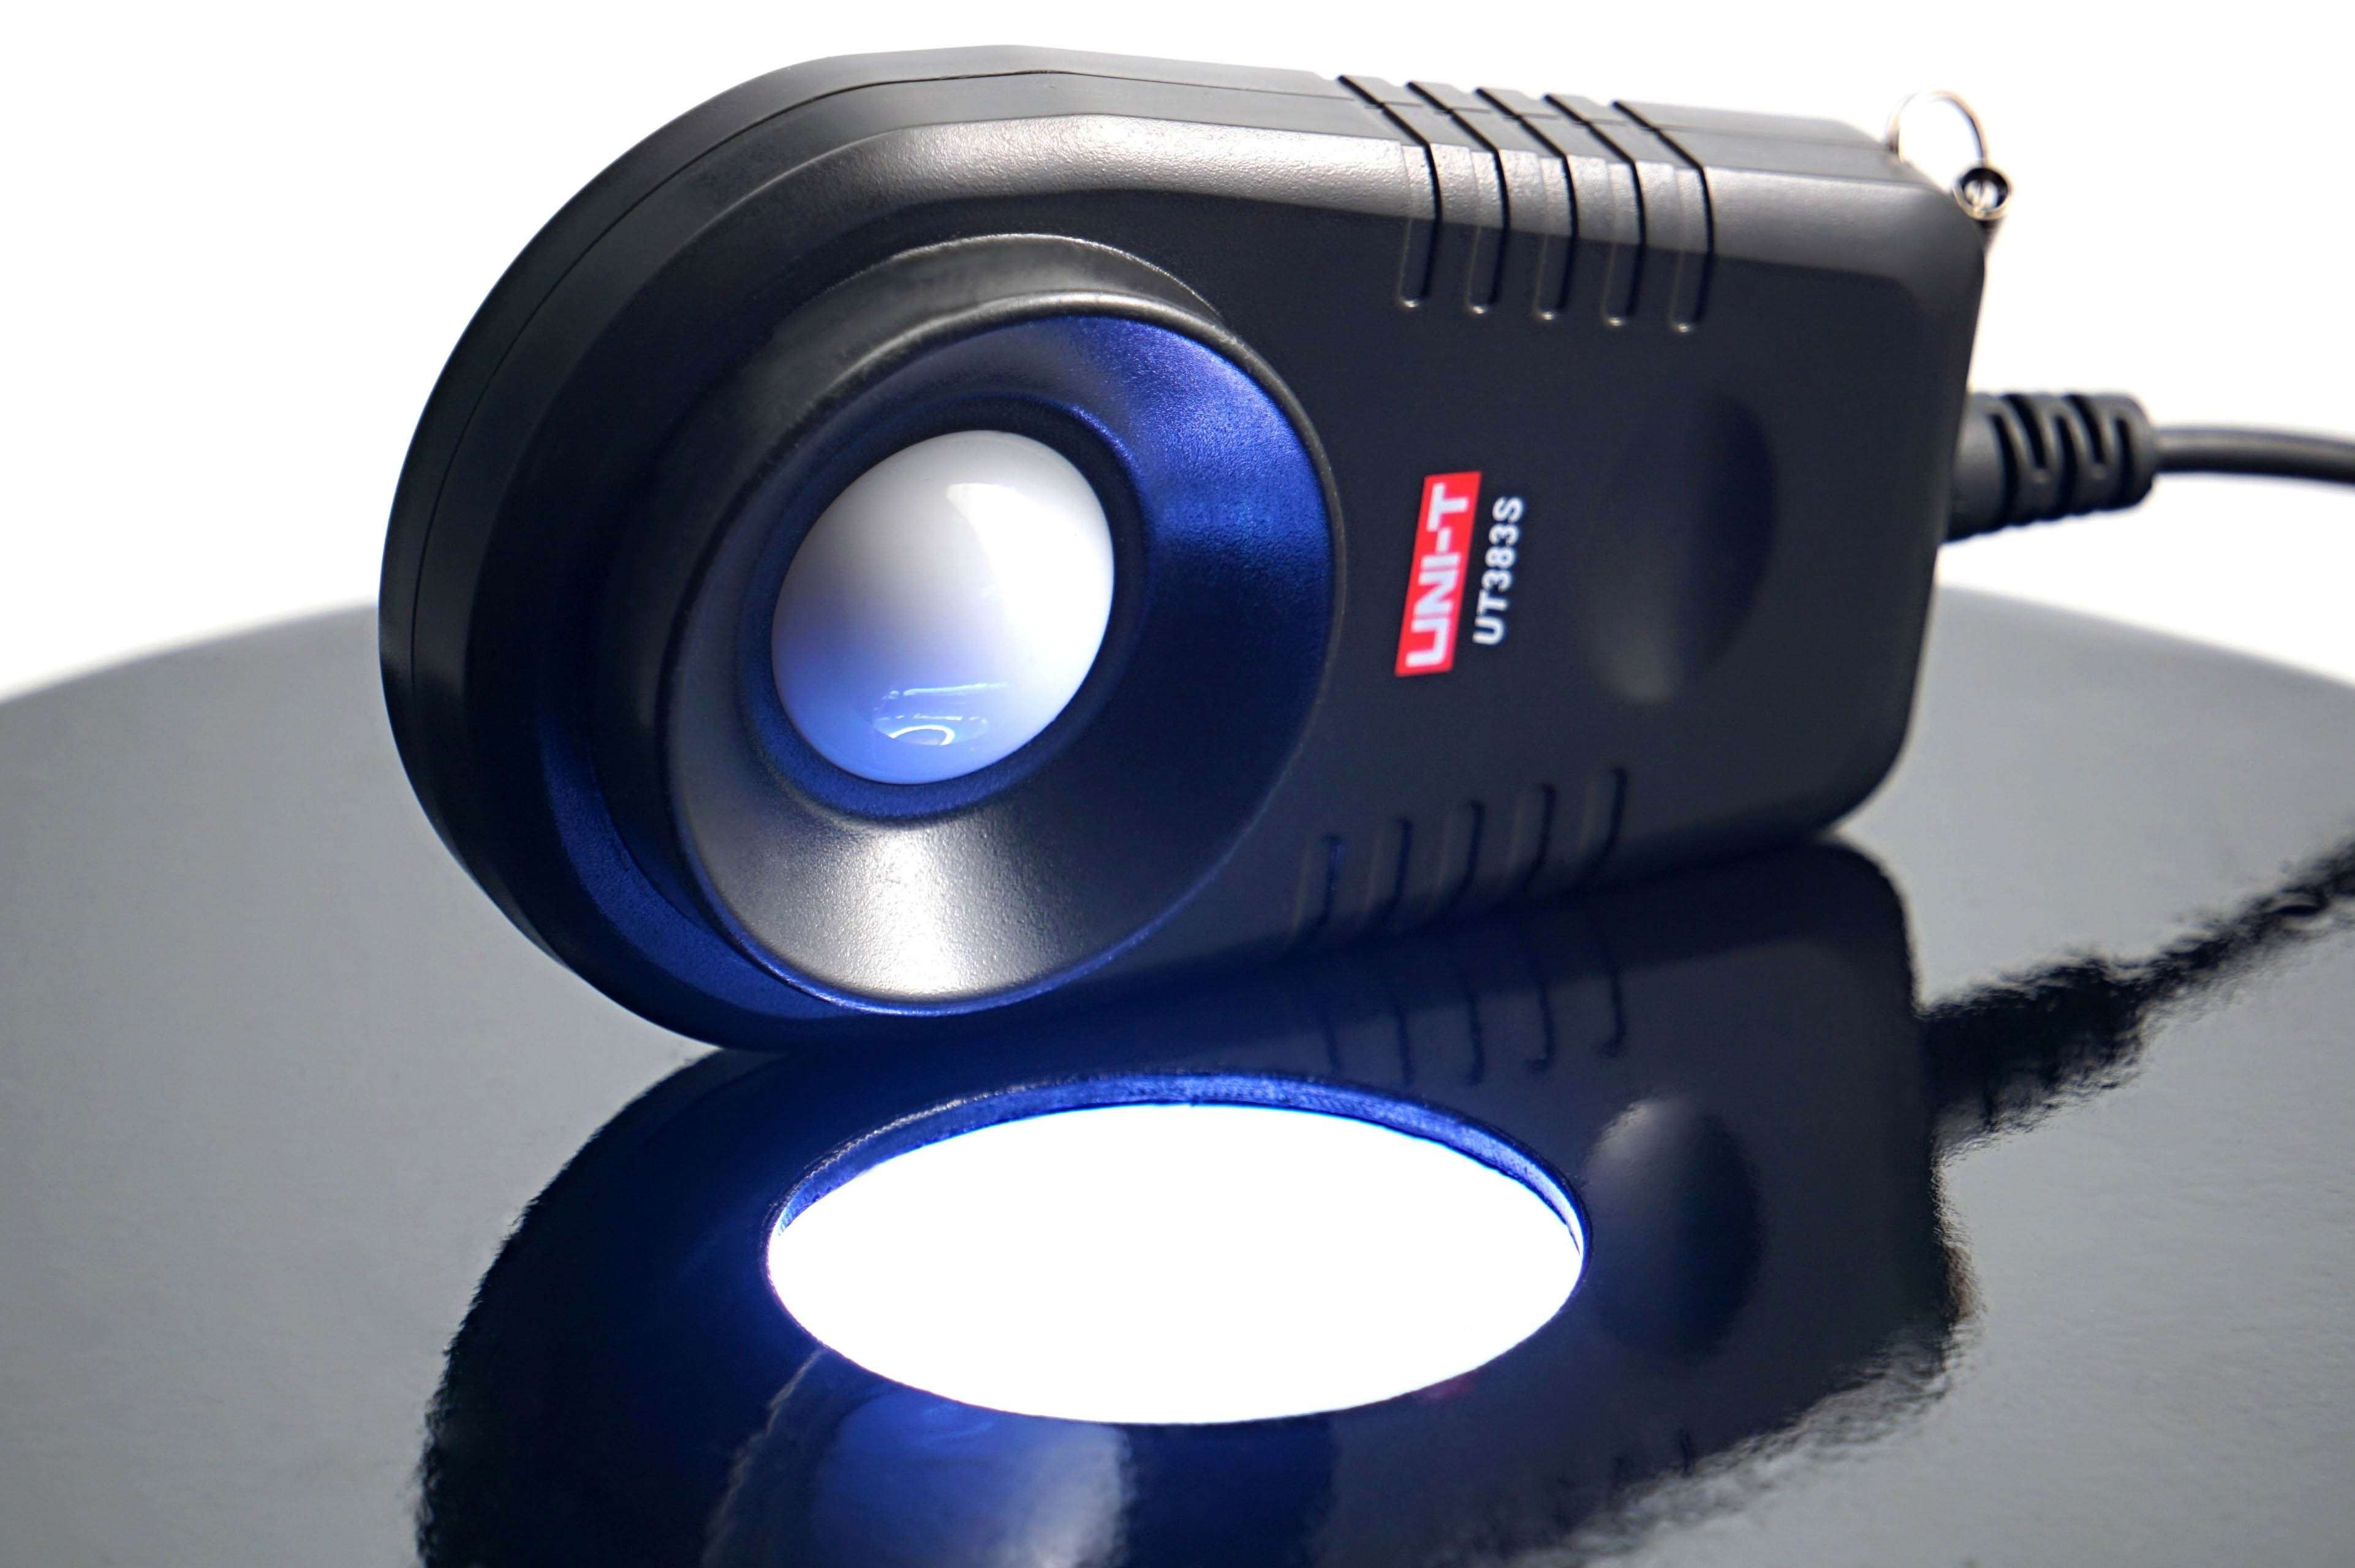
In addition to the brightness intensity, we also measure the power draw that it requires. This is again through the shunt, which is between the Gophert CPS-3205 power supply and the (A)RGB LED driver. After this we get a reading of the lighting power draw. In the graphs we show it separately, but also in sum with the motor power draw as the total maximum fan power.
- Contents
- Noctua NF-A14 PWM in detail
- Overview of manufacturer specifications
- Basis of the methodology, the wind tunnel
- Mounting and vibration measurement
- Initial warm-up and speed recording
- Base 6 equal noise levels…
- ... and sound color (frequency characteristic)
- Static pressure measurement…
- … and airflow
- Everything changes with obstacles
- How we measure power draw and motor power
- Measuring the intensity (and power draw) of lighting
- Results: Speed
- Results: Airlow w/o obstacles
- Results: Airflow through a nylon filter
- Results: Airflow through a plastic filter
- Results: Airflow through a hexagonal grille
- Results: Airflow through a thinner radiator
- Results: Airflow through a thicker radiator
- Results: Static pressure w/o obstacles
- Results: Static pressure through a nylon filter
- Results: Static pressure through a plastic filter
- Results: Static pressure through a hexagonal grille
- Results: Static pressure through a thinner radiator
- Results: Static pressure through a thicker radiator
- Results: Static pressure, efficiency depending on orientation
- Reality vs. specifications
- Results: Frequency response of sound w/o obstacles
- Results: Frequency response of sound with a dust filter
- Results: Frequency response of sound with a hexagonal grille
- Results: Frequency response of sound with a radiator
- Results: Vibration, in total (3D vector length)
- Results: Vibration, X-axis
- Results: Vibration, Y-axis
- Results: Vibration, Z-axis
- Results: Power draw (and motor power)
- Results: Cooling performance per watt, airflow
- Results: Cooling performance per watt, static pressure
- Airflow per euro
- Static pressure per euro
- Results: Lighting – LED luminance and power draw
- Results: LED to motor power draw ratio
- Evaluation


Thanks.
I particularly like the minimum fan speed, that’s a must to me.