


Methodology: how we measure power draw
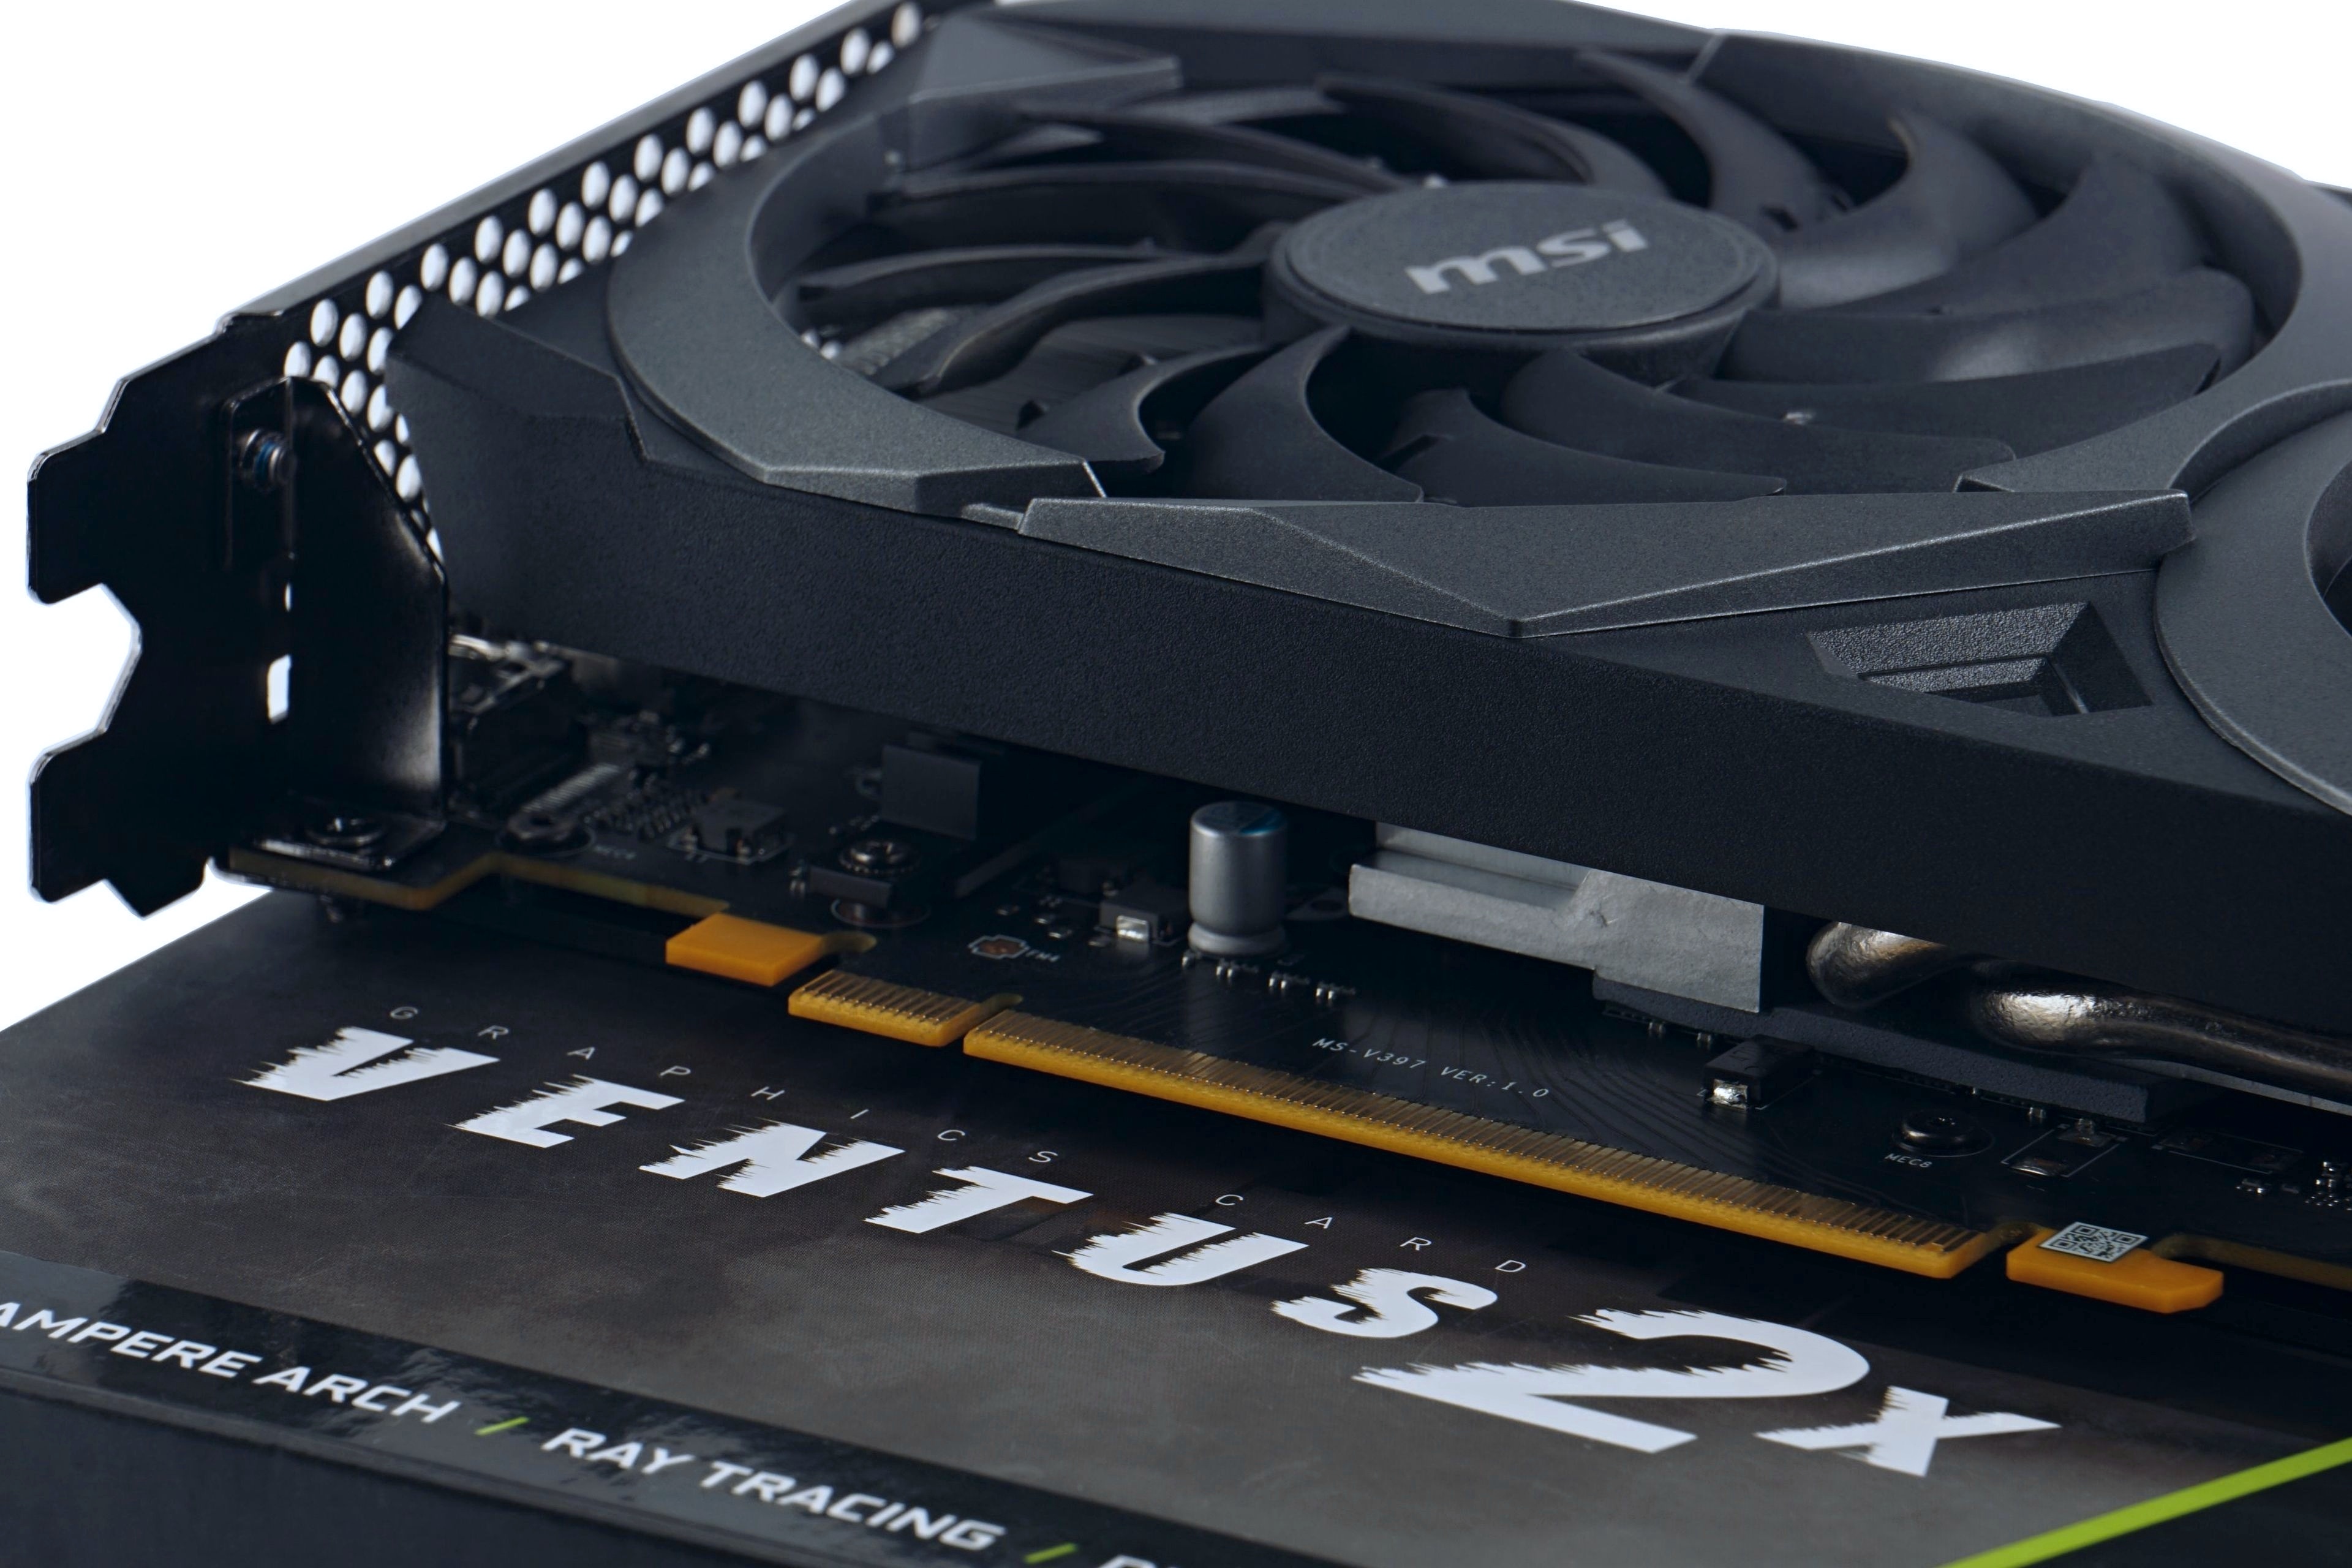
In addition to the global price drop on all graphics cards, MSI is now also reducing the MSRP of the RTX 3050 Ventus 2X (OC) from its lowest range. The phrase “affordable graphics card” thus takes on a new spin, and if you’ve read somewhere that the performance characteristics of Ventus graphics cards aren’t worth much, forget it. We certainly don’t see it that way, and few RTX 3050s for this money can boast a more functionally attractive design.
Methodology: how we measure power draw
We have been tuning the method of measuring power draw for quite a long time and we will also be tuning it for some time. But we already have gimmicks that we can work with happily.
To get the exact value of the total power draw of the graphics card, it is necessary to map the internal power draw on the PCI Express slot and the external one on the additional power supply. For the analysis of the PCIe slot, it was necessary to construct an in-between card on which the power draw measurement takes place. Its basis is resistors calibrated to the exact value (0.1 Ω) and according to the amount of their voltage drop we can calculate the current. We then substitute it into the formula for the corresponding value of the output voltage ~ 12 V and ~ 3.3 V. The voltage drop is so low that it doesn’t make the VRM of the graphics card unstable and the output is still more than 12/3.3 V.

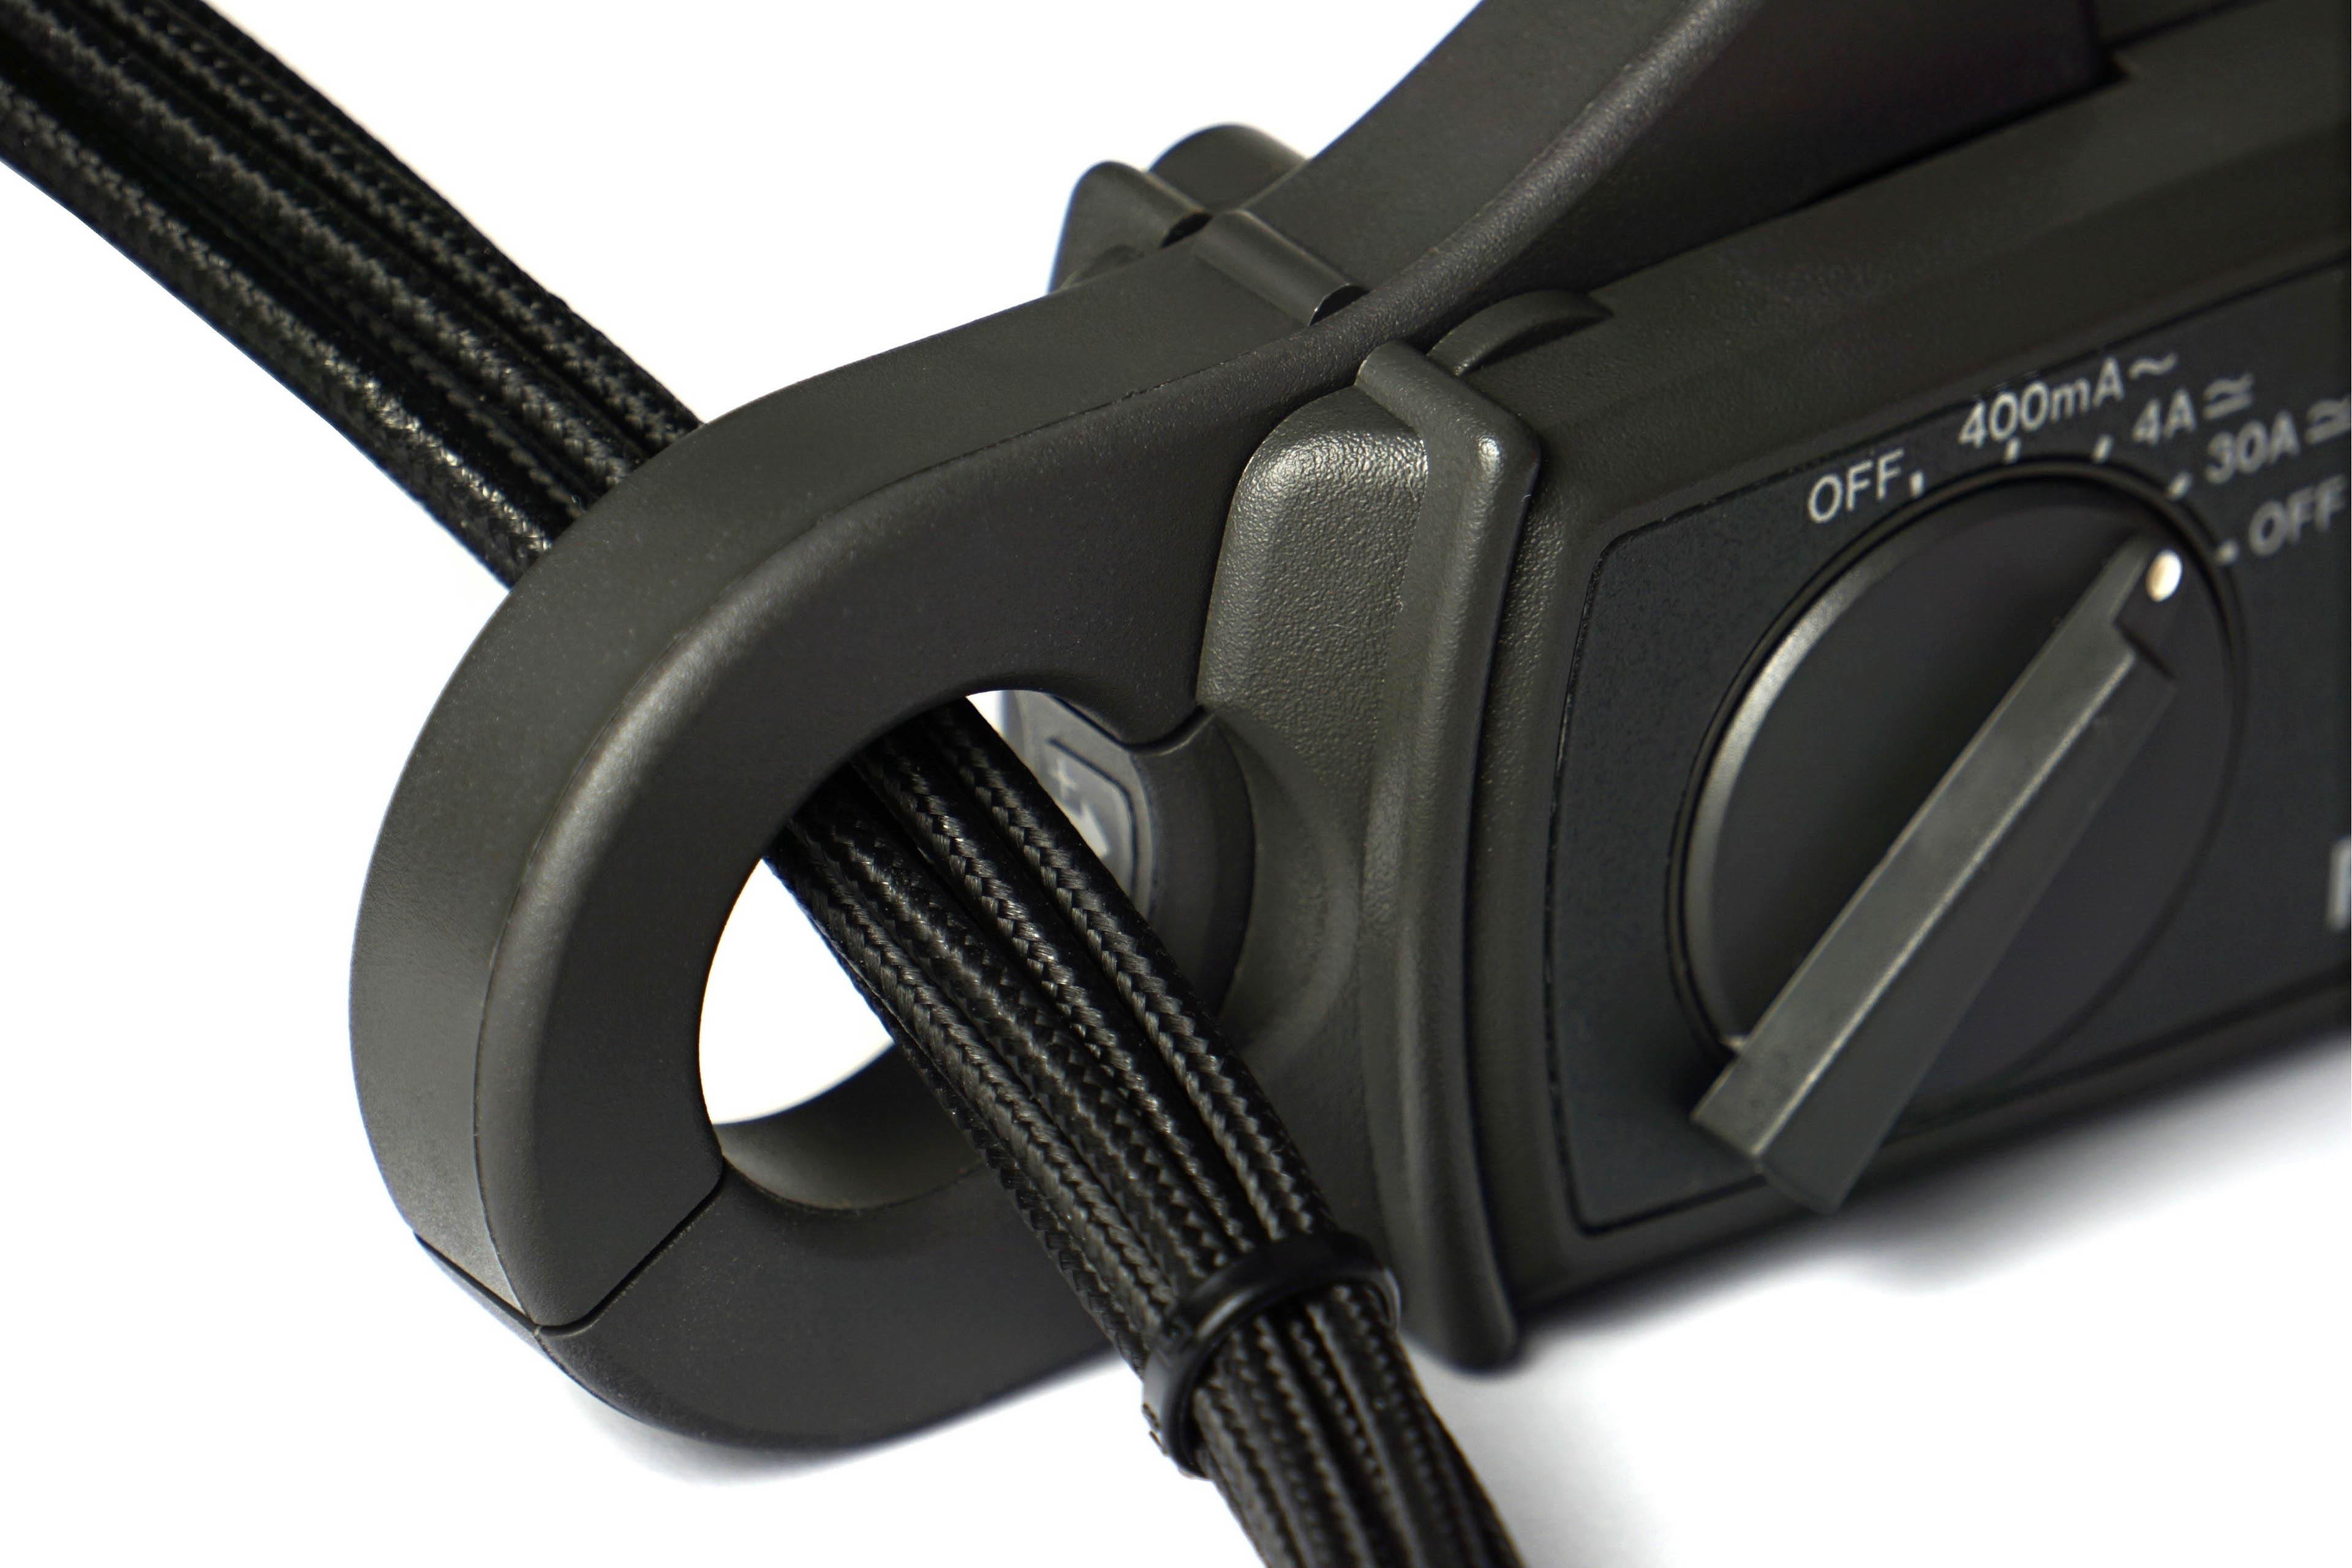
We are also working on a similar device for external power supply. However, significantly higher currents are achieved there, longer cabling and more passages between connectors are necessary, which means that the voltage drop will have to be read on an even smaller resistance of 0.01 Ω, the current state (with 0.1 Ω) is unstable for now. Until we fine-tune it, we will use Prova 15 current clamp for cable measurements, which also measures with good accuracy, they just have a range of up to 30 A. But that is also enough for the OC version of the RTX 3090 Gaming X Trio. If a card is over the range, it is always possible to split the consumption measurement (first into one half and then into the other half of the 12 V conductors).
And why bother with such devices at all when Nvidia has a PCAT power draw analyzer? For complete control over the measurements. While our devices are transparent, the Nvidia’s tool uses the processor that can (but of course does not have to) affect the measurements. After testing the AMD graphics card on the Nvidia’s tool, we probably wouldn’t sleep well.
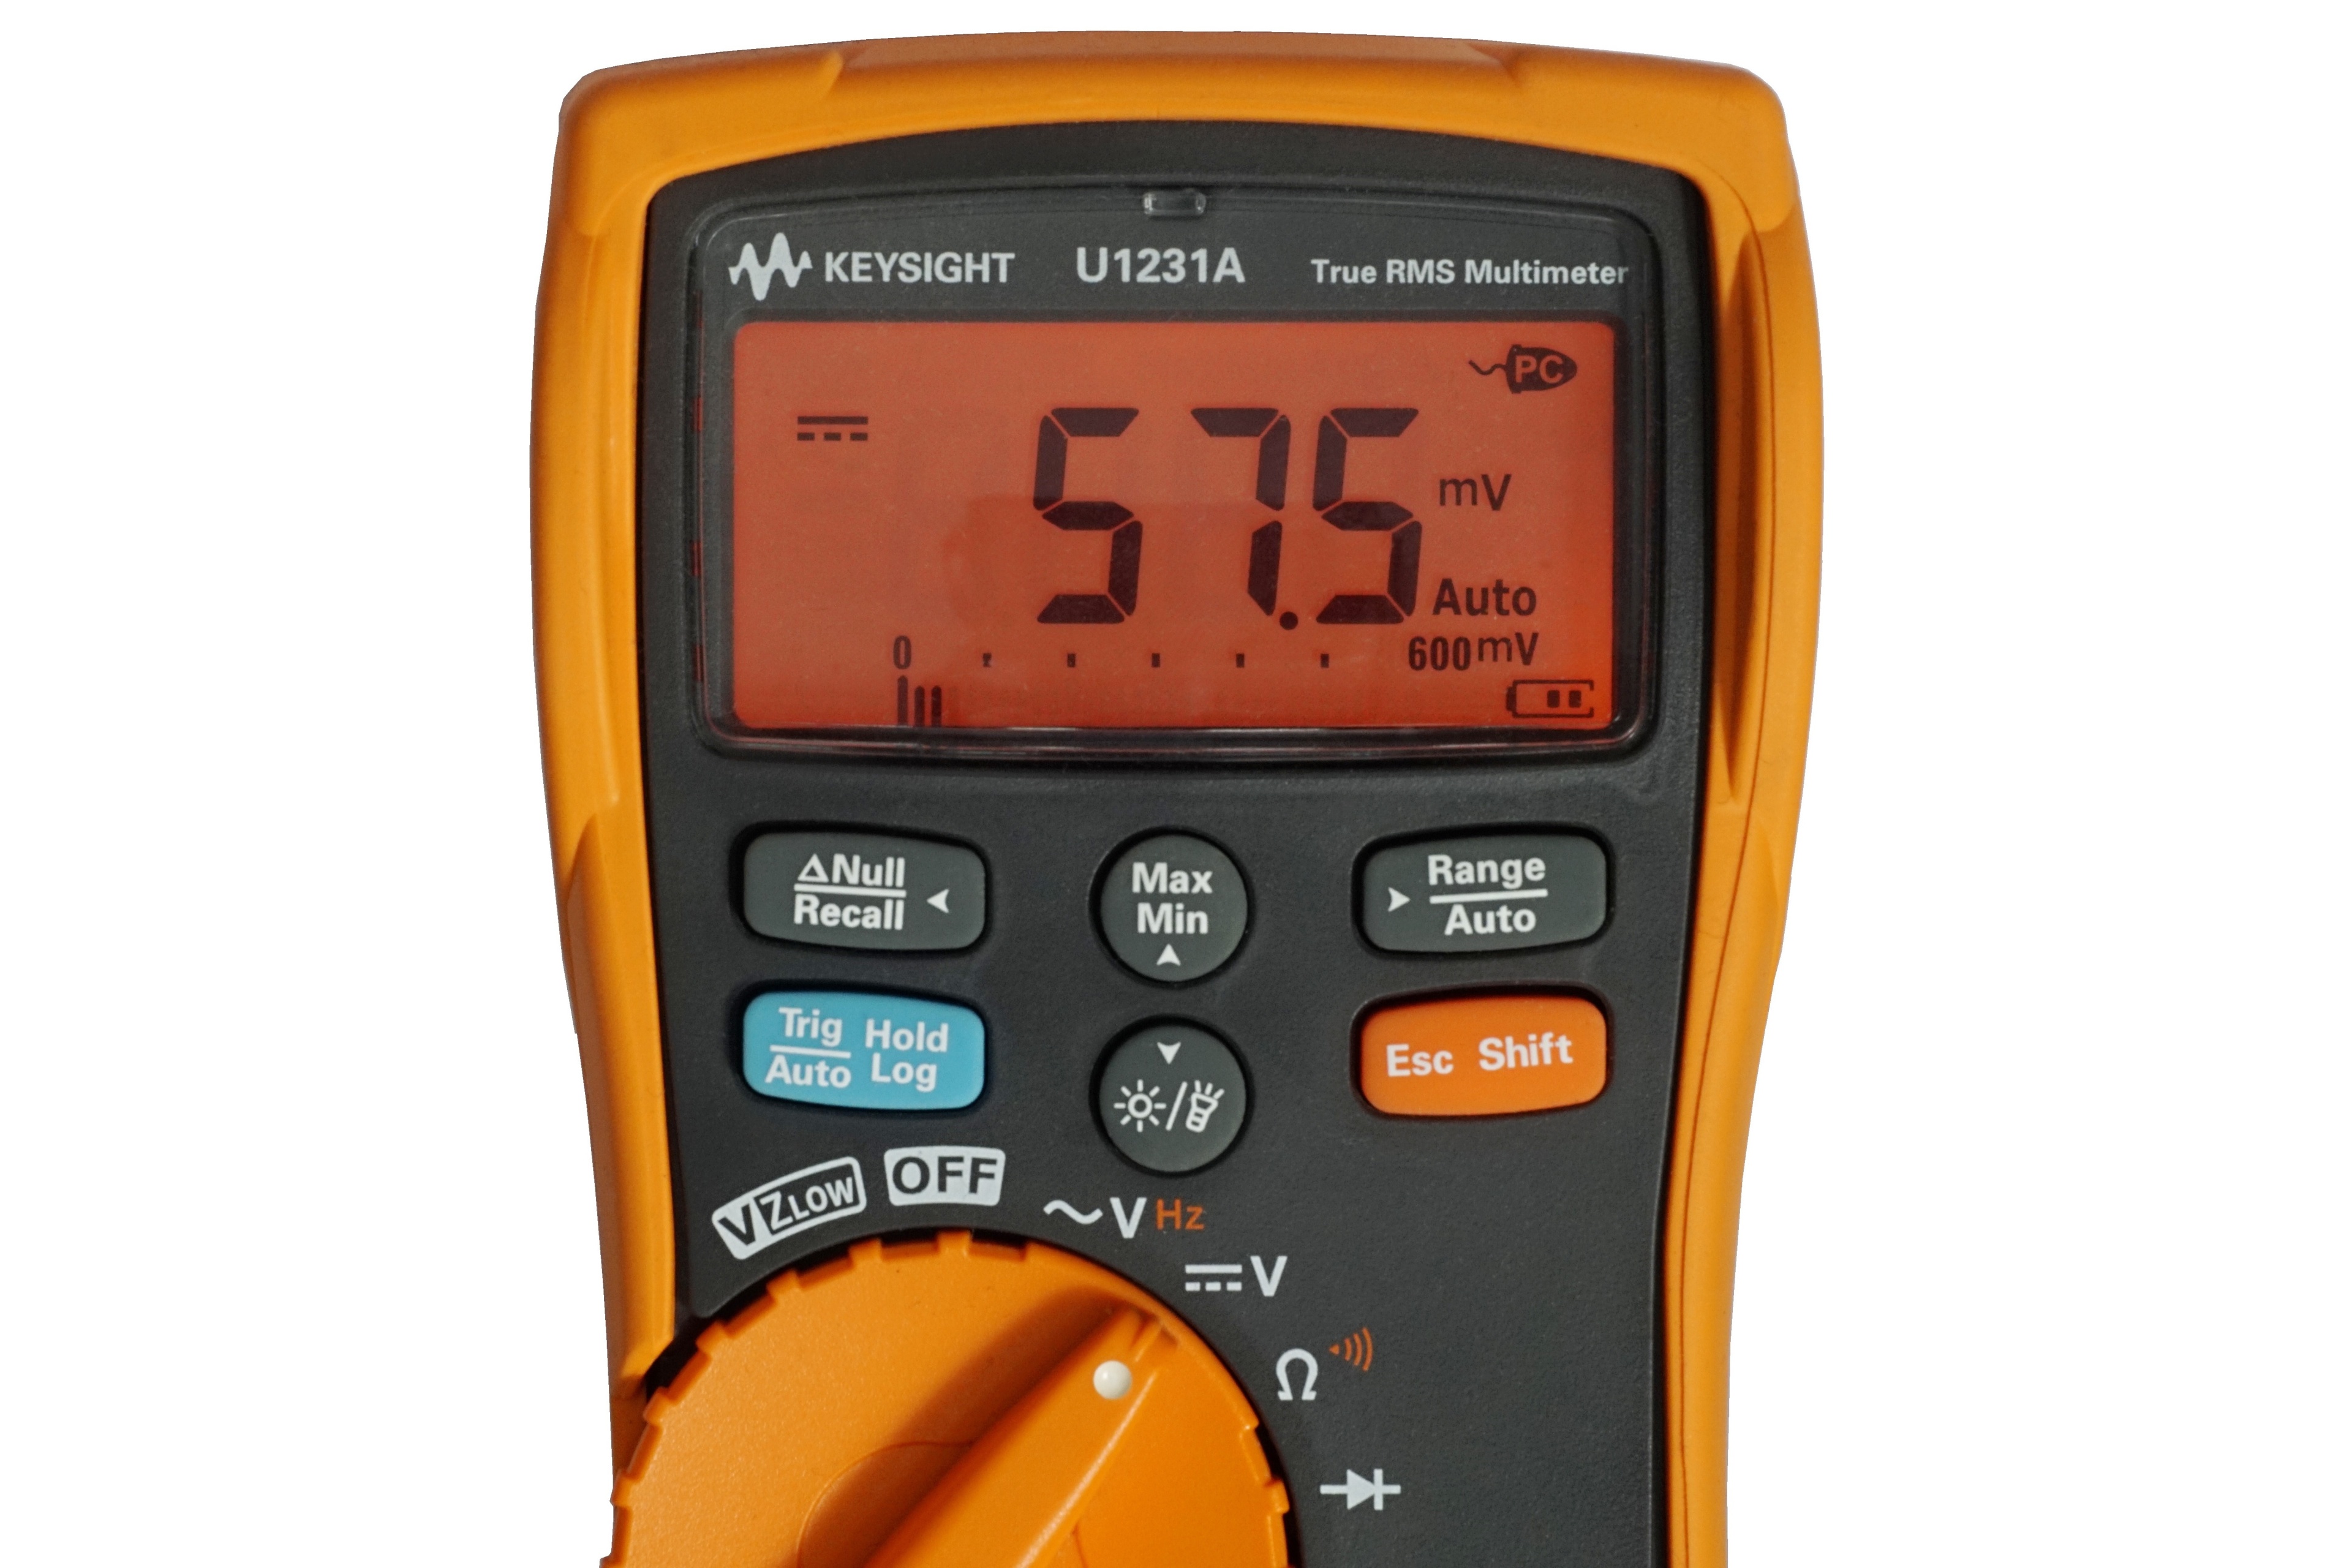
To read and record measurements, we use a properly calibrated multimeter Keysight U1231A, which exports samples to XLS. From it we obtain the average value and by substituting into the formula with the exact value of the subcircuit output voltages we obtain the data for the graphs.


We will analyze the line graphs with the waveforms for each part of the power supply separately. Although the 3.3 V value is usually negligible, it needs to be monitored. It is difficult to say what exactly this subcircuit powers, but usually the consumption on it is constant and when it changes only with regard to whether a static or dynamic image is rendered. We measure consumption in two sort of demanding games (F1 2020 and Shadow of the Tomb Raider) and one less demanding one (CS:GO) with the highest graphic details preset and UHD resolution (3840 × 2560 px). Then in 3D rendering in Blender using the Cycles renderer on the famous Classroom scene. However, in addition to high-load tests, it’s important to know your web browser consumption (which, in our case, is accelerated Google Chrome), where we also spend a lot of time watching videos or browsing the web. The usual average load of this type is represented by the FishIE Tank (HTML5) website with 20 fish and the web video in our power draw tests is represented by a sample with the VP9 codec, data rate of 17.4 mb/s and 60 fps. In contrast, we also test offline video consumption, in VLC player on a 45 HEVC sample (45.7 mb/s, 50 fps). Finally, we also record the power consumption of the graphics card on the desktop of idle Windows 10 with one or two active UHD@60 Hz monitors.
- Contents
- MSI RTX 3050 Ventus 2X 8G OC in detail
- Table of specifications
- Methodology: performance tests
- Methodology: how we measure power draw
- Methodology: noise and sound measurement
- Methodology: temperature tests
- Test rig
- 3DMark
- Age of Empires II: DE
- Assassin’s Creed: Valhalla
- Battlefield V
- Battlefield V with DXR
- Borderlands 3
- Control
- Control with DXR and DLSS
- Counter-Strike: GO
- Cyberpunk 2077
- Cyberpunk 2077 with DLSS
- Cyberpunk 2077 with DXR (and DXR with DLSS)
- DOOM Eternal
- F1 2020
- FIFA 21
- Forza Horizon 4
- Mafia: DE
- Metro Exodus
- Metro Exodus with DXR and DLSS
- Microsoft Flight Simulator
- Red Dead Redemption 2 (Vulkan)
- Red Dead Redemption 2 (Dx12)
- Shadow of the Tomb Raider
- Shadow of the Tomb Raider s DXR
- Total War Saga: Troy
- Wasteland 3
- Overall game performance and performance per euro
- CompuBench (OpenCL)
- SPECviewperf 2020 and SPECworkstation 3
- FLOPS, IOPS and memory speed tests
- 3D rendering 1/2 (LuxMark and Blender@Cycles
- 3D rendering 2/2 (Blender@Radeon ProRender and Eevee)
- Photo editing (Adobe Photoshop, Lightroom and Affinity Photo)
- Broadcasting (OBS and Xsplit)
- Password cracking
- GPU clock speeds
- GPU and VRAM temperatures
- Net GPU power draw and performance per watt
- Analysis of 12 V branch power supply (higher load)
- Analysis of 12 V branch power supply (lower load)
- Analysis of 3,3 V branch power supply
- Noise level
- Frequency response of sound
- Conclusion


Would it be possible to perform thermal tests of the upcoming GPUs using the same noise levels – just like in CPU cooler and fan tests? With the current methodology, there is a multitude of results, but it’s often impossible to decide which result is better. Some GPUs operate at less than 60 degrees (an overkill) but to achieve it, they run twice as loud. The many game noise and thermal tests could be replaced with just coil whine tests, as it changes a lot in different environments (specific game, being in menu/playing).
The original proposal of the test methodology looked exactly as you describe (we obviously have the same taste :)), but we eventually dropped it. There were several reasons for that. But the main reason was time. If I had taken the cooler apart in such detail and tested it in several modes (instead of one) it would have been unmanageable in terms of time. It’s already too much now. With coolers and fans it’s easier, as they are not as complicated devices as graphics cards, where a lot of time is taken up by performance tests.
The time consumption of a single graphics card test in its current form, by our standards for accuracy, is approaching 300 hours of net time. With a more detailed analysis of the cooler, it would be quite a bit more, and in addition to the modes normalized by the various noise levels, we would still need the default one for evaluation in the end, which is based on the video card’s BIOS settings and is key for the vast majority of users.
And then there’s one more thing that causes some risk when testing at fixed noise levels. The GPU temperature is usually significantly lower than the VRAM and memory temperatures, which are quite difficult to keep track of. Sure, hardware monitoring and, in case of critical values, stop the test (typically at low speed) and evaluate it as a failure, but… capacity-wise, we unfortunately can’t afford this marginal type of tests, which have only a very small audience, in the interest of self-preservation. Although personally, I’d love to pursue it. So perhaps sometime in the future when we can afford to split the work between more people.