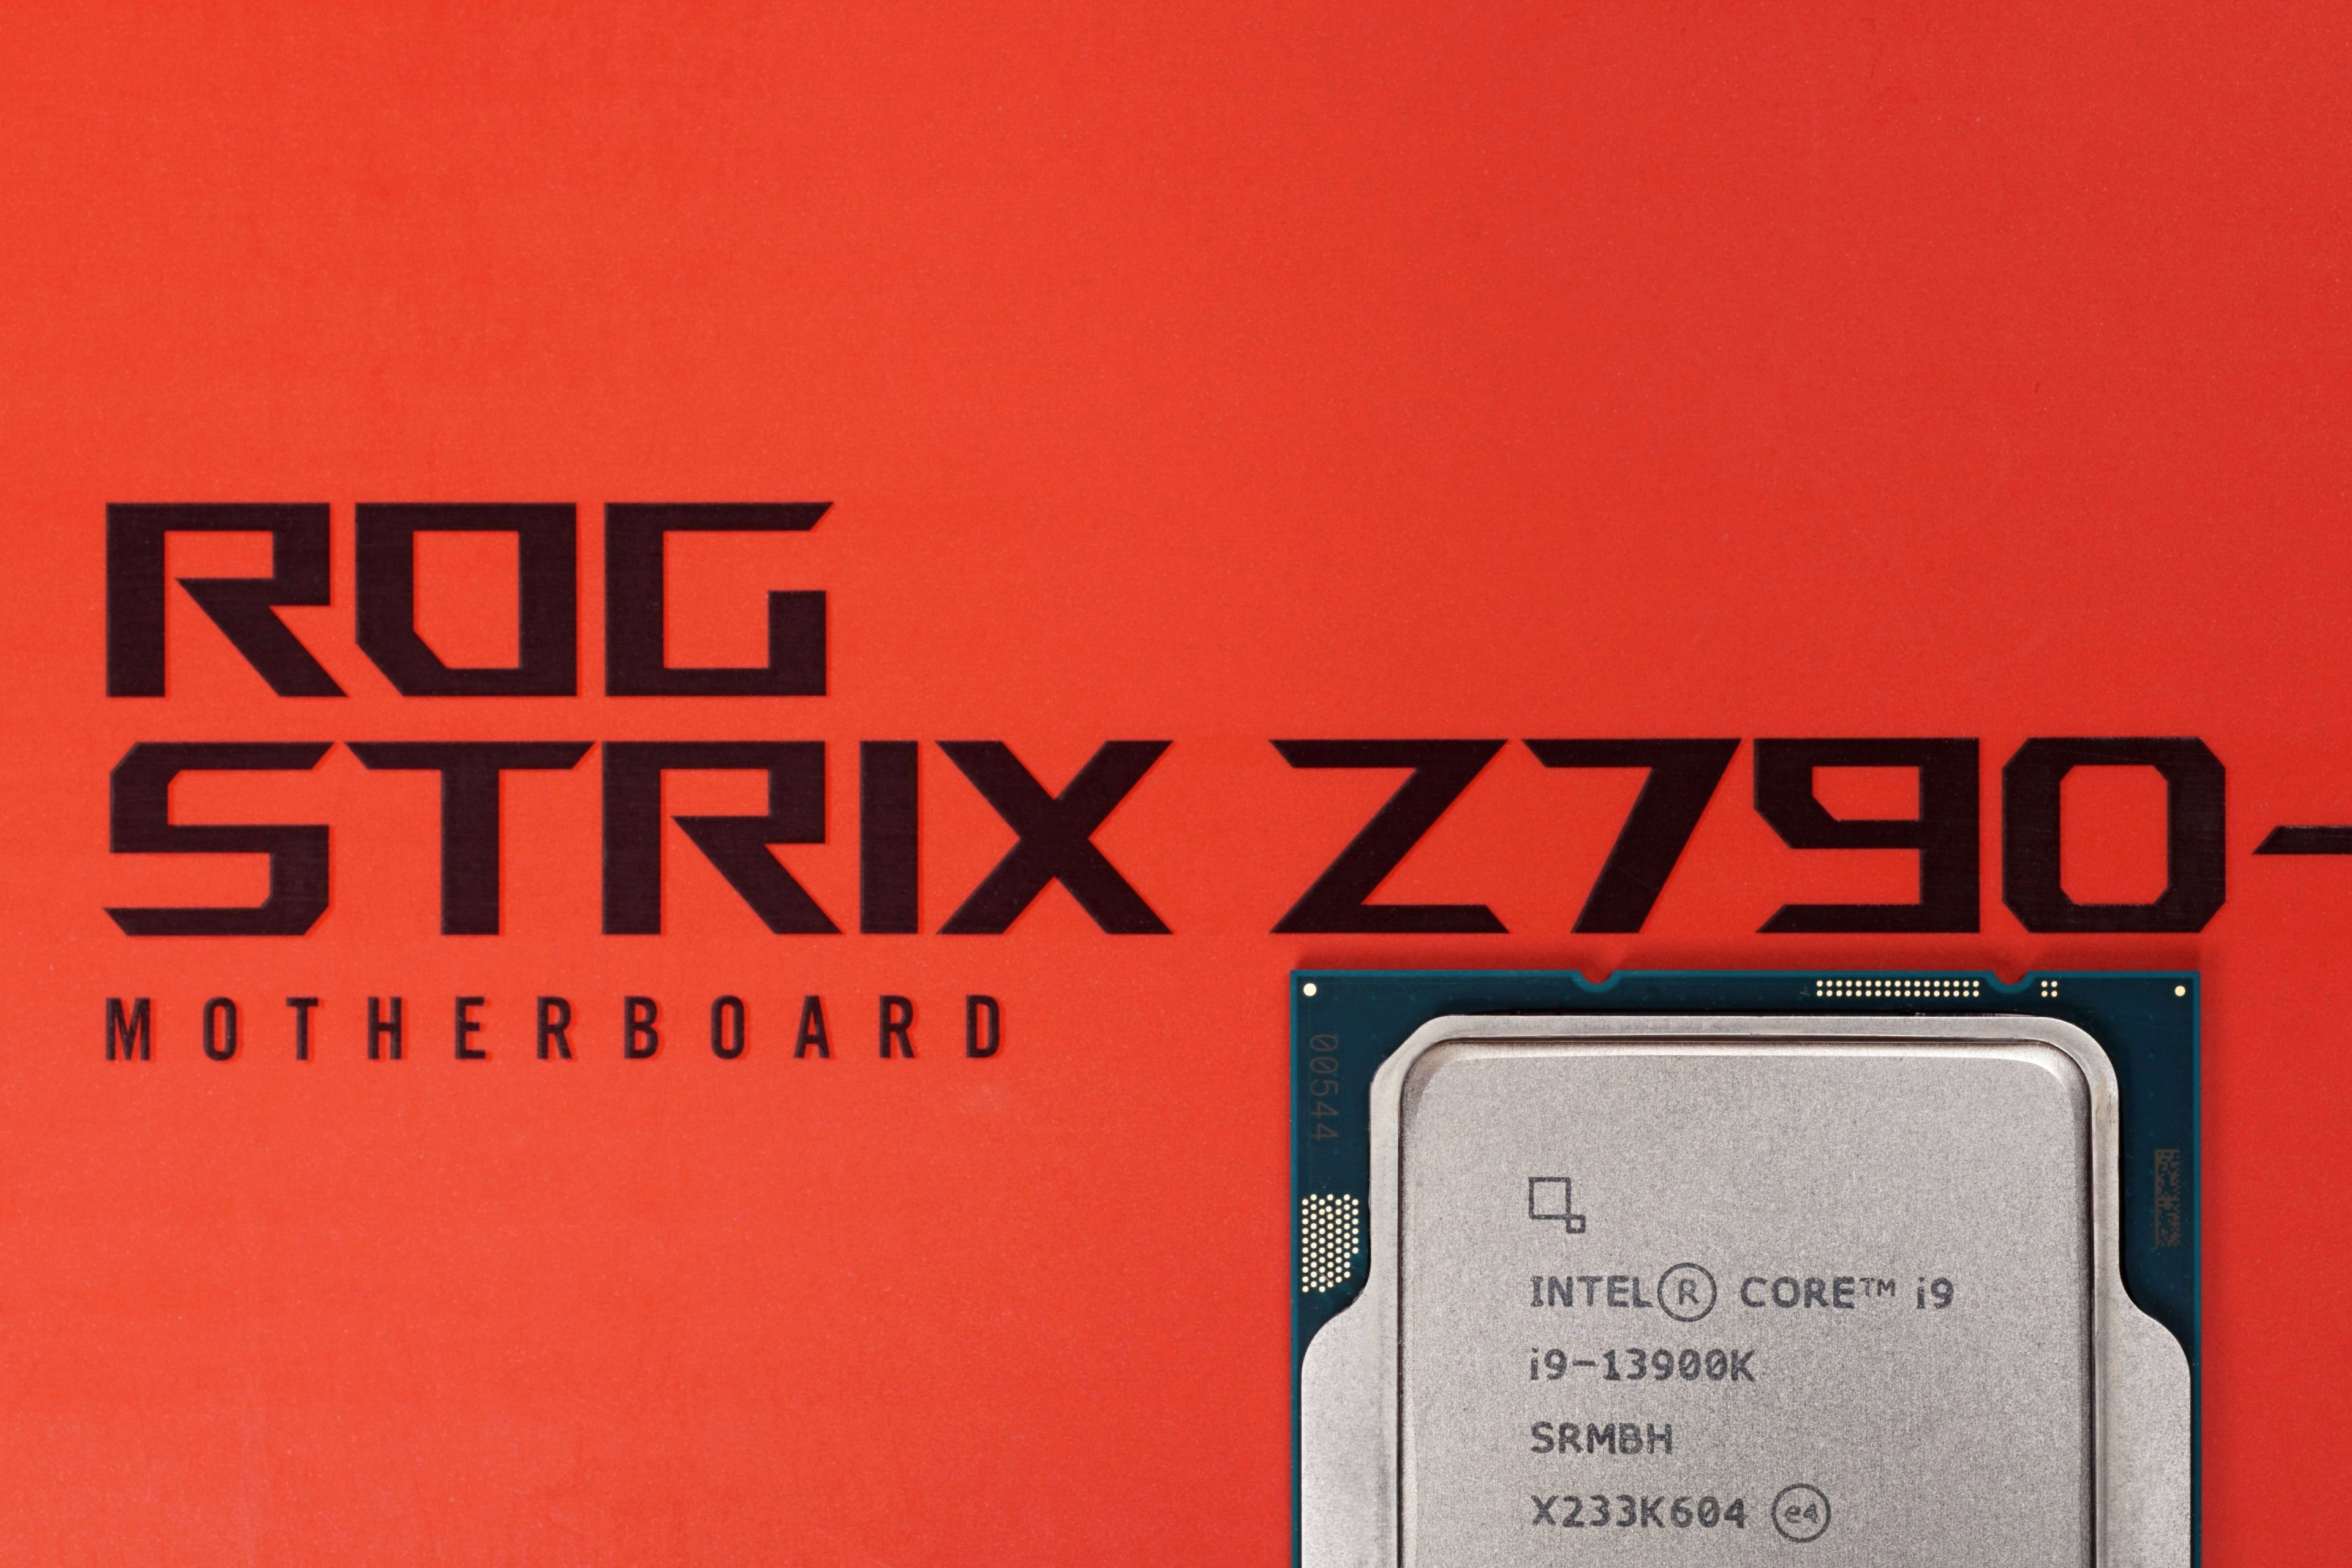
New motherboards for Intel Raptor Lake processors are again a bit more expensive in the same class than the previous generation Z690, but they are also better equipped. This also applies to the ROG Strix Z790-E Gaming WiFi, which now has more M.2 slots than SATA ports. What’s also neater is the mechanism for removing graphics cards from underneath the big tower coolers and overclocking the CPU using machine learning. That’s also an option.
Methodology: How we measure power draw
In contrast to the Z690/B660 tests, we’ll simplify it a bit and measure only the CPU power draw on the EPS cables. This means that (also for the sake of best possible clarity) we omit the 24-pin measurements. We have already analysed it thoroughly and the power draw on it doesn’t change much across boards. Of the ten boards tested with an Alder Lake processor (Core i9-12900K), the power draw at 12 volts of the 24-pin connector ranges from 37.3–40.4 W (gaming load, graphics card power supply via PCI Express ×16 slot), at 5V (memory, ARGB LEDs and some external controllers) then between 13.9–22.3 W and finally at the weakest, 3.3-volt branch, the power draw of our test setup tends to be 2.2–3.6 W.
On top of the CPU power draw, which also takes into account the efficiency of the power delivery, this adds up to some 53–66 W under gaming/graphics load and only 15–25 W outside of it, with the graphics card idle. We already know all this from older tests, and it will be no different on the new boards, and as the number of measurements increases, reducing measurements that worsen orientation is beneficial. But from the text above, you know how much to add for the total power draw of the motherboard components to the CPU’s majority power draw.

The situation will be a bit different on AMD platforms, for those we will deal with what is the power draw on which branch of the 24-pin, but already in a separate article that will better highlight this topic. In a large comprehensive motherboard test, these measurements disappear, they do not attract enough attention.
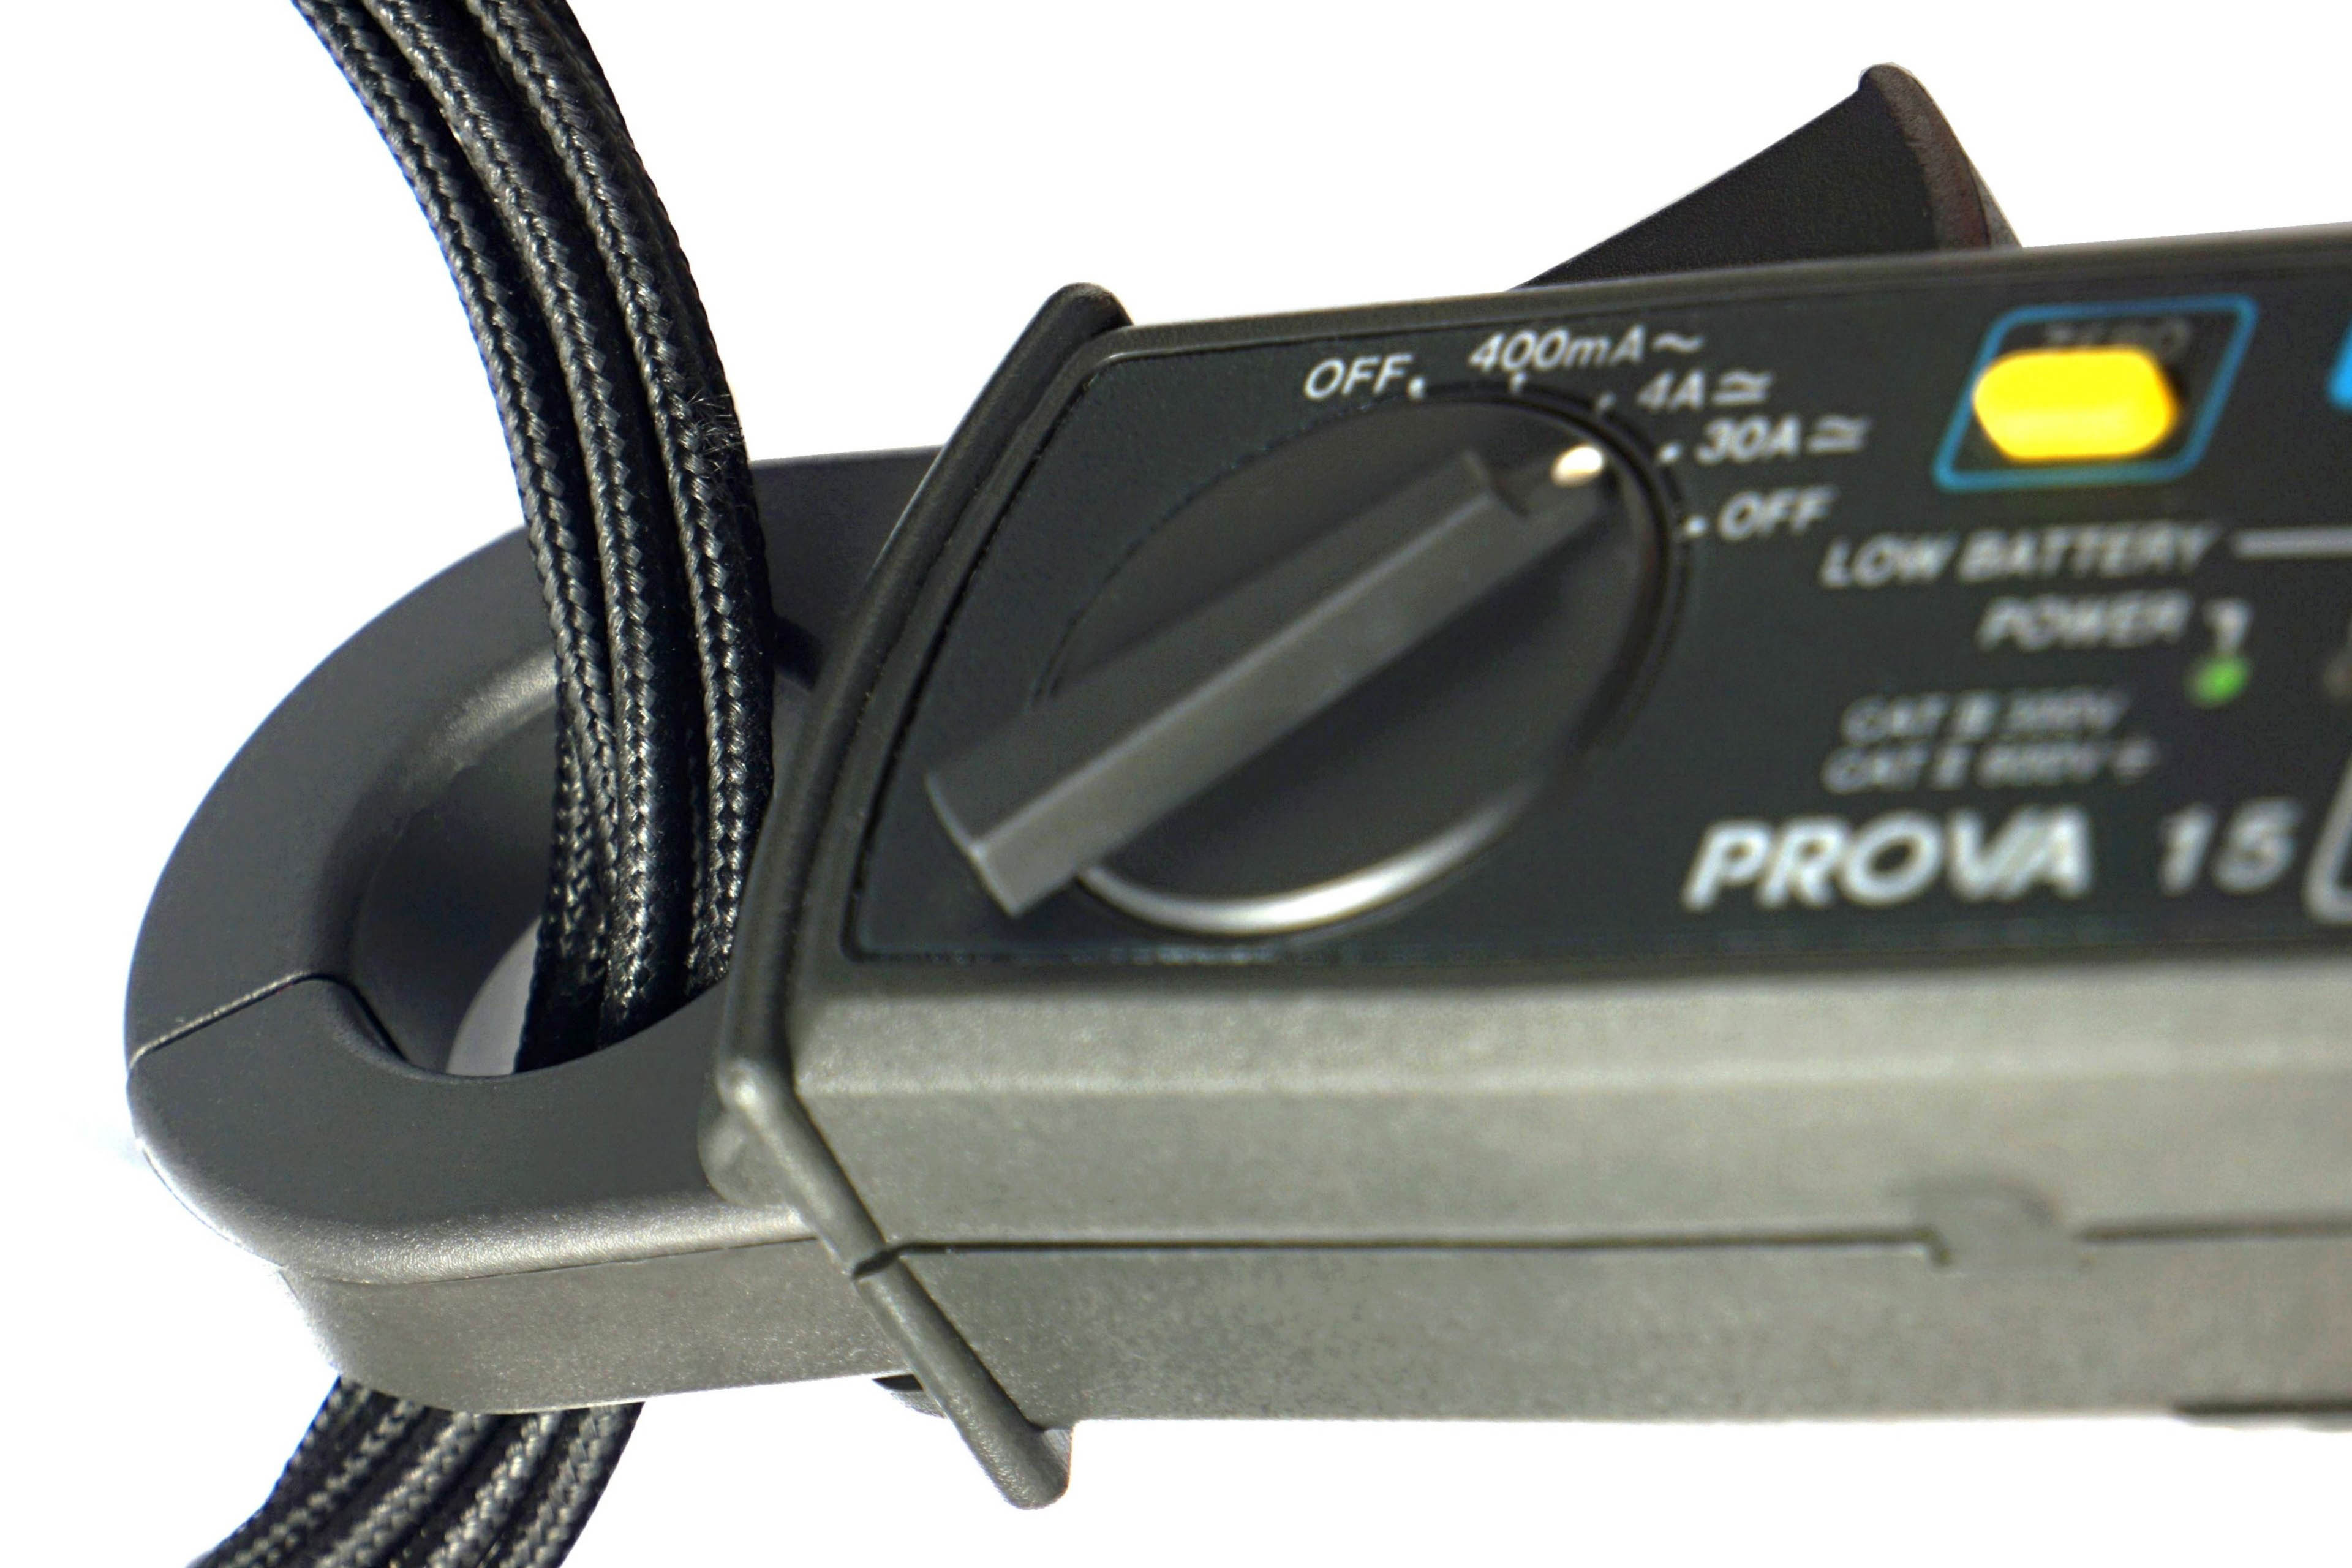
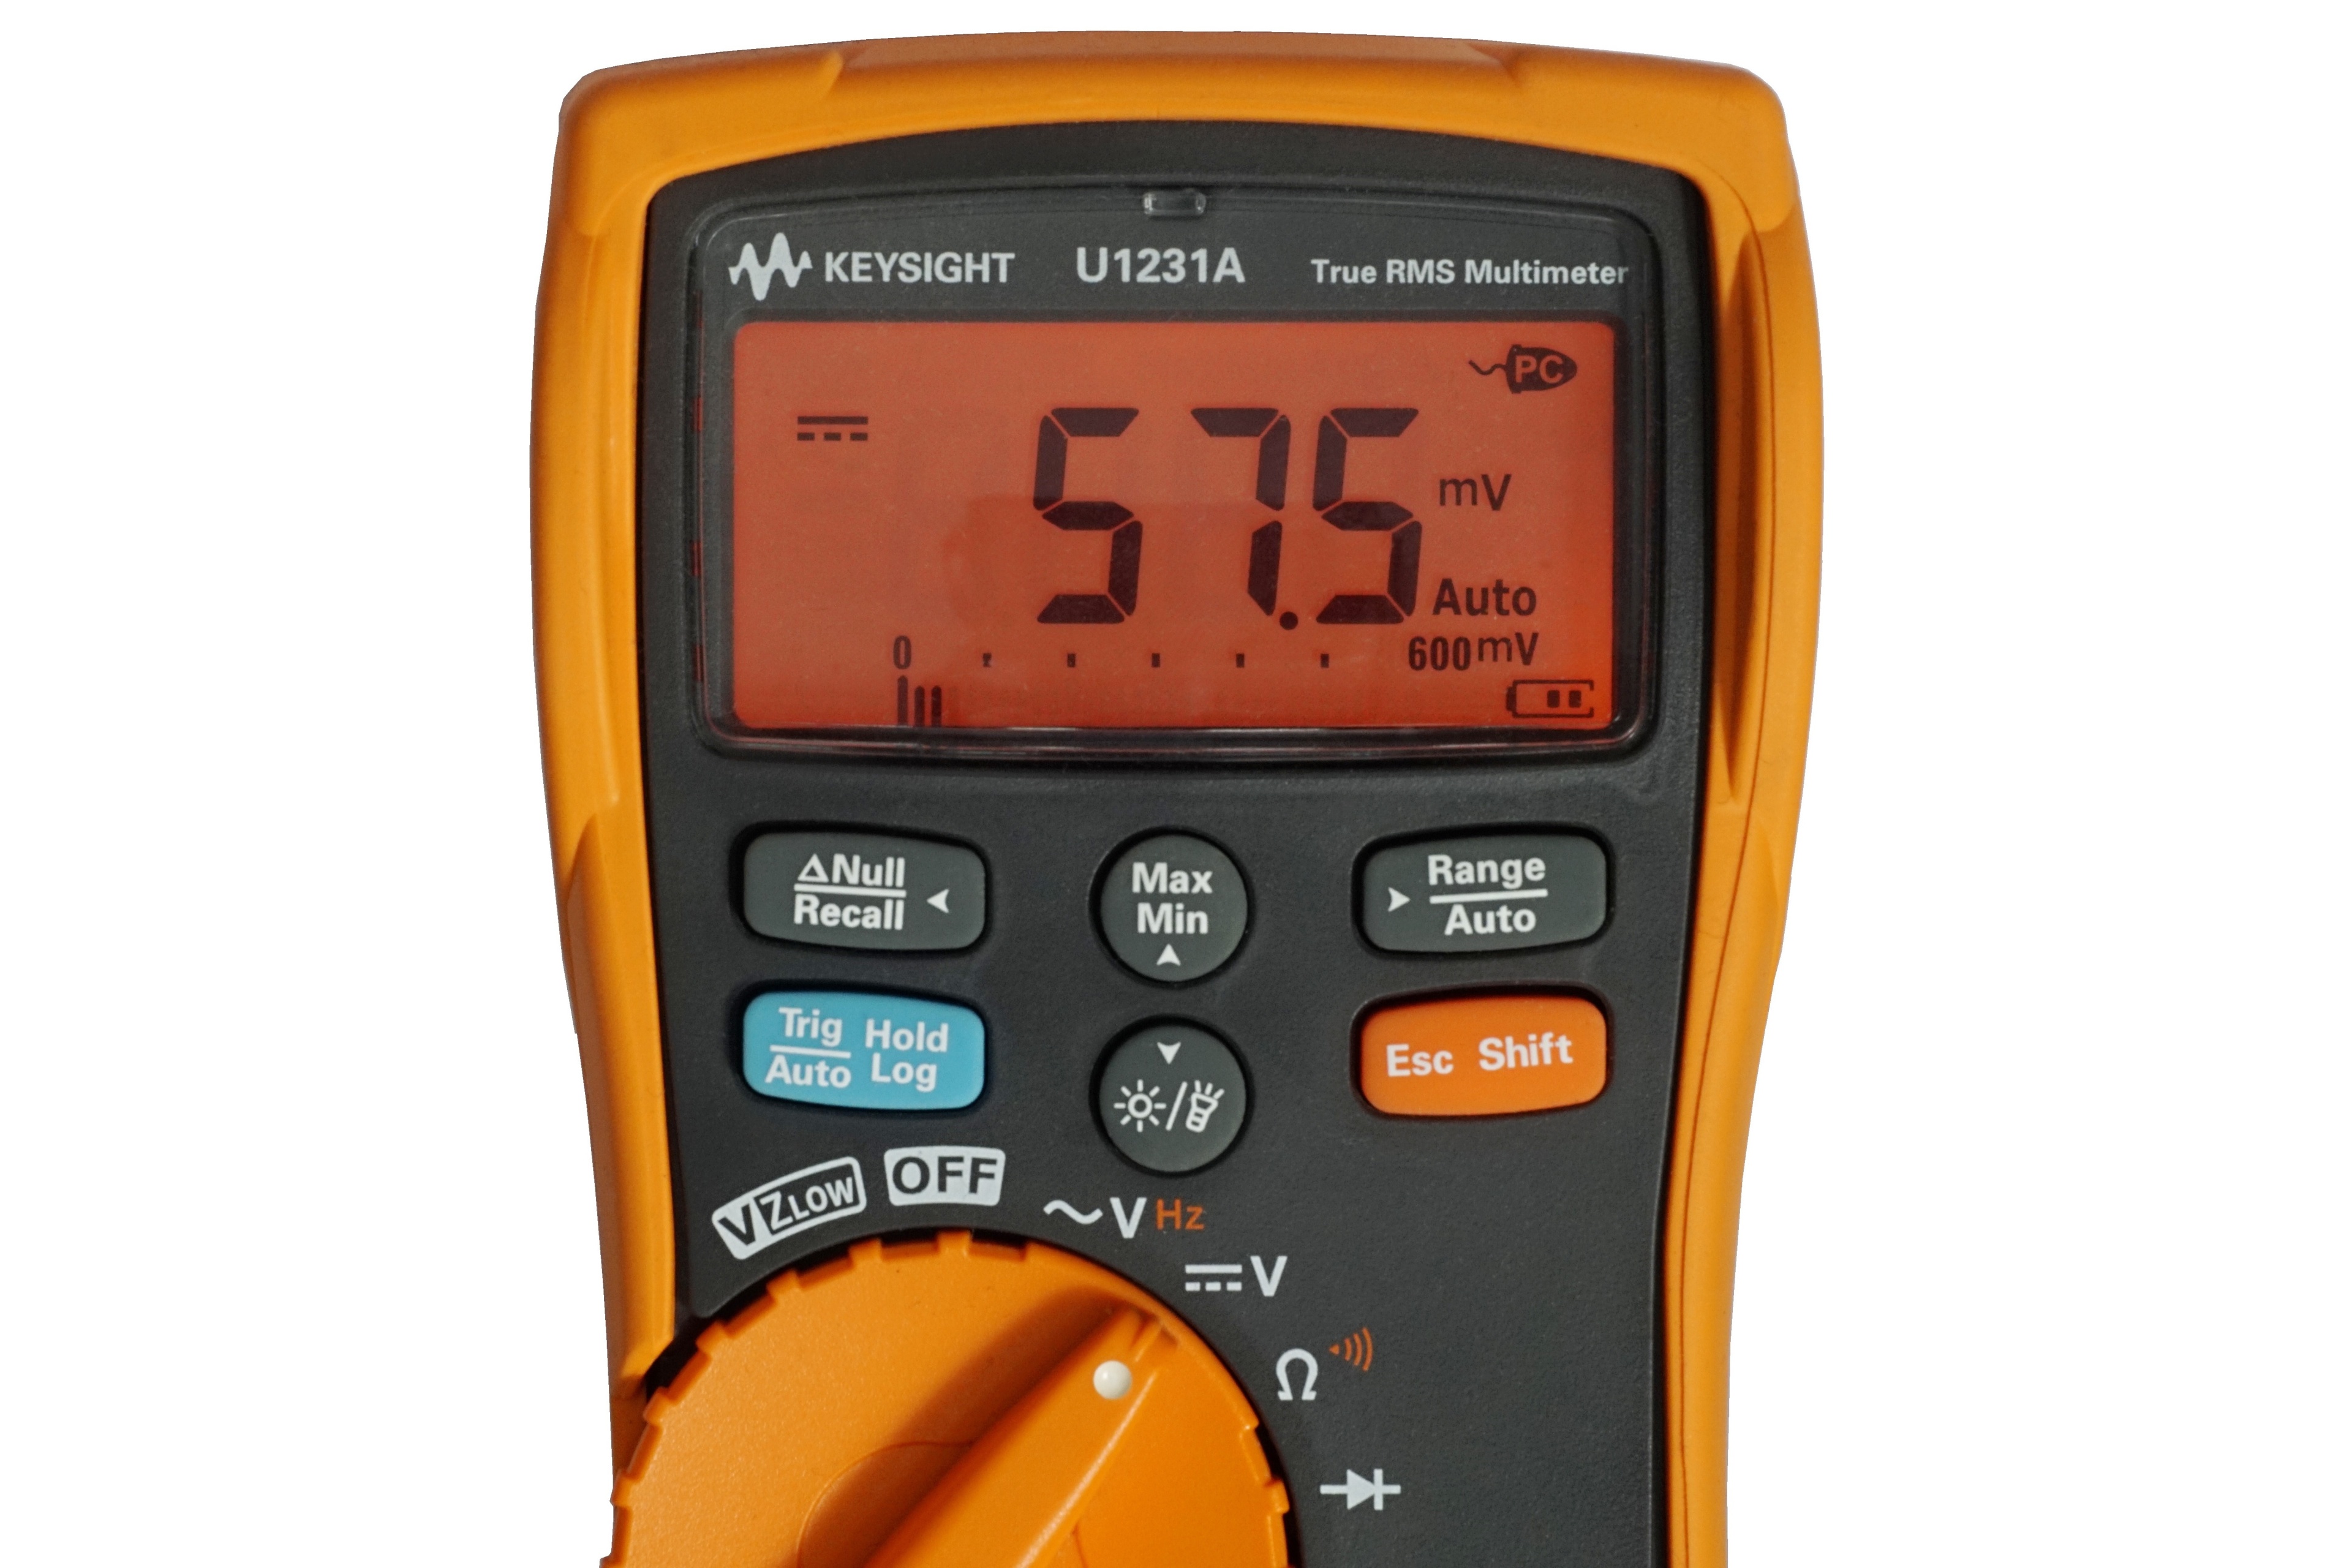
We measure the power draw of the CPU (and its VRM) on the power supply cables, with calibrated Prova 15 current clamps and a calibrated Keysight U1231A multimeter. The clamps measure the electric current, the multimeter measures the electric voltage. In the union of these two electrical quantities, we finally obtain the exact power draw. We measure this in different loads on the CPU. The maximum multithreaded load is represented by Cinebench R23.
Lower, gaming load by Shadow of the Tomb Raider (1080p@high), single-threaded load by audio encoding (reference encoder 1.3.2, FLAC with bitrate 200 kbps) and idle power draw is measured on the Windows 10 desktop when only basic operating system processes and launchers of some test applications are running in the background.