


It’s the fastest Core i3 yet, but it’s also the hungriest. The 14100F’s (Raptor Lake Refresh) biggest competition in its own ranks is in the form of older models (13100F and 12100F). These are a bit slower, but lower-power. The “better” choice depends on what holds more weight on your scales. Maybe it will be that record-breaking speed? In this class (Core i3), power consumption is always relatively low.
Methodology: temperature and clock speed tests
When choosing a cooler, we eventually opted for Noctua NH-U14S. It has a high performance and at the same time there is also the TR4-SP3 variant designed for Threadripper processors. It differs only by the base, the radiator is otherwise the same, so it will be possible to test and compare all processors under the same conditions. The fan on the NH-U14S cooler is set to a maximum speed of 1,535 rpm during all tests.
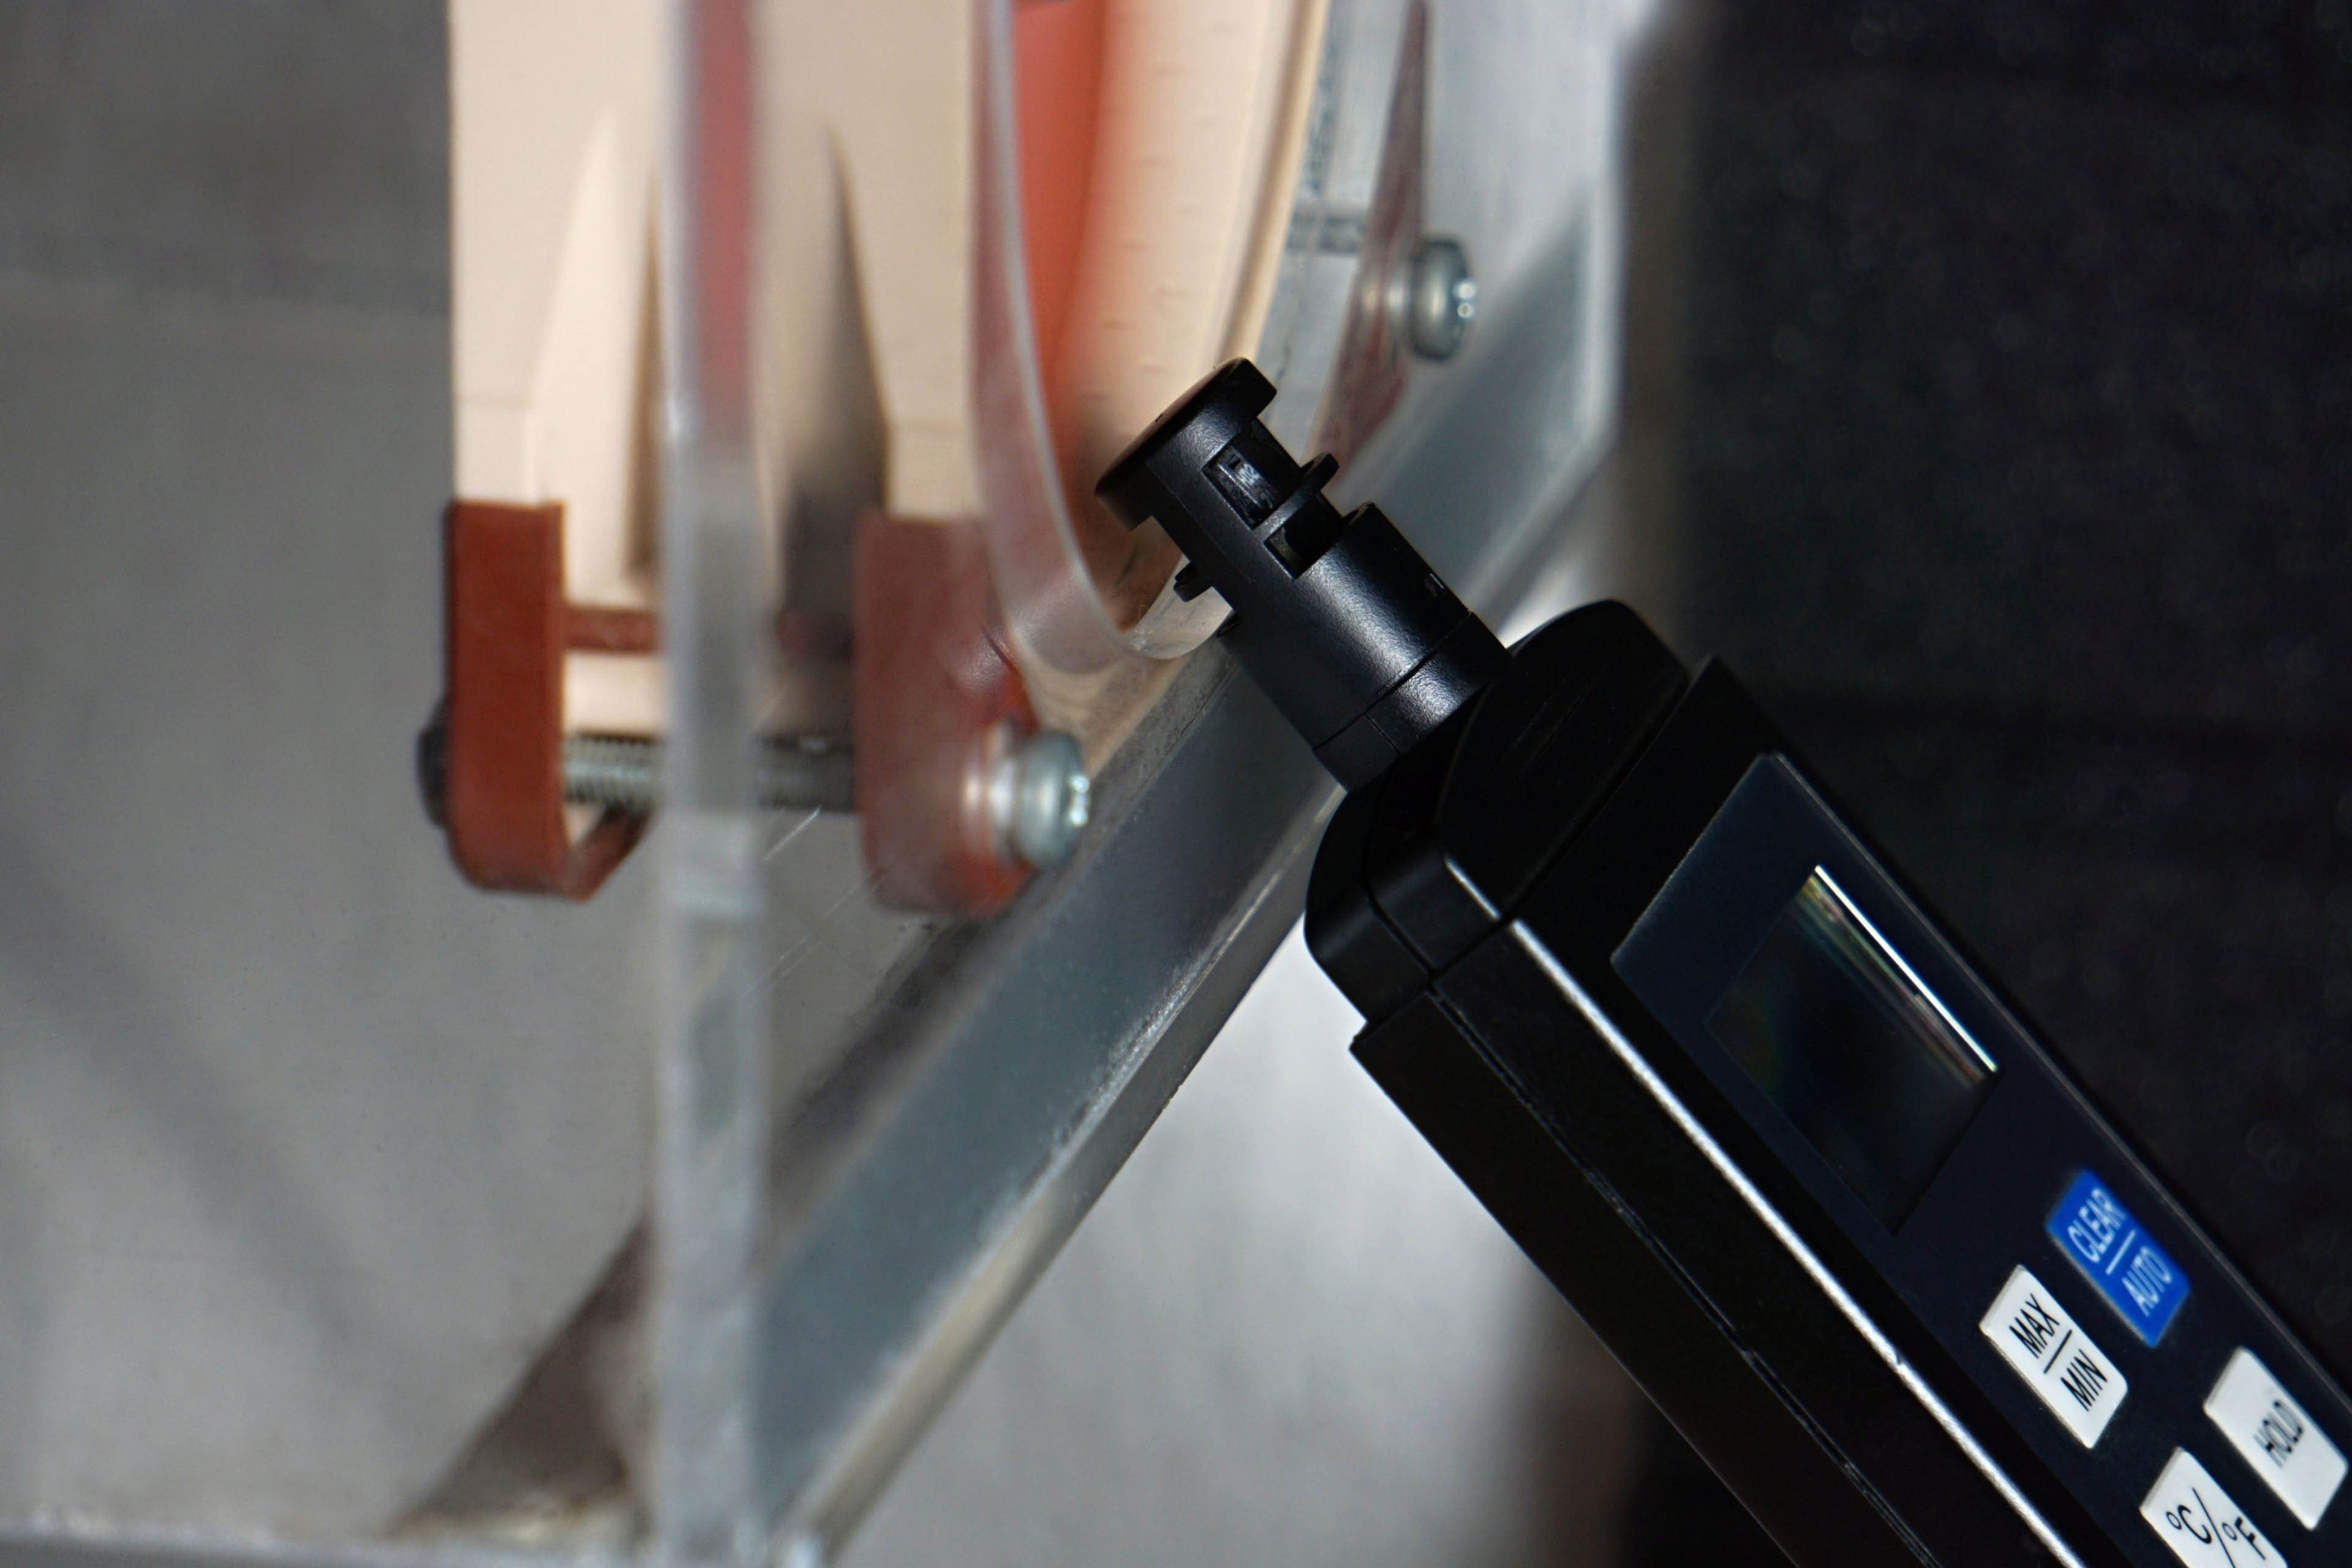
Measurements always take place on a bench-wall in a wind tunnel which simulates a computer case, with the difference that we have more control over it.
System cooling consists of four Noctua NF-S12A PWM fans, which are in an equilibrium ratio of two at the inlet and two at the outlet. Their speed is set at a fixed 535 rpm, which is a relatively practical speed that is not needed to be exceeded. In short, this should be the optimal configuration based on our tests of various system cooling settings.

It is also important to maintain the same air temperature around the processors. Of course, this also changes with regard to how much heat a particular processor produces, but at the inlet of the tunnel it must always be the same for accurate comparisons. In our air-conditioned test lab, it is currently in the range of 21–21.3 °C.
Maintaining a constant inlet temperature is necessary not only for a proper comparison of processor temperatures, but especially for unbiased performance comparisons. Trend of clock speed and especially single-core boost depends on the temperature. In the summer at higher temperatures, processors may be slower in living spaces than in the winter.
For Intel processors, we register the maximum core temperature for each test, usually of all cores. These maximum values are then averaged and the result is represented by the final value in the graph. From the outputs of single-threaded load, we only pick the registered values from active cores (these are usually two and alternate during the test). It’s a little different with AMD processors. They don’t have temperature sensors for every core. In order for the procedure to be as methodically as possible similar to that applied on Intel processors, the average temperature of all cores is defined by the highest value reported by the CPU Tdie sensor (average). For single-threaded load, however, we already use a CPU sensor (Tctl/Tdie), which usually reports a slightly higher value, which better corresponds to the hotspots of one or two cores. But these values as well as the values from all internal sensors must be taken with a grain of salt, the accuracy of the sensors varies across processors.
Clock speed evaluation is more accurate, each core has its own sensor even on AMD processors. Unlike temperatures, we plot average clock speed values during tests in graphs. We monitor the temperature and clock speed of the processor cores in the same tests, in which we also measure the power consumption. And thus, gradually from the lowest load level on the desktop of idle Windows 10, through audio encoding (single-threaded load), gaming load in three games (F1 2020, Shadow of the Tomb Raider and Total War Saga: Troy), to a 10-minute load in Cinebench R23 and the most demanding video encoding with the x264 encoder in HandBrake.
To record the temperatures and clock speed of the processor cores, we use HWiNFO, in which sampling is set to two seconds. With the exception of audio encoding, the graphs always show the averages of all processor cores in terms of temperatures and clock speed. During audio encoding, the values from the loaded core are given.

Thank you for the article. I have been looking for 14th gen non-K cpu reviews.
Do you have an explanation why does 14100 take so much more power at idle, compared to 13100? In the other power graphs too, 13100 seems to be an outlier… I expected 14100 to be basically the same cpu, just being produced using a tad better refined process, and the clocks whipped up a bit.
More aggressive clock speed management. The Core i3-14100F does not go to 400 MHz like the Core i3-13100F (although the working range of the multiplier should be the same). I’m not saying it never does, but not at the level of our load corresponding to “idle”. And it won’t be on the edge either, nothing changed by terminating some processes (for example launchers) in the background, after which less load is put on the processor. Sometimes, under the same conditions, the Ci3-14100F doesn’t underclock as aggressively (as the Ci3-13100F). I can’t note what this is related to, but it might have something to do with a more aggressive TB (2.0), which makes the processor run at higher clock speeds even at very low load.
Sounds plausible.
Did you re-test 12100 and 13100 using the same exact OS version? I am also thinking if the silicon lottery may play a role, I have seen a test of multiple cpus of the exact same model, and the results were somewhat divergent. (Do not remember the source, I think it was Der8auer.)
No, we haven’t re-tested the Ci3-12100F and Ci3-13100F, but we are still using Windows 10 (22H2). For the reason that it does not change as dynamically as W11 and is therefore more suitable for building a massive database. It would never be possible to make with the kind of tests we do here otherwise.
I can assure you that it is definitely not about “silicon lottery”. I find Der8baer’s tests very irresponsible and unreliable. To accurately analyze such things, a controlled, consistent testing environment is essential, which he does not have. This is extremely important for processors such as the Ryzen 5 7600, which are particularly sensitive to temperature changes. Rather than real differences between processors, his results are more a reflection of how ambient conditions change during individual tests. These include, among other things, the mounting of the cooler on the processor, which is defined by an always equal heat transfer from the processor to the cooler. This is also very difficult to achieve.
We also used to deal with the dependence of the cooling performance on the different techniques of applying thermal paste and its different quantities. And also the influence of different pressure. All this is necessary to control in order to analyze the properties across different pieces of the same processor. It doesn’t seem that these things are any special concern of the author testing with the motherboard “installed” on its box and components randomly spread on the table. 🙂