




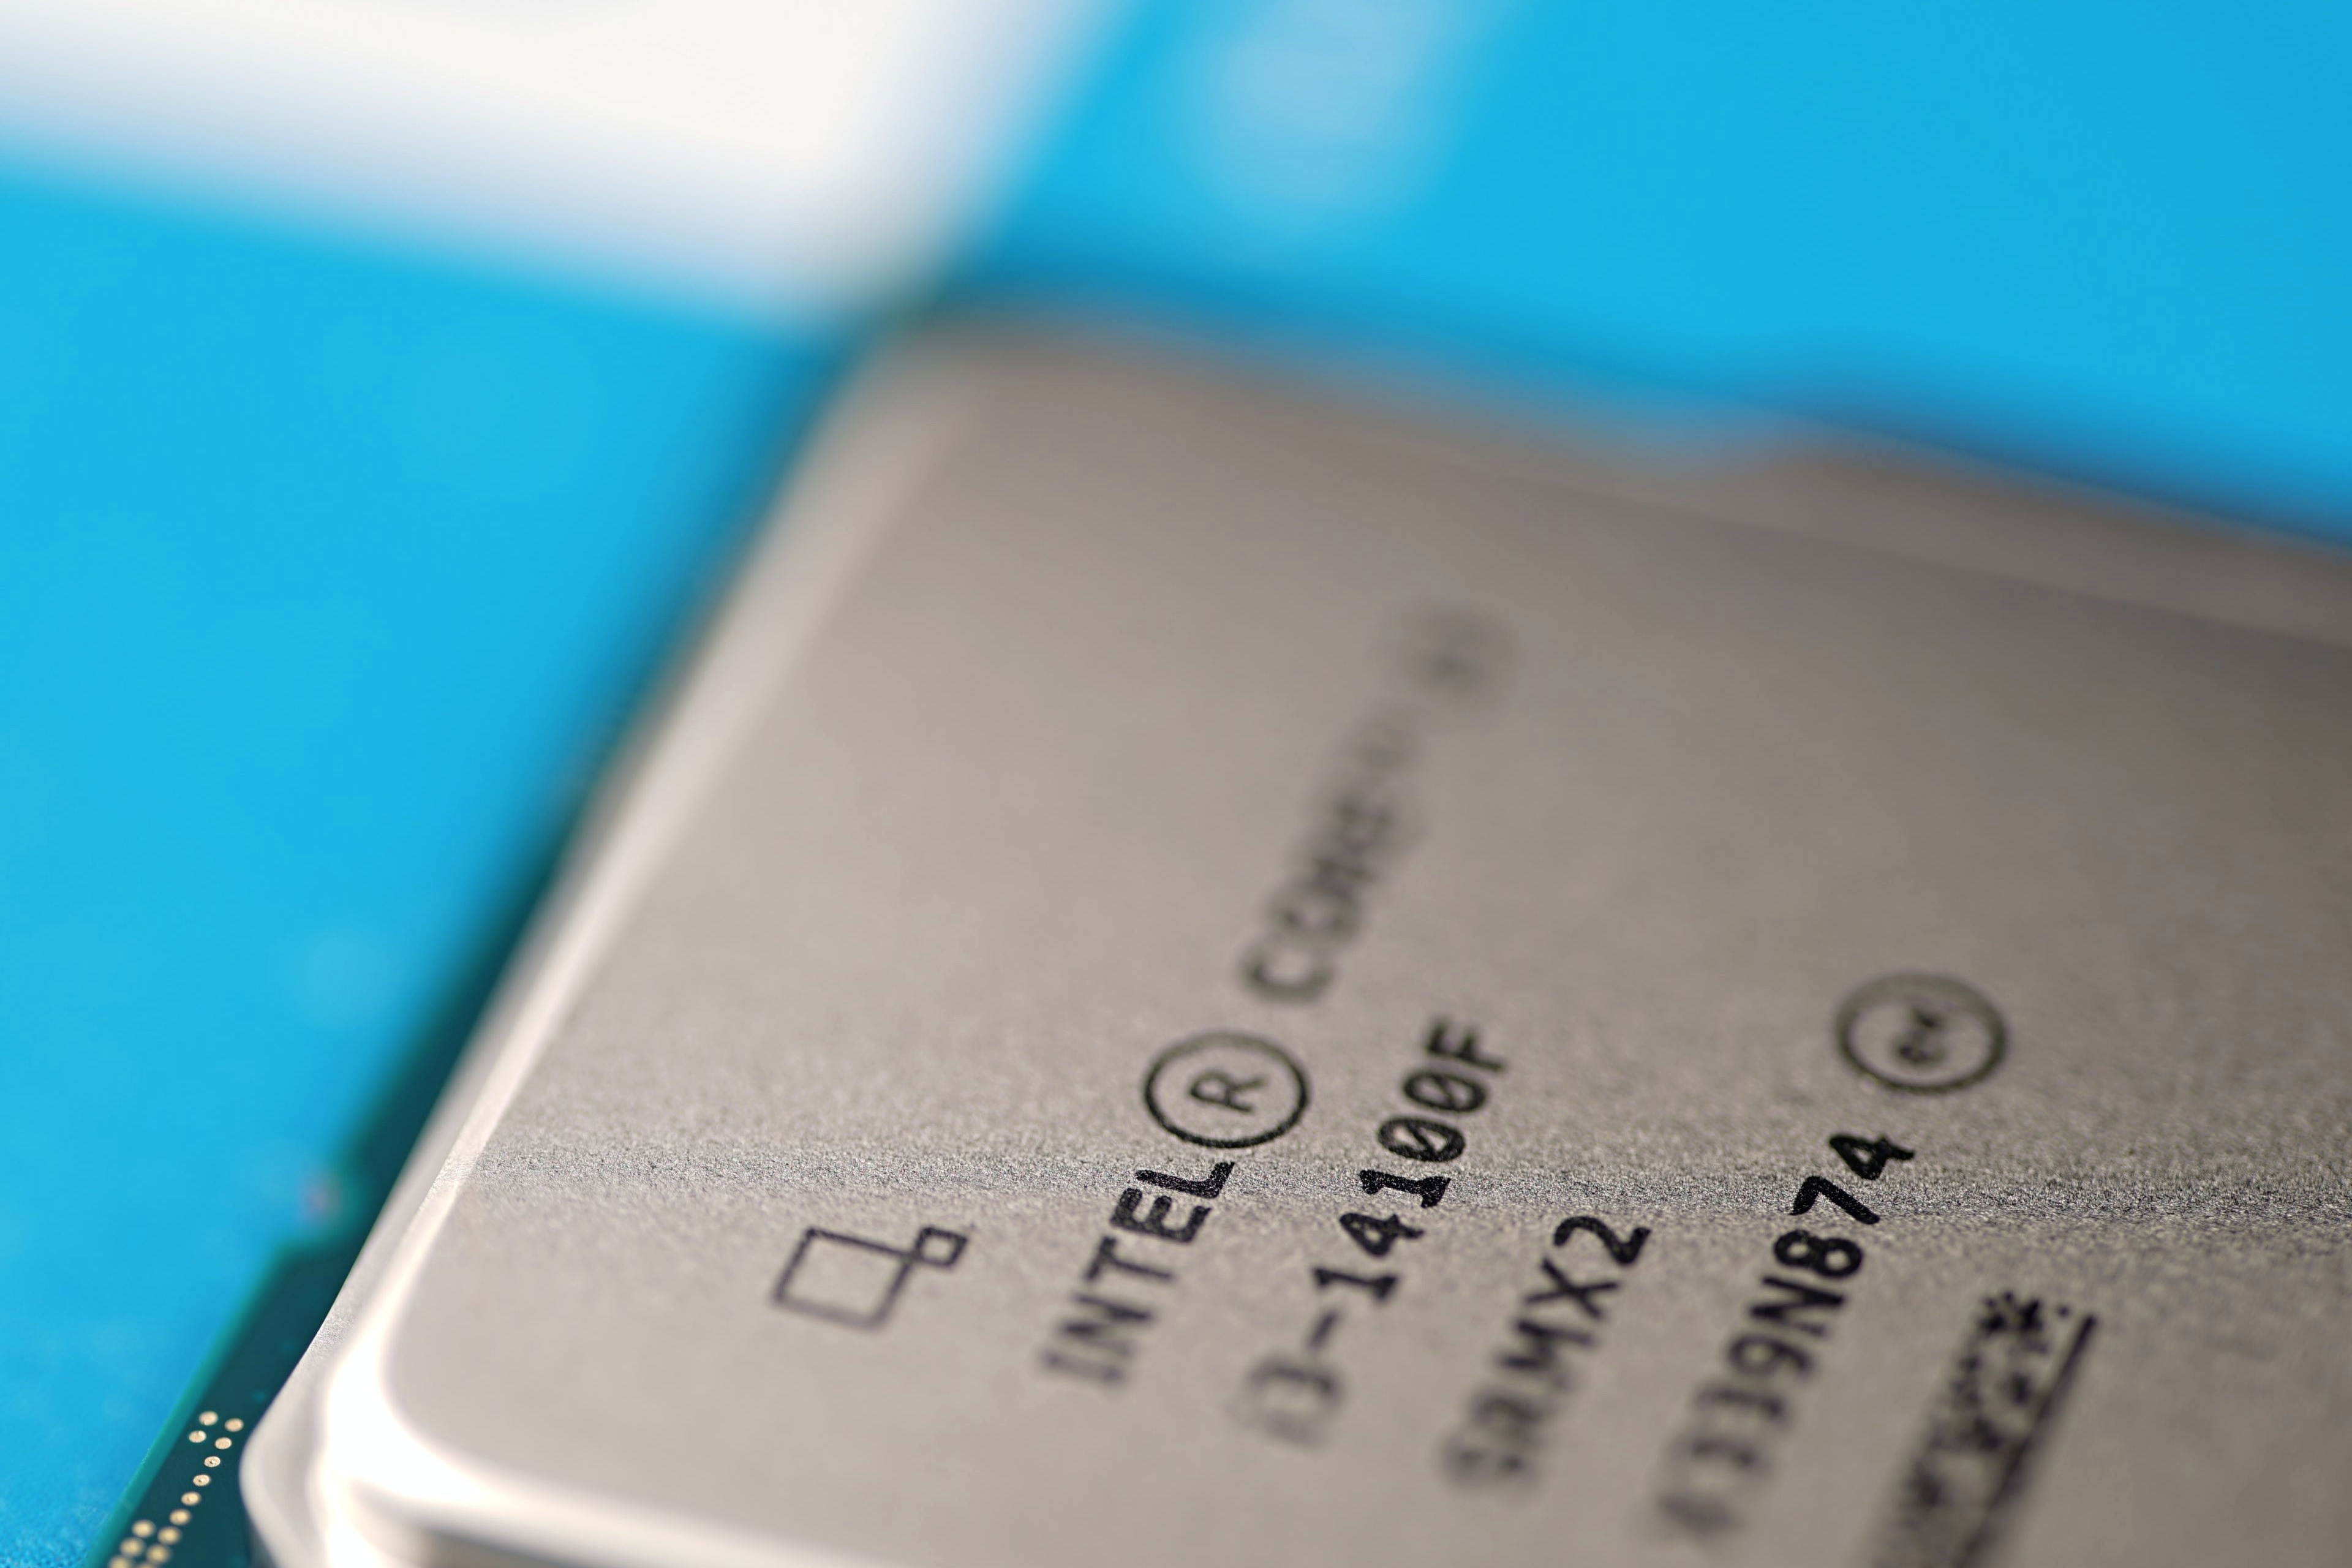
It’s the fastest Core i3 yet, but it’s also the hungriest. The 14100F’s (Raptor Lake Refresh) biggest competition in its own ranks is in the form of older models (13100F and 12100F). These are a bit slower, but lower-power. The “better” choice depends on what holds more weight on your scales. Maybe it will be that record-breaking speed? In this class (Core i3), power consumption is always relatively low.
Methodology: how we measure power draw
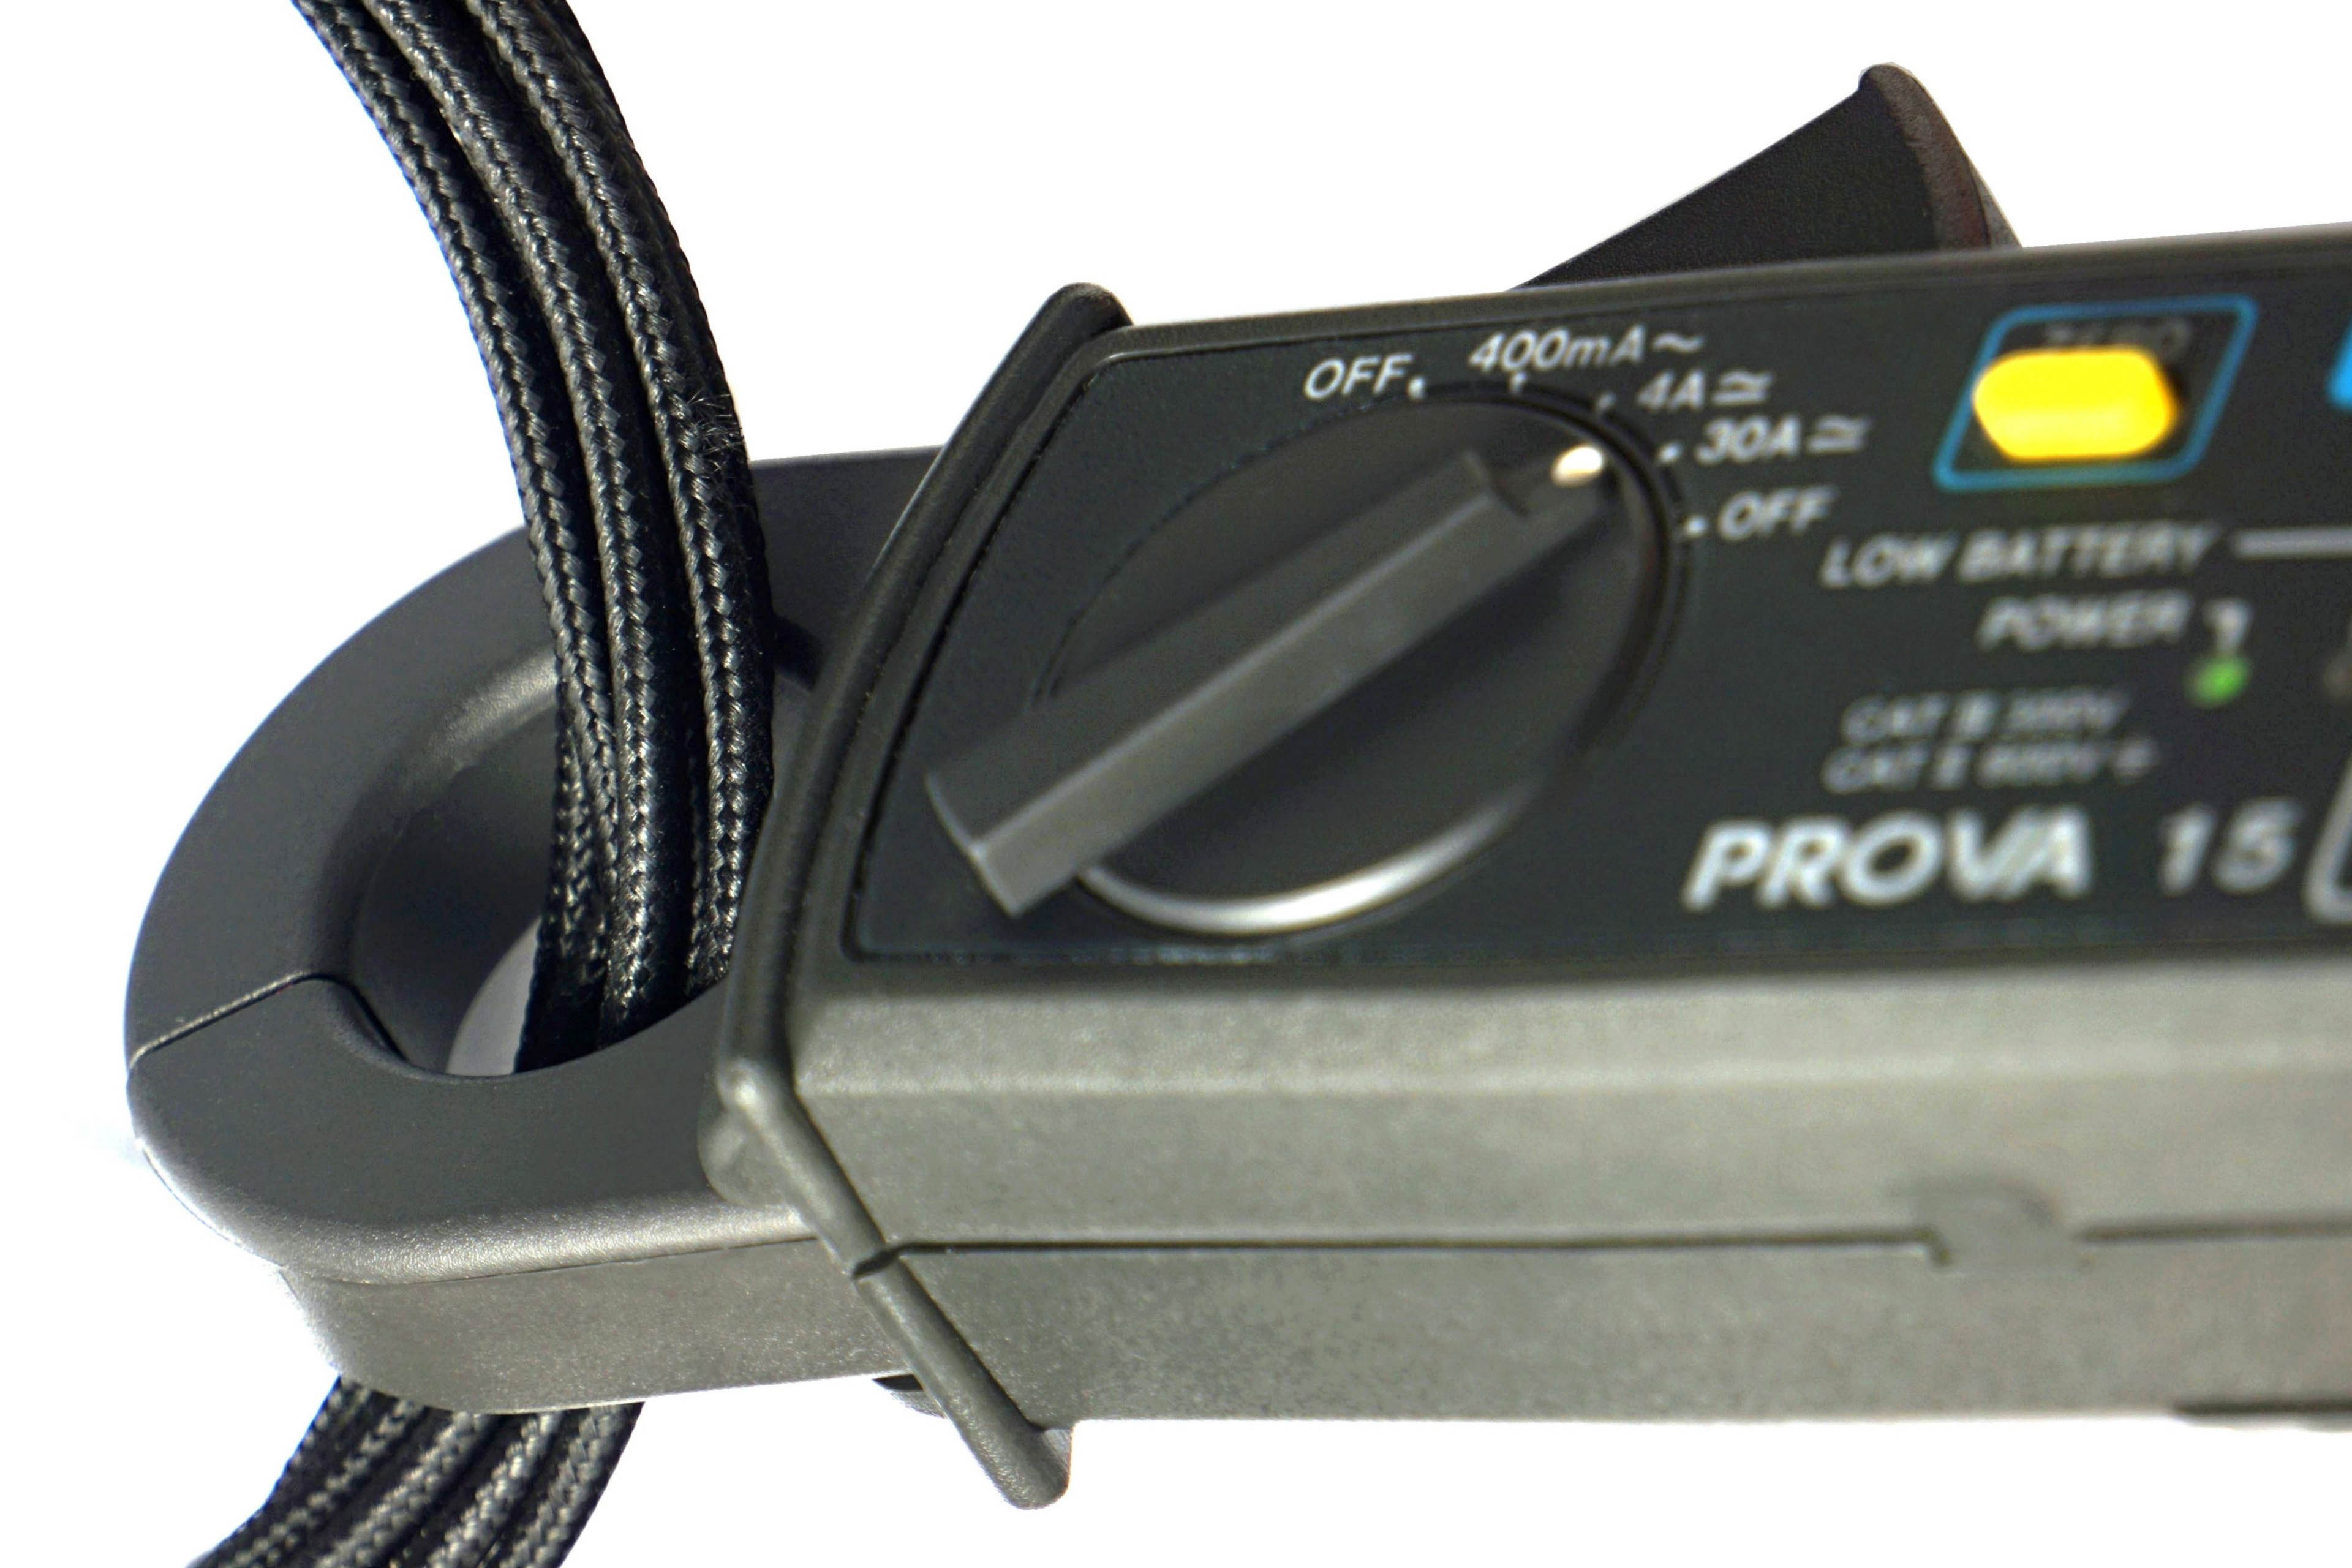
Measuring CPU power consumption is relatively simple, much easier than with graphics cards. All power goes through one or two EPS cables. We also use two to increase the cross-section, which is suitable for high performance AMD processors up to sTR(X)4 or for Intel HEDT, and in fact almost for mainstream processors as well. We have Prova 15 current probes to measure current directly on the wires. This is a much more accurate and reliable way of measuring than relying on internal sensors.
The only limitation of our current probes may be when testing the most powerful processors. These already exceed the maximum range of 30 A, at which high accuracy is guaranteed. For most processors, the range is optimal (even for measuring a lower load, when the probes can be switched to a lower and more accurate range of 4 A), but we will test models with power consumption over 360 W on our own device, a prototype of which we have already built. Its measuring range will no longer be limiting, but for the time being we will be using the Prova probes in the near future.
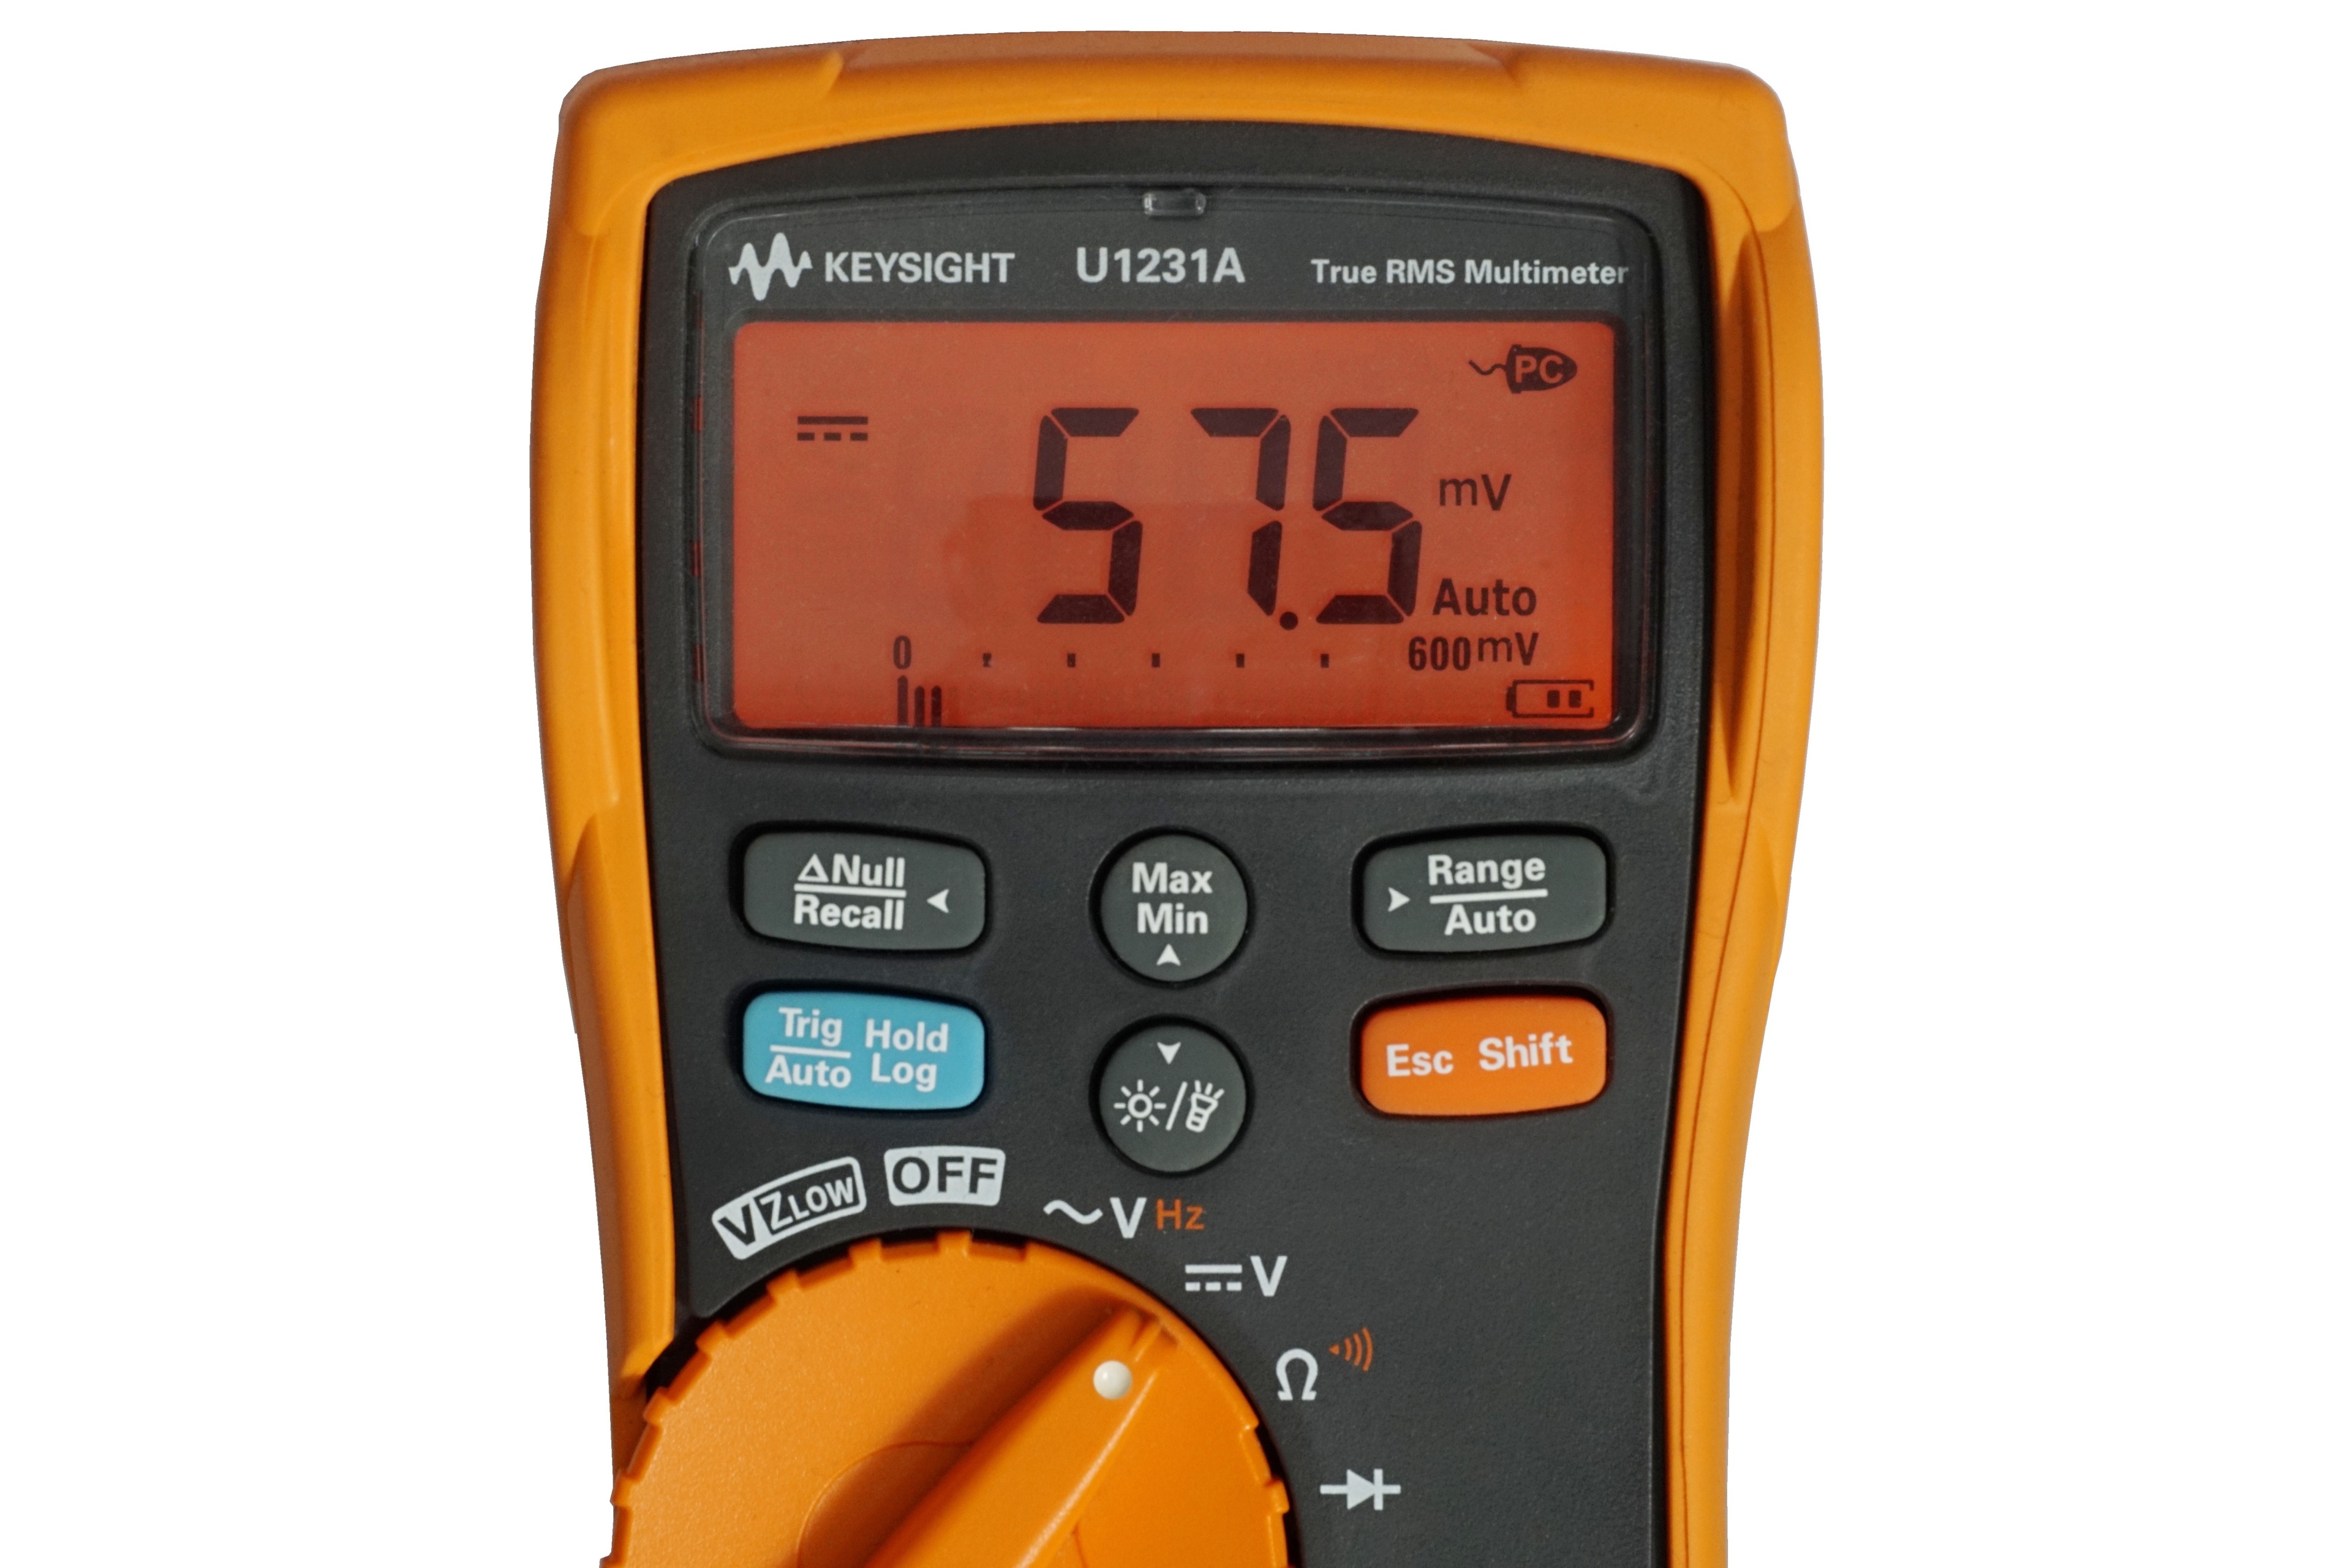
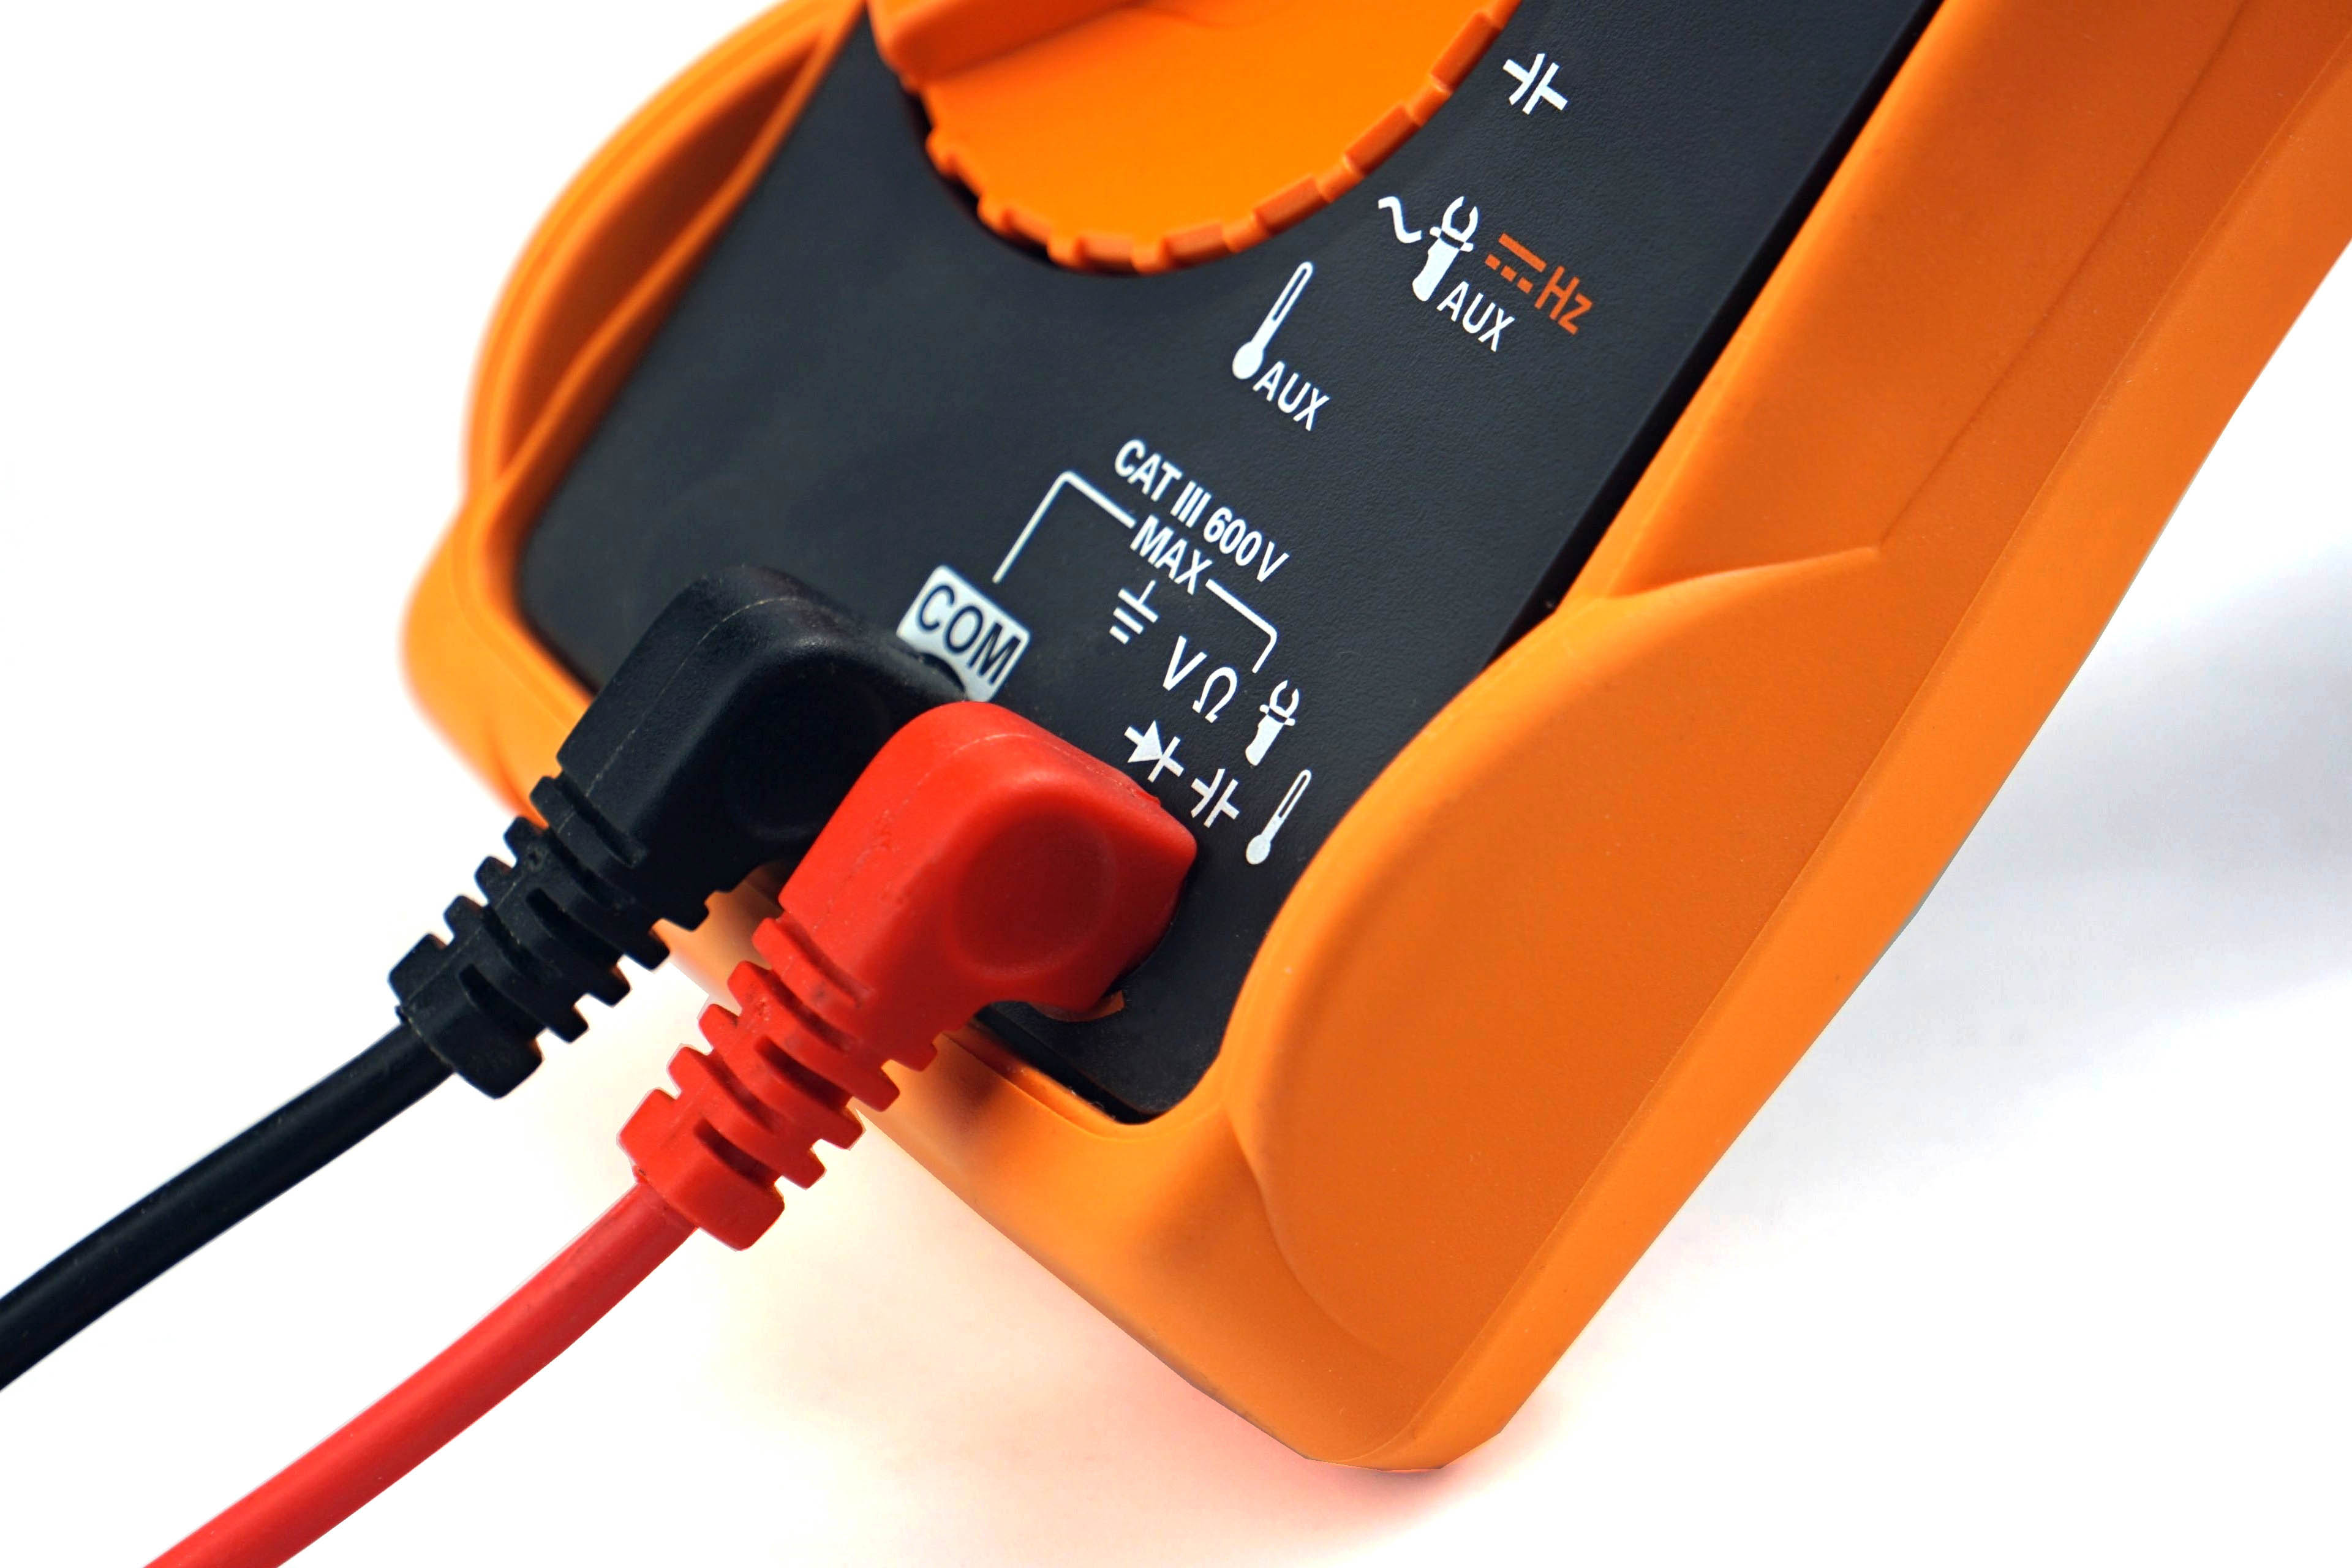
The probes are properly set to zero and connected to a Keysight U1231A multimeter before each measurement. It records samples of current values during the tests via the IR-USB interface and writes them in a table at one-second intervals. We can then create bar graphs with power consumption patterns. But we always write average values in bar graphs. Measurements take place in various load modes. The lowest represents an idle Windows 10 desktop. This measurement takes place on a system that had been idle for quite some time.
Audio encoding (FLAC) represents a higher load, but processors use only one core or one thread for this. Higher loads, where more cores are involved, are games. We test power consumption in F1 2020, Shadow of the Tomb Raider and Total War Saga: Troy in 1920 × 1080 px. In this resolution, the power consumption is usually the highest or at least similar to that in lower or higher resolutions, where in most cases the CPU power draw rather decreases due to its lower utilization.
Power limits are disabled for both Intel and AMD processors, unlocked at the PL2/PPT level. This is also the default setting for most motherboards. This means that the “Tau” timeout after 56 seconds does not reduce power consumption and clock speeds even under higher load, and performance is stable. We considered whether or not to accept the lower-power settings. In the end, we won’t, on the grounds that the vast majority of users don’t do it either and thus the results and comparisons would be rather uninteresting. The solution would indeed be to test with and without power limits, but this is already impossible time-wise in the context of processor tests. However, we won’t ignore this issue and it will be given space in motherboard tests where it makes more sense to us.
We always use motherboards with extremely robust, efficient VRM, so that the losses on MOSFETs distort the measured results as little as possible and the test setups are powered by a high-end 1200 W BeQuiet! Dark Power Pro 12 power supply. It is strong enough to supply every processor, even with a fully loaded GeForce RTX 3080, and at the same time achieves above-standard efficiency even at lower load. For a complete overview of test setup components, see Chapter 5 of this article.


Thank you for the article. I have been looking for 14th gen non-K cpu reviews.
Do you have an explanation why does 14100 take so much more power at idle, compared to 13100? In the other power graphs too, 13100 seems to be an outlier… I expected 14100 to be basically the same cpu, just being produced using a tad better refined process, and the clocks whipped up a bit.
More aggressive clock speed management. The Core i3-14100F does not go to 400 MHz like the Core i3-13100F (although the working range of the multiplier should be the same). I’m not saying it never does, but not at the level of our load corresponding to “idle”. And it won’t be on the edge either, nothing changed by terminating some processes (for example launchers) in the background, after which less load is put on the processor. Sometimes, under the same conditions, the Ci3-14100F doesn’t underclock as aggressively (as the Ci3-13100F). I can’t note what this is related to, but it might have something to do with a more aggressive TB (2.0), which makes the processor run at higher clock speeds even at very low load.
Sounds plausible.
Did you re-test 12100 and 13100 using the same exact OS version? I am also thinking if the silicon lottery may play a role, I have seen a test of multiple cpus of the exact same model, and the results were somewhat divergent. (Do not remember the source, I think it was Der8auer.)
No, we haven’t re-tested the Ci3-12100F and Ci3-13100F, but we are still using Windows 10 (22H2). For the reason that it does not change as dynamically as W11 and is therefore more suitable for building a massive database. It would never be possible to make with the kind of tests we do here otherwise.
I can assure you that it is definitely not about “silicon lottery”. I find Der8baer’s tests very irresponsible and unreliable. To accurately analyze such things, a controlled, consistent testing environment is essential, which he does not have. This is extremely important for processors such as the Ryzen 5 7600, which are particularly sensitive to temperature changes. Rather than real differences between processors, his results are more a reflection of how ambient conditions change during individual tests. These include, among other things, the mounting of the cooler on the processor, which is defined by an always equal heat transfer from the processor to the cooler. This is also very difficult to achieve.
We also used to deal with the dependence of the cooling performance on the different techniques of applying thermal paste and its different quantities. And also the influence of different pressure. All this is necessary to control in order to analyze the properties across different pieces of the same processor. It doesn’t seem that these things are any special concern of the author testing with the motherboard “installed” on its box and components randomly spread on the table. 🙂