


Something for warm-up. We’ll start our ATX 3.0 PSU tests with perhaps the most talked about topic surrounding them, the temperatures of the new cables with 16-pin PCIe connectors. The overview of the PSUs of twelve brands answers well the question of how the manufacturers handled which models. With high current loads, the temperature differences can be quite significant, both on the connector housings and on the wire insulation.
We have completed our work on the PSUs in the external testlab. But it will still take some time to finish the acoustic part. Now we will shorten the wait for the complete tests by comparing the temperatures of 12VHPWR cables.
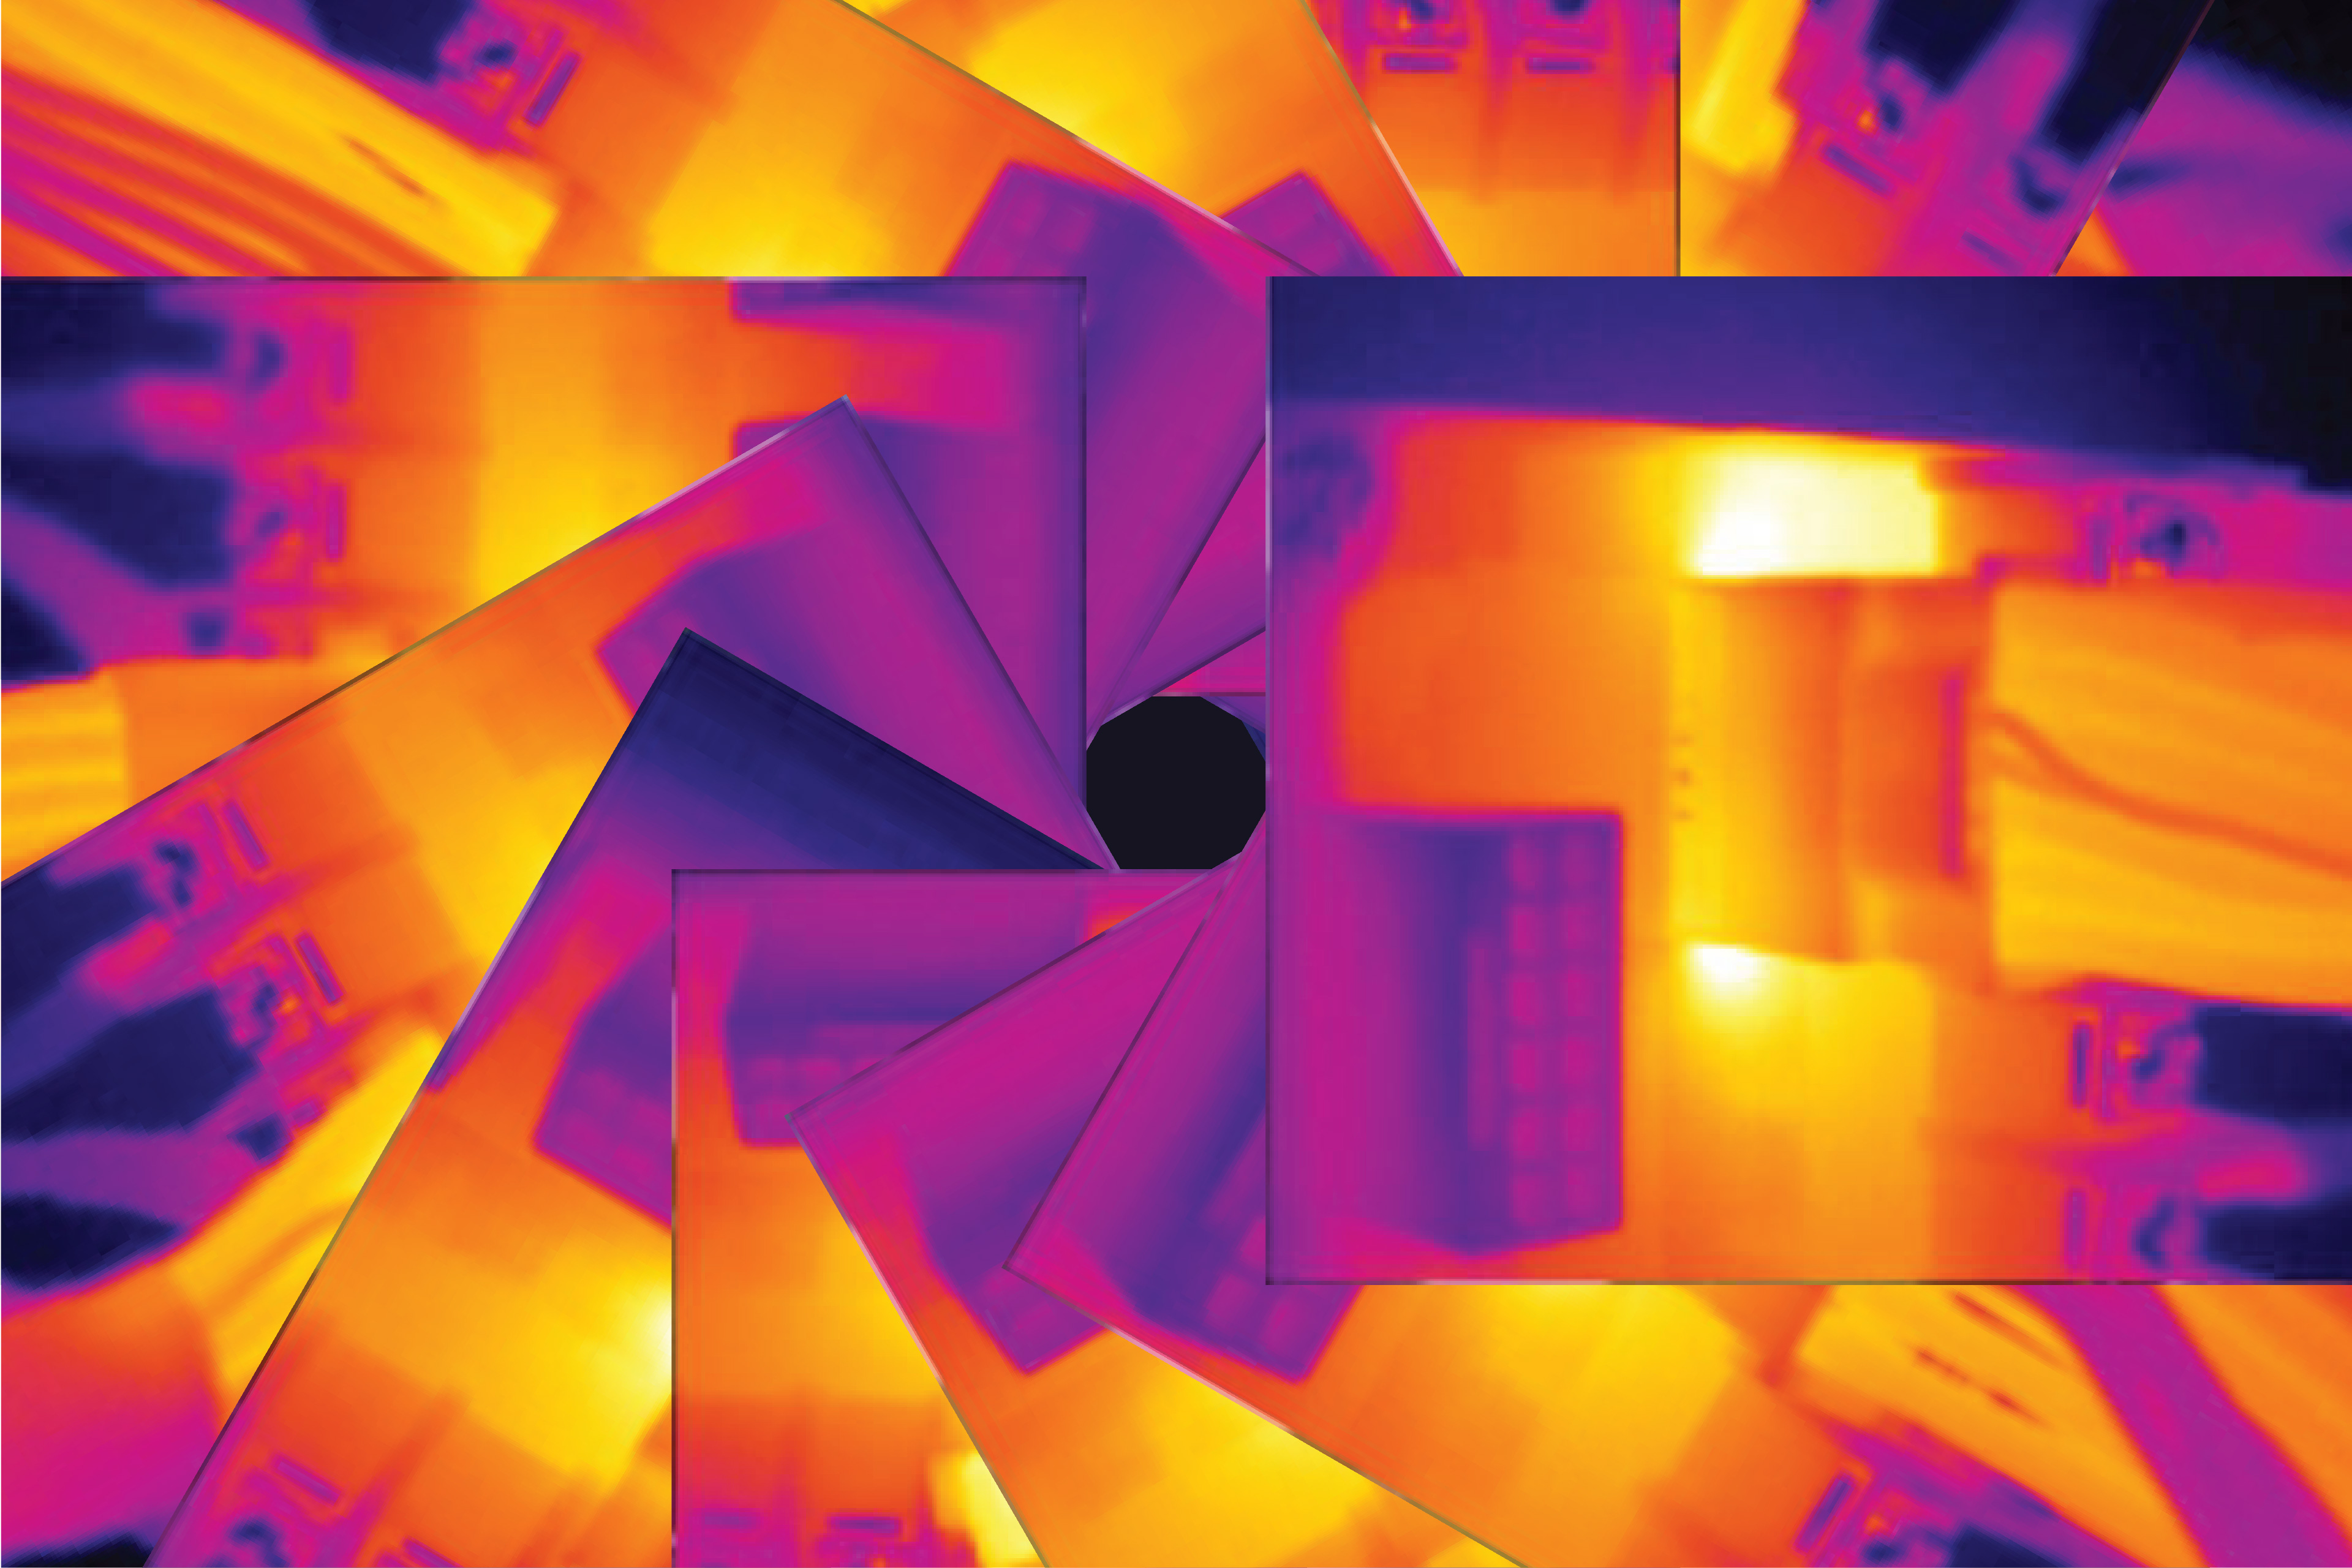
You are already familiar with the lineup of PSUs we have been dealing with. However, the results of these measurements are also compatible with other performance variants. Across the board, the same cables are usually used, even when they have different wattage rating markings on them. While most power supplies have 600 W printed on the housing, the Cooler Master GX III Gold 850 or even the SilverStone DA850R have “only” 450 W, for example. However, this does not indicate a lower cable load capacity, but only that higher loads are not recommended for 850-watt power supplies, given that when the maximum rated load capacity of the cable is reached with powerful processors, the system may already be unstable due to overloading. Reason being that overloading will occur on the 12-volt rail.
So even though we have specific models with twelve different brands, the same conclusions will be valid for other performance variants of Asus, BeQuiet!, Cooler Master, Corsair, DeepCool, Enermax, FSP, Gigabyte, Chieftec, MSI, Seasonic or SilverStone power supplies. In many cases, the same cables are also found across model lines. In other words, the knowledge we get with a particular manufacturer in model x will likely be comparable across the model range.
We will soon publish a separate article on the PSU testing methodology with all the necessary details needed to control the test environment. For the purposes of this article, only a few details will suffice. The main one is that the current setting for all connectors is 53 A, which at 12.0 V is equivalent to 600 W (the mark you usually find in the specifications on the connector housing). The continuous current load that each 12VHPWR cable should be capable of is up to 55 A.
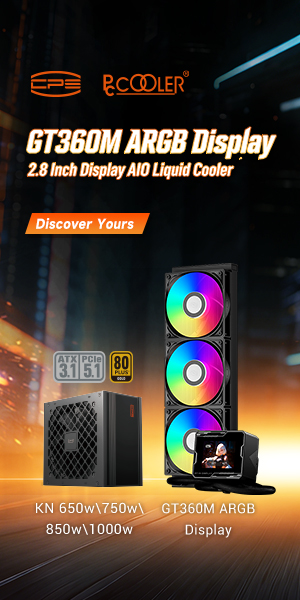
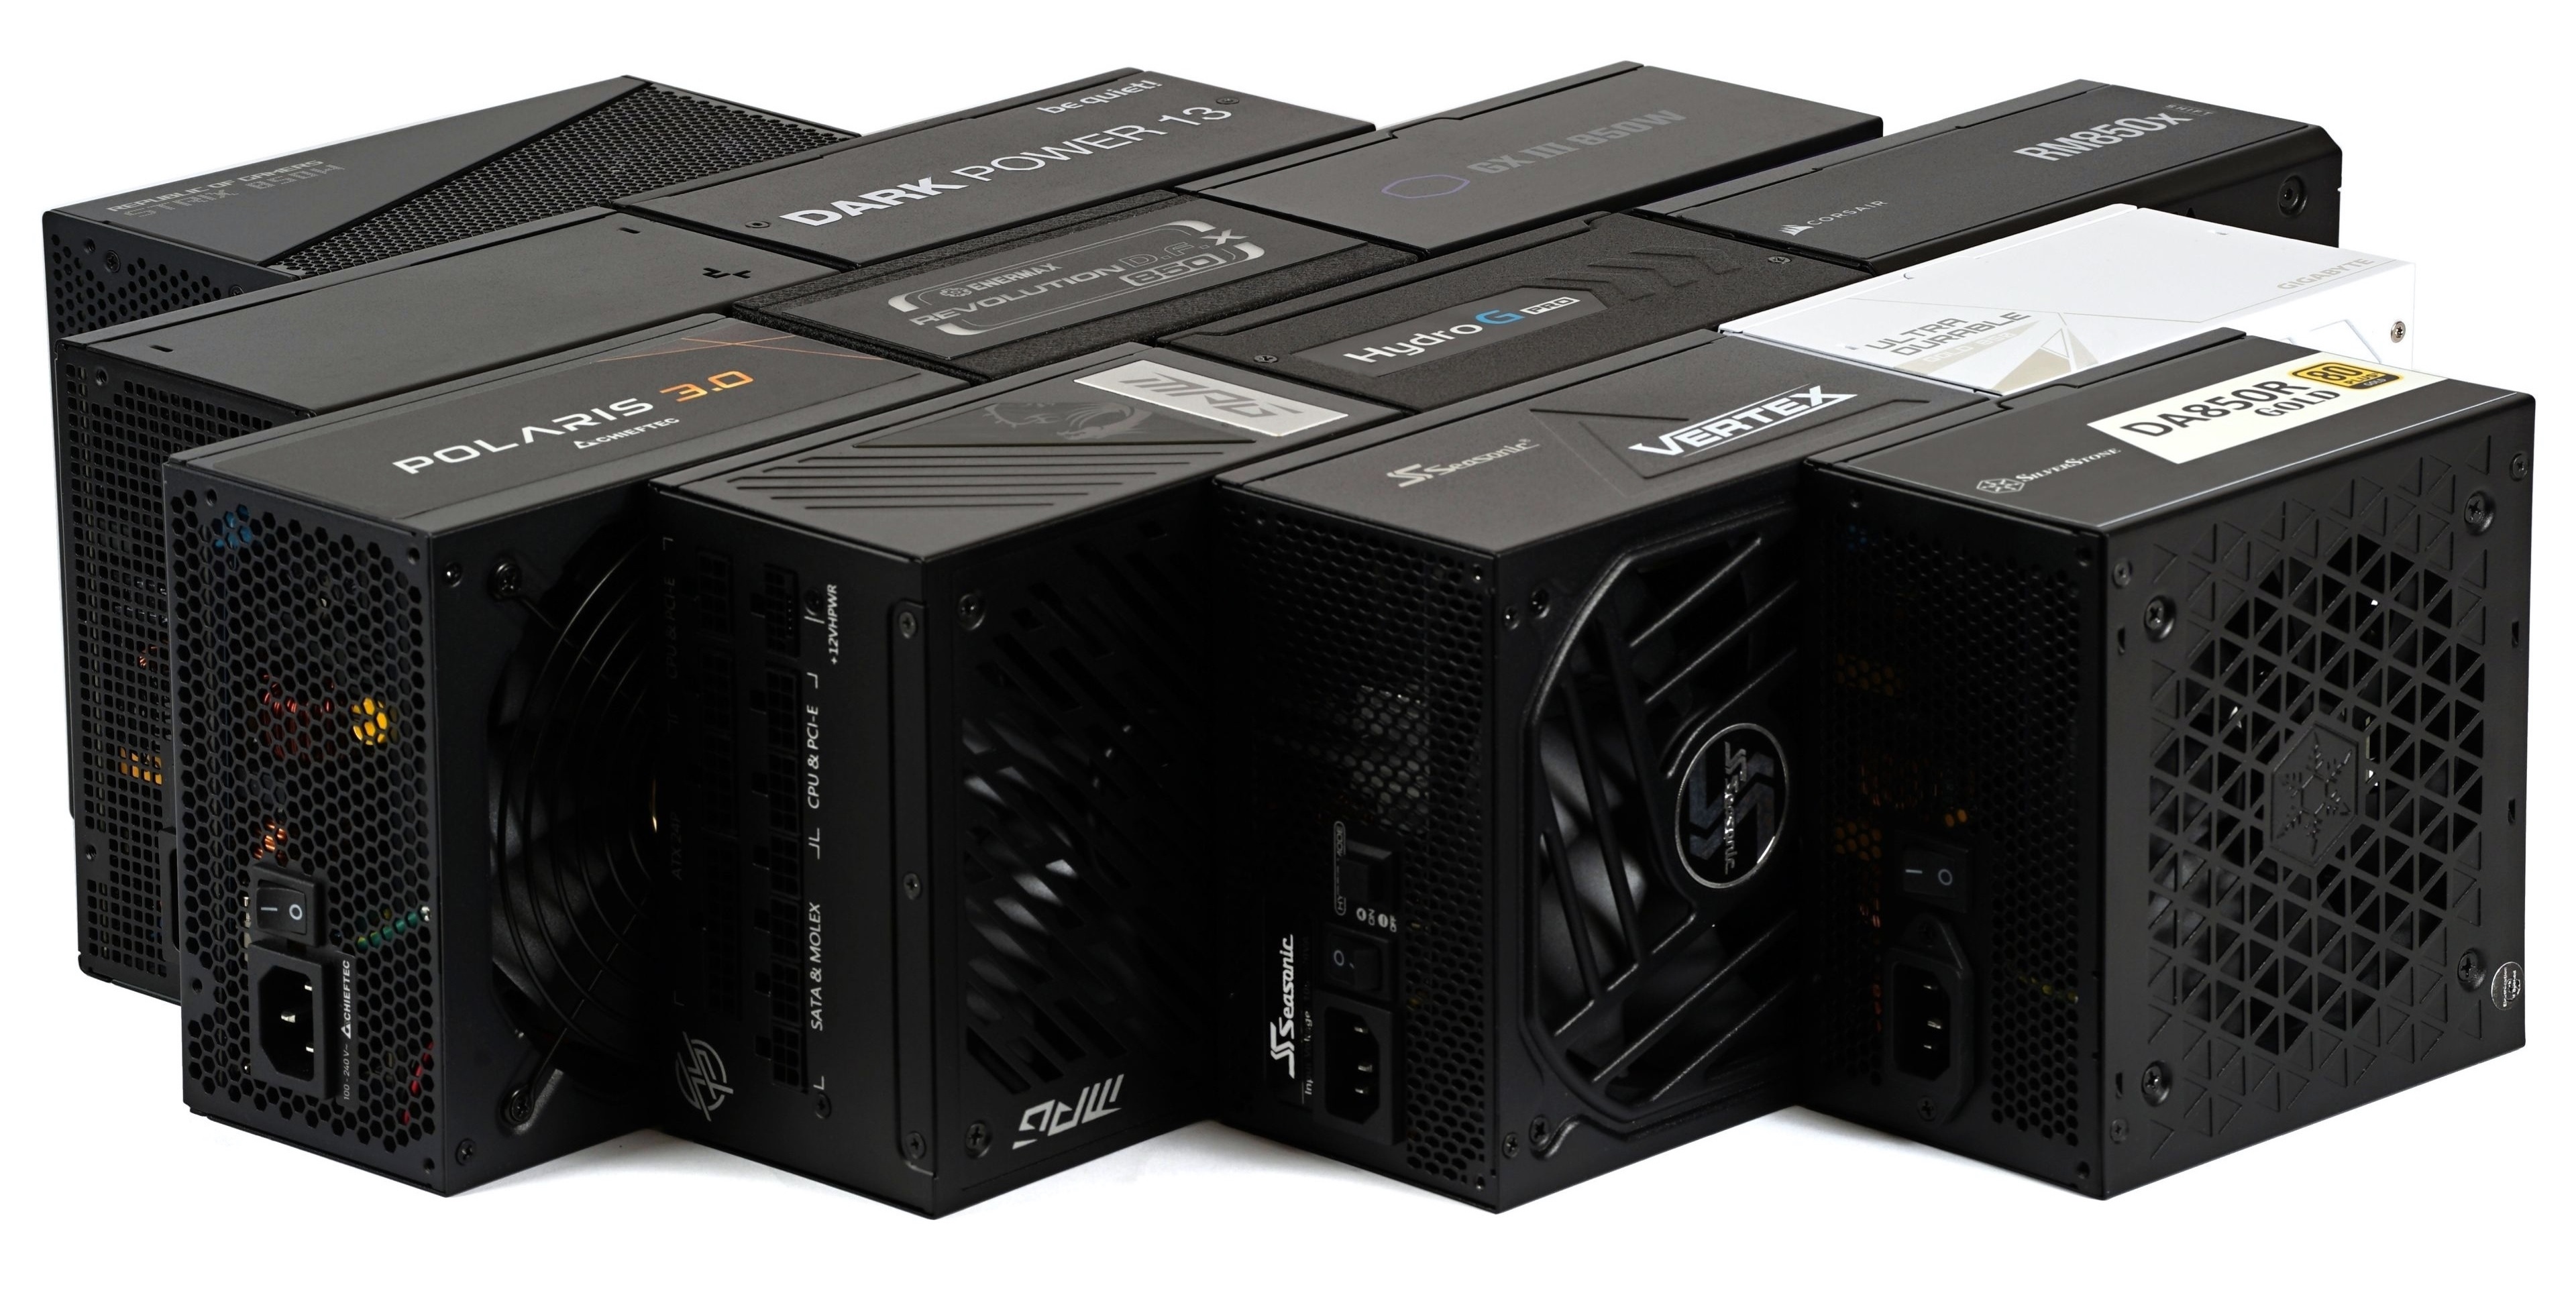
To achieve constant conditions, we use a Chroma 63106A load module kit to which a PCB with a 12VHPWR connector is connected. The connector operates in an open space, outside a case, with no active air circulation, but at a controlled ambient air temperature. This is around 19 °C in the background. Thermal imaging photos are taken after 600 seconds of load. The cables start from “room” temperature.
The maximum and average surface temperature is zonally read from the connector housing (plastic sleeve for the contacts) and from the insulation of the wires. Temperature maps can be found in the second chapter of this article. The third chapter is then a grouping of the details of the hollows profiles on whose design the temperature of the cables depends. This is because they form the transient resistance that results in “some degree of heating”.
Test results
In general, it should be noted that all PSUs are capable of operating at very high current, at the edge of their specifications. Nevertheless, there are variants that can be assessed as having technically better or worse implementation in this respect.
The lowest temperature of the tested 12VHPWR cables is the one on the Chieftec Polaris 3.0 power supply. And that’s whether it’s the temperatures of the connector housing or the wires. The power part of the cables is always (for each cable) 16 AWG. With the same connector, the temperatures wouldn’t vary too much. However, connectors are different and the higher the temperature in the connectors, the hotter the cable itself gets, which acts as a passive cooler, dissipating heat.
In the aspect we’re looking at in these tests, the Asus ROG Strix 850G Aura has the relatively weakest cable. It experiences the highest temperatures. The MSI MPG A850G‘s cable has only slightly lower temperature. The gap from these PSUs from the rest is quite pronounced. The electrical contact will thus be on a smaller surface area, and the Strix 850G Aura’s hollow walls also appear thinner. They will then warm up faster. For a detailed structural analysis it is necessary to disassemble the connectors to see the whole construction of the hollows, but again we do not consider this so important. For the end user, the result, or the measured values are key.
It is evident (visible) that PSU manufacturers use more than two kinds of hollows. The different quality of the solid connections (crimping, soldering) also plays a role in temperature rise. In addition to the Chieftec Polaris 3.0’s cable, the cables that can also be described as “thermally” very decent are the ones of the SilverStone DA850R Gold, Enermax ERT850EWT, Seasonic Vertex GX-850 or the DeepCool PX1000G. SilverStone has the second lowest maximum connector temperature and Enermax has an average one. The larger difference between the highest and the average temperature points to weaknesses that can be suppressed by making the critical part thicker.
Everything is also in perfectly fine with the FSP Hydro G Pro ATX3.0, Gigabyte GP-UD850GM PG5W, Corsair RM850x Shift, Cooler Master GX III Gold 850 or the BeQuiet! Dark Power 13. Even at 53A, which you won’t encounter in practice (RTX 4090 graphics cards have up to 40A), there’s still a margin here. This is useful in builds with lower airflow (not uncommon for spaces behind the side panel) or in environments with excessive ambient air temperature, or a combination of both of these factors.
When plugging in the 12VHPWR connectors (and not only those), of course, always make sure that their safety latch clicks. The latter is indicated by an acoustic response, but when it is silent, you can also feel that you have pushed the connector to the stop by touch. If neither of these phenomena occur, the temperature will be higher in the critical areas. To what extent depends on the quality of the installation. The smaller the contact area of the pins with the hollows, the higher the transient resistance, which also results in higher temperatures. With expert installation, the risk of fire is minimal. Still, you’ll already get a nasty burn on the hottest cables in our tests, as they’re not that far off the 105°C they’re designed for. Remember that the measurement results below take place at a higher current than you will encounter in practice.
Addition/update (13. 12. 2023): We have noticed that there are comments in external discussions about the evaluation of the method we used to analyse the cable temperature, with the suggestion that the use of thermocouples instead of a thermal imaging camera would be preferable, which in this situation (cable measurements) we take the liberty of objecting to. Although IR imaging has its drawbacks, since the nature of the surfaces being monitored does not require a change in emissivity number, you will not get more accurate comparative data across cables from a thermocouple. On the contrary, when using thermocouples, the resolution is reduced and to make comparably (versus IR) objective measurements of the hottest spot, or even the average heating, a very large number of thermocouples would have to be used and the result would be rather less relevant. This is for example also because the presence of thermocouples will change the properties of the cable by absorbing heat at their own level. To a different extent with different mounting, the distortion could vary there. Also for this reason, in this case, we consider IR imaging to be a more reasonable choice.
And that the surface temperature of the cable (from the connector housing or from the insulation of the wires) is less useful data than information about the temperature of the core/live part of the cable? Live parts are naturally hotter, but we consider insulation temperature to be important for practice. Also, the temperature figure on the cable tells you what temperature the insulation used is capable of, not the wire as such, the latter won’t just easily melt. Safety risks arise from damage/breach of insulation. Certainly, a figure for the temperature difference between the core and the surface of the insulation would naturally be attractive, as the inner wall of the insulation will also get hotter and reach critical levels sooner. Last but not least, it is also possible that there are some technical gaps in the perception of the problem as we describe it. This is getting into things that are outside our primary specialty. HWCooling does not employ “experts in everything”.
English translation and edit by Jozef Dudáš

