


Blade length is always the “topic”, but will be more common with 140mm fans than smaller variants. Some bet on long blades for preference of selected features, the other manufacturer on short ones. And such (short) and overall more robust blades are also used by the 140mm Aorus fan. From certain points of view this is quite a big advantage, but for which something had to be sacrificed. It’s a quid pro quo.
Basis of the methodology, the wind tunnel
Before you start reading the methodology with all the details, take a look at the test tunnel as a whole. This is the heart of the whole system, to which other arteries are connected (manometer, vibrometer, powermeter, …). The only solid part of the tunnel from the measuring instruments is the anemometer.
The shape of the wind tunnel is inspired by the Venturi tube, which has long been used to measure the flow of liquids and gasses. The Venturi effect for wind speed measuring is also known from the aerospace industry. However, the design for measuring computer fans has its own specificities, which this proposal of ours reflects.
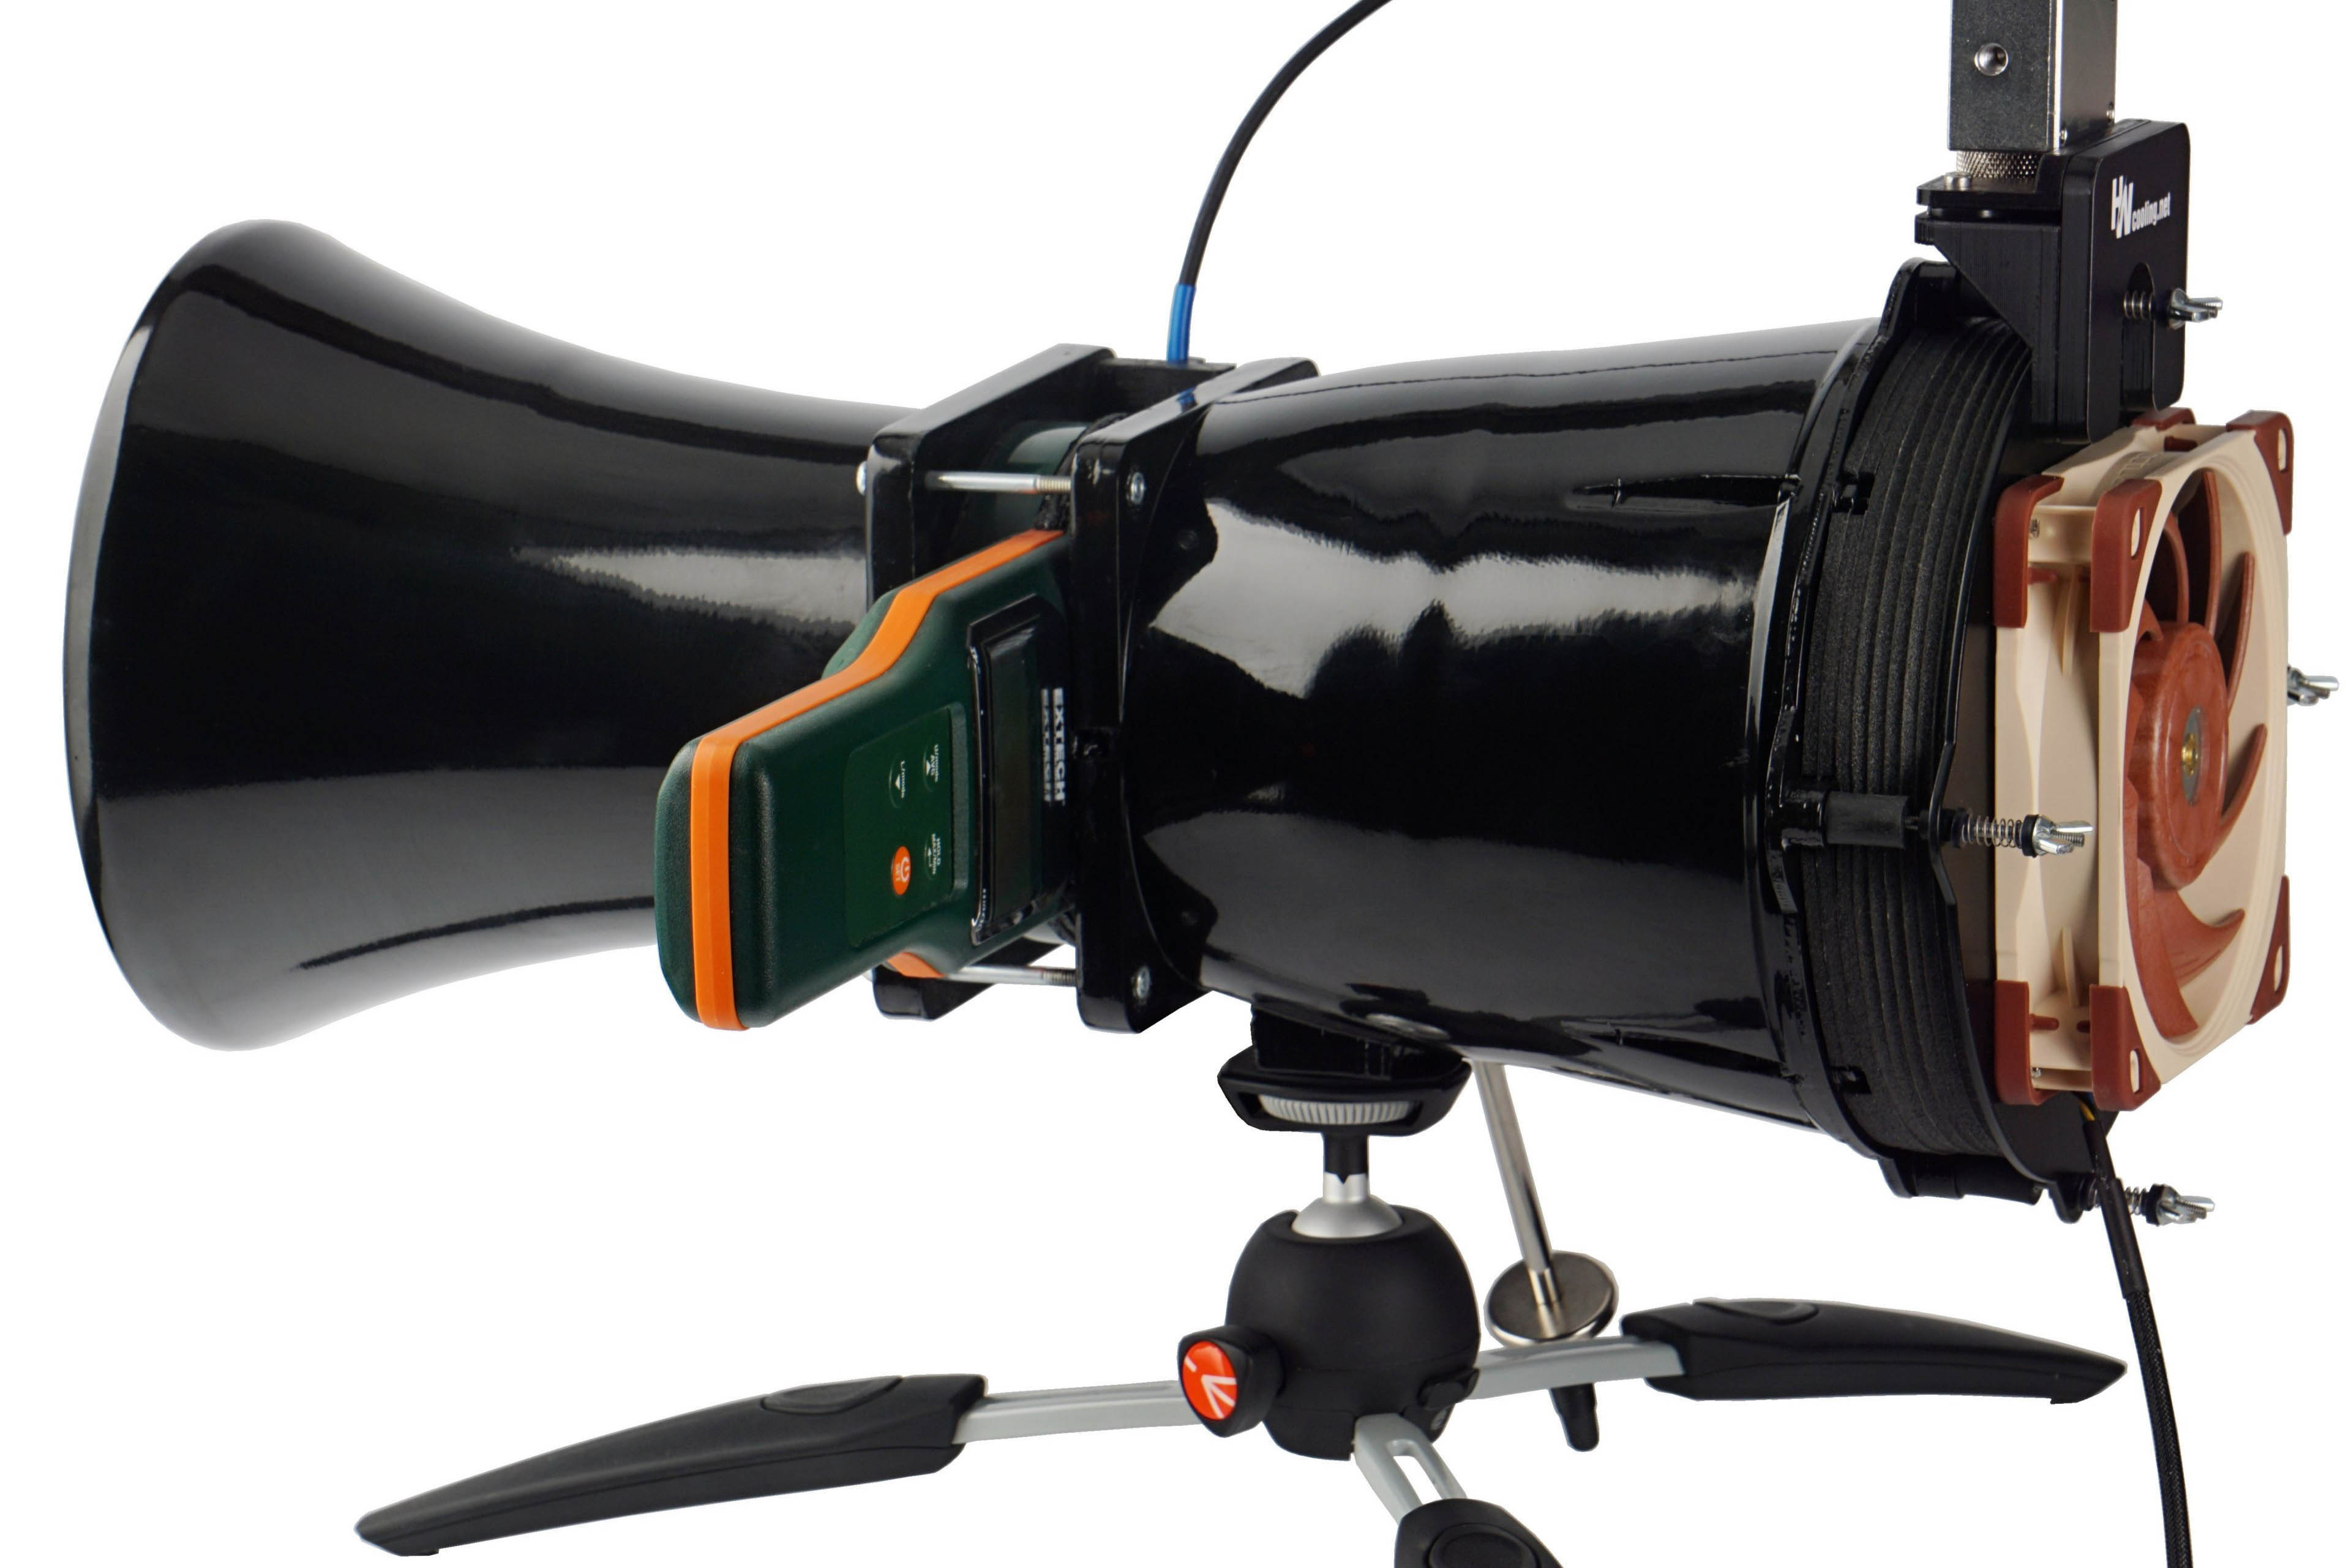
The individual parameters of the HWC wind tunnel for fan tests are the result of physical simulations and practical debugging. All the details (folds, material or finish used) have a rationale behind them and are designed this way for a specific reason. We will discuss the individual design details in turn in the description of the sub-variable measurements.
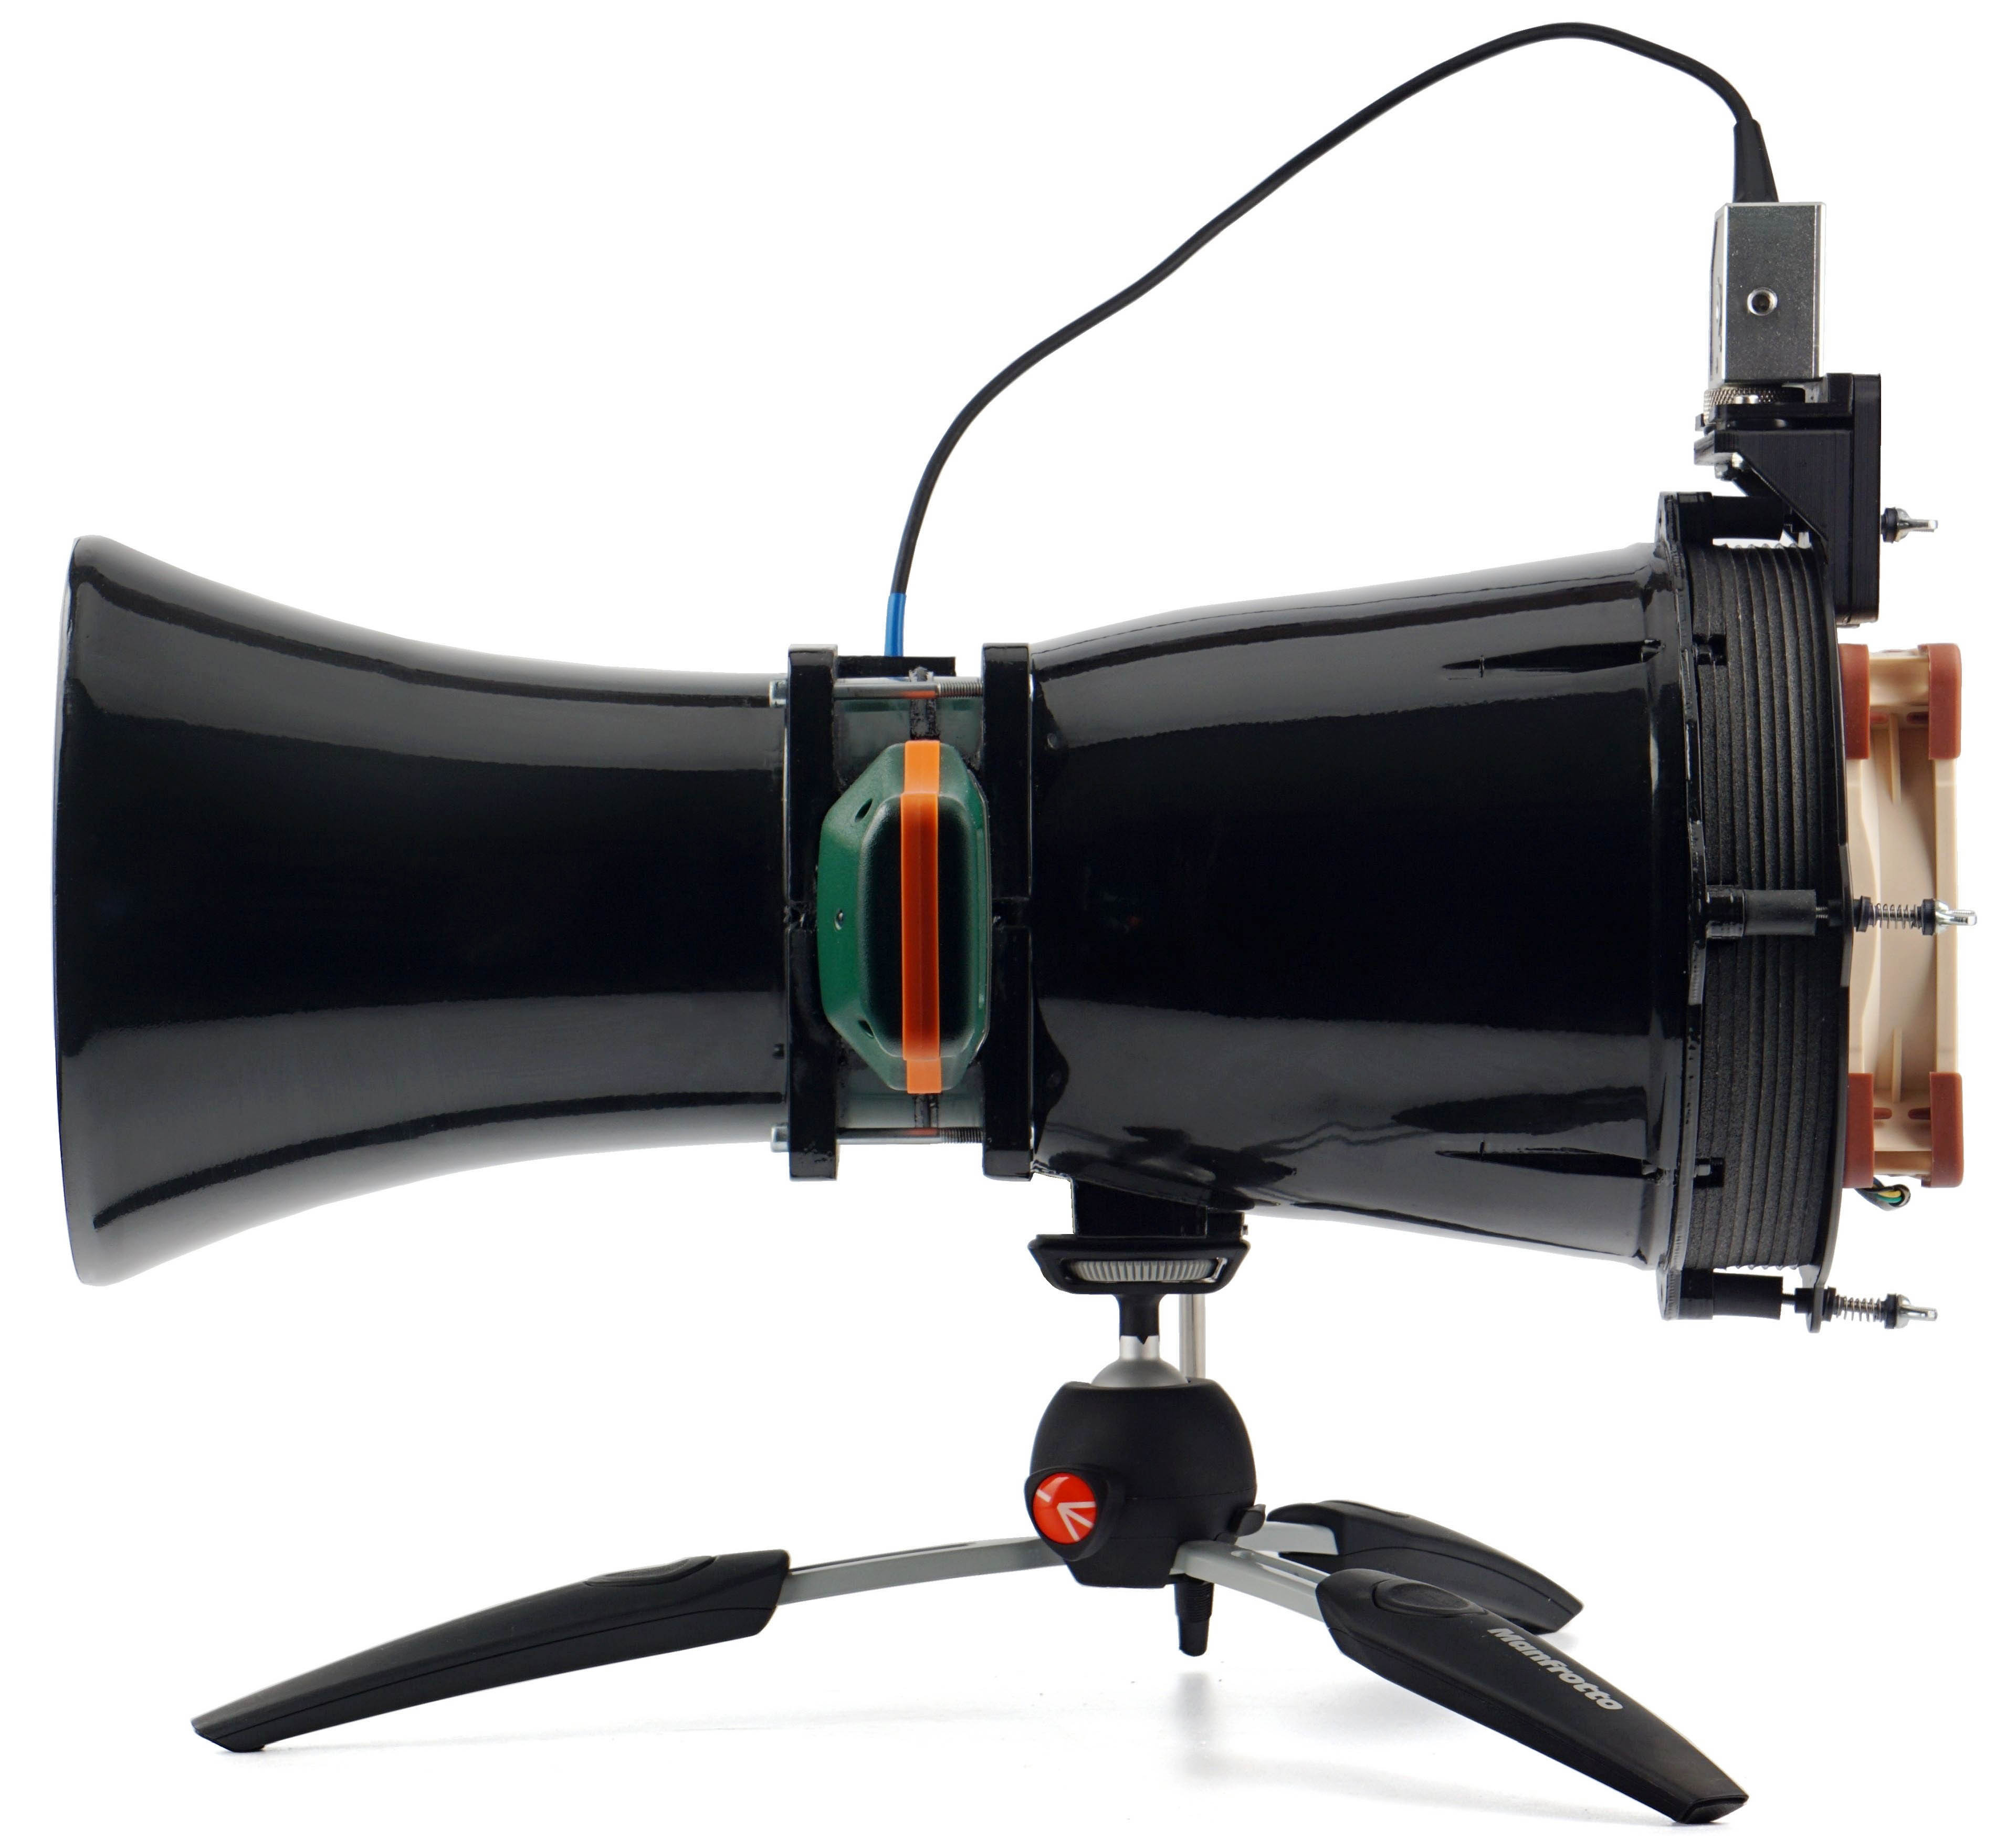
Now we will briefly elaborate on some things that do not fit thematically into the text of the following chapters. Namely, for example, that the skeleton of the wind tunnel is the work of a 3D printer (PLA). The rough print was, of course, then thoroughly machined by grinding, fusing, polishing and varnishing. Especially important is the smooth finish of the interior walls.
When joining the individual parts, the emphasis was on making sure that they fit together flawlessly, that they were sealed flawlessly (we will come back to this when we describe the test procedures for pressure measurement), but also that the joints were not loosened by use. Everything is disassemblable for servicing purposes, but it is ensured that the properties are maintained during use and, for example, even under the stress of vibration. The threads are secured with either lock nuts or thread-locking fluid. It depends on which is more suitable in which place.
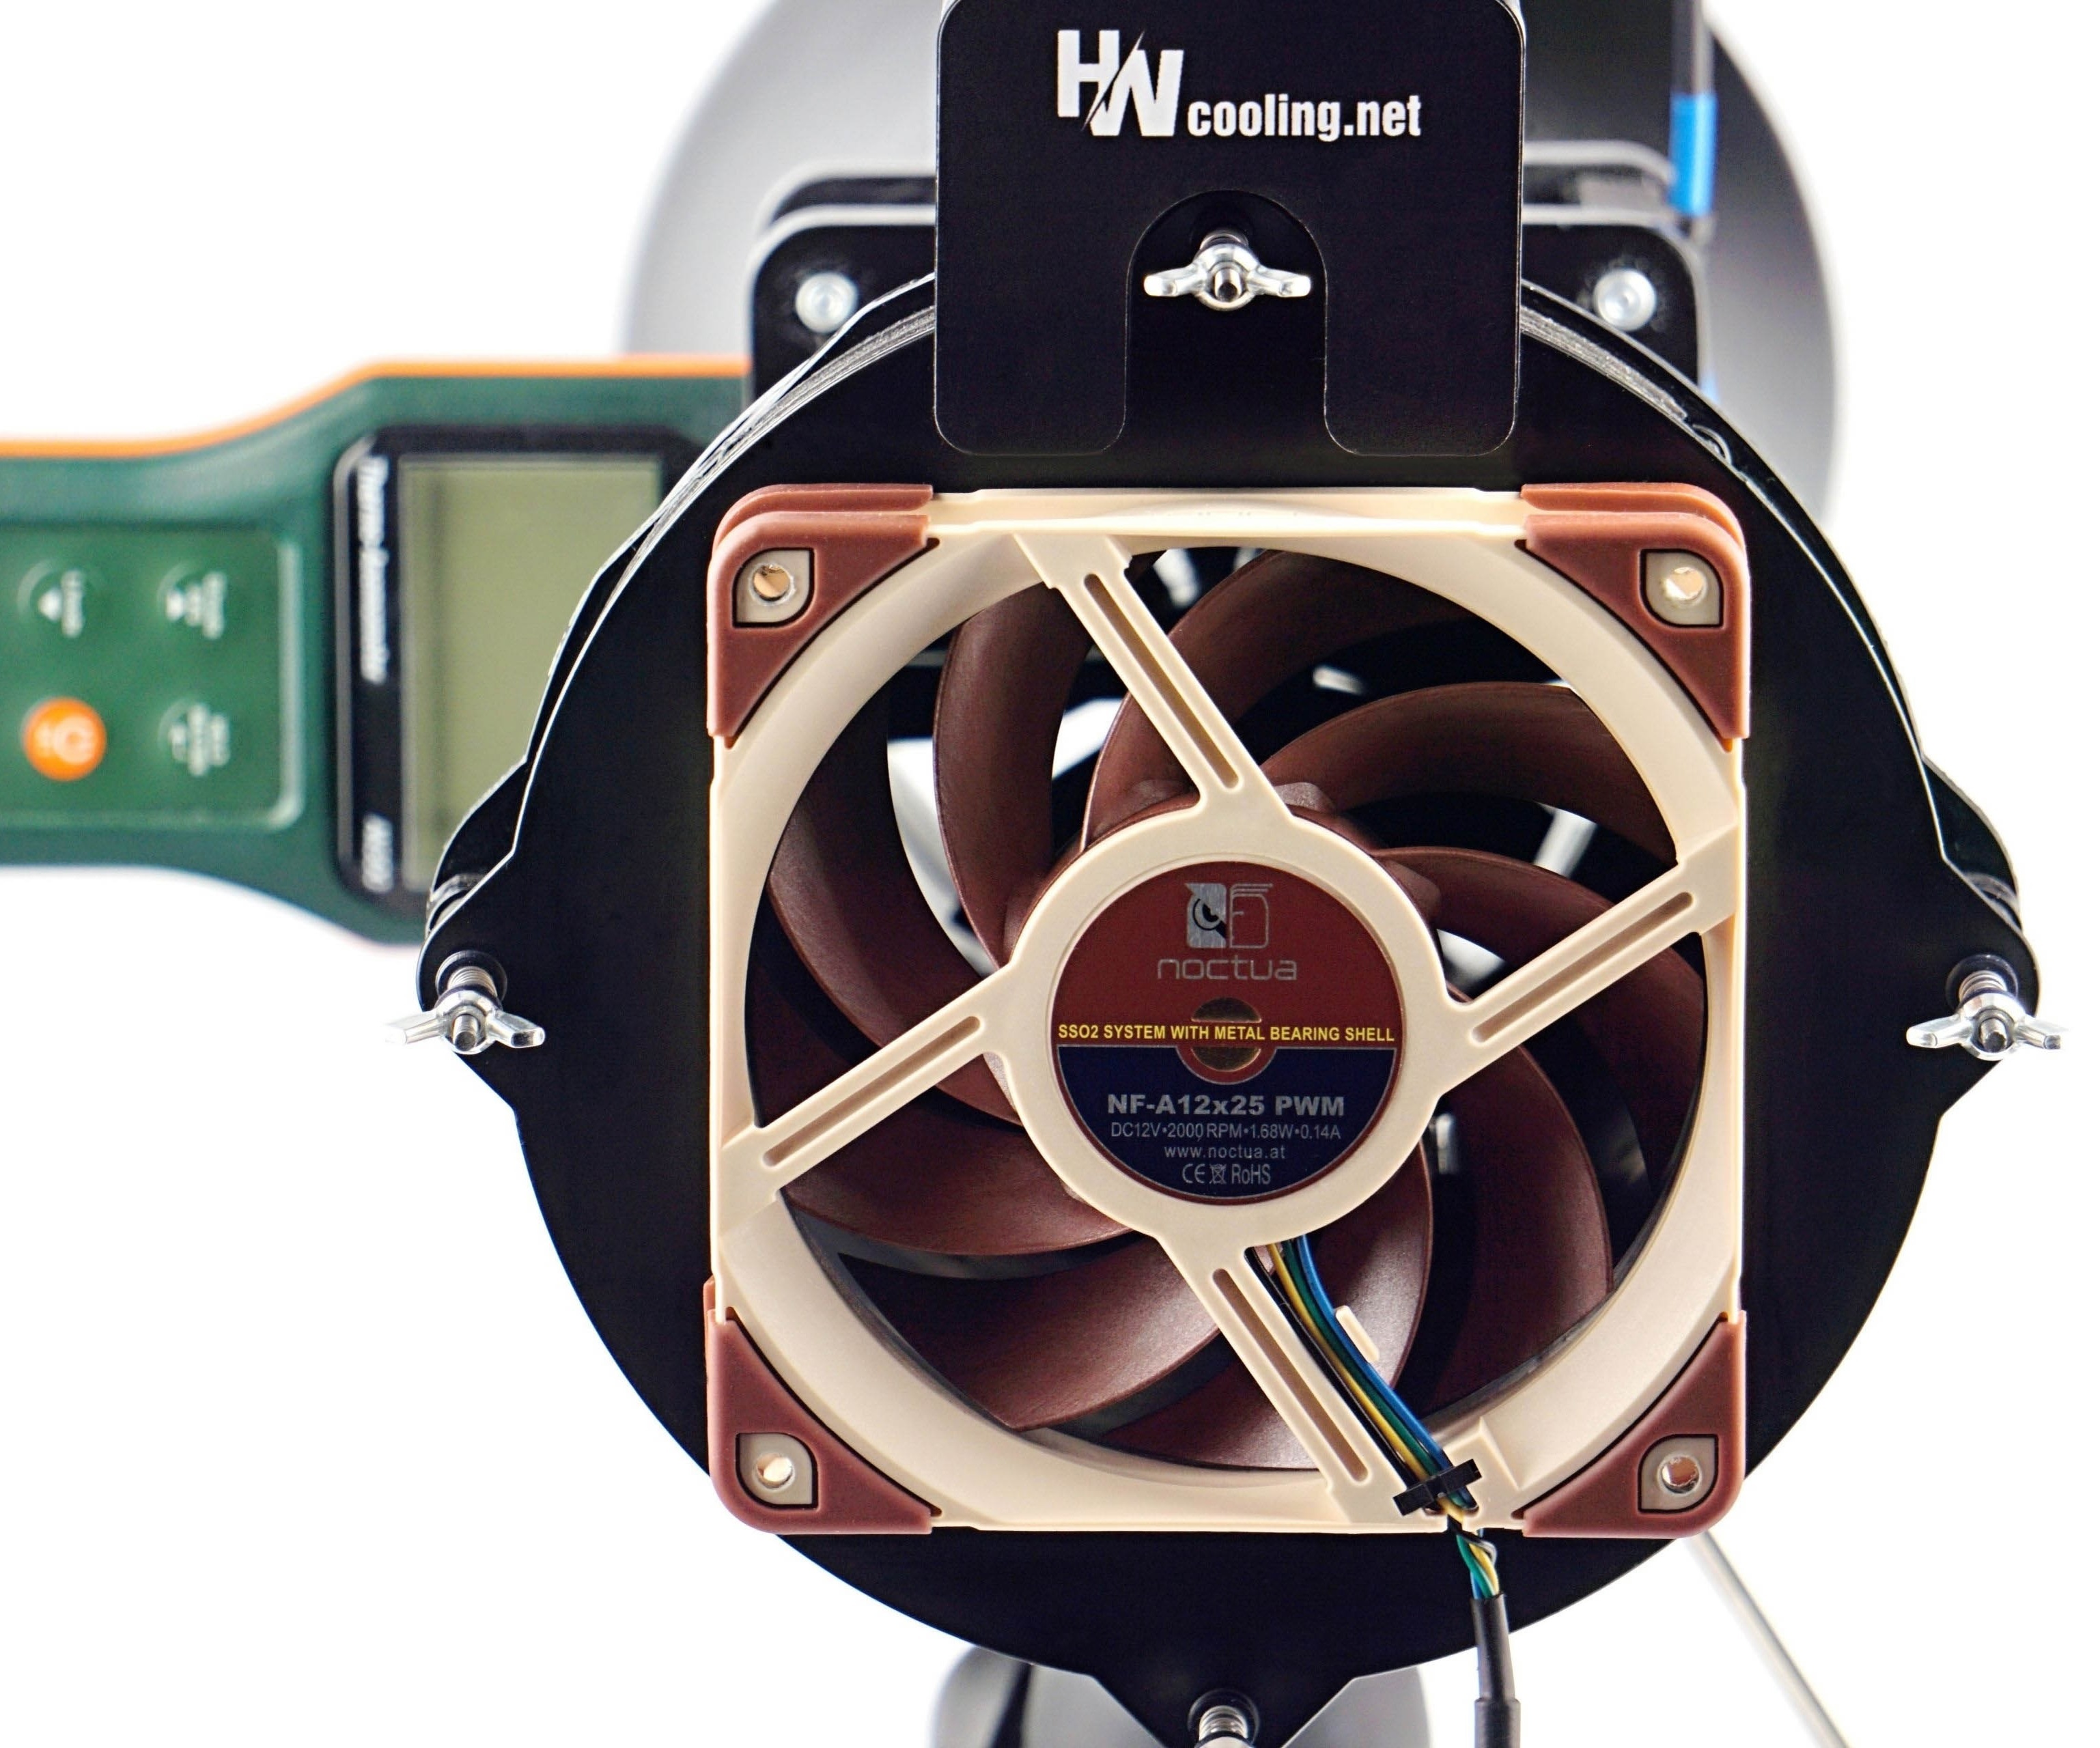
When the wind tunnel is not in use, it is enclosed in a dust-tight chamber. In addition to the technical equipment and its correct storage, it is also important for objective outputs that all measuring instruments are calibrated according to the standard. Without this, it would be impossible to stand behind your results and rely on the manufacturers’ specifications. Calibration protocols are therefore an important part of the methodology. Testing is carried out at an ambient air temperature of 21–21.3 °C, humidity is approximately 45 % (± 2 %).
Fans come to us for testing in at least two pieces of the same model. If the deviations of any of the measured values are greater than 5 %, we also work with a third or fourth sample and the average value is formed by the results of the fans that came out the most similar and the differences between them fit under 5 %.




Nice to see the 140mm fan reviews rolling!
Also, would it be possible to publish noise samples for your fan/cooler reviews? Preferably for all scenarios where you perform frequency analysis?
And they will continue to come, tests of 140 mm fans. But we probably won’t exaggerate it, so that they stay in a relevant ratio (according to the interest in whichever format in general) to 120 mm models.
Which noise samples do you mean? From spectrographs? Do you want that data for your own purposes, for your own analysis? If so, we can send you the noise levels at all frequencies in all tested scenarios almost immediately (e.g. by e-mail). We can certainly post them on the web somewhere, but it will take more time, as we will need to create a section for this somewhere. Making it make sense on the web will be more time-consuming and at the moment we are quite overloaded and it is hard to find space for extra activities. :/
Always looking forward to your fan reviews regardless of size!
For noise samples, I mean audio files so I can listen to them to make a subjective judgement. In reviews you often mention the differences in frequencies between obstacles/fan models etc. With audio files to listen to, it will be much more easy to understand the difference.
Maybe you can consider compiling the audio files for each fan and upload to YouTube as a video, for example, which perhaps take relatively little effort, though I am not sure if the audio quality is satisfactory. Anyway, it is only a suggestion so please decide on whether you think it is worth the effort or not.
I understand now, and I am also sorry that I am now likely to disappoint you.
Sound recordings are something I boycott against and the goal is to get more and more people to learn to read spectrograms. Sure, it’s more complicated, but we plan to publish materials to facilitate reading these charts. We will select a few fans that have the biggest differences in the frequency characteristic of the sound, make a sound recording of them, and put a spectrogram against it. On it we then explain which component of the sound represents what in the spectral analysis.
You know, I’m willing to sacrifice all my time for these things, but I have to see some meaning behind the results. And sound recordings don’t make sense to me because they can be extremely misleading. While the user thinks he’s hearing the fan, the sound system with the speaker on top is laughing at how they have been perfectly fooled. It is certainly not necessary to elaborate that the same recording sounds different on each speaker (it is determined by the frequency characteristics of the sound equipment of the end user), and this also with regard to the volume that the person sets. To judge something on the basis of the sound recording is therefore very inaccurate and misleading. I would probably suffer a lot when making them with my high demands on the relevance of things and at the same time it would reduce the relevance of spectrogram, which everyone sees the same way.
I believe that after this message you will not give up on our tests and sooner or later you will surely find out (also with the help of various auxiliary materials, which we plan to publish on this topic), that you understand everything perfectly also with the help of spectrograms. 🙂
Not disappointed at all, very satisfied with your answer. Looking forward to the articles explaining spectrograms, I’ll admit I never really understood how to interpret them.