


… and airflow
Blade length is always the “topic”, but will be more common with 140mm fans than smaller variants. Some bet on long blades for preference of selected features, the other manufacturer on short ones. And such (short) and overall more robust blades are also used by the 140mm Aorus fan. From certain points of view this is quite a big advantage, but for which something had to be sacrificed. It’s a quid pro quo.
… a prietoku vzduchu
… and airflow
With airflow measurements, we can well explain why the test tunnel is shaped the way it is. It doesn’t consist of two parts just so that the “exhaust” can be conveniently clogged for pressure measurements. The anemometer (i.e. the wind speed measuring instrument) is held together by two parts, two formations, through the flanges.
The front part, at the beginning of which the fan is mounted, becomes steadily narrower and from about two thirds of the way through the cross-section is smaller than that of a 120 mm fan. The reason for this is that the cross-section of the anemometer is always smaller than that of the fans tested. The taper towards the anemometer fan is as smooth as could be chosen and the tunnel walls are smooth. This has minimized the occurrence of unnatural turbulence.
The difference between the cross section at the intake (fan under test) and at the constriction point (anemometer) also means a difference in dynamic pressure, the principles of the Venturi effect apply here. In order to avoid distortion at this level and to ensure that the fan airflow is not different from what it actually is, the Bernoulli equation must be applied to the measured values (for maximum accuracy, the calculation also takes into account the internal cross-sectional area of the anemometer, i.e. its inactive part ). After all this, it is again possible to confront our results with the paper parameters.
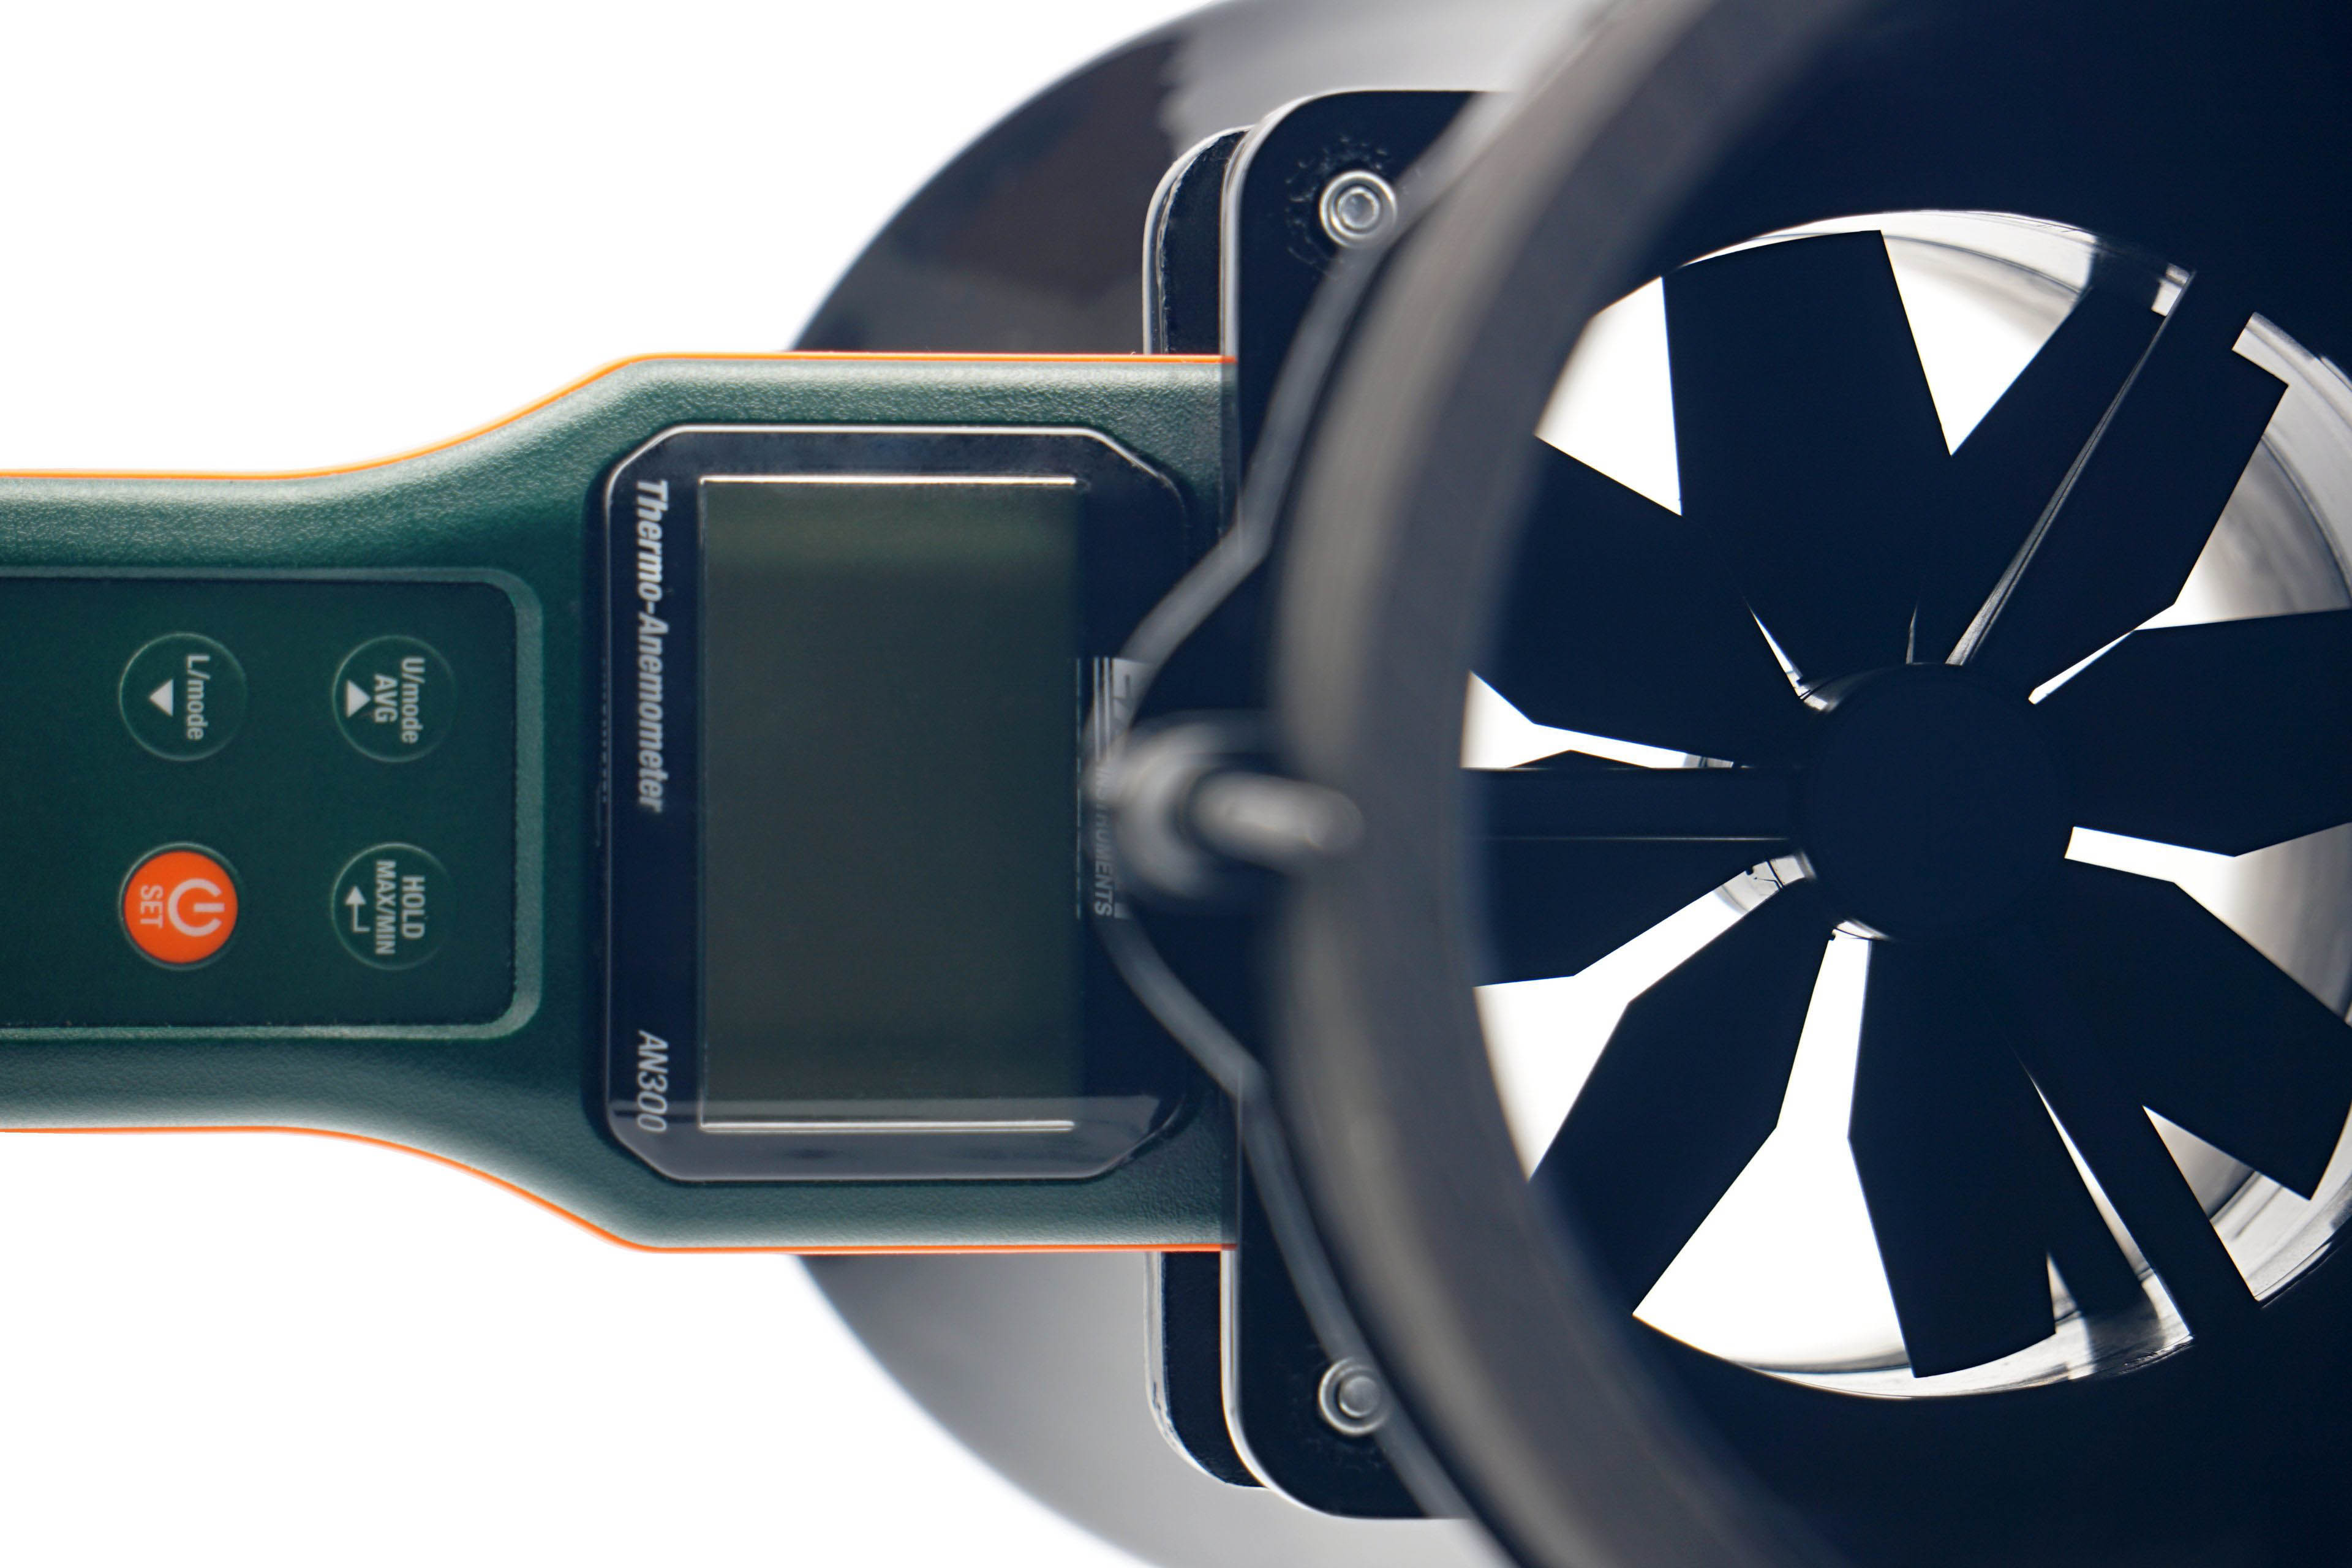
We use an Extech AN300 anemometer with a large 100 mm fan for the measurements. Its big advantage over other anemometers is that it is made for bidirectional sensing. This allows tests at different fan orientations. However, the “pull” position is more suitable or accurate for measurements, even though it may not seem so at first glance, but we’ll explain.
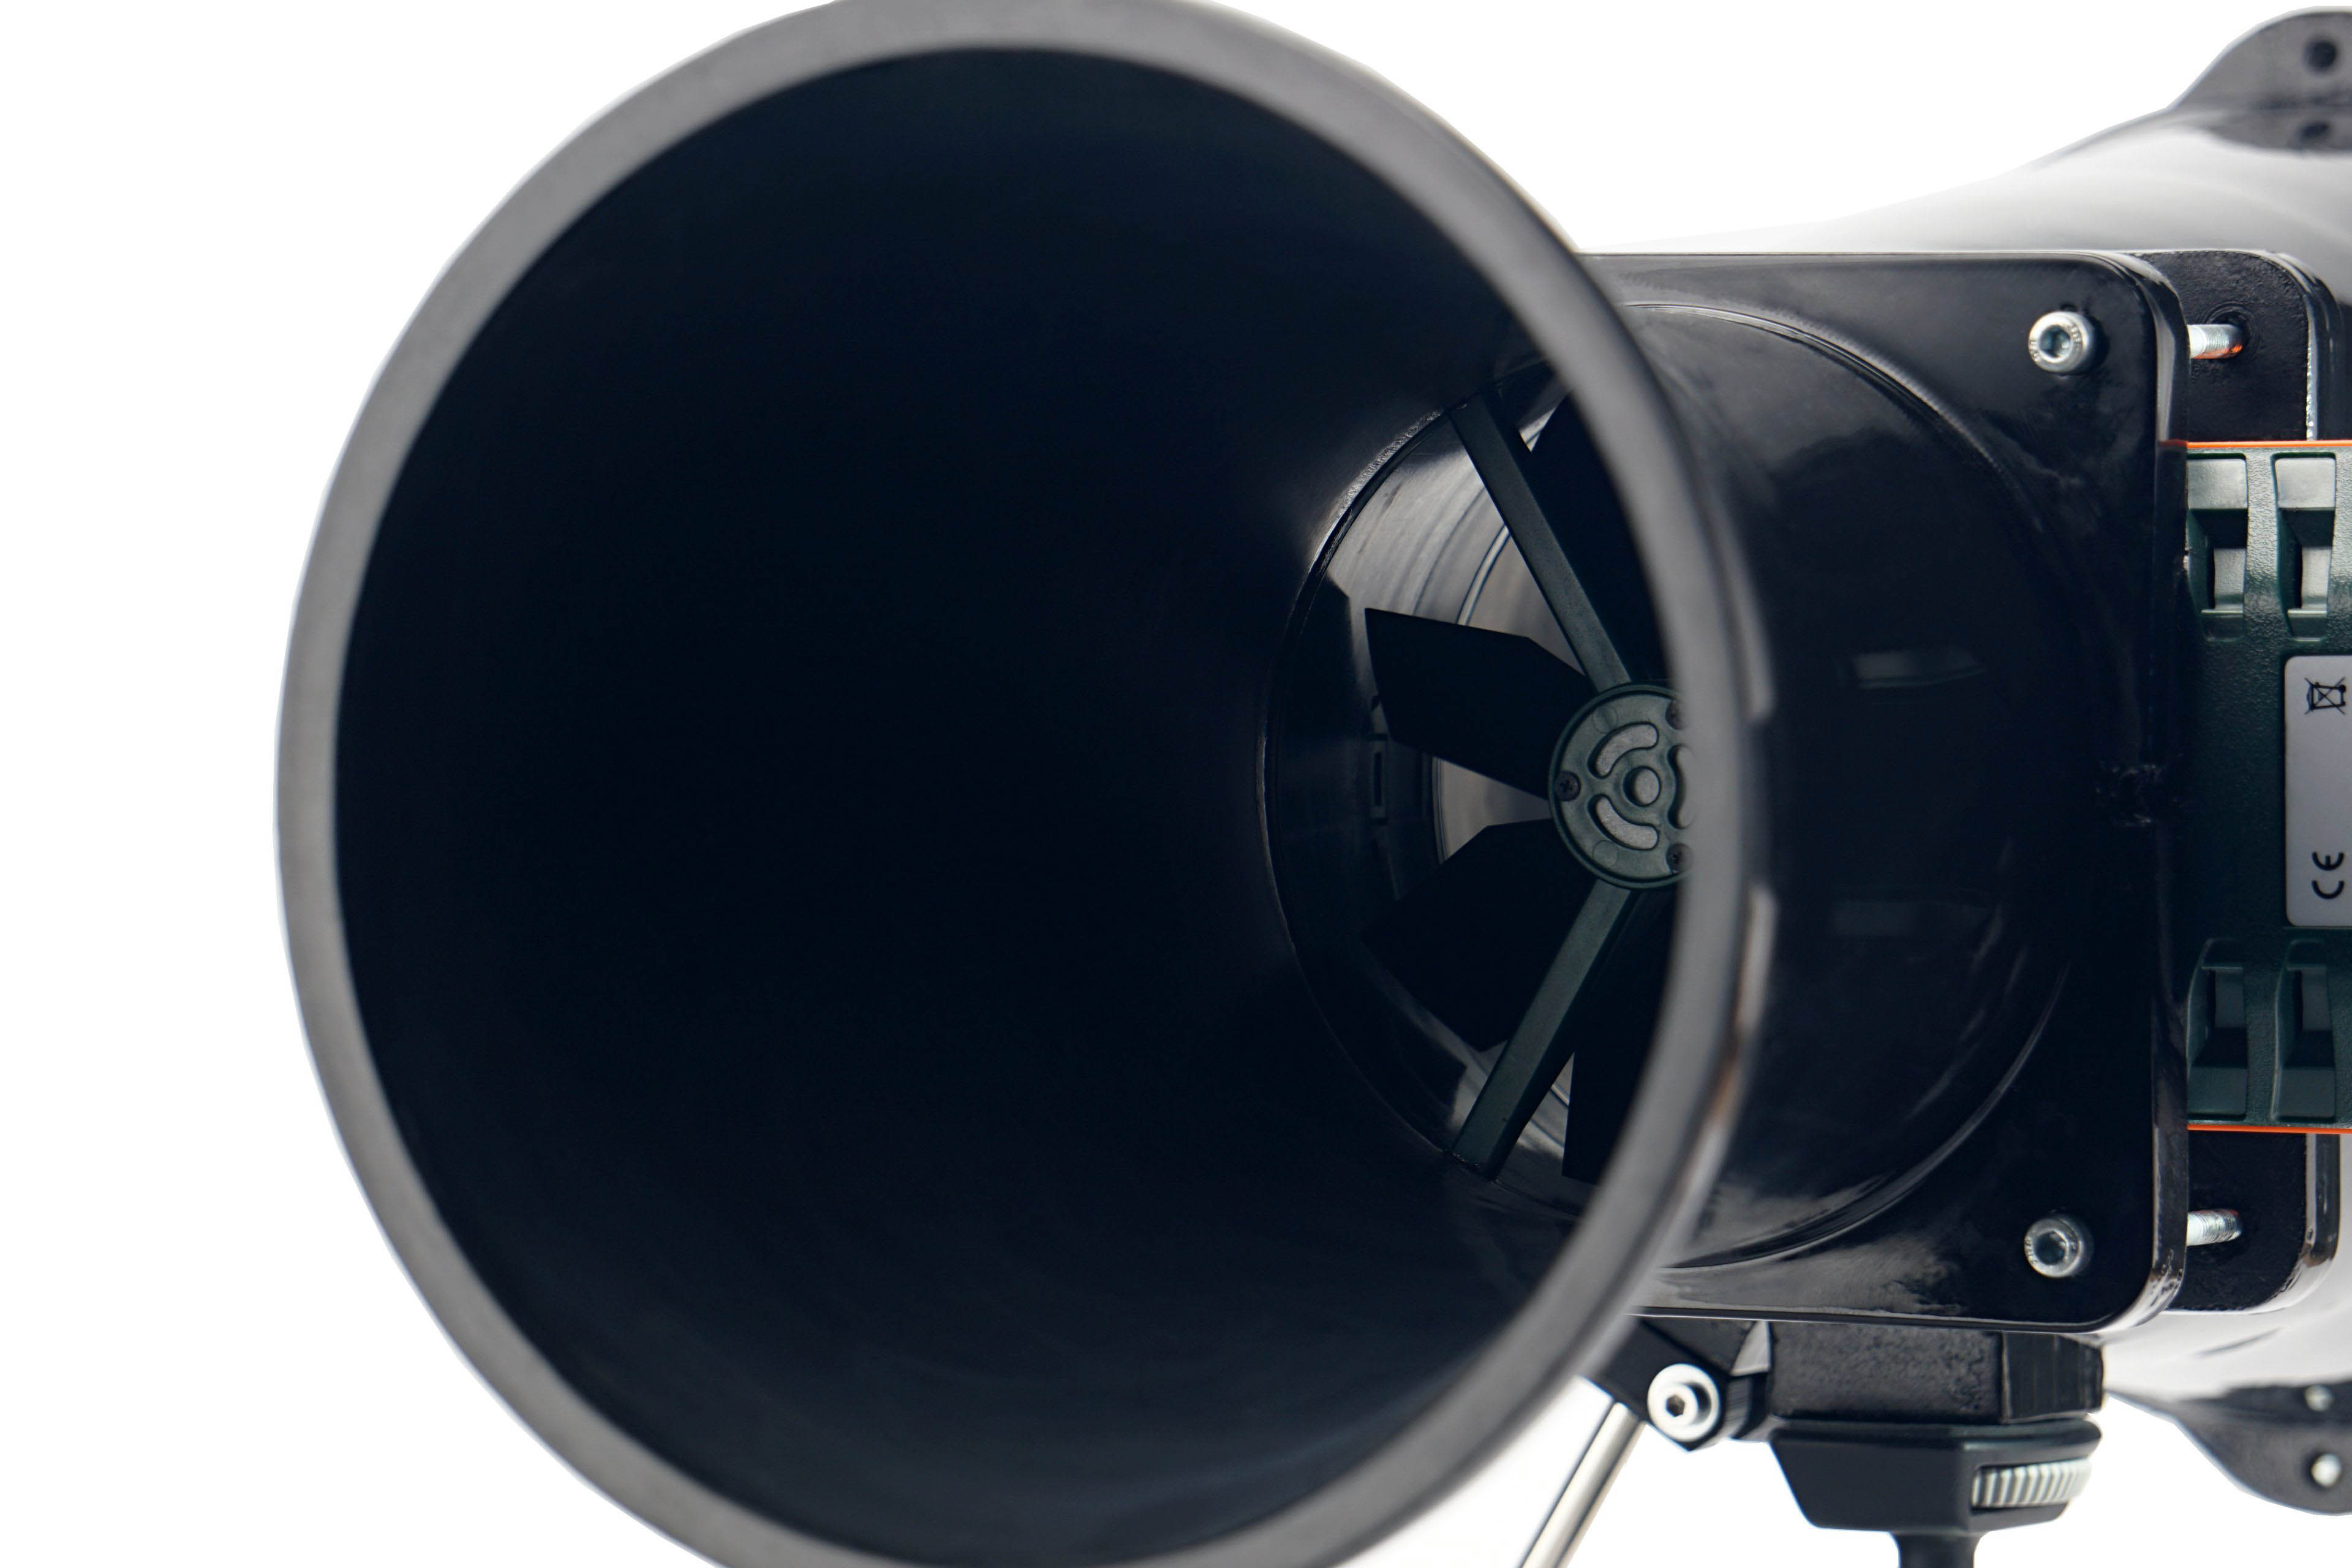
Here, we get to the second part of the tunnel, the part behind the anemometer. It is part of the whole device, mainly to allow a laminar flow of air to arrive at the rotor of the anemometer. Otherwise, uncontrolled side whirls would be reflected in the results, which are inconsistent with accurate measurements. Therefore, we will test the flow in the pull position. If anyone would like us to elaborate more on this topic, we can elaborate further at any time in the discussion below the article. Ask away. 🙂
In regard to the anemometer, we shall return for a bit to noise measurements and to setting modes according to fixed noise levels. It may have occurred to you as you were reading that the anemometer fan is also a source of sound that needs to be filtered out when measuring fans. For this reason, we insert a securing pad between the frame and the anemometer fan before each measurement and mode setting according to the fixed noise level. This, by the way, also holds the anemometer fan during static pressure measurements.
- Contents
- Gigabyte Aorus 140 ARGB in detail
- Basis of the methodology, the wind tunnel
- Mounting and vibration measurement
- Initial warm-up and speed recording
- Base 6 equal noise levels…
- ... and sound color (frequency characteristic)
- Static pressure measurement…
- … and airflow
- Everything changes with obstacles
- How we measure power draw and motor power
- Measuring the intensity (and power draw) of lighting
- Results: Speed
- Results: Airlow w/o obstacles
- Results: Airflow through a nylon filter
- Results: Airflow through a plastic filter
- Results: Airflow through a hexagonal grille
- Results: Airflow through a thinner radiator
- Results: Airflow through a thicker radiator
- Results: Static pressure w/o obstacles
- Results: Static pressure through a nylon filter
- Results: Static pressure through a plastic filter
- Results: Static pressure through a hexagonal grille
- Results: Static pressure through a thinner radiator
- Results: Static pressure through a thicker radiator
- Results: Static pressure, efficiency by orientation
- Reality vs. specifications
- Results: Frequency response of sound w/o obstacles
- Results: Frequency response of sound with a dust filter
- Results: Frequency response of sound with a hexagonal grille
- Results: Frequency response of sound with a radiator
- Results: Vibration, in total (3D vector length)
- Results: Vibration, X-axis
- Results: Vibration, Y-axis
- Results: Vibration, Z-axis
- Results: Power draw (and motor power)
- Results: Cooling performance per watt, airflow
- Results: Cooling performance per watt, static pressure
- Airflow per euro
- Static pressure per euro
- Results: Lighting – LED luminance and power draw
- Results: LED to motor power draw ratio
- Evaluation


Nice to see the 140mm fan reviews rolling!
Also, would it be possible to publish noise samples for your fan/cooler reviews? Preferably for all scenarios where you perform frequency analysis?
And they will continue to come, tests of 140 mm fans. But we probably won’t exaggerate it, so that they stay in a relevant ratio (according to the interest in whichever format in general) to 120 mm models.
Which noise samples do you mean? From spectrographs? Do you want that data for your own purposes, for your own analysis? If so, we can send you the noise levels at all frequencies in all tested scenarios almost immediately (e.g. by e-mail). We can certainly post them on the web somewhere, but it will take more time, as we will need to create a section for this somewhere. Making it make sense on the web will be more time-consuming and at the moment we are quite overloaded and it is hard to find space for extra activities. :/
Always looking forward to your fan reviews regardless of size!
For noise samples, I mean audio files so I can listen to them to make a subjective judgement. In reviews you often mention the differences in frequencies between obstacles/fan models etc. With audio files to listen to, it will be much more easy to understand the difference.
Maybe you can consider compiling the audio files for each fan and upload to YouTube as a video, for example, which perhaps take relatively little effort, though I am not sure if the audio quality is satisfactory. Anyway, it is only a suggestion so please decide on whether you think it is worth the effort or not.
I understand now, and I am also sorry that I am now likely to disappoint you.
Sound recordings are something I boycott against and the goal is to get more and more people to learn to read spectrograms. Sure, it’s more complicated, but we plan to publish materials to facilitate reading these charts. We will select a few fans that have the biggest differences in the frequency characteristic of the sound, make a sound recording of them, and put a spectrogram against it. On it we then explain which component of the sound represents what in the spectral analysis.
You know, I’m willing to sacrifice all my time for these things, but I have to see some meaning behind the results. And sound recordings don’t make sense to me because they can be extremely misleading. While the user thinks he’s hearing the fan, the sound system with the speaker on top is laughing at how they have been perfectly fooled. It is certainly not necessary to elaborate that the same recording sounds different on each speaker (it is determined by the frequency characteristics of the sound equipment of the end user), and this also with regard to the volume that the person sets. To judge something on the basis of the sound recording is therefore very inaccurate and misleading. I would probably suffer a lot when making them with my high demands on the relevance of things and at the same time it would reduce the relevance of spectrogram, which everyone sees the same way.
I believe that after this message you will not give up on our tests and sooner or later you will surely find out (also with the help of various auxiliary materials, which we plan to publish on this topic), that you understand everything perfectly also with the help of spectrograms. 🙂
Not disappointed at all, very satisfied with your answer. Looking forward to the articles explaining spectrograms, I’ll admit I never really understood how to interpret them.