


Initial warm-up and speed recording
The introduction to this article has been rewritten several times. The original versions resorted to describing the adverse events that caused the long-announced fan testing to be so dramatically delayed. But the text was always dreadfully boring… the important thing is that everything managed to make it to the start. But before the starting gun, come take a thorough walk around the track where the measurements will take place.
Initial warm-up…
Before we even start measuring anything, we let the fans run “idle” for a few minutes after plugging them in. This is because immediately after a cold start the fans reach different parameters than after a certain amount of short-term operation.
Until the operating temperature of the lubricant is stabilized, a typically lower maximum performance is achieved. This is because at lower temperatures the lubricant is denser, which is associated with higher friction. Therefore, the fans do not reach maximum speed immediately, but only after the first few seconds. Before the first measurements, we therefore leave the fans running for at least 300 seconds at 12 V, or 100 % PWM intensity.
…and speed recording
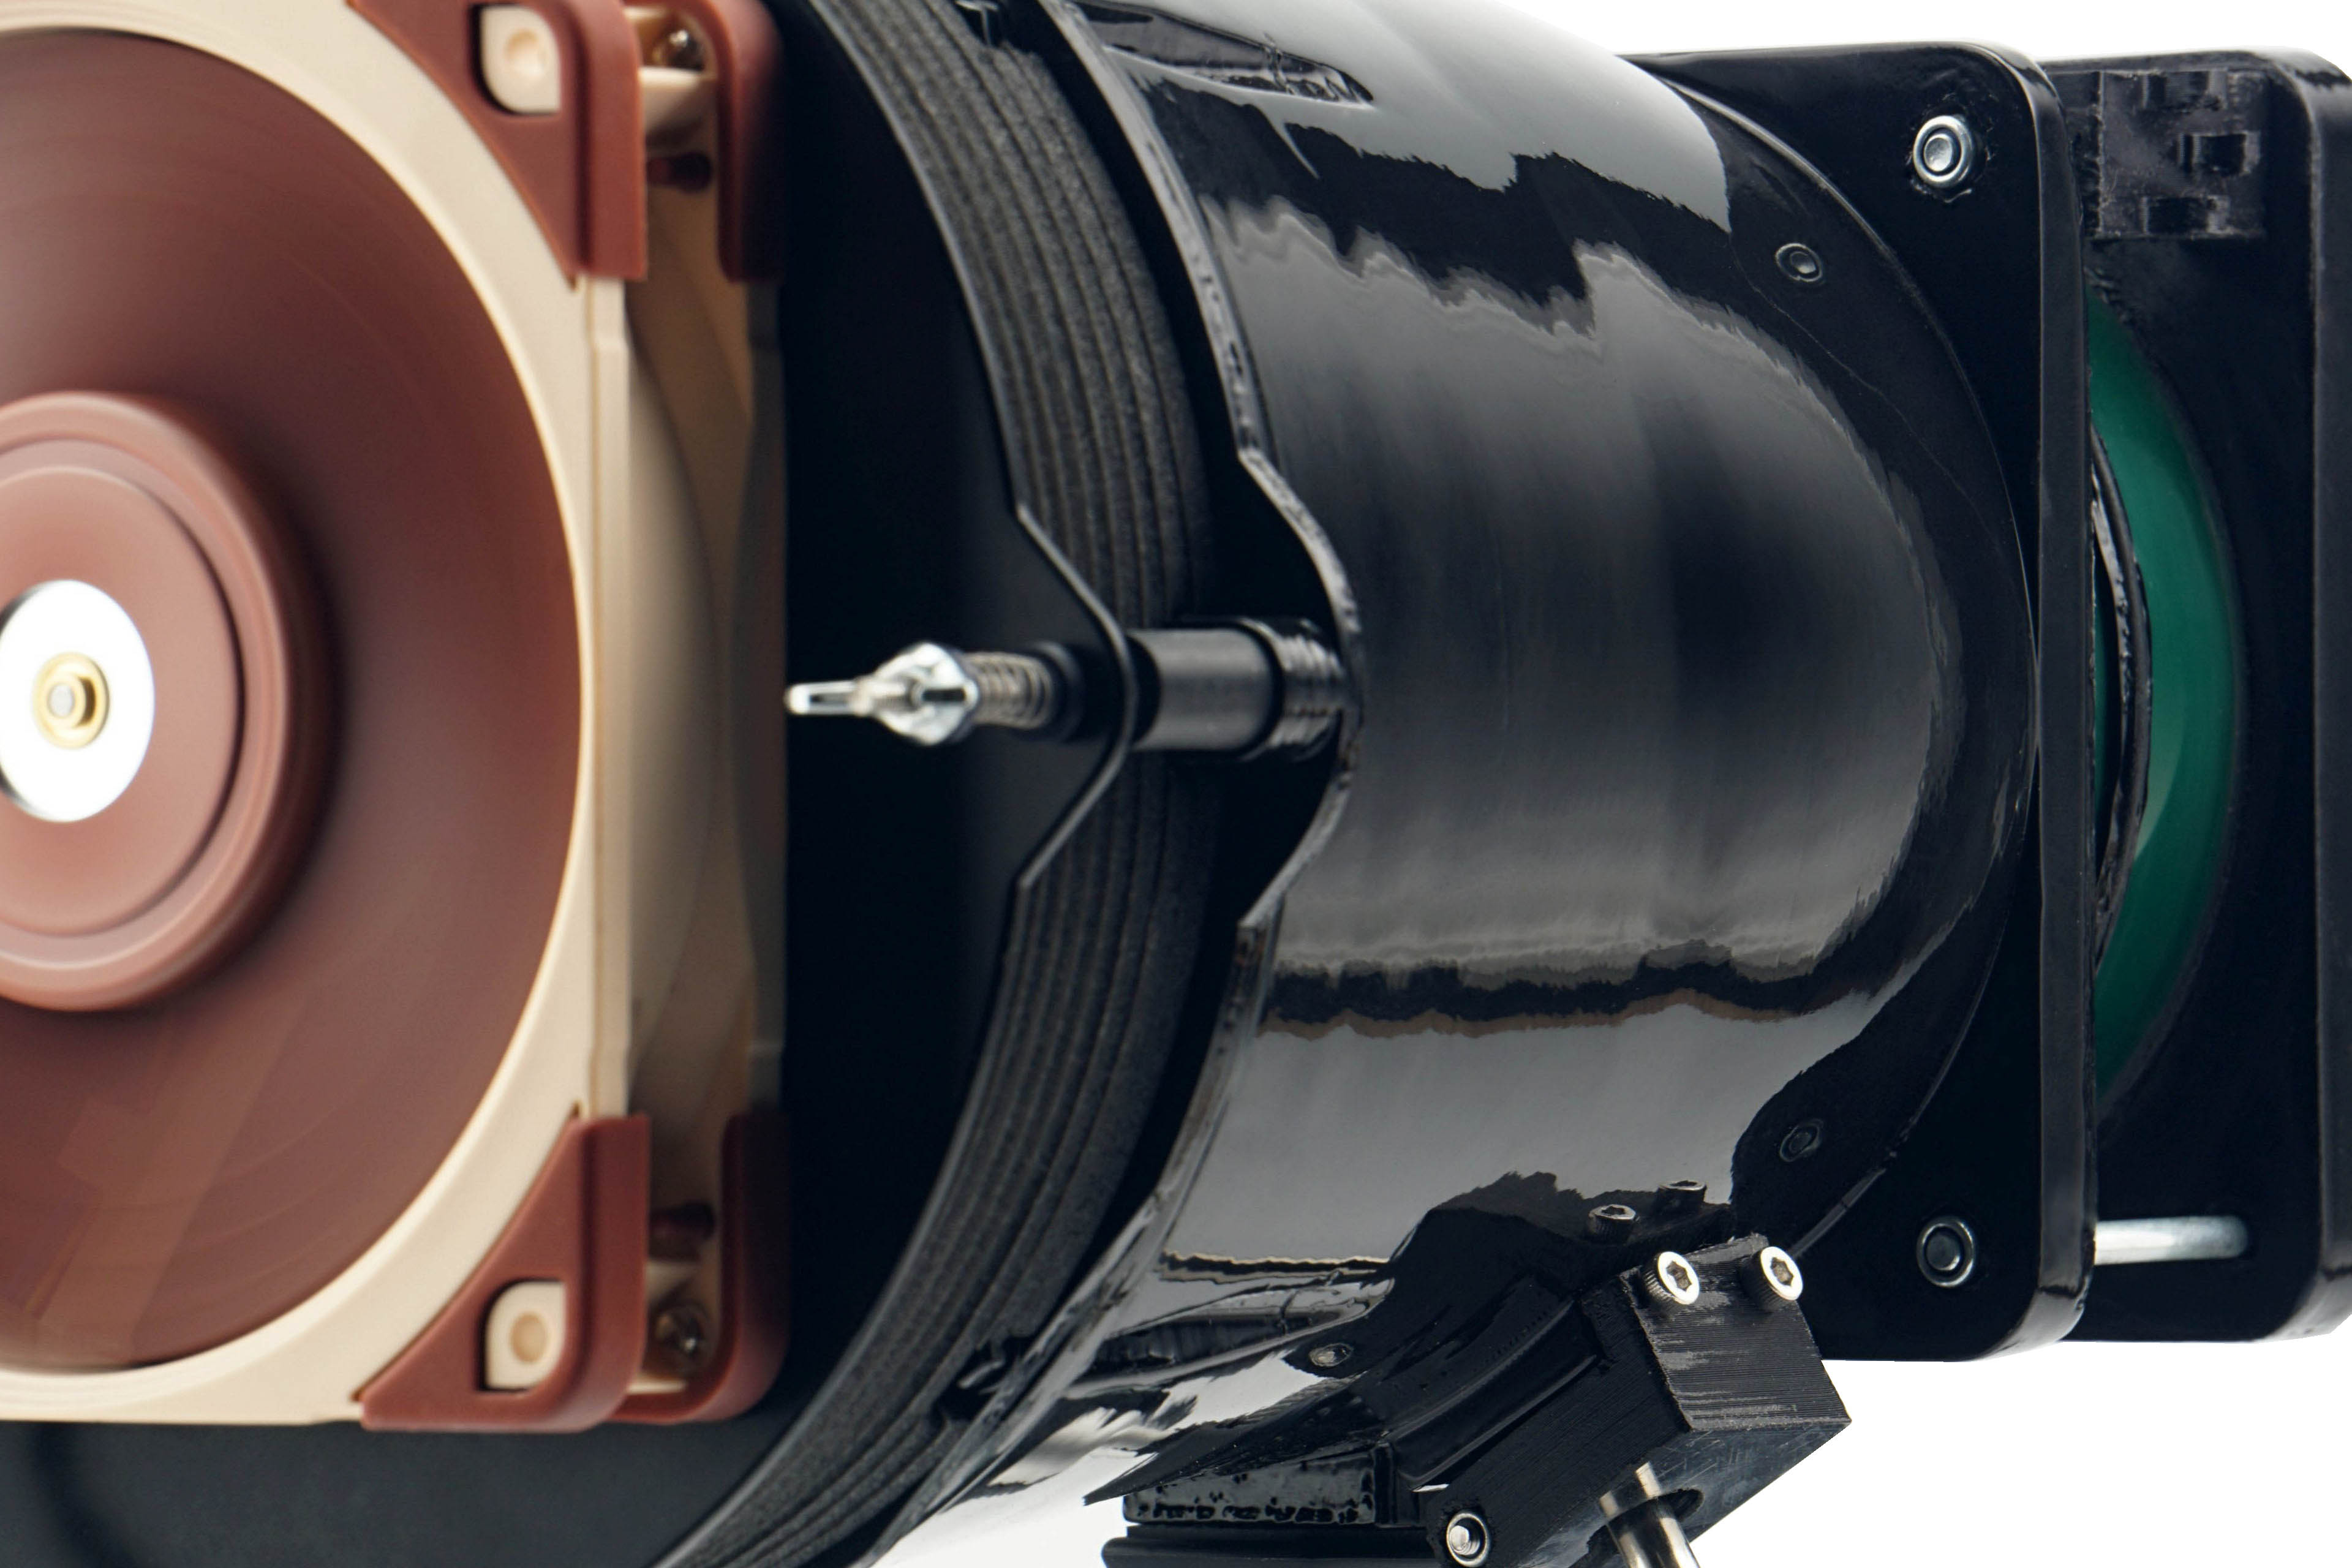
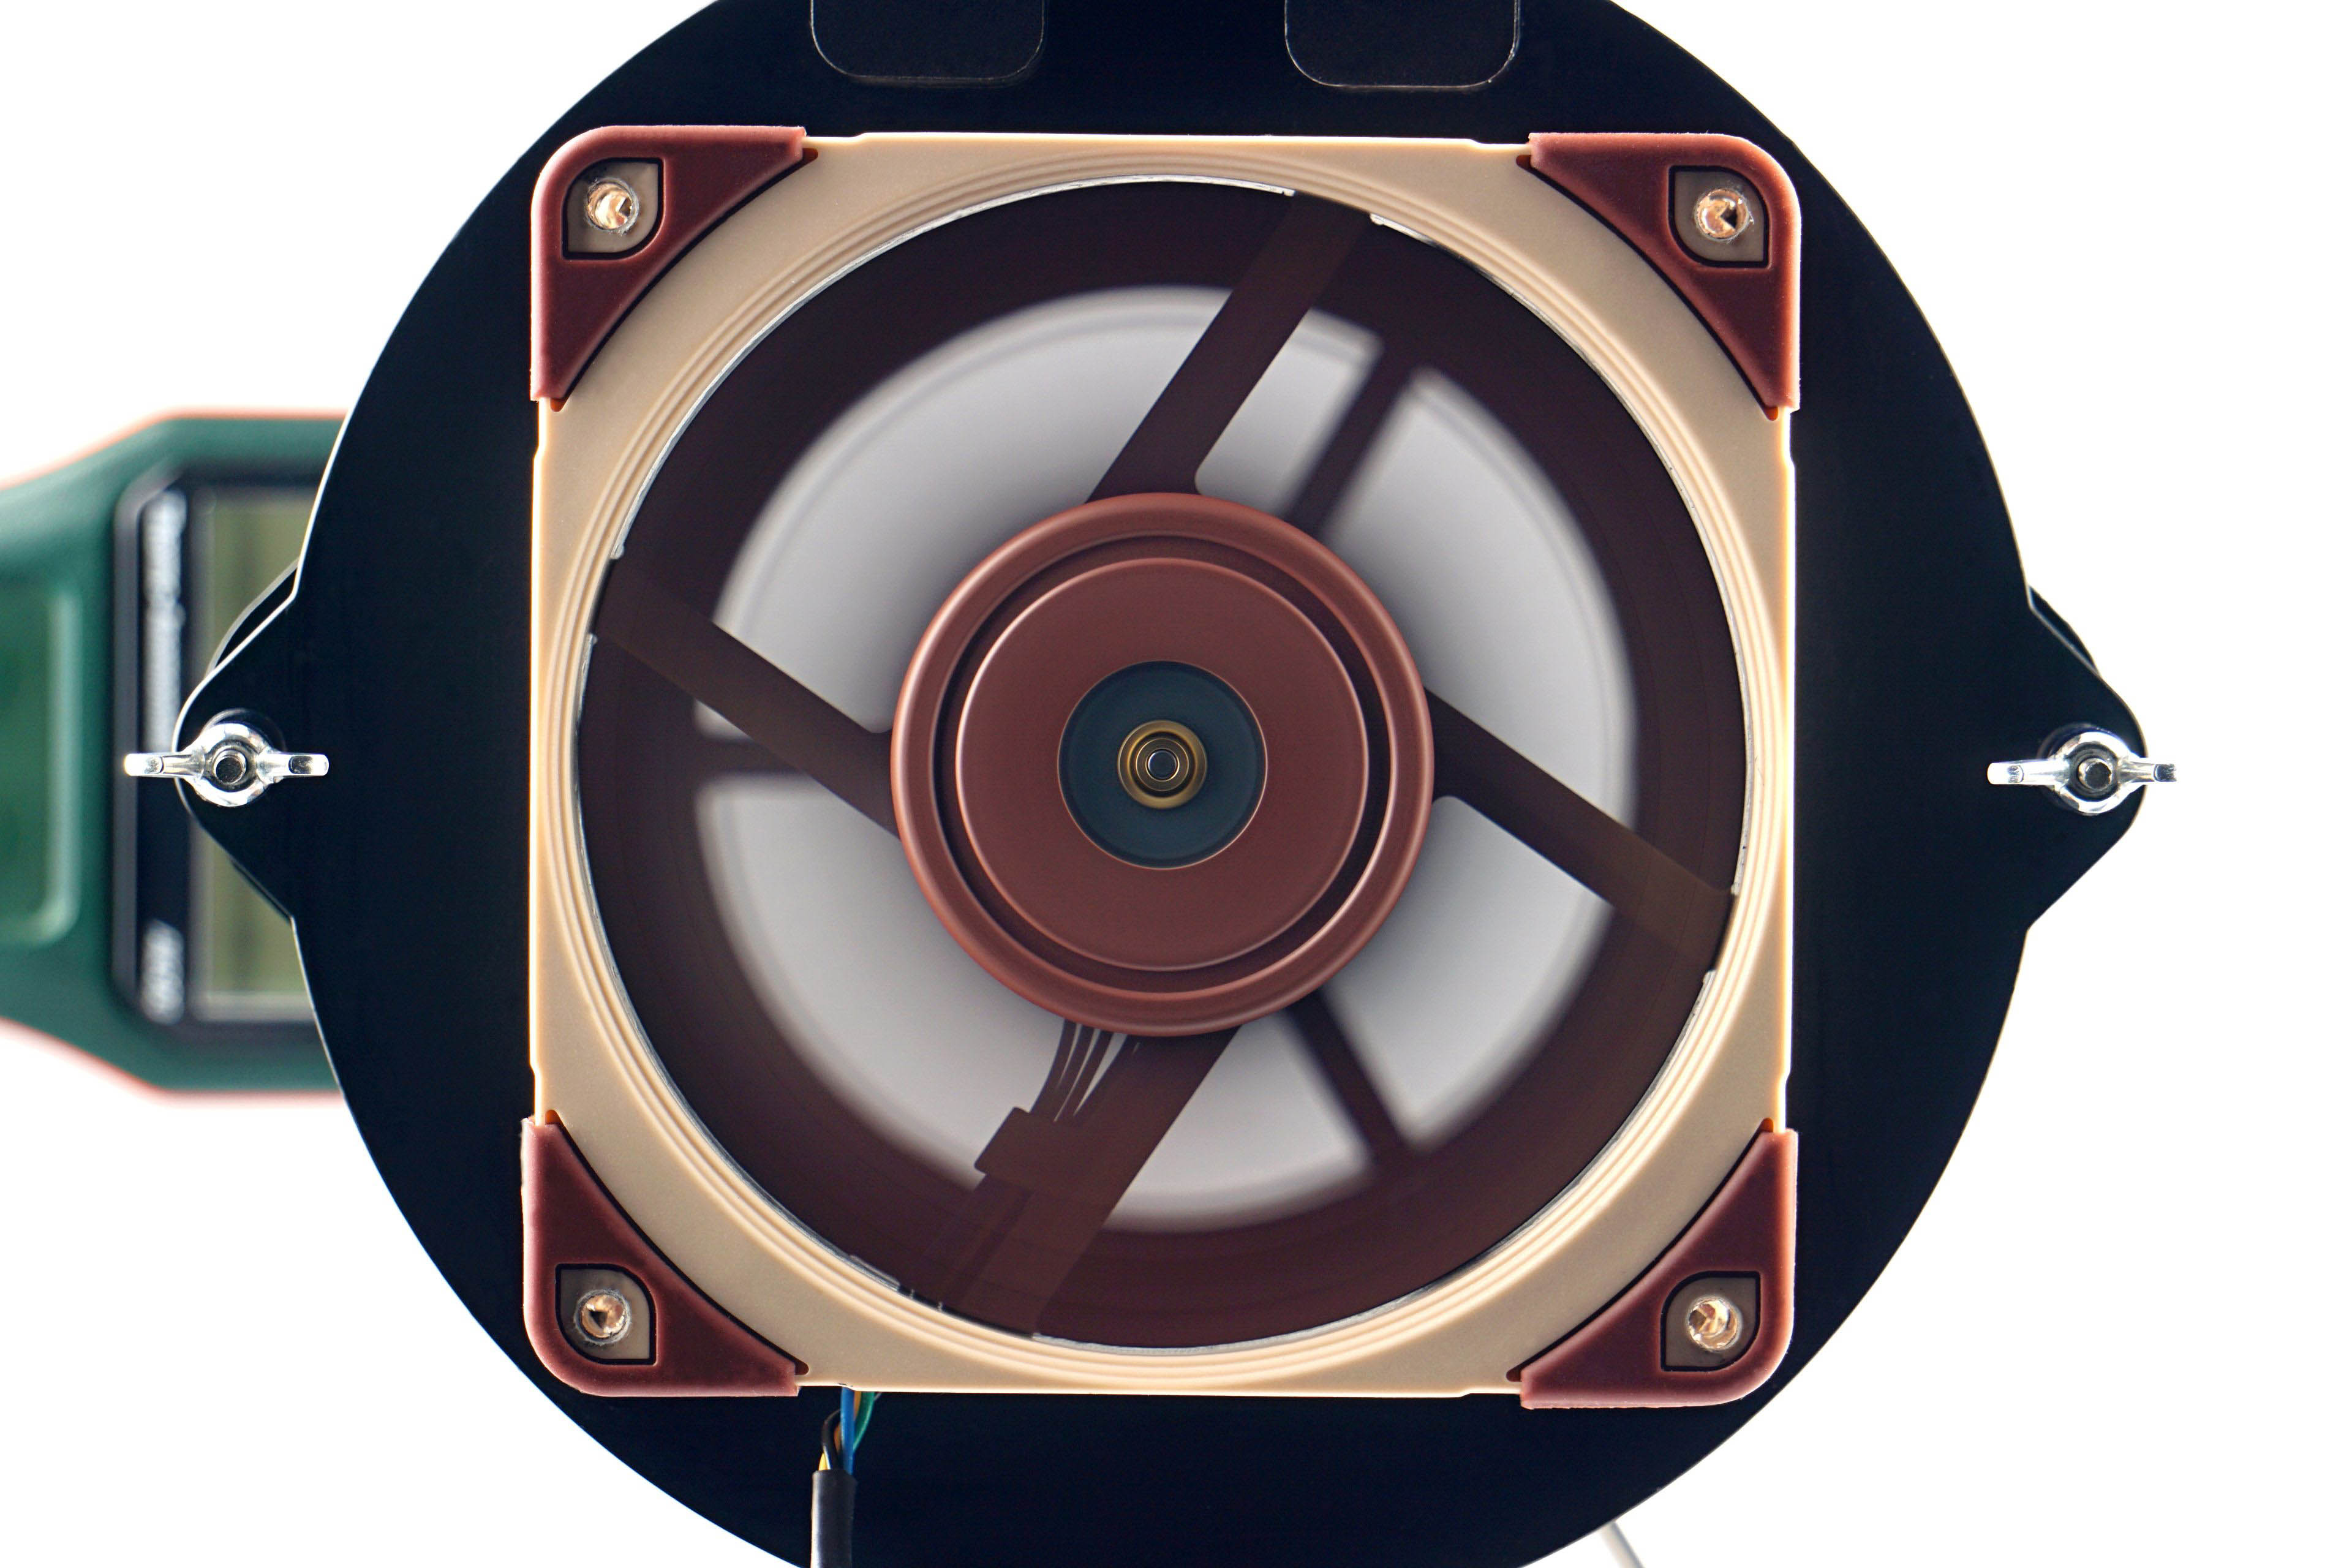
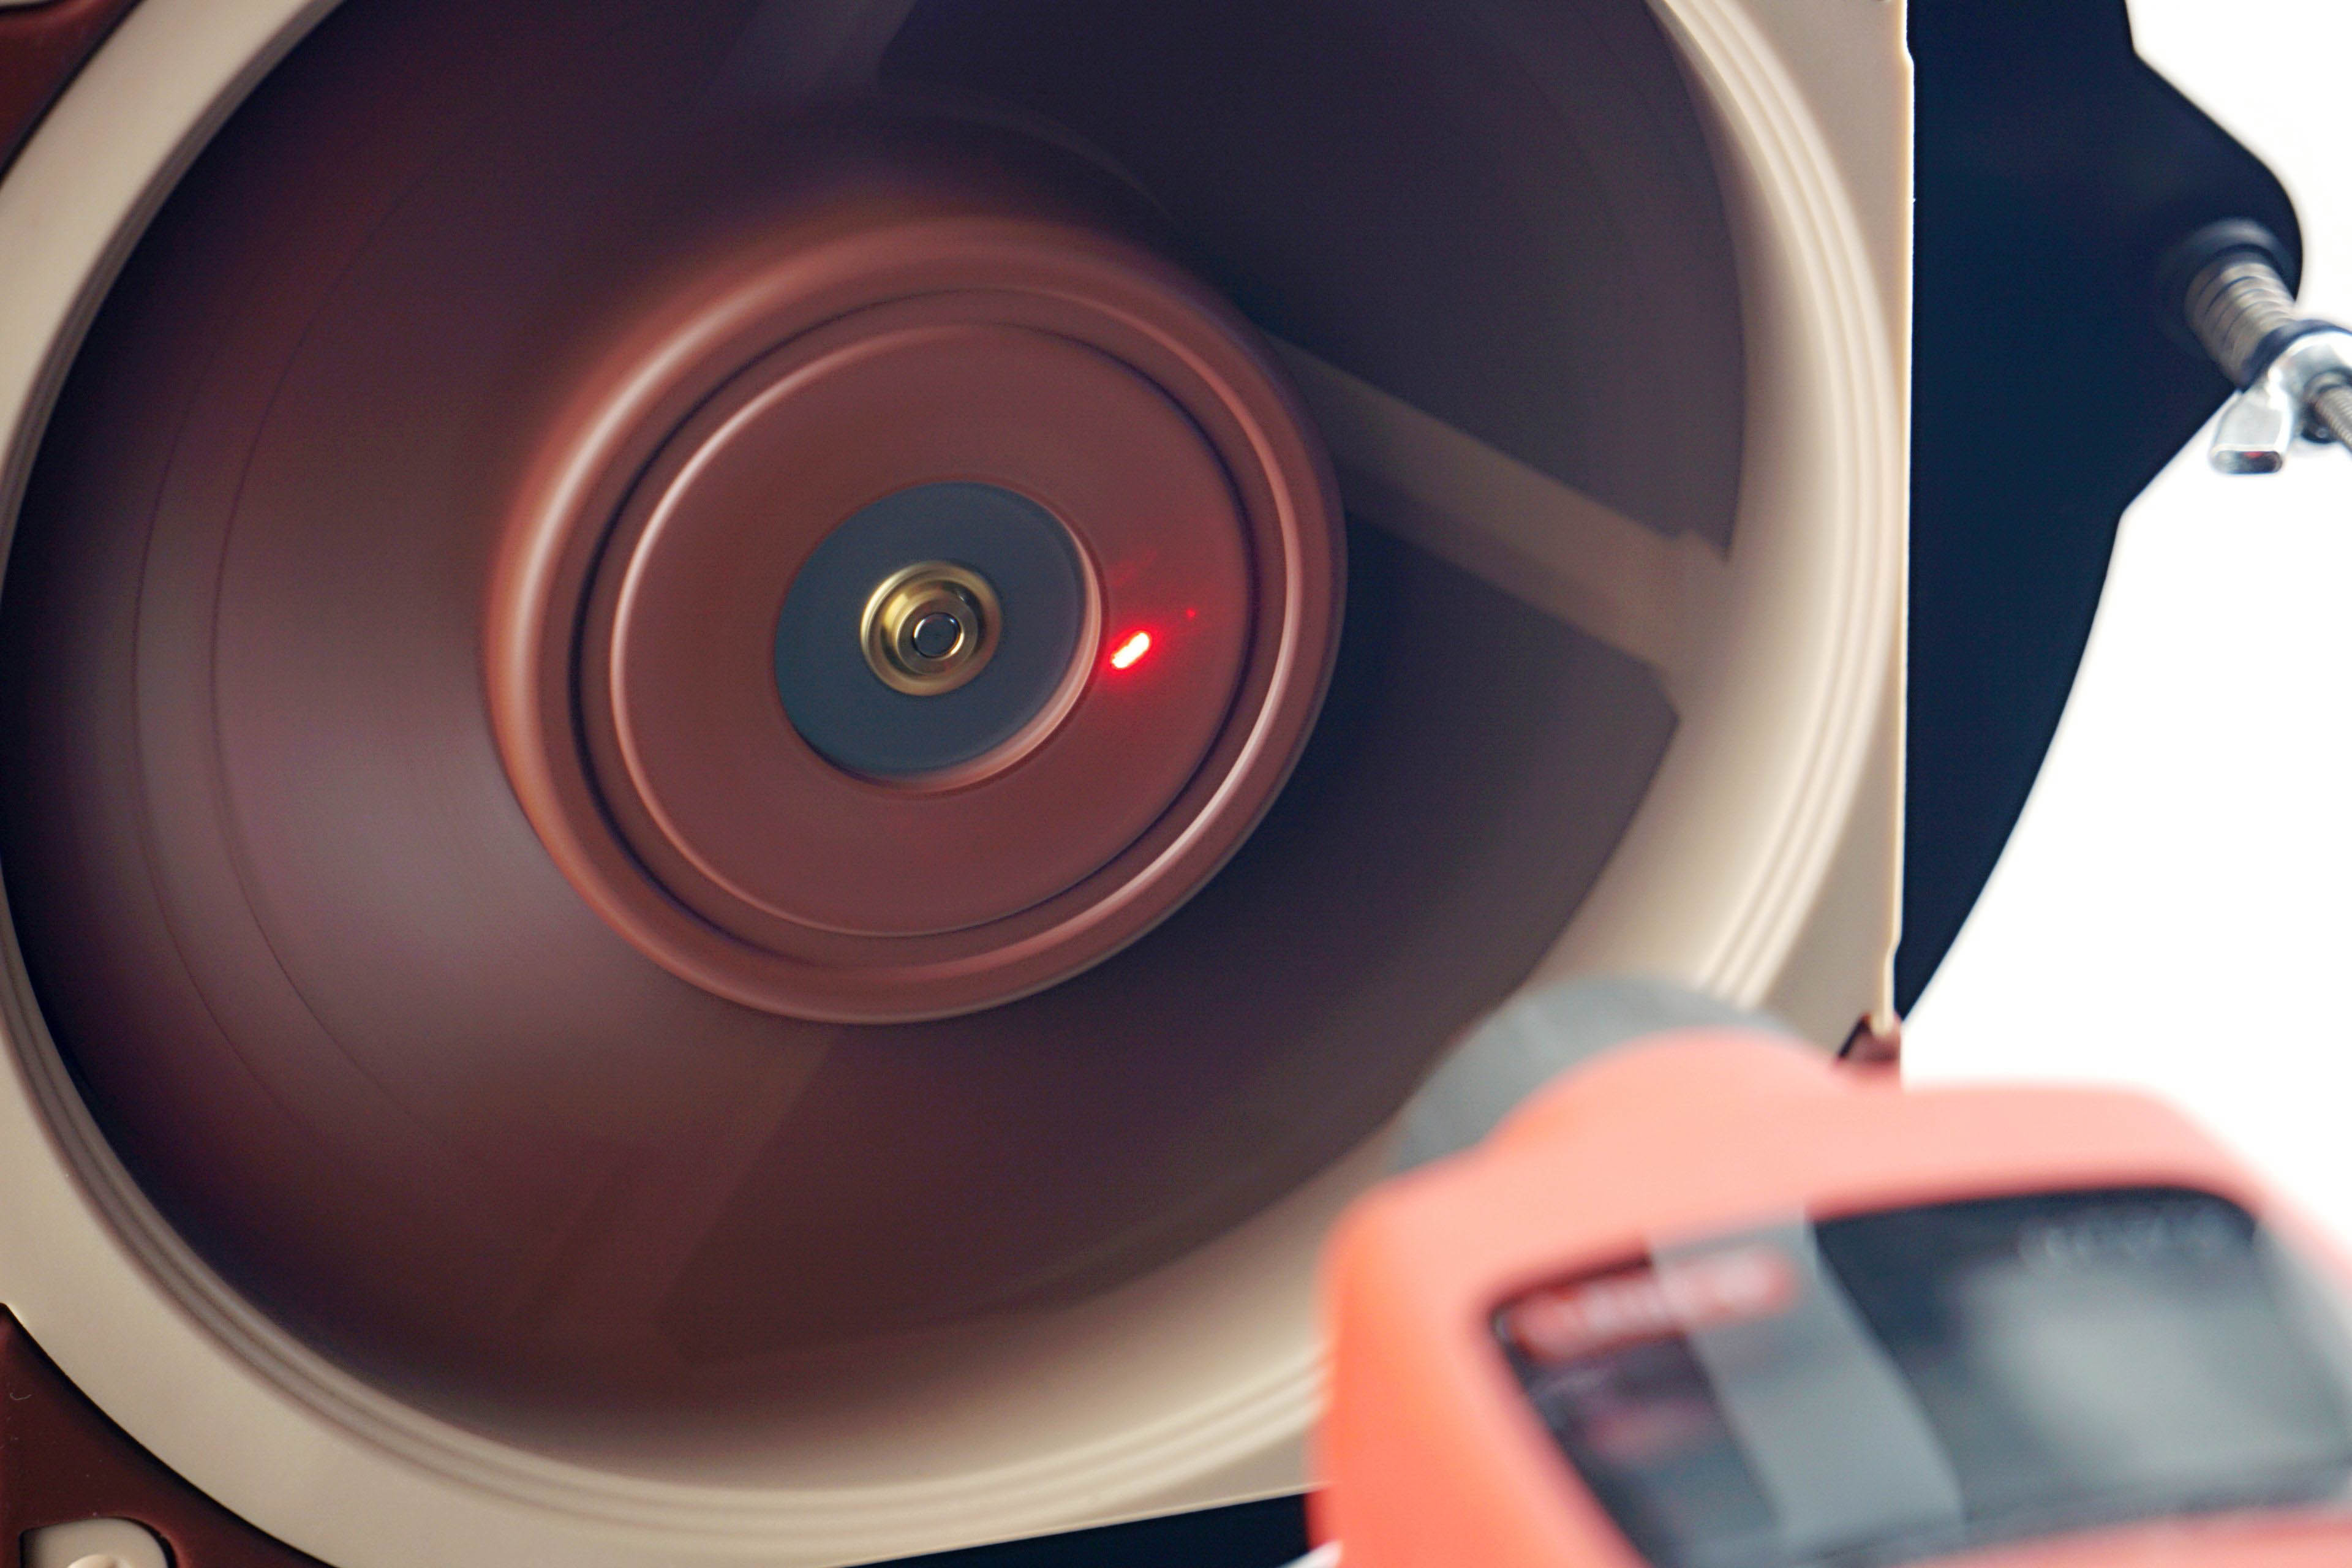
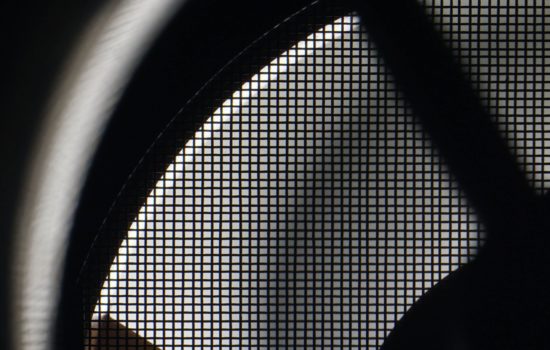
The speed of the fans is monitored using a laser tachometer, which reads the number of revolutions from a reflective sticker on the rotor. For this purpose, we use the UNI-T UT372 device, which also allows real-time averaging of samples. Thus, we do not record the peak value in the graphs, but the average speed value from a 30-second time period.
However, the speed itself is a relatively unimportant parameter that is often given more attention than is appropriate. This is the case even in many fan or cooler tests, where speed is used to normalize the different modes in which other variables are measured.
However, hyper-focusing on a specific speed is a rather unfortunate decision if only because the fans don’t gain any commonality. At the same speed all other variables are different, there is no intersection. It can be noted that a better normalization would have been by any other variable, whether it be static pressure, flow or noise level, which wins in our case. But more on that in the next chapter.
We only measure the speed so that you can associate a particular parameter (such as the amount of static pressure or some noise level) with something according to which you can adjust the fan yourself. Perhaps for that alone, the information about the achieved speed is useful. As part of the fan analysis, we will also indicate what the fans’ starting and minimum speeds are. Start-up speeds tend to be higher than minimum speeds because more force is required to get the rotor moving than once the fan rotor is spinning, and a minimum power intensity is sought at which the fan does not stall.
- Contents
- Introduction to fan testing
- Basis of methodology, the wind tunnel
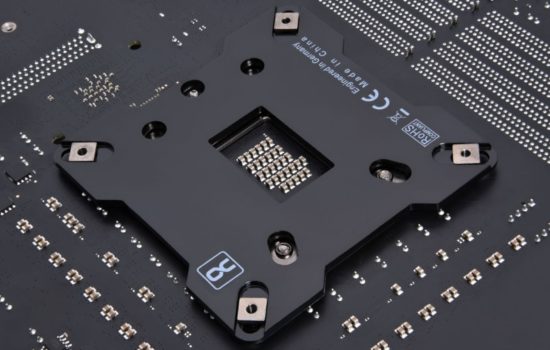
- Mounting and vibration measurement
- Initial warm-up and speed recording
- Base 7 equal noise levels...
- ... and sound color (frequency characteristic)
- Static pressure measurement…
- ... and airflow
- Everything changes with obstacles
- How we measure power draw and motor power
- Measuring the intensity (and power draw) of lighting
- Eight “basics” to start off…


Have you tried PWM controllers other than the Noctua NA-FC1? Does the NA-FC1 offer some advantages over other (often much cheaper) controllers?
We tried our own solution, our own PWM controller. But it was rather clumsy and the only disadvantage of NA-FC1 is that it is not possible to read a numeric value from it. And maybe the fact that it has a narrower rotation range. As long as it is powered by a laboratory power supply, it does not reduce the sensitivity of the exact setting (and what needs to be set can always be fine-tuned in units of mV on the power supply). I have no experience with other off-the-shelf PWM controllers, nor did I know there were any. All PC speed controllers I have used in the past only supported DC control. I have probably the most experience with Scythe Kaze Master Pro and Lamptron Touch. 🙂
Hi,
Could you please clarify the flow in the pull position?
I’m referring to measuring the airflow in a pull fan configuration.
Yes, thanks for asking. Schematically this is the model:
The airflow guide is on the opposite side of the tested fan. This design is the result of several years of research in which we compared different tunnel concepts and in the end we evaluated this design as the most accurate and the most objective. Different tunnels have different problems, for which some fans are relatively advantageous, but others are disadvantageous. This topic is not suitable for a comment below an article, a whole book could be written about it. And we will write it as well, but everything in its time. Some of the wording and details in the methodology are deliberately such that someone cannot adopt it 1:1. We wanted to avoid such a risk, because it would put us at a considerable disadvantage if many things were considered a “good idea” even by someone with significantly better marketing than we have.
But we are slowly approaching the stage when we will be able (our two-year work on tests will not be surpassed :)) to go into details (and also, if I can find the space for it, I would like to revise the overall documentation for the test methodology) and on the basis of the results of our own experiments to analyze in detail why our design is more relevant for the evaluation of fans than the traditional designs with long ducts with a grilled airflow guide. Even a detail such as the orientation of the fan to the tunnel can significantly distort the perspective of the evaluation. When measuring the noise of fans on a tunnel, its walls (tunnel walls), compared to free space, increase the noise of each fan differently. There is a more detailed discussion on this in this thread actually. But these are all things that require reviews of different tunnels with different fans under different conditions to understand sufficiently. We have these data and sooner or later we will certainly process them and publish them in a series of popular-style articles. I can’t promise to do it right away, because it will be a lot of work, which will be commercially inefficient. And serious magazines that want to survive and are based on in-depth reviews don’t have much room for that. But we will certainly get there. It is necessary to start off gently, so that people can understand elementary things/phenomena sufficiently. The design analysis of individual elements in the test tunnels is a more complex topic for the true fan enthusiasts, of which there are only a few, unfortunately. The interest must be always more widespread for the work to make sense financially. With this, we will definitely go financially into the negative, the efficiency in this direction will be low, but we count with it and we have to plan everything properly. Particularly since the series of articles on this subject will be extremely laborious, it is a very demanding topic. Especially if the form of processing is to be understandable even for laymen.
The orientation of the air flow through the tunnel need not interest you at all. With regard to the design of the test tunnel, it is chosen with a view to achieving sufficient laminar flow wherever it is necessary for objective measurements. It has nothing to do with the orientation of the fan on the obstacle. Differences in this respect are shaped primarily by the degree of imperfection of the test system. If someone gets lower airflow on push, it is mainly because the nature of the airflow is more turbulent at the point of dynamic pressure measurement.