


Static pressure measurement…
The introduction to this article has been rewritten several times. The original versions resorted to describing the adverse events that caused the long-announced fan testing to be so dramatically delayed. But the text was always dreadfully boring… the important thing is that everything managed to make it to the start. But before the starting gun, come take a thorough walk around the track where the measurements will take place.
Static pressure measurement…
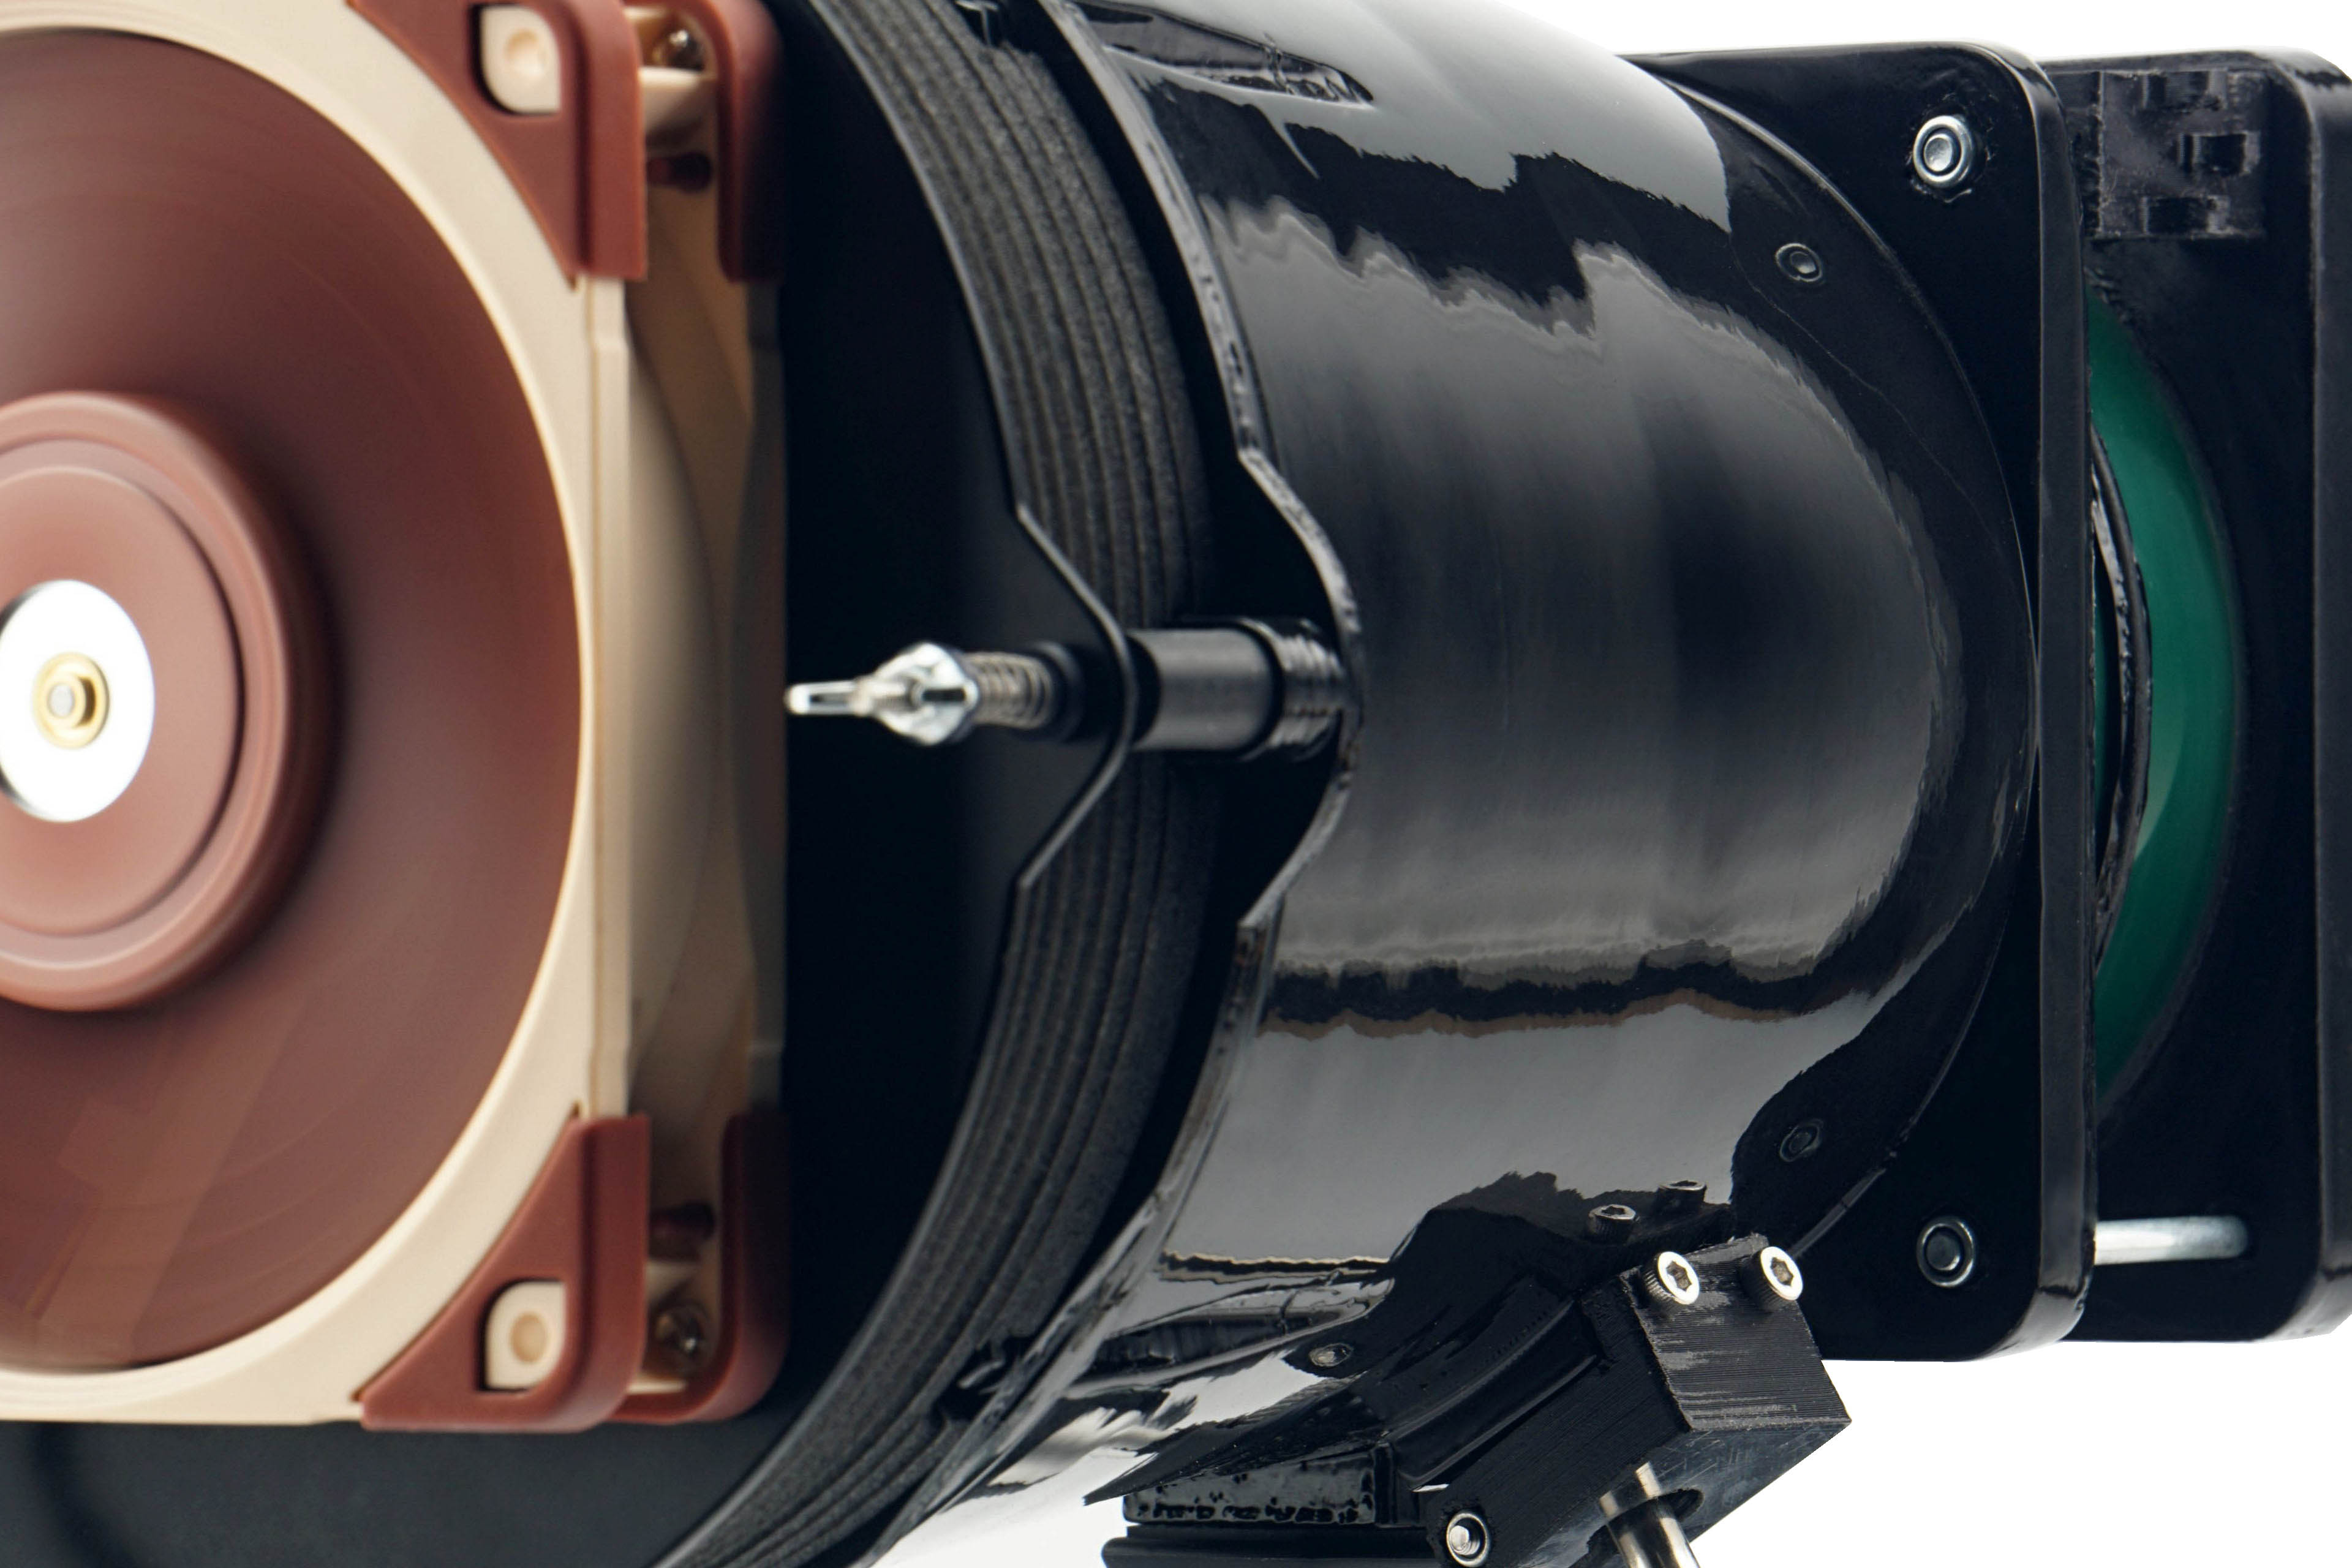
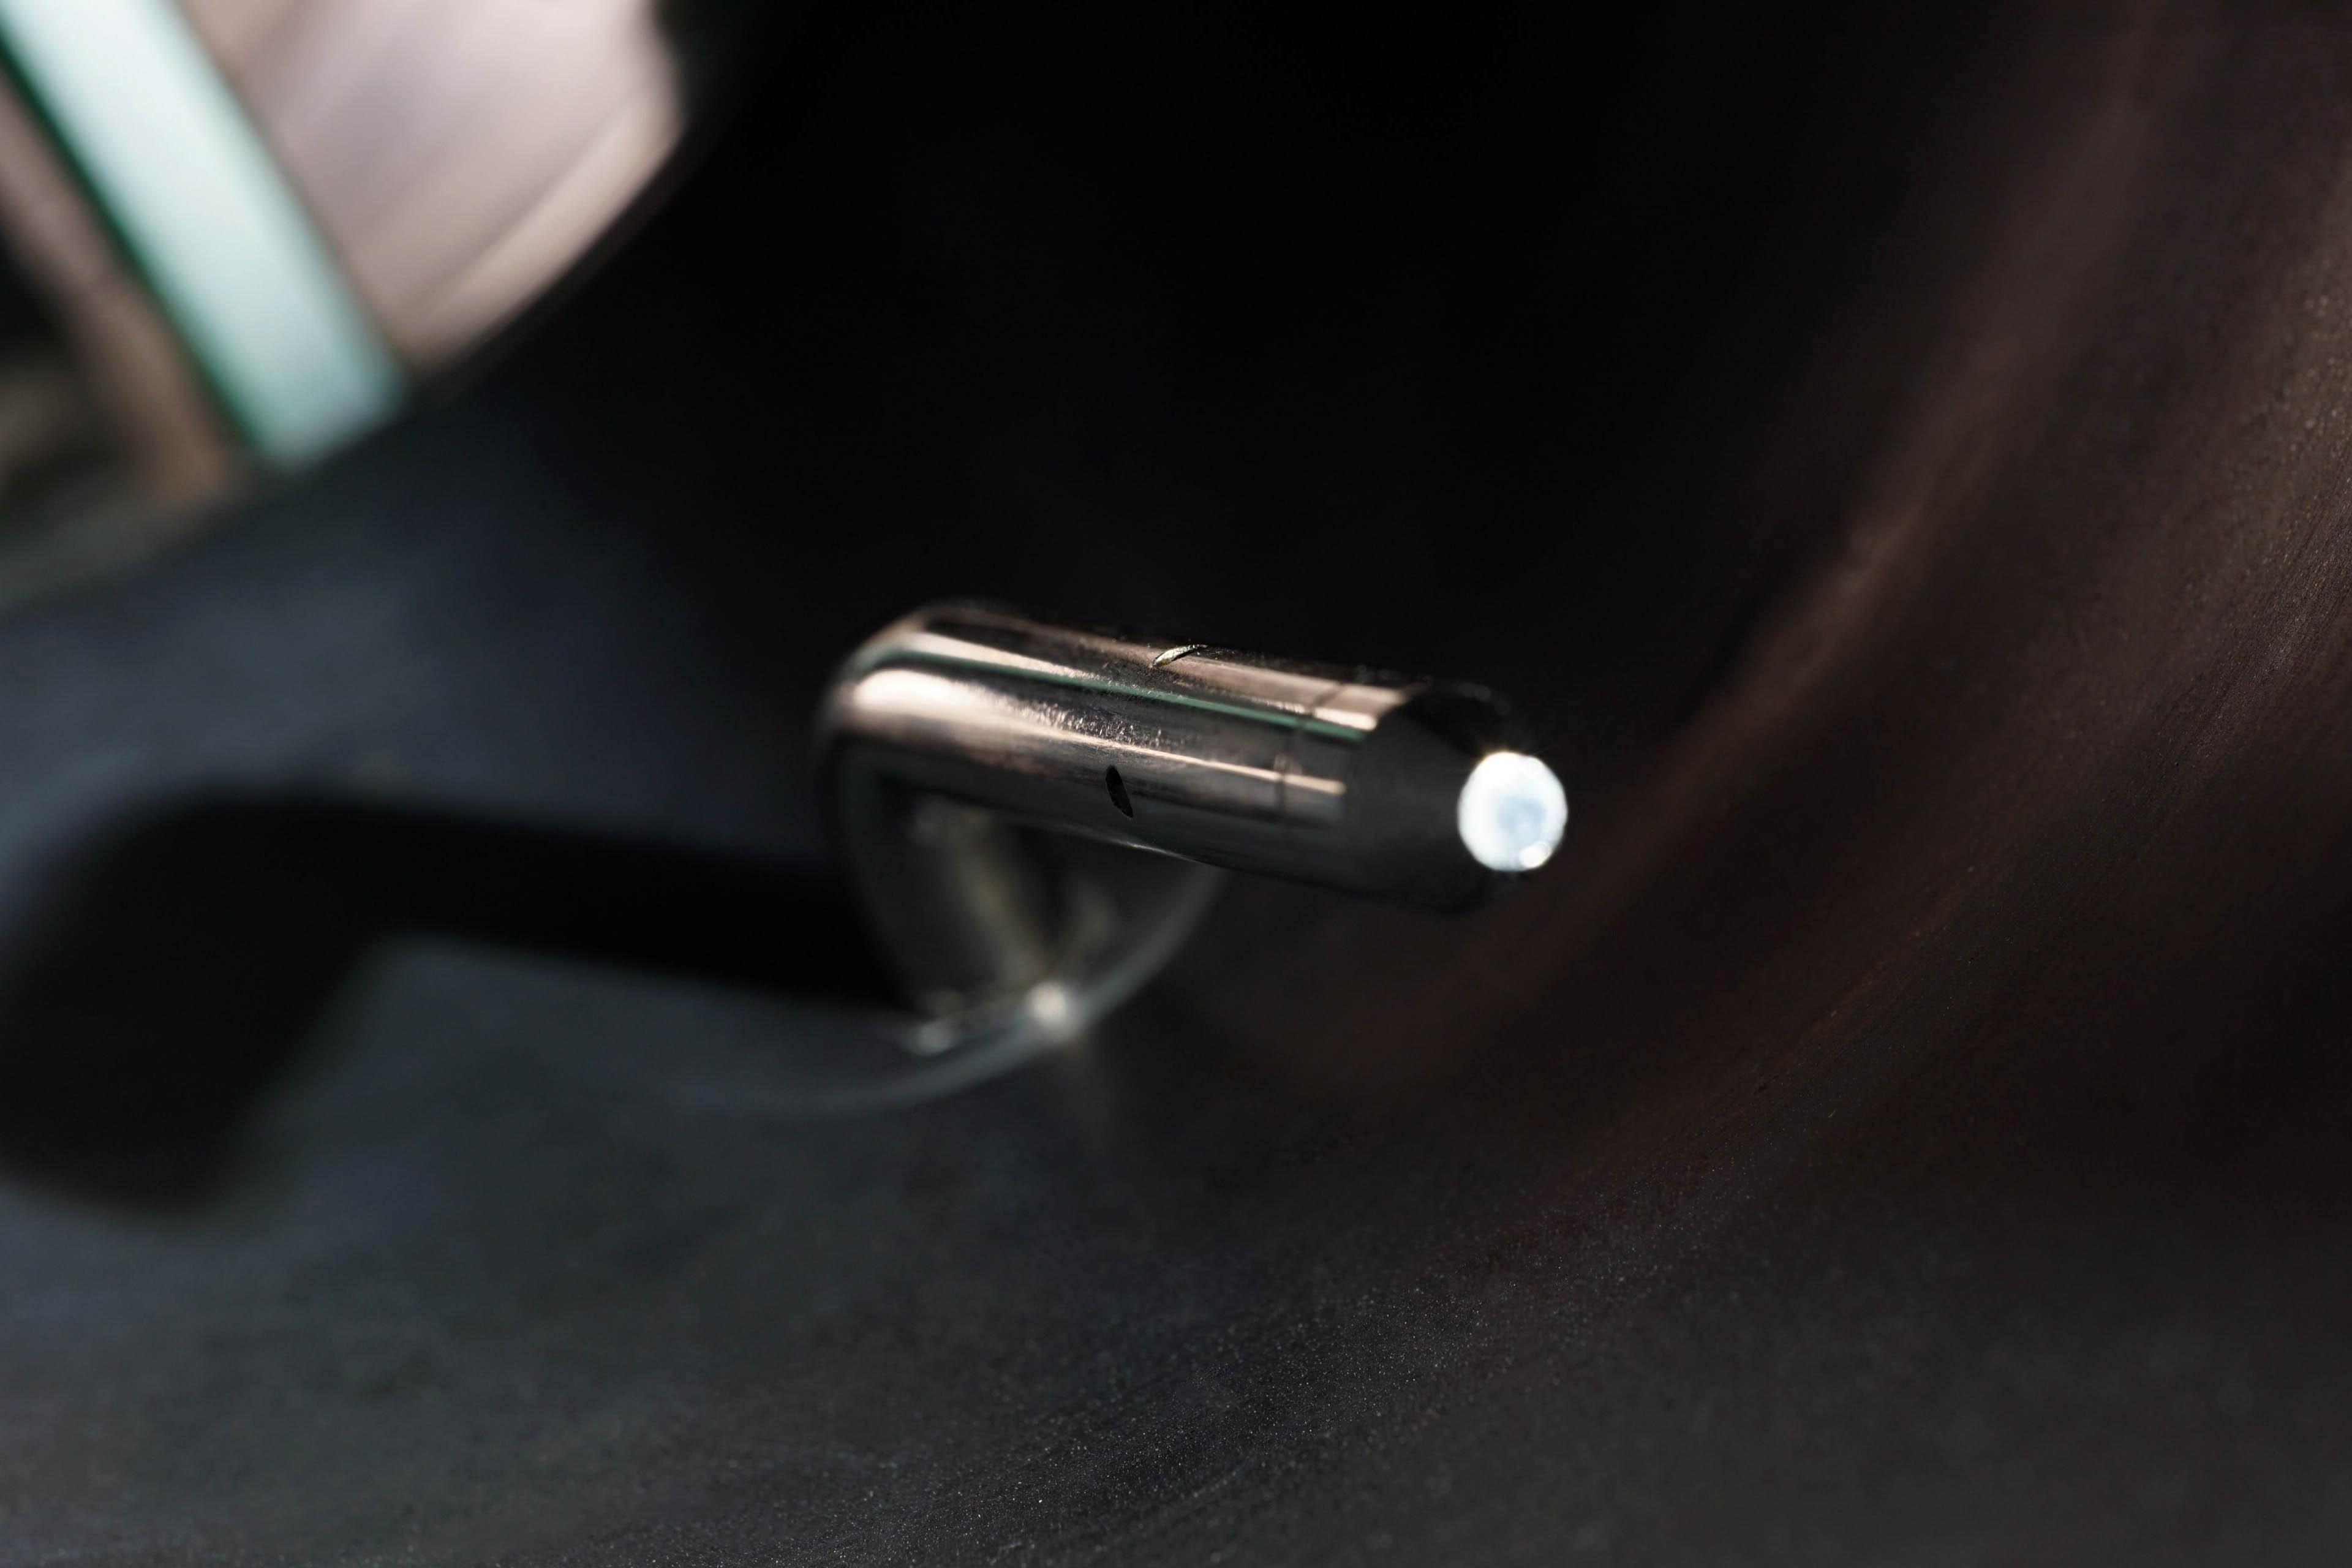
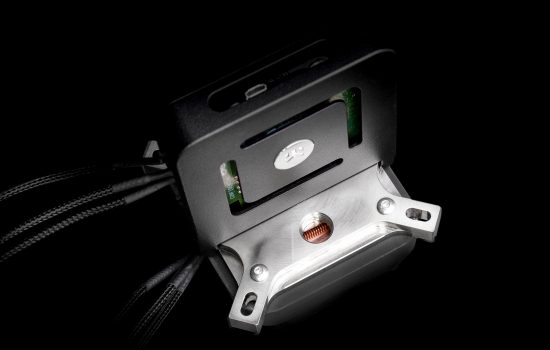
Finally, it is time to move further down the tunnel a bit. Just behind the fan is a static pressure sensing probe. Its position has been chosen with maximum measurement efficiency in mind. In other words, the sensors are placed at the points of highest pressure (although this is virtually the same everywhere in the unconstrained part of the tunnel).
The Fieldpiece ASP2, which is connected to the Fieldpiece SDMN5 manometer, is used to measure the static pressure in the tunnel. The latter also allows measurements in millimetres of water column, but we measure in millibars. This is a more finely resolved base unit for this meter. And only from there we convert the measured values into mm H2O to allow easy comparison with what the manufacturers state.
The difference in cross-section at the intake and exhaust (where the exhaust in this case is considered to be the anemometer) is related to the fact that the pressure increases in the narrowed part and with it the airflow. In order to avoid distortion at this level and to prevent the airflow from being stated as higher than it actually is, the Bernoulli equation must be applied to the measured values to compensate for the difference between the intake and exhaust cross-section (it also takes into account the motor housings). After this, it is again possible to confront our results with the paper parameters.
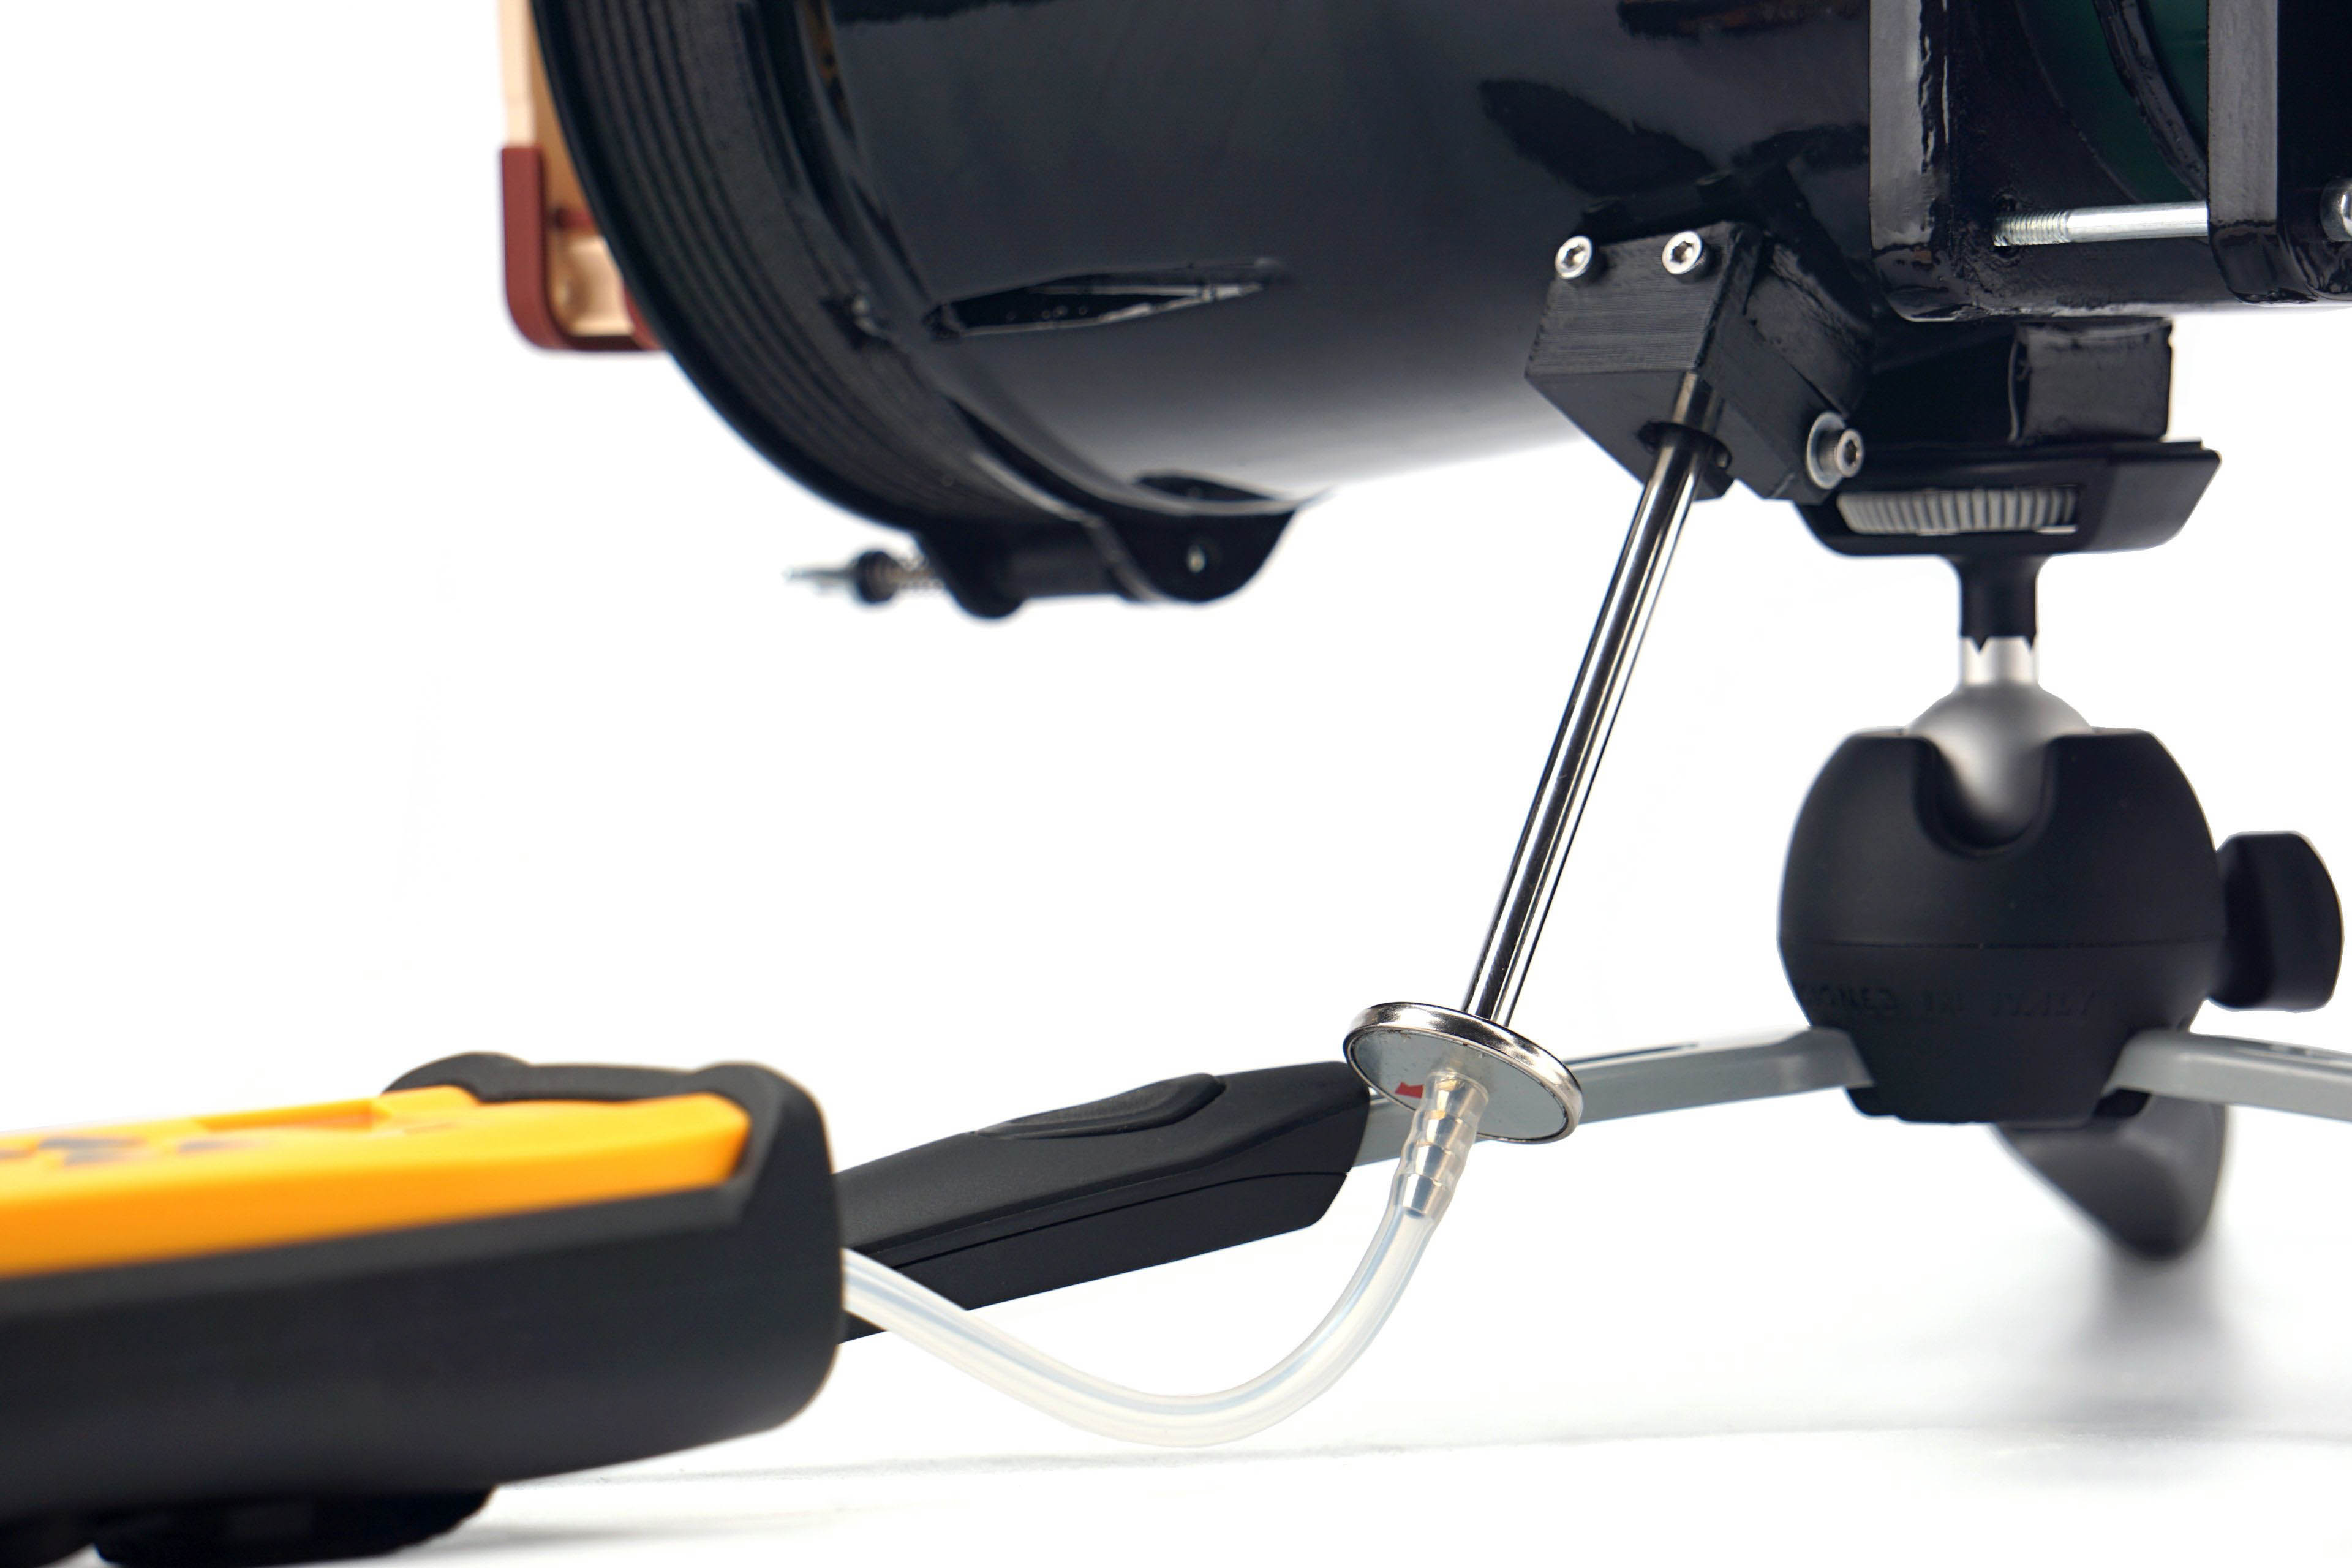
The greater the difference between the manufacturer’s claimed values and ours, the less the specifications correspond to reality. If the claimed values are significantly higher, it is certainly an intention to artificially give an advantage to the fans on the market. However, if the manufacturer quotes a lower pressure value than we do, it points to something else. Namely, a weaker tightness of the measuring environment. The less tight the tunnel is, the lower the pressure you naturally measure. This is one of the things we tuned for an extremely long time, but in the end we ironed out all the weak spots. Whether it’s the passage for the probe itself, the flanges around the anemometer, even the anemometer frame itself, which is made up of two parts, needed to be sealed in the middle. Finally, the flap at the tunnel outlet must also be perfectly tight. That’s because static pressure has to be measured in zero airflow.
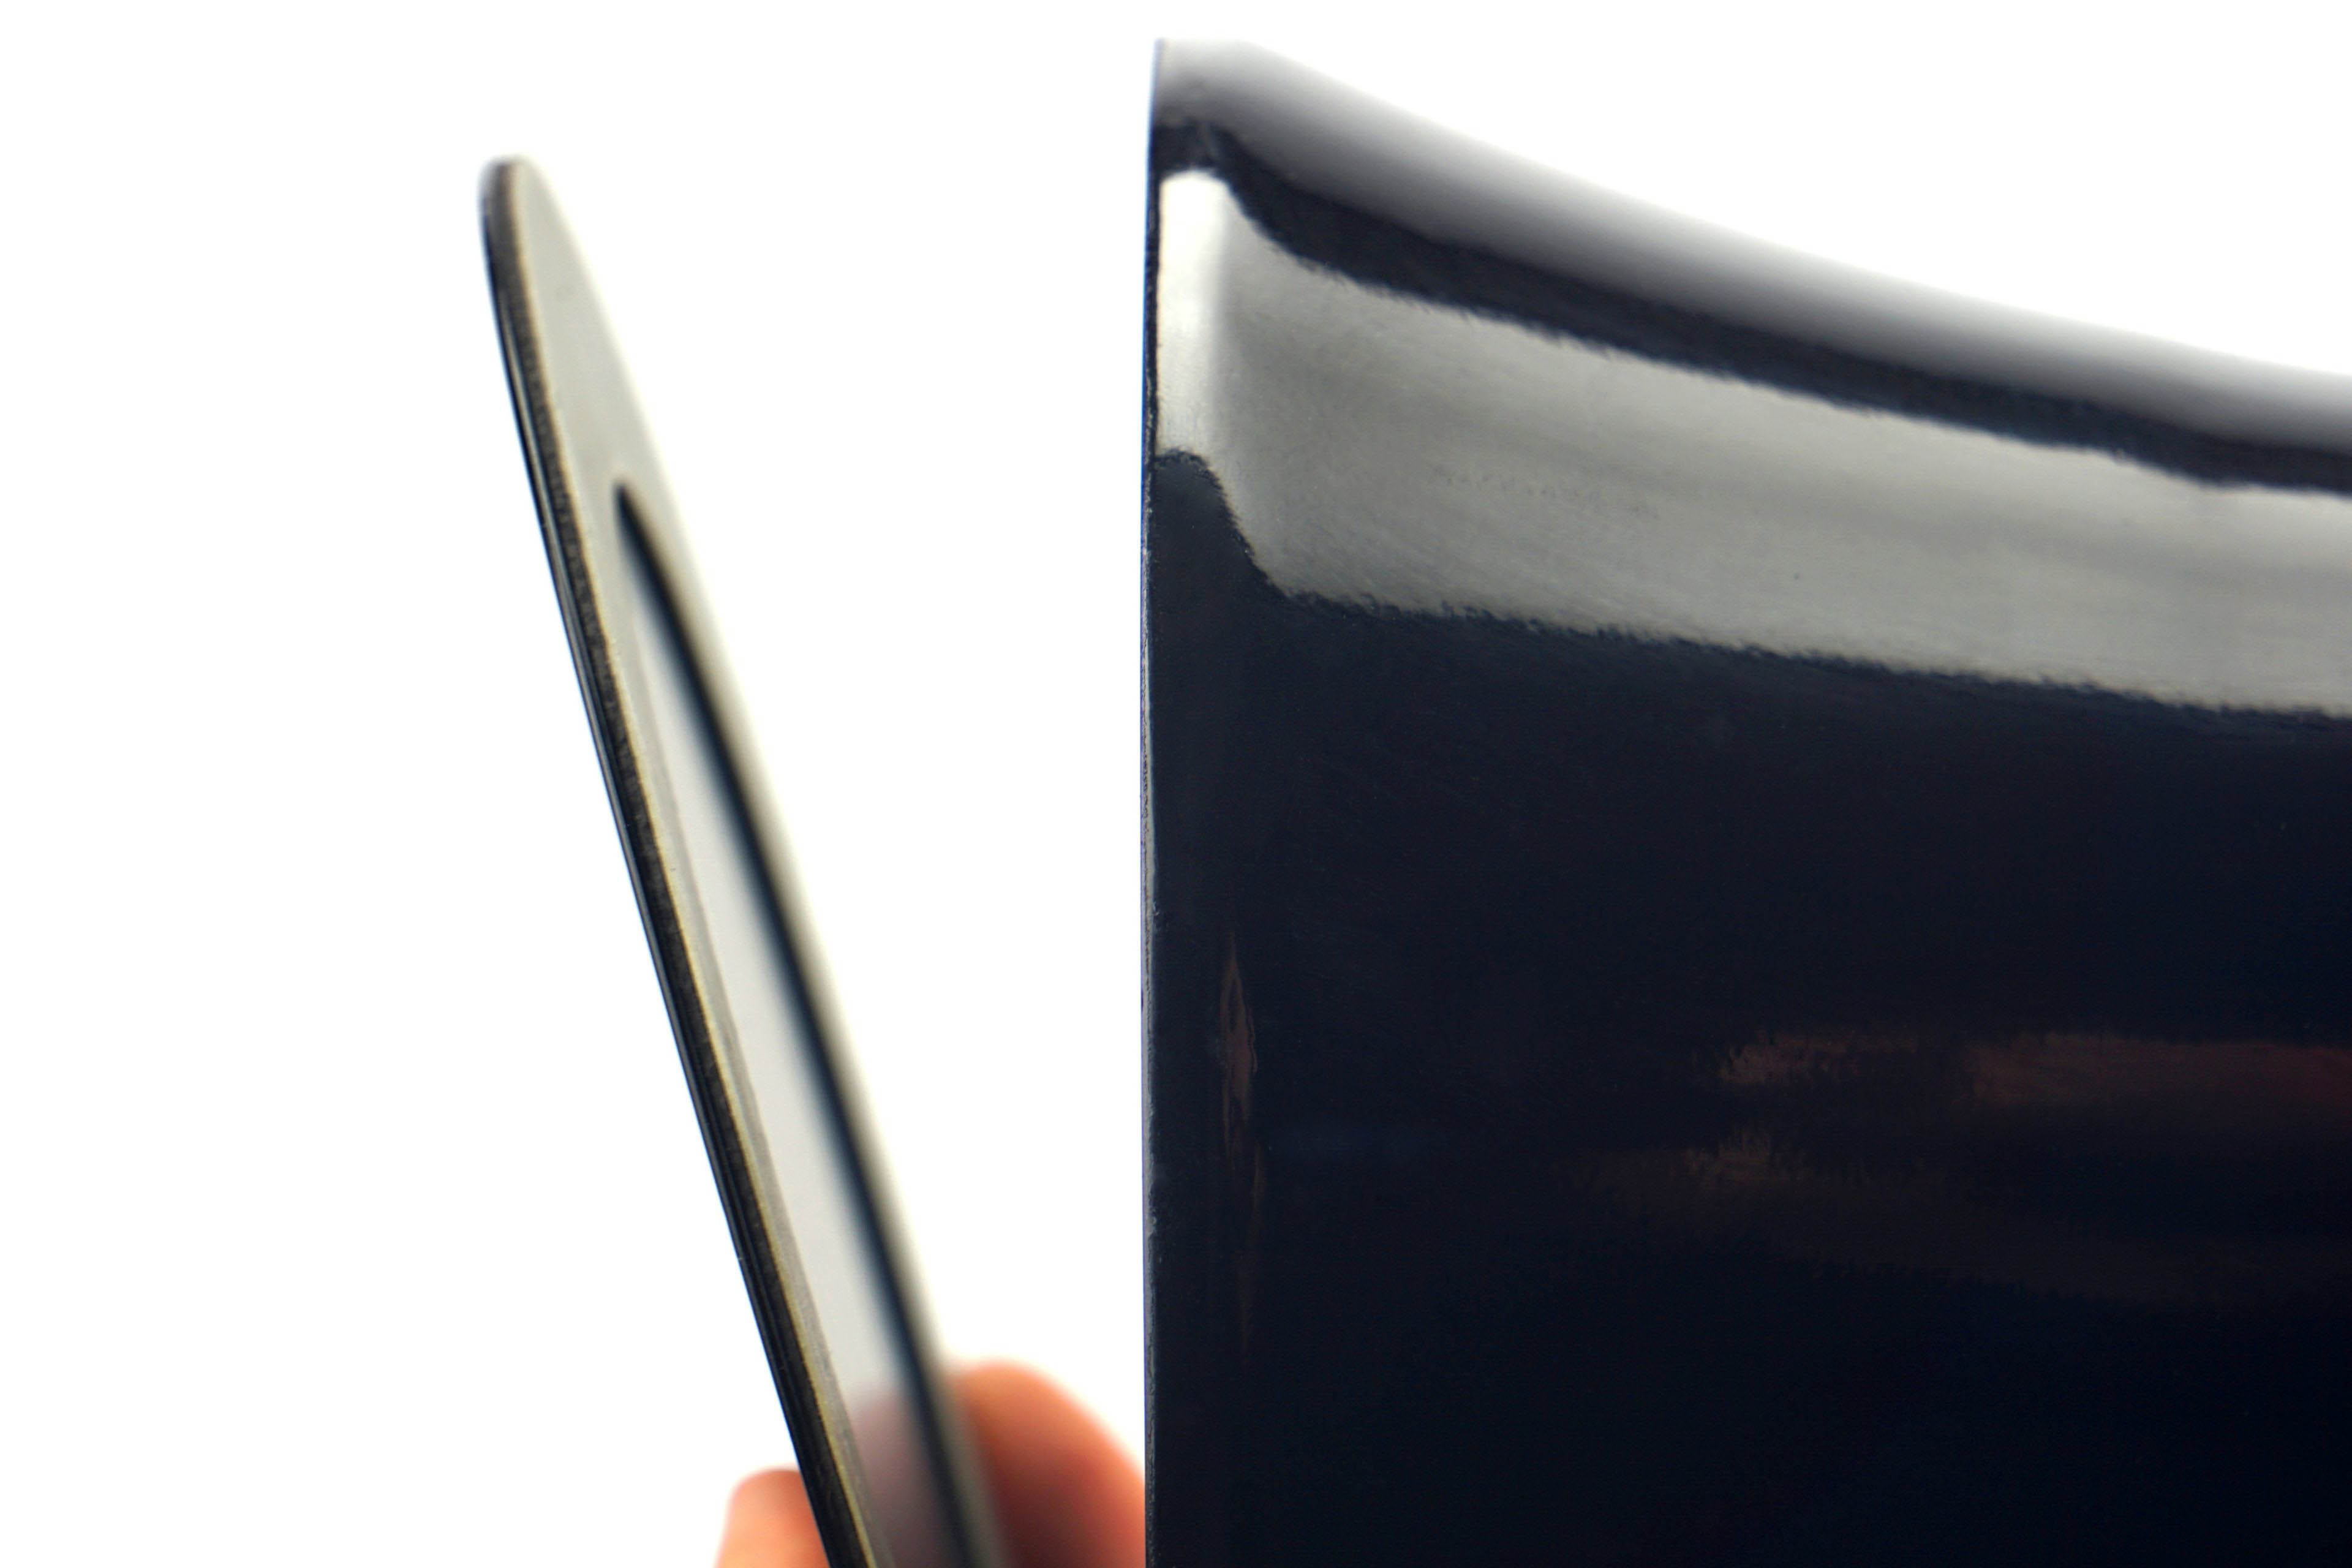
But there is one thing that often lowers the pressure of the fans a bit. And that’s protruding anti-vibration pads in the corners or otherwise protruding corners. In other words, when the fan doesn’t fit perfectly to the mounting frame at the inlet, and there are small gaps around the perimeter, that also affects what you measure. But we have not gone into this because it is already a quality feature of the fan. In the same way, it will “stand out” and perform a bit weaker than it has the potential to do with better workmanship, even after application by the end user.
- Contents
- Introduction to fan testing
- Basis of methodology, the wind tunnel
- Mounting and vibration measurement
- Initial warm-up and speed recording
- Base 7 equal noise levels...
- ... and sound color (frequency characteristic)
- Static pressure measurement…
- ... and airflow
- Everything changes with obstacles
- How we measure power draw and motor power
- Measuring the intensity (and power draw) of lighting
- Eight “basics” to start off…


Have you tried PWM controllers other than the Noctua NA-FC1? Does the NA-FC1 offer some advantages over other (often much cheaper) controllers?
We tried our own solution, our own PWM controller. But it was rather clumsy and the only disadvantage of NA-FC1 is that it is not possible to read a numeric value from it. And maybe the fact that it has a narrower rotation range. As long as it is powered by a laboratory power supply, it does not reduce the sensitivity of the exact setting (and what needs to be set can always be fine-tuned in units of mV on the power supply). I have no experience with other off-the-shelf PWM controllers, nor did I know there were any. All PC speed controllers I have used in the past only supported DC control. I have probably the most experience with Scythe Kaze Master Pro and Lamptron Touch. 🙂
Hi,
Could you please clarify the flow in the pull position?
I’m referring to measuring the airflow in a pull fan configuration.
Yes, thanks for asking. Schematically this is the model:
The airflow guide is on the opposite side of the tested fan. This design is the result of several years of research in which we compared different tunnel concepts and in the end we evaluated this design as the most accurate and the most objective. Different tunnels have different problems, for which some fans are relatively advantageous, but others are disadvantageous. This topic is not suitable for a comment below an article, a whole book could be written about it. And we will write it as well, but everything in its time. Some of the wording and details in the methodology are deliberately such that someone cannot adopt it 1:1. We wanted to avoid such a risk, because it would put us at a considerable disadvantage if many things were considered a “good idea” even by someone with significantly better marketing than we have.
But we are slowly approaching the stage when we will be able (our two-year work on tests will not be surpassed :)) to go into details (and also, if I can find the space for it, I would like to revise the overall documentation for the test methodology) and on the basis of the results of our own experiments to analyze in detail why our design is more relevant for the evaluation of fans than the traditional designs with long ducts with a grilled airflow guide. Even a detail such as the orientation of the fan to the tunnel can significantly distort the perspective of the evaluation. When measuring the noise of fans on a tunnel, its walls (tunnel walls), compared to free space, increase the noise of each fan differently. There is a more detailed discussion on this in this thread actually. But these are all things that require reviews of different tunnels with different fans under different conditions to understand sufficiently. We have these data and sooner or later we will certainly process them and publish them in a series of popular-style articles. I can’t promise to do it right away, because it will be a lot of work, which will be commercially inefficient. And serious magazines that want to survive and are based on in-depth reviews don’t have much room for that. But we will certainly get there. It is necessary to start off gently, so that people can understand elementary things/phenomena sufficiently. The design analysis of individual elements in the test tunnels is a more complex topic for the true fan enthusiasts, of which there are only a few, unfortunately. The interest must be always more widespread for the work to make sense financially. With this, we will definitely go financially into the negative, the efficiency in this direction will be low, but we count with it and we have to plan everything properly. Particularly since the series of articles on this subject will be extremely laborious, it is a very demanding topic. Especially if the form of processing is to be understandable even for laymen.
The orientation of the air flow through the tunnel need not interest you at all. With regard to the design of the test tunnel, it is chosen with a view to achieving sufficient laminar flow wherever it is necessary for objective measurements. It has nothing to do with the orientation of the fan on the obstacle. Differences in this respect are shaped primarily by the degree of imperfection of the test system. If someone gets lower airflow on push, it is mainly because the nature of the airflow is more turbulent at the point of dynamic pressure measurement.