


The basis of the methodology, the wind tunnel
To write that we have something mapped out to the last detail is perhaps too bold, but after proper preparation, few pieces of hardware are as easy to evaluate as fans. Of course, this had to be preceded by long preparations, developing a methodology, but you already know the story. What you don’t know yet is the first fruit, or rather the results of Akasa, SilentiumPC, SilverStone, Xigmatek or more exotic Reeven fans.
The basis of the methodology, the wind tunnel
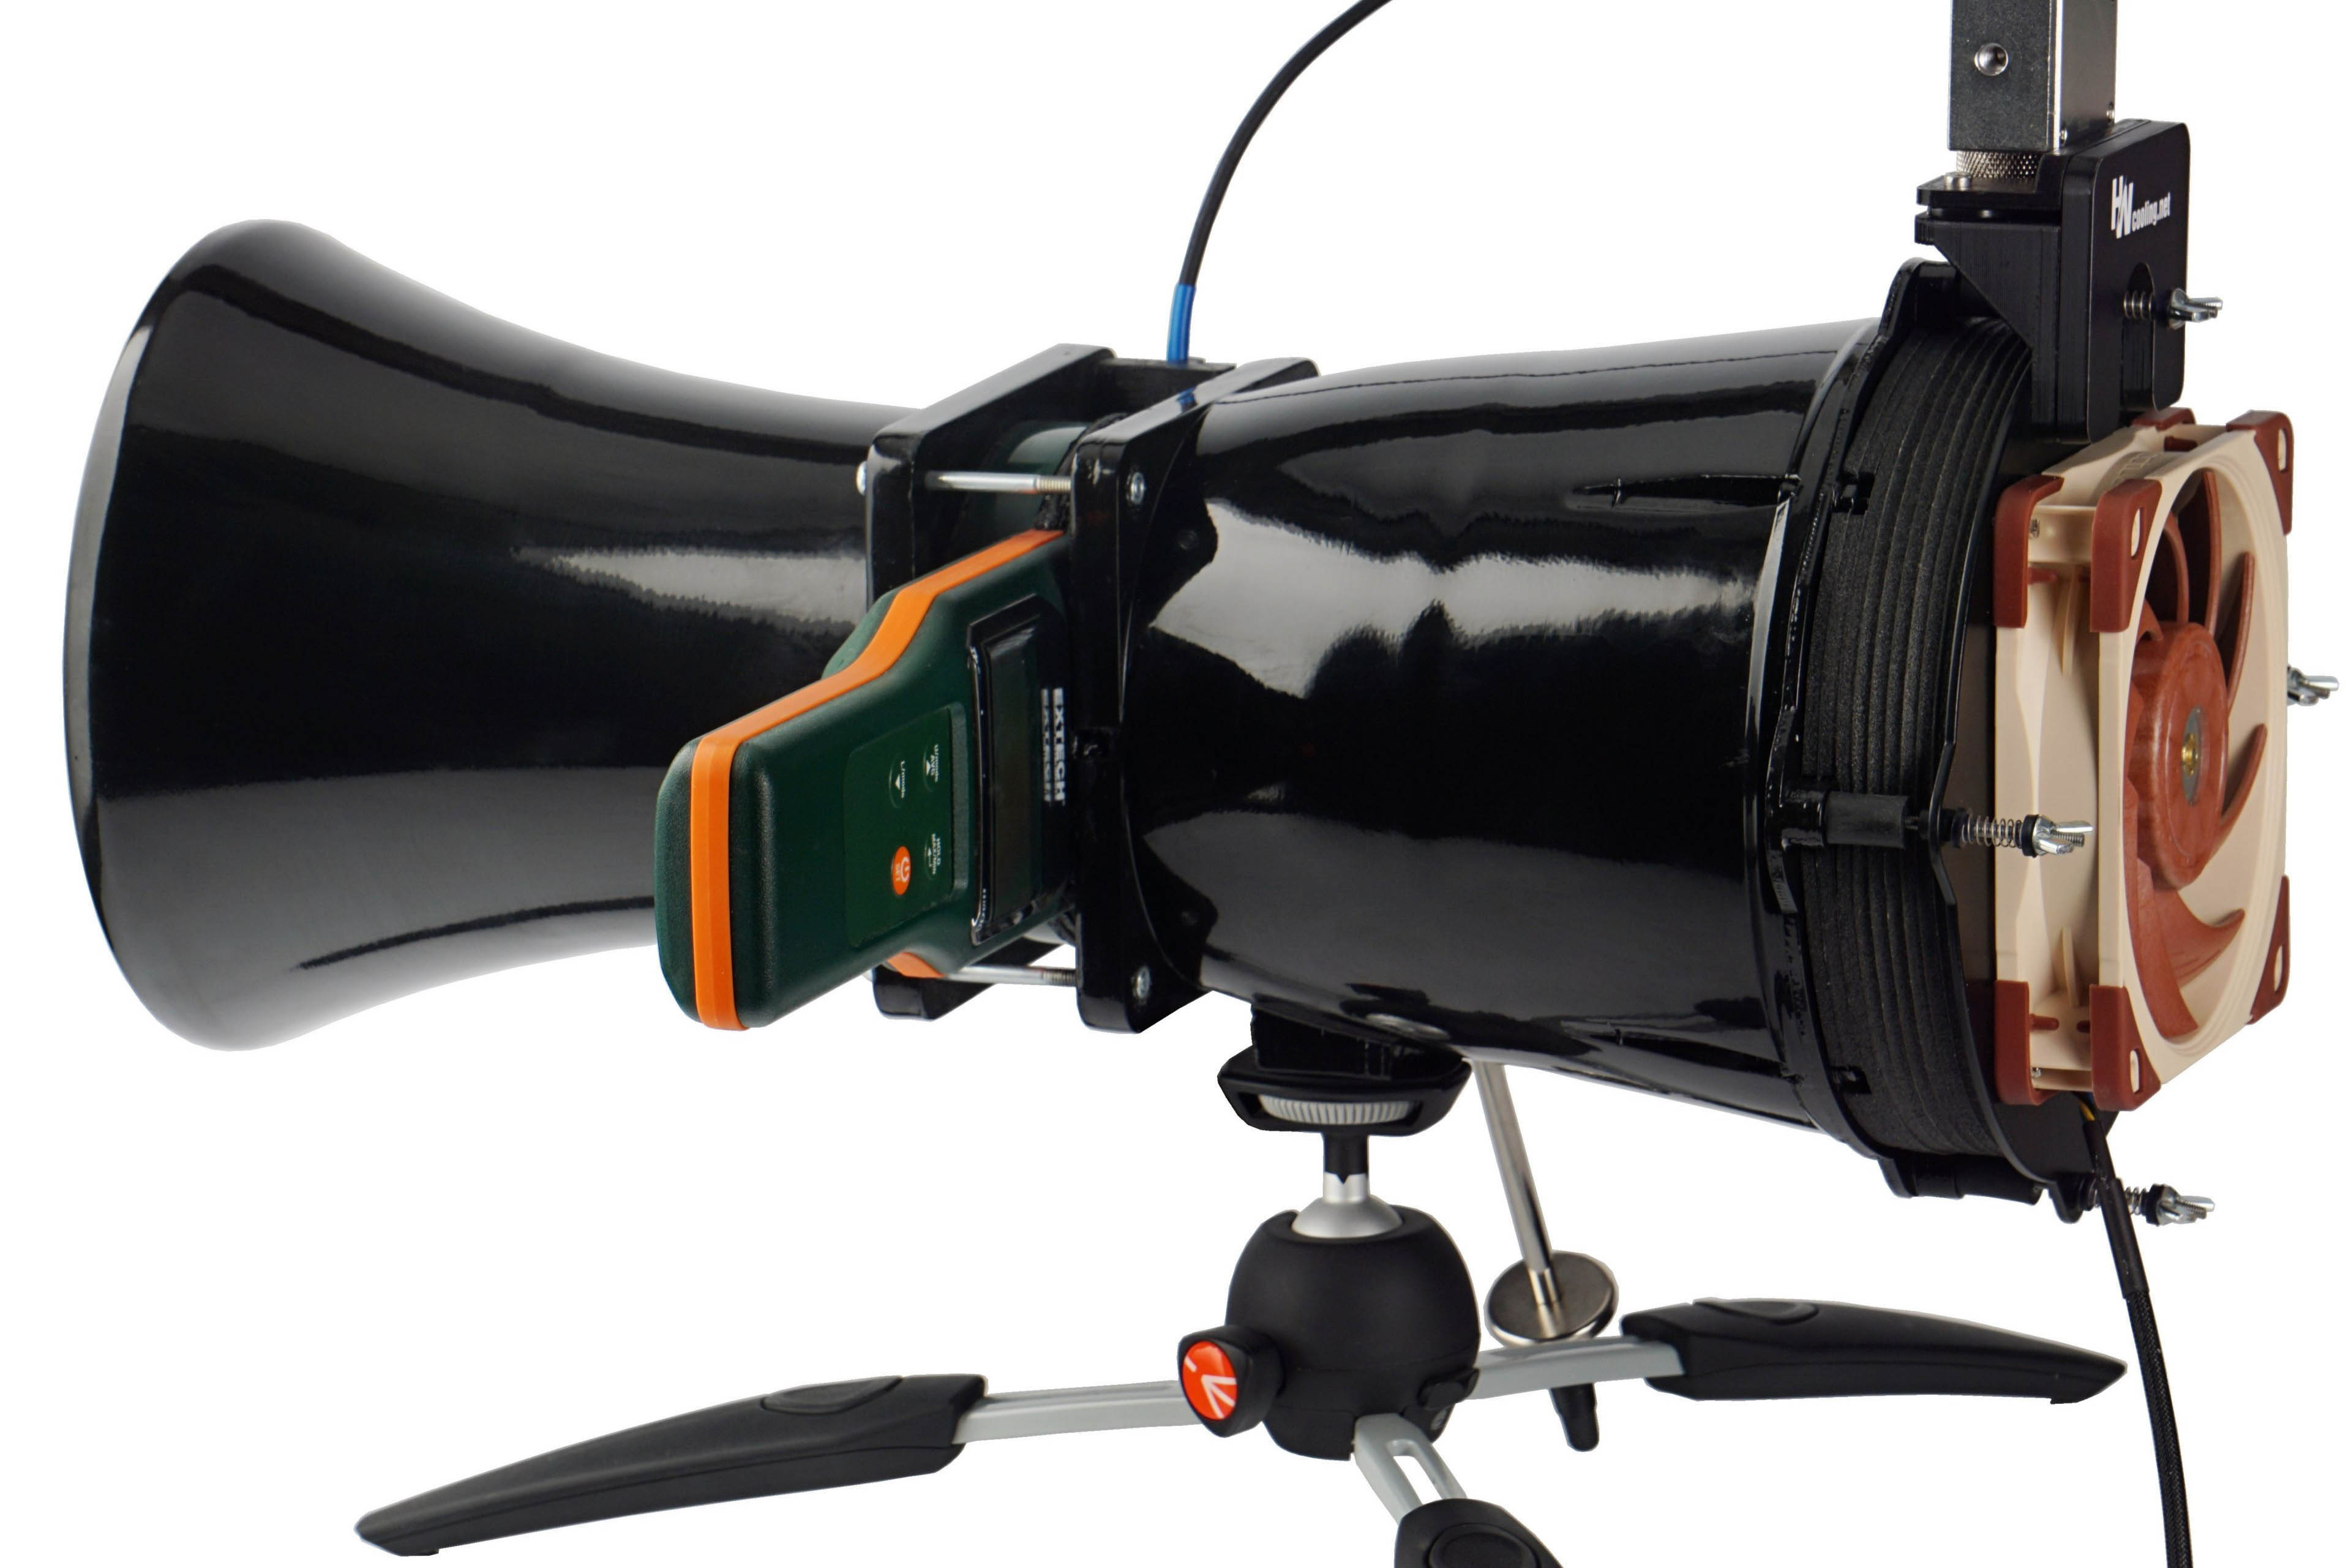
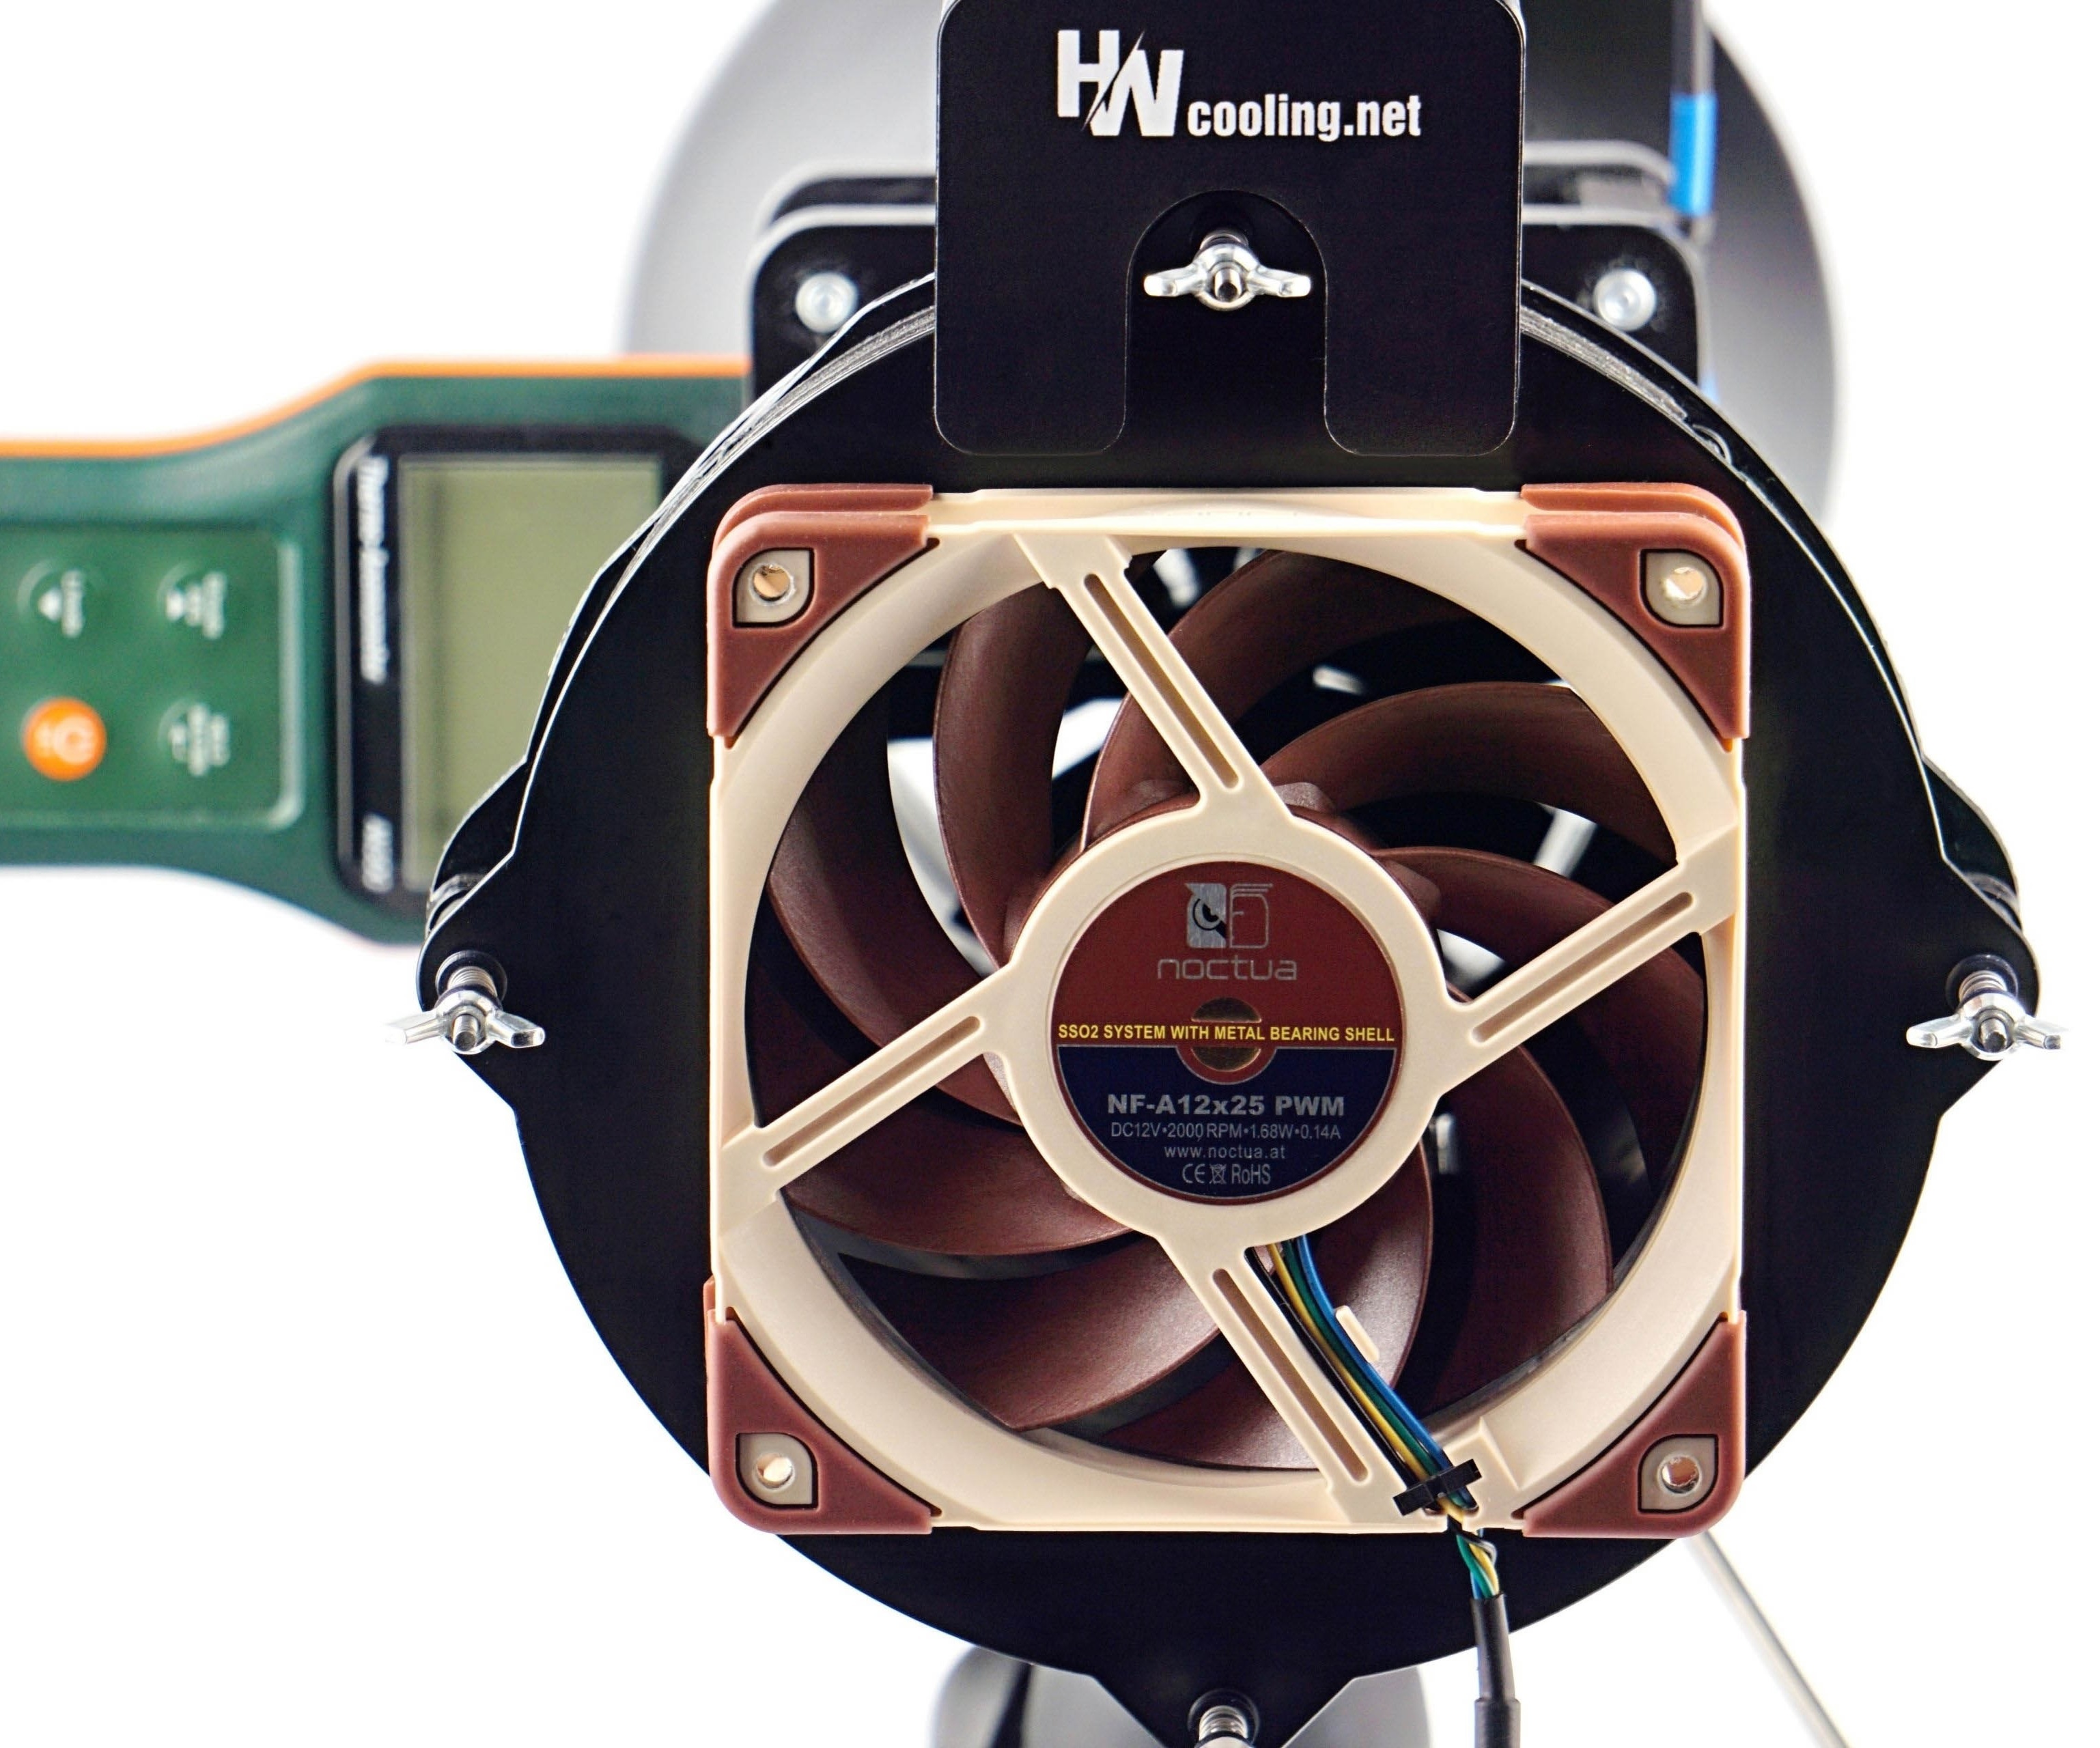
Before you start reading the methodology with all the details, take a look at the test tunnel as a whole. This is the heart of the whole system, to which other arteries are connected (manometer, vibrometer, powermeter, …). The only solid part of the tunnel from the measuring instruments is the anemometer.
The shape of the wind tunnel is inspired by the Venturi tube, which has long been used to measure the flow of liquids and gasses. The Venturi effect for wind speed measuring is also known from the aerospace industry. However, the design for measuring computer fans has its own specificities, which this proposal of ours reflects.
The individual parameters of the HWC wind tunnel for fan tests are the result of physical simulations and practical debugging. All the details (folds, material or finish used) have a rationale behind them and are designed this way for a specific reason. We will discuss the individual design details in turn in the description of the sub-variable measurements.
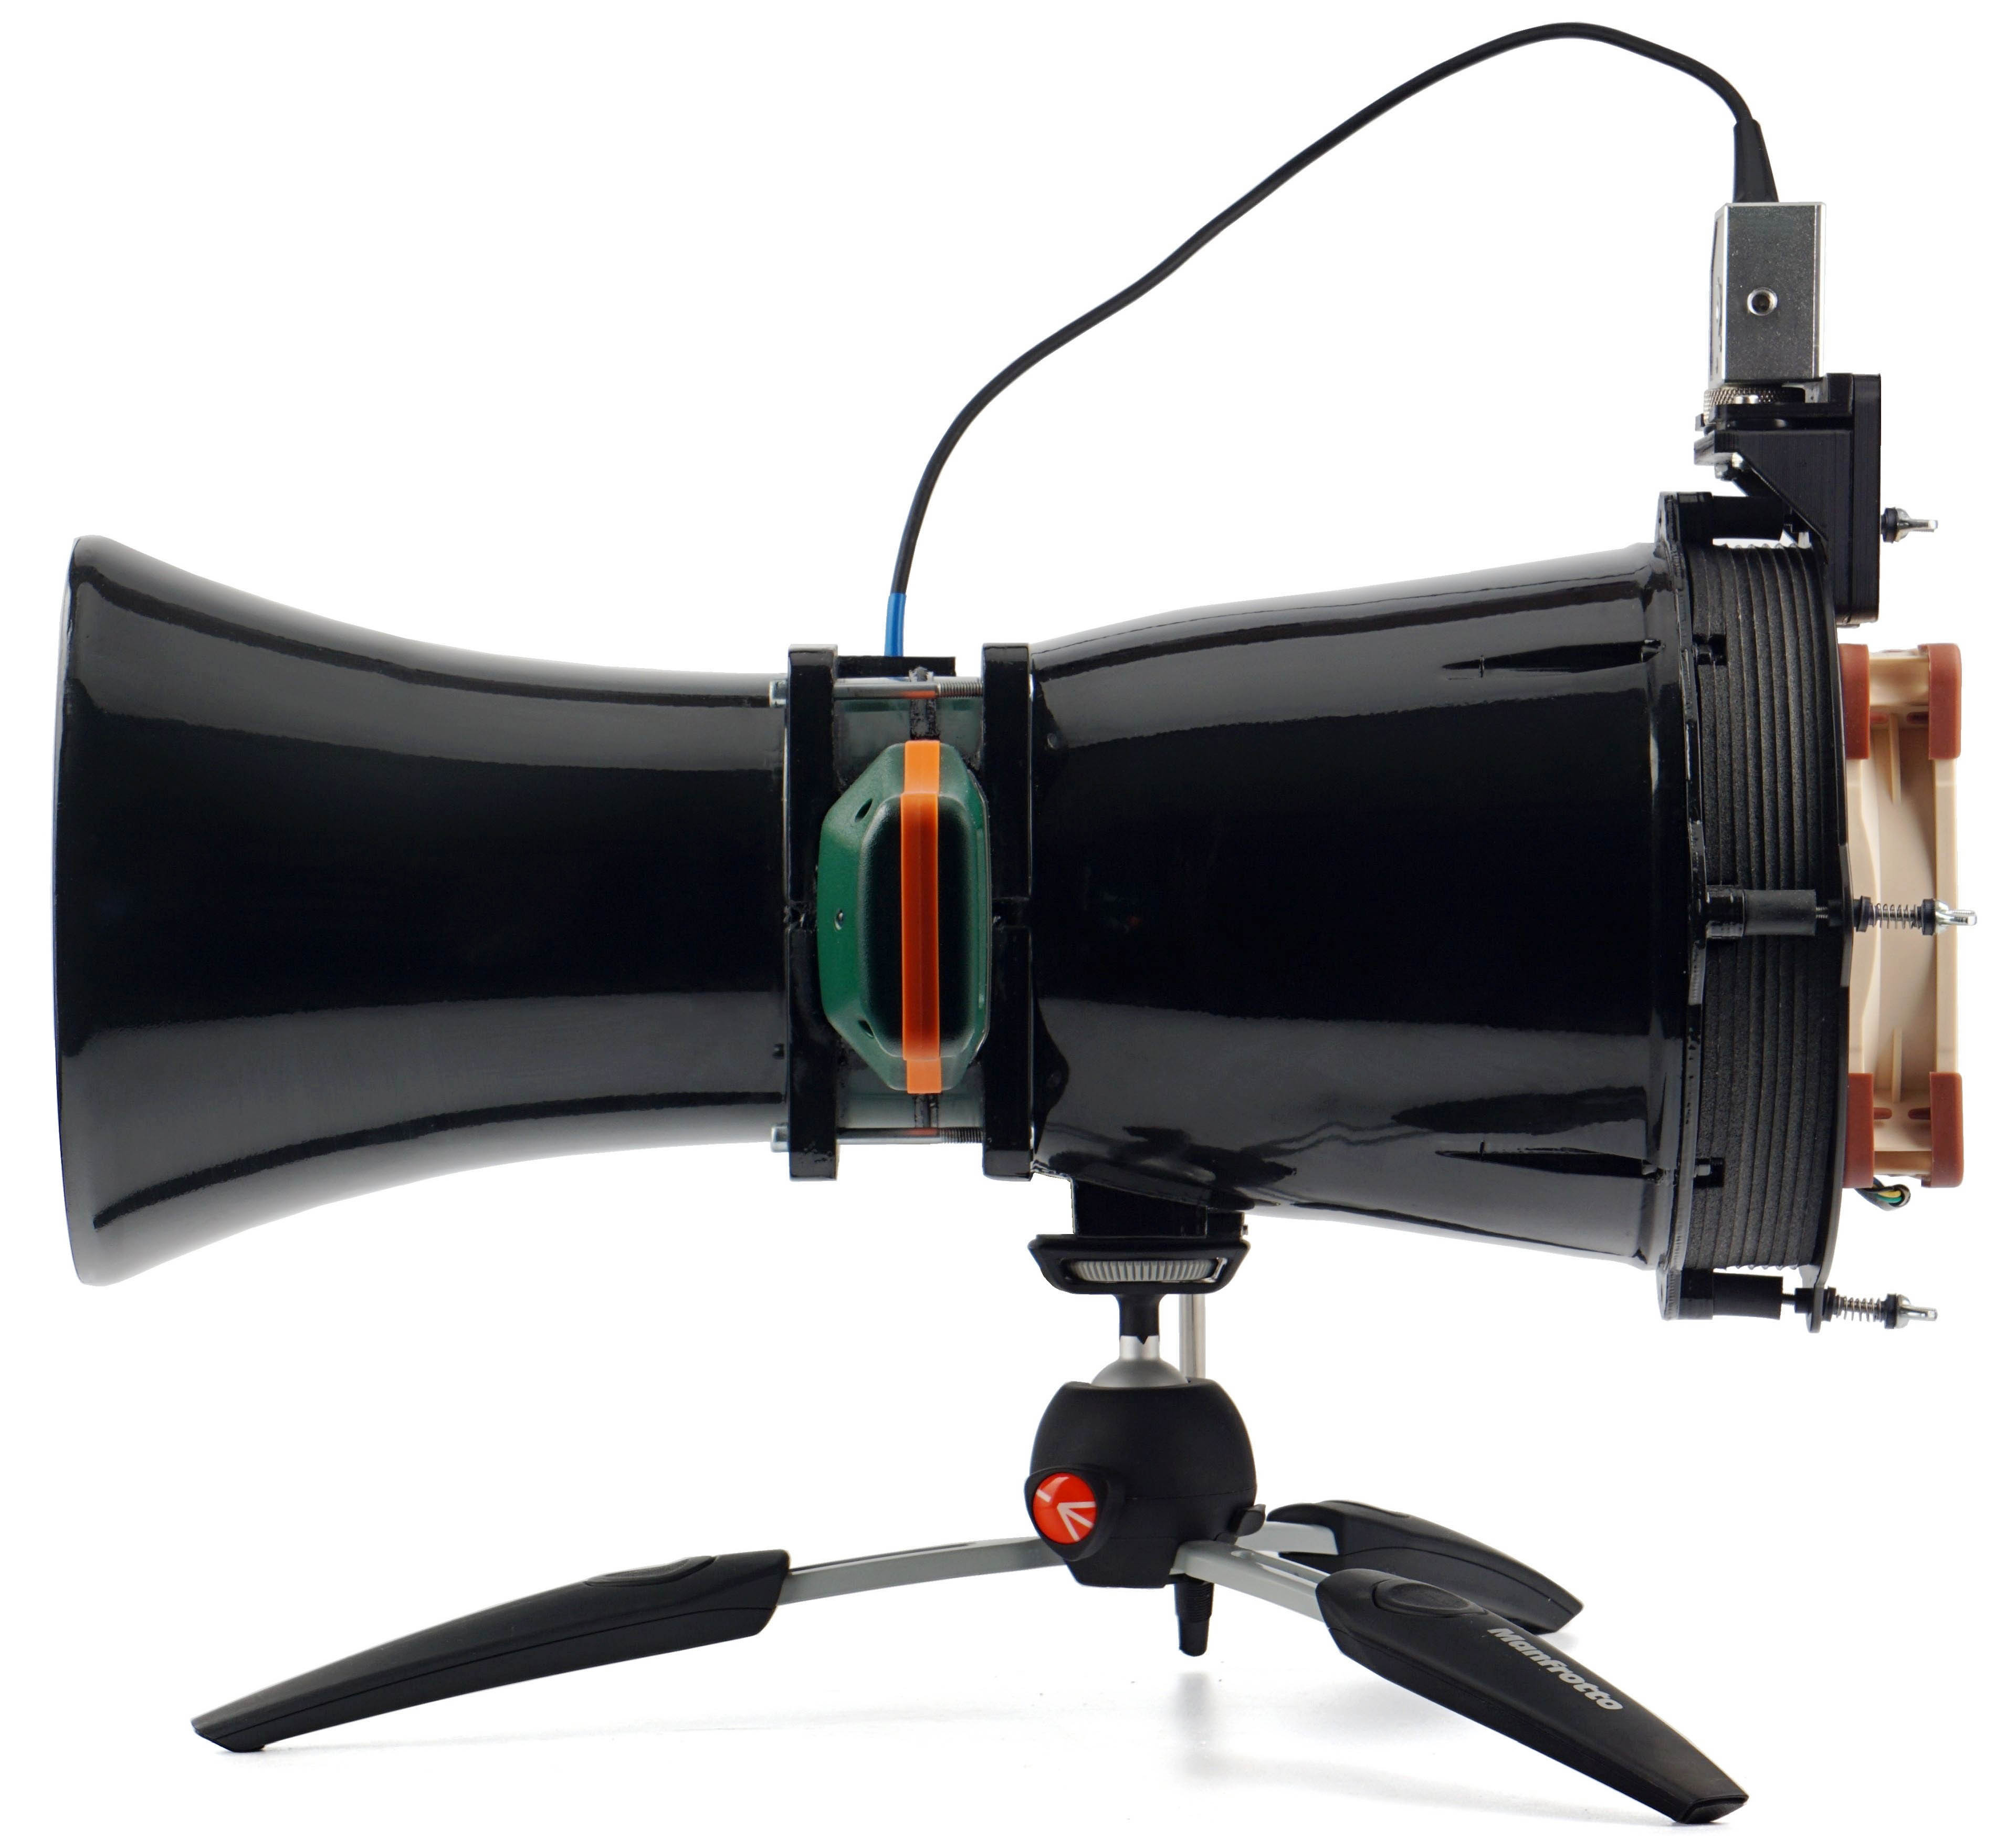
Now we will briefly elaborate on some things that do not fit thematically into the text of the following chapters. Namely, for example, that the skeleton of the wind tunnel is the work of a 3D printer (PLA). The rough print was, of course, then thoroughly machined by grinding, fusing, polishing and varnishing. Especially important is the smooth finish of the interior walls.
When joining the individual parts, the emphasis was on making sure that they fit together flawlessly, that they were sealed flawlessly (we will come back to this when we describe the test procedures for pressure measurement), but also that the joints were not loosened by use. Everything is disassemblable for servicing purposes, but it is ensured that the properties are maintained during use and, for example, even under the stress of vibration. The threads are secured with either lock nuts or thread-locking fluid. It depends on which is more suitable in which place.
When the wind tunnel is not in use, it is enclosed in a dust-tight chamber. In addition to the technical equipment and its correct storage, it is also important for objective outputs that all measuring instruments are calibrated according to the standard. Without this, it would be impossible to stand behind your results and rely on the manufacturers’ specifications. Calibration protocols are therefore an important part of the methodology. Testing is carried out at an ambient air temperature of 21–21.3 °C, humidity is approximately 45 % (± 2 %).
Fans come to us for testing in at least two pieces of the same model. If the deviations of any of the measured values are greater than 5 %, we also work with a third or fourth sample and the average value is formed by the results of the fans that came out the most similar and the differences between them fit under 5 %.
- Contents
- Cooler Master MasterFan SF120M in detail
- The basis of the methodology, the wind tunnel
- Mounting and vibration measurement
- Initial warm-up and speed recording
- Base 7 equal noise levels…
- .. and sound color (frequency characteristic)
- Static pressure measurement…
- … and airflow
- Everything changes with obstacles
- How we measure power draw and motor power
- Measuring the intensity (and power draw) of lighting
- Results: Speed
- Results: Airlow w/o obstacles
- Results: Airflow through a nylon filter
- Results: Airflow through a plastic filter
- Results: Airflow through a hexagonal grille
- Results: Airflow through a thinner radiator
- Results: Airflow through a thicker radiator
- Results: Static pressure w/o obstacles
- Results: Static pressure through a nylon filter
- Results: Static pressure through a plastic filter
- Results: Static pressure through a hexagonal grille
- Results: Static pressure through a thinner radiator
- Results: Static pressure through a thicker radiator
- Results: Static pressure, efficiency by orientation
- Reality vs. specifications
- Results: Frequency response of sound w/o obstacles
- Results: Frequency response of sound with a dust filter
- Results: Frequency response of sound with a hexagonal grille
- Results: Frequency response of sound with a radiator
- Results: Vibration, in total (3D vector length)
- Results: Vibration, X-axis
- Results: Vibration, Y-axis
- Results: Vibration, Z-axis
- Results: Power draw (and motor power)
- Results: Cooling performance per watt, airflow
- Results: Cooling performance per watt, static pressure
- Airflow per euro
- Static pressure per euro
- Results: Lighting – LED luminance and power draw
- Results: LED to motor power draw ratio
- Evaluation


It looks like the frequency response charts do not show.
Thanks for the heads up, it’s now corrected.
In some of the older articles in English, imperfect processing techniques combined with a lack of focus resulted in incorrect paths to the spectrograms being left in the source code. If you should come across something like that again, the original language version (there are graphs with EN descriptions anyway, you can get to it by clicking the flag in the upper right corner of the page) is always correct. Alternatively, the spectrograms of the individual fans can be accessed by entering the URL according to the format “name-of-the-fan-g***”, where the *** a number from the interval 233 to 244. Of course, this is only a temporary solution until we fix it (after you reporting it). But otherwise it must always work without such complications. 🙂
Thanks, I will keep it in mind if I encounter such an issue in the future and report it so that everyone can have it fixed.
I wanted to see the frequencies because of Noctua NF-A12x25 which has a highly disturbing peak right before 400 Hz. The frequency response of SF120M looks so much better at “33dB” in comparison. That’s why it would be great to have at least 1 sound sample per fan at 33dB, to judge the noise according to personal preference.
This is true, but the reason for this is that the SF120M has an overall “dropped” aerodynamic noise spectrum in this mode due to the higher tonal peaks of the motor and bearings. This is also why it achieves a lower airflow. If the test modes were aligned for equal airflow (i.e., the SF120M would have higher RPM), I expect that the NF-A12x25 might not be noisier even at 380 Hz.