


Everything changes with obstacles
To write that we have something mapped out to the last detail is perhaps too bold, but after proper preparation, few pieces of hardware are as easy to evaluate as fans. Of course, this had to be preceded by long preparations, developing a methodology, but you already know the story. What you don’t know yet is the first fruit, or rather the results of Akasa, SilentiumPC, SilverStone, Xigmatek or more exotic Reeven fans.
Everything changes with obstacles
So far, we have described how static pressure and airflow measurements are made under conditions where the fan has no obstacles in its path. In practice, however, fans do not usually blow into an empty space, but have a filter, grille or radiator in front of or behind them, the fins of which need to be pushed through as efficiently as possible.
We will also measure both airflow and pressure through practical obstacles for the reasons stated above. These include two types of filters that are usually used in PC cases. One fine – nylon and the other plastic with a thinner mesh. One other obstacle is the hexagonal grille perforated at 50%, on which the vast majority of fans – intake and exhaust – are installed. In some cases, we measure the effect of the obstacles on the results at positions (behind or in front of the rotor) that are used in practice. All obstacles are both pushed through to detect pressure drops, but also pulled through, which in turn speaks to the impact on airflow.

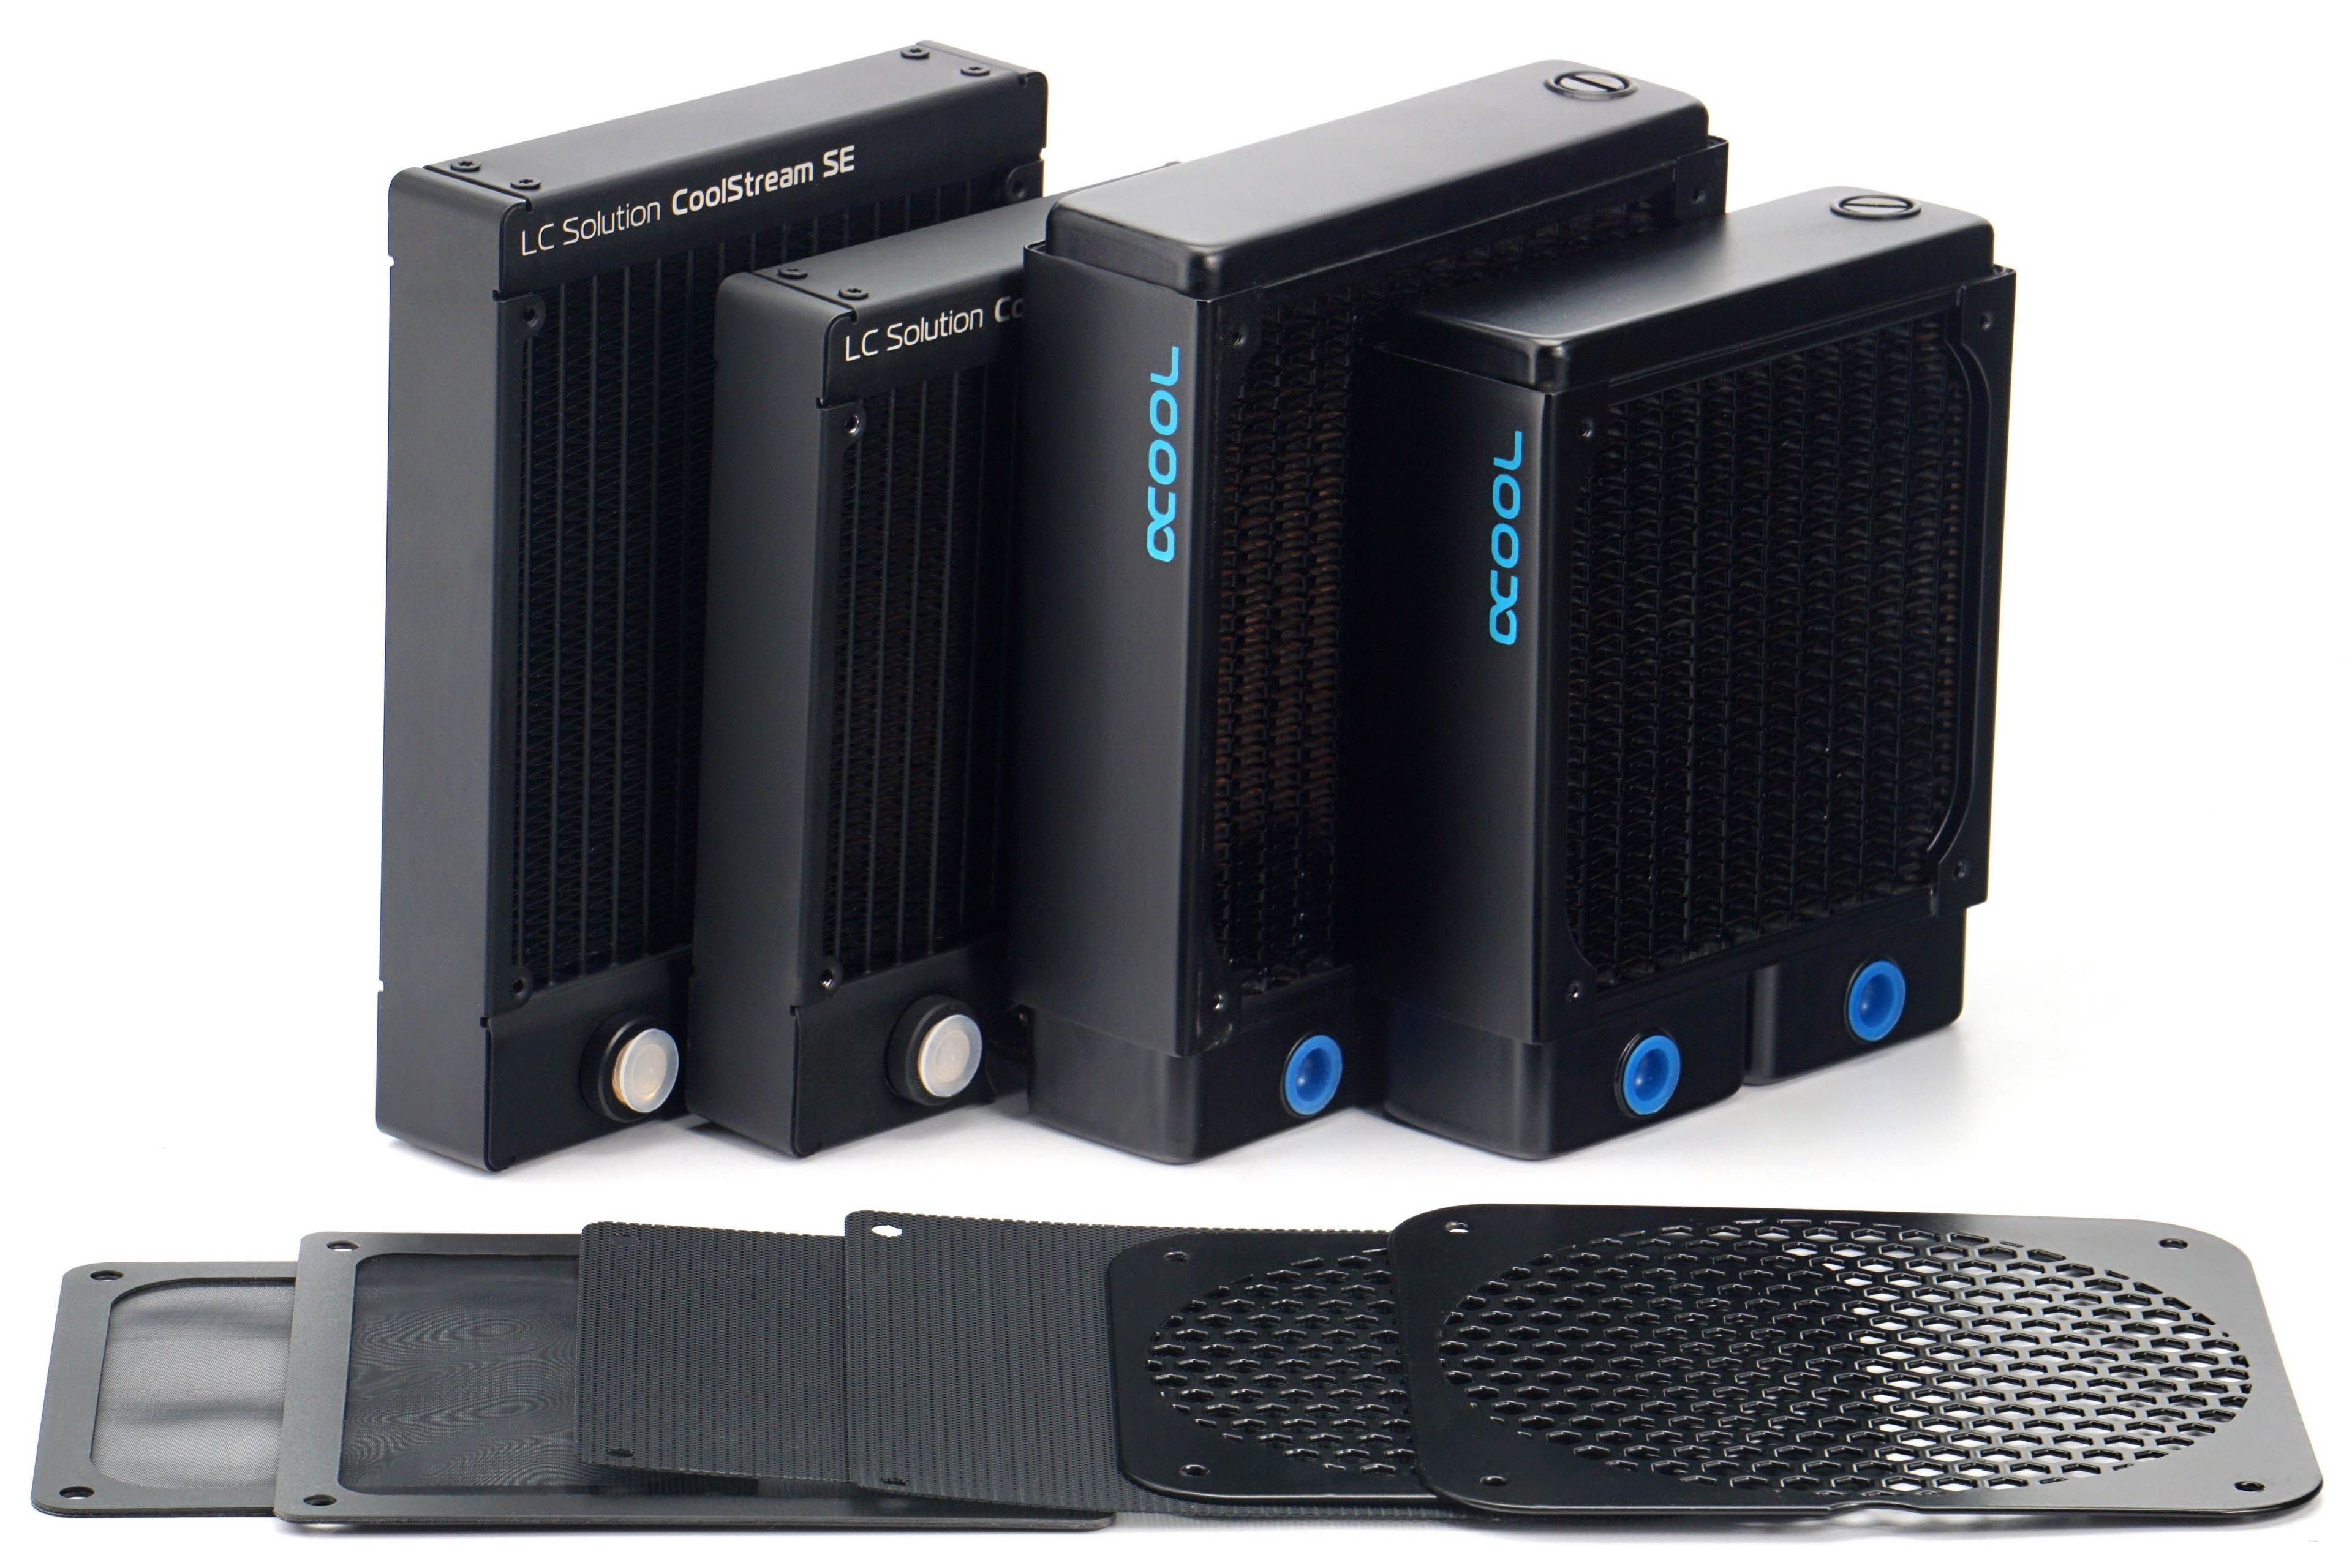
We use two radiators that differ in thickness and fin density. The EK CoolStream SE120/140 is 28 mm thick and the FPI is 22, the Alphacool NexXxoS XT45 v2 is thicker (45 mm) but with less FPI. CoolStream’s fin disposition is also similar in parameters to AIOs. The results on the NexXxoS will again be attractive for those who build their own water cooling loops, where the fans should work well even at low speeds – hence the lower fin density.
These obstacles and especially the radiators, but also the grilles, increase the mechanical resistance in front of the fan, resulting in higher noise levels. However, we will still tune the fan speeds to the specified noise levels of 31.5 to 45 dBA. Naturally, the speeds will always be lower than when testing without obstructions, but we will maintain the noise levels for clarity. The different noise levels with and without obstacles will only be at maximum power. In this mode it will also be nice to see how the fan design works with the obstacle and in which case the noise level increases more and in which less.
- Contents
- Cooler Master MasterFan SF120M in detail
- The basis of the methodology, the wind tunnel
- Mounting and vibration measurement
- Initial warm-up and speed recording
- Base 7 equal noise levels…
- .. and sound color (frequency characteristic)
- Static pressure measurement…
- … and airflow
- Everything changes with obstacles
- How we measure power draw and motor power
- Measuring the intensity (and power draw) of lighting
- Results: Speed
- Results: Airlow w/o obstacles
- Results: Airflow through a nylon filter
- Results: Airflow through a plastic filter
- Results: Airflow through a hexagonal grille
- Results: Airflow through a thinner radiator
- Results: Airflow through a thicker radiator
- Results: Static pressure w/o obstacles
- Results: Static pressure through a nylon filter
- Results: Static pressure through a plastic filter
- Results: Static pressure through a hexagonal grille
- Results: Static pressure through a thinner radiator
- Results: Static pressure through a thicker radiator
- Results: Static pressure, efficiency by orientation
- Reality vs. specifications
- Results: Frequency response of sound w/o obstacles
- Results: Frequency response of sound with a dust filter
- Results: Frequency response of sound with a hexagonal grille
- Results: Frequency response of sound with a radiator
- Results: Vibration, in total (3D vector length)
- Results: Vibration, X-axis
- Results: Vibration, Y-axis
- Results: Vibration, Z-axis
- Results: Power draw (and motor power)
- Results: Cooling performance per watt, airflow
- Results: Cooling performance per watt, static pressure
- Airflow per euro
- Static pressure per euro
- Results: Lighting – LED luminance and power draw
- Results: LED to motor power draw ratio
- Evaluation


It looks like the frequency response charts do not show.
Thanks for the heads up, it’s now corrected.
In some of the older articles in English, imperfect processing techniques combined with a lack of focus resulted in incorrect paths to the spectrograms being left in the source code. If you should come across something like that again, the original language version (there are graphs with EN descriptions anyway, you can get to it by clicking the flag in the upper right corner of the page) is always correct. Alternatively, the spectrograms of the individual fans can be accessed by entering the URL according to the format “name-of-the-fan-g***”, where the *** a number from the interval 233 to 244. Of course, this is only a temporary solution until we fix it (after you reporting it). But otherwise it must always work without such complications. 🙂
Thanks, I will keep it in mind if I encounter such an issue in the future and report it so that everyone can have it fixed.
I wanted to see the frequencies because of Noctua NF-A12x25 which has a highly disturbing peak right before 400 Hz. The frequency response of SF120M looks so much better at “33dB” in comparison. That’s why it would be great to have at least 1 sound sample per fan at 33dB, to judge the noise according to personal preference.
This is true, but the reason for this is that the SF120M has an overall “dropped” aerodynamic noise spectrum in this mode due to the higher tonal peaks of the motor and bearings. This is also why it achieves a lower airflow. If the test modes were aligned for equal airflow (i.e., the SF120M would have higher RPM), I expect that the NF-A12x25 might not be noisier even at 380 Hz.