


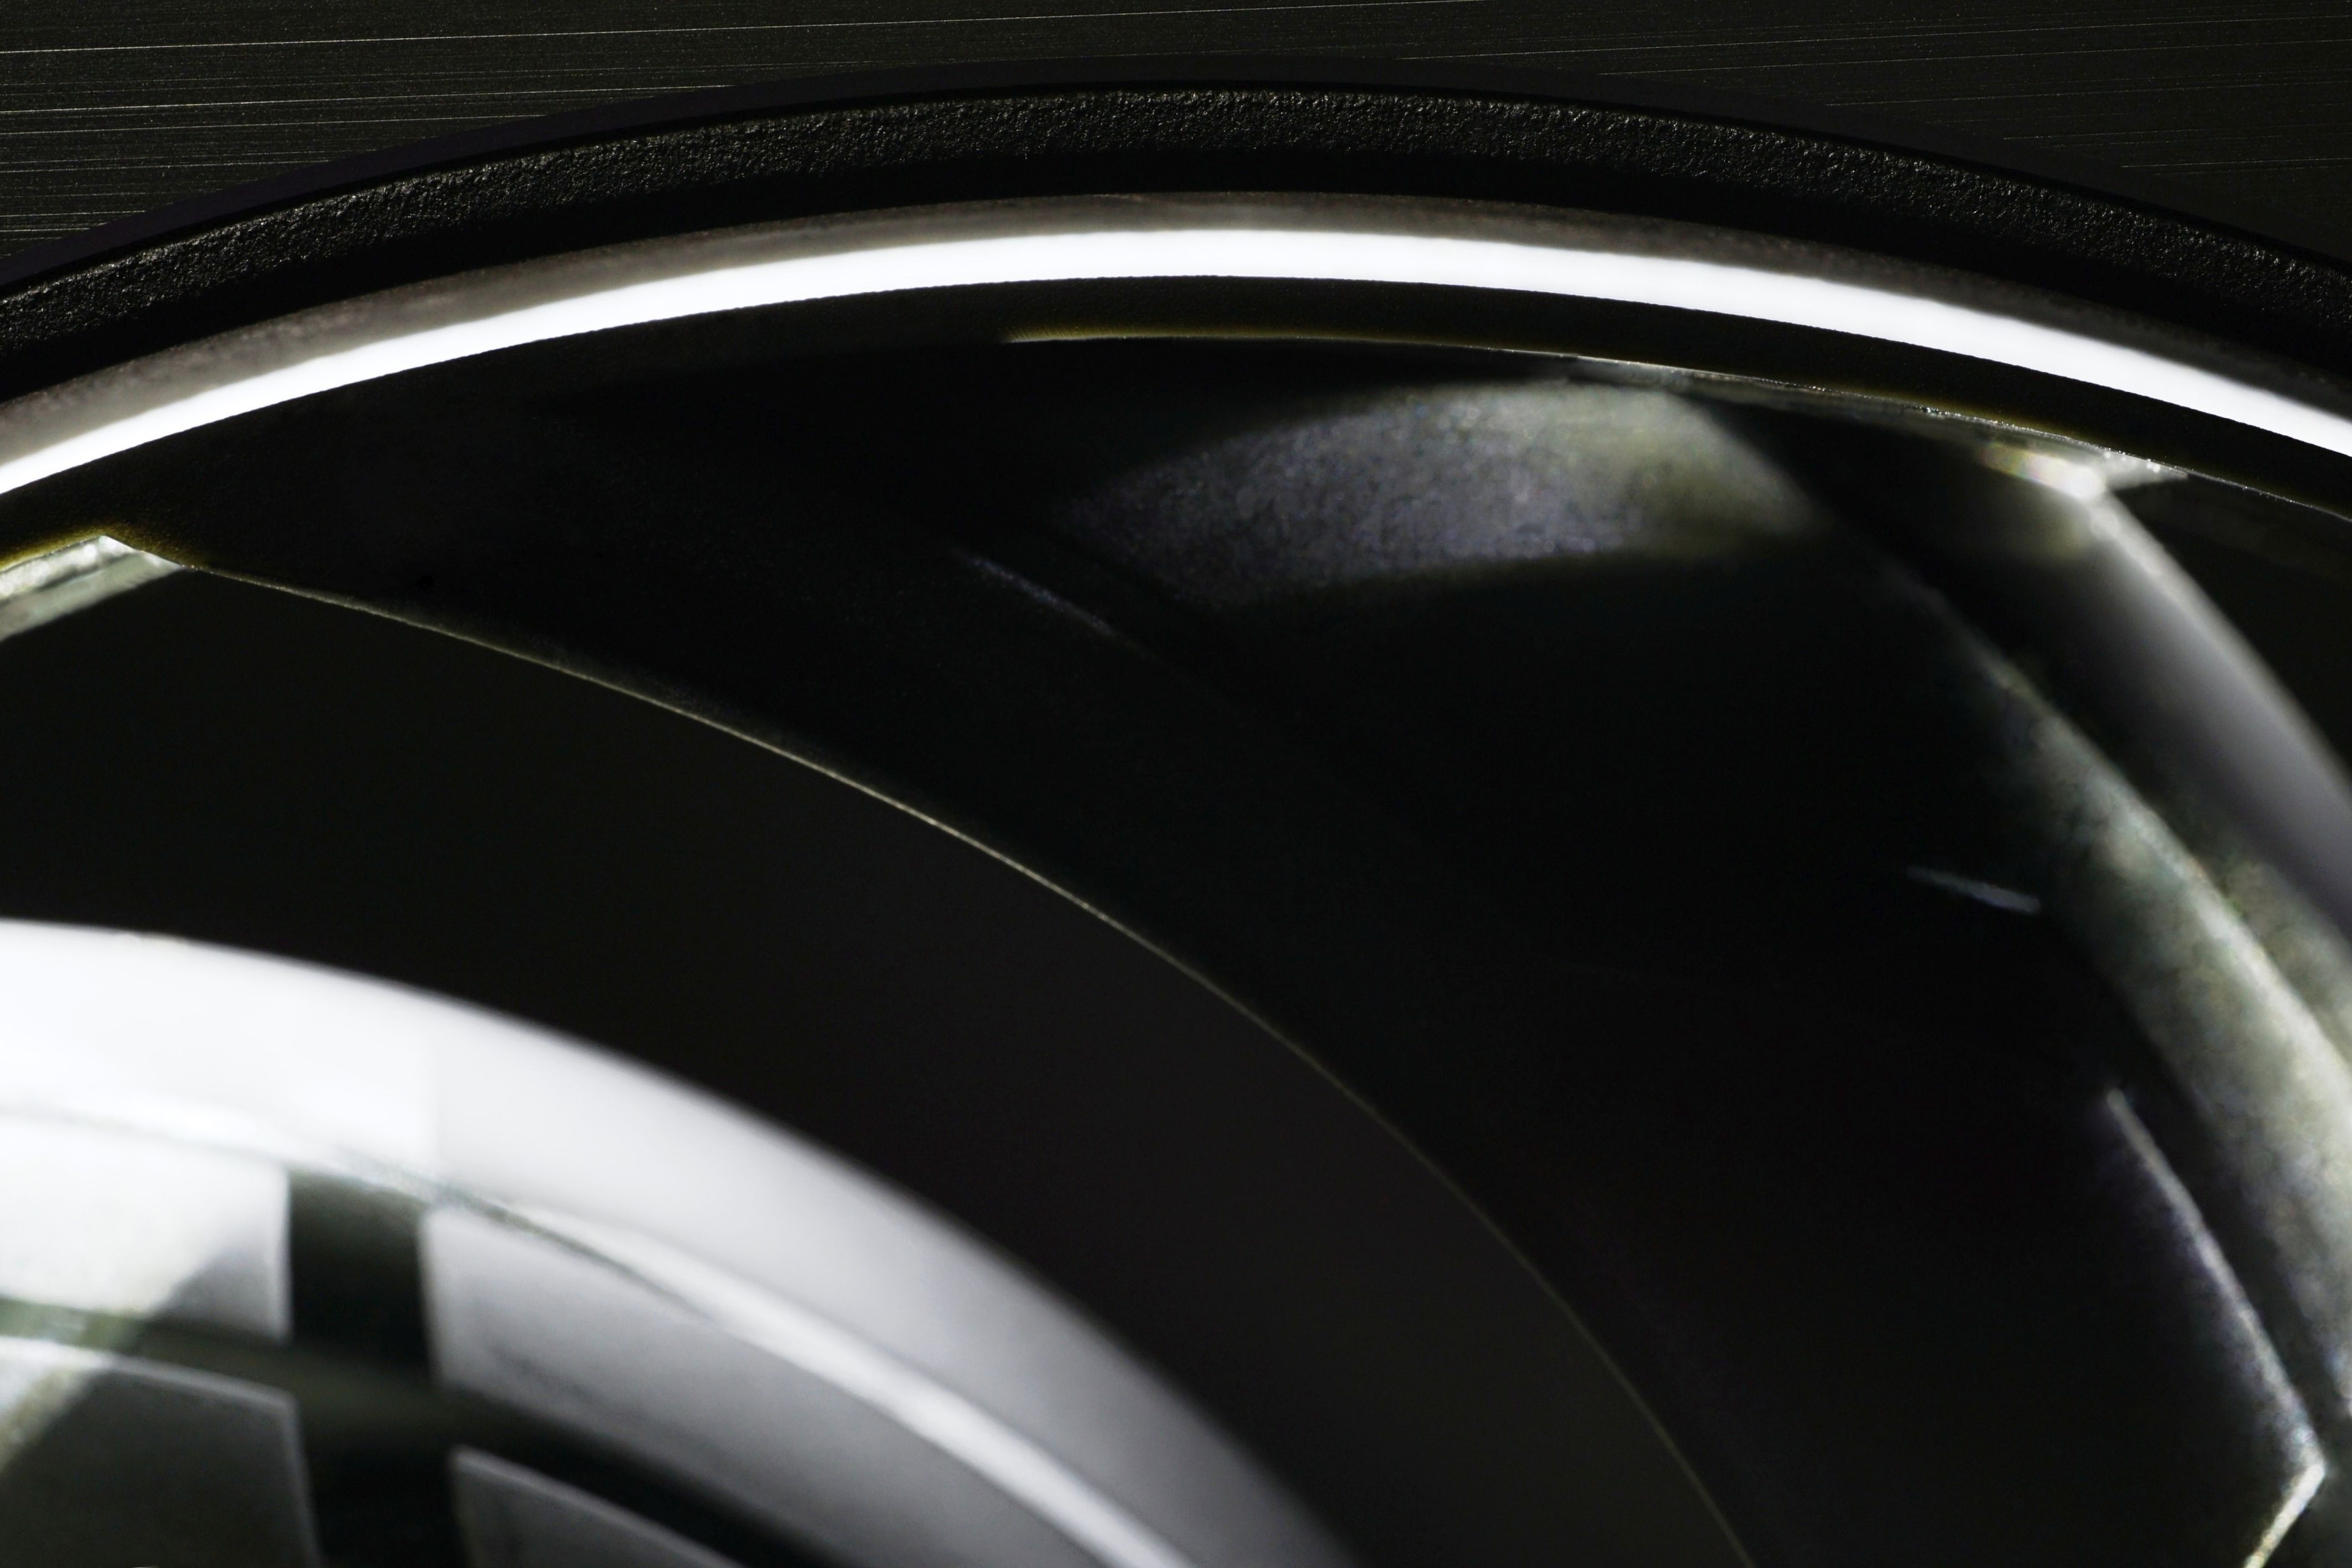
In HWCooling tests, there will no longer be uninteresting fans that serve “only” to build benchmarks. We have passed this phase. From now on, database building will have a different character and each additional fan will enrich the knowledge significantly. We’ll get right into the thick of it, with Cooler Master’s most expensive fan already riding the wave of the framed rotors that are coming in strong. And do you know why?
Results: Airlow w/o obstacles
Why is there a missing value sometimes? There may be more reasons. Usually it is because the fan could not be adjusted to the target noise level. Some have a higher minimum speed (or the speed is low, but the motor is too noisy) or it is a slower fan that will not reach the higher decibels. But the results in the graphs are also missing if the rotor is brushing against the nylon filter mesh. In that case, we evaluate this combination as incompatible. And zero in the graphs is naturally also in situations where we measure 0.00. This is a common occurrence at extremely low speeds with obstructions or within vibration measurements.


It looks like the frequency response charts do not show.
Thanks for the heads up, it’s now corrected.
In some of the older articles in English, imperfect processing techniques combined with a lack of focus resulted in incorrect paths to the spectrograms being left in the source code. If you should come across something like that again, the original language version (there are graphs with EN descriptions anyway, you can get to it by clicking the flag in the upper right corner of the page) is always correct. Alternatively, the spectrograms of the individual fans can be accessed by entering the URL according to the format “name-of-the-fan-g***”, where the *** a number from the interval 233 to 244. Of course, this is only a temporary solution until we fix it (after you reporting it). But otherwise it must always work without such complications. 🙂
Thanks, I will keep it in mind if I encounter such an issue in the future and report it so that everyone can have it fixed.
I wanted to see the frequencies because of Noctua NF-A12x25 which has a highly disturbing peak right before 400 Hz. The frequency response of SF120M looks so much better at “33dB” in comparison. That’s why it would be great to have at least 1 sound sample per fan at 33dB, to judge the noise according to personal preference.
This is true, but the reason for this is that the SF120M has an overall “dropped” aerodynamic noise spectrum in this mode due to the higher tonal peaks of the motor and bearings. This is also why it achieves a lower airflow. If the test modes were aligned for equal airflow (i.e., the SF120M would have higher RPM), I expect that the NF-A12x25 might not be noisier even at 380 Hz.