


You’ve already seen the tests of the Endorfy Corona 120 fans, and now we’re adding results for the “reverse” variants. The aerodynamic design is essentially the same—just… reversed. The emphasis on visual appeal is therefore even stronger. The colorful lighting is complemented by an element intended to make the result even more striking. You won’t see the stator struts interfering with the appearance.
Results: Frequency response of sound with a hexagonal grille
Measurements are conducted using TrueRTA, which captures audio data across 240 frequency bands within the 20–20,000 Hz range. To facilitate comparisons between articles, we extract and present the dominant frequency from each of three spectral bands: low (20–200 Hz), mid (201–2000 Hz), and high (2001–20,000 Hz) in standardized bar graphs.
However, for an even more detailed analysis of the sound expression, it is important to perceive the overall shape of the graph and the intensity of all frequencies/tones. If any aspects of the graphs or data tables are unclear, detailed interpretation guidelines are provided in this article.
Most fan-related acoustic activity occurs within the 70–7000 Hz range. Frequencies above 7000 Hz typically represent electromagnetic interference from the test environment, while the lowest bands below 70 Hz may also include such noise, albeit mixed with aerodynamic sound. Although we could exclude these frequency extremes, they are retained to detect and visualize potential anomalies.
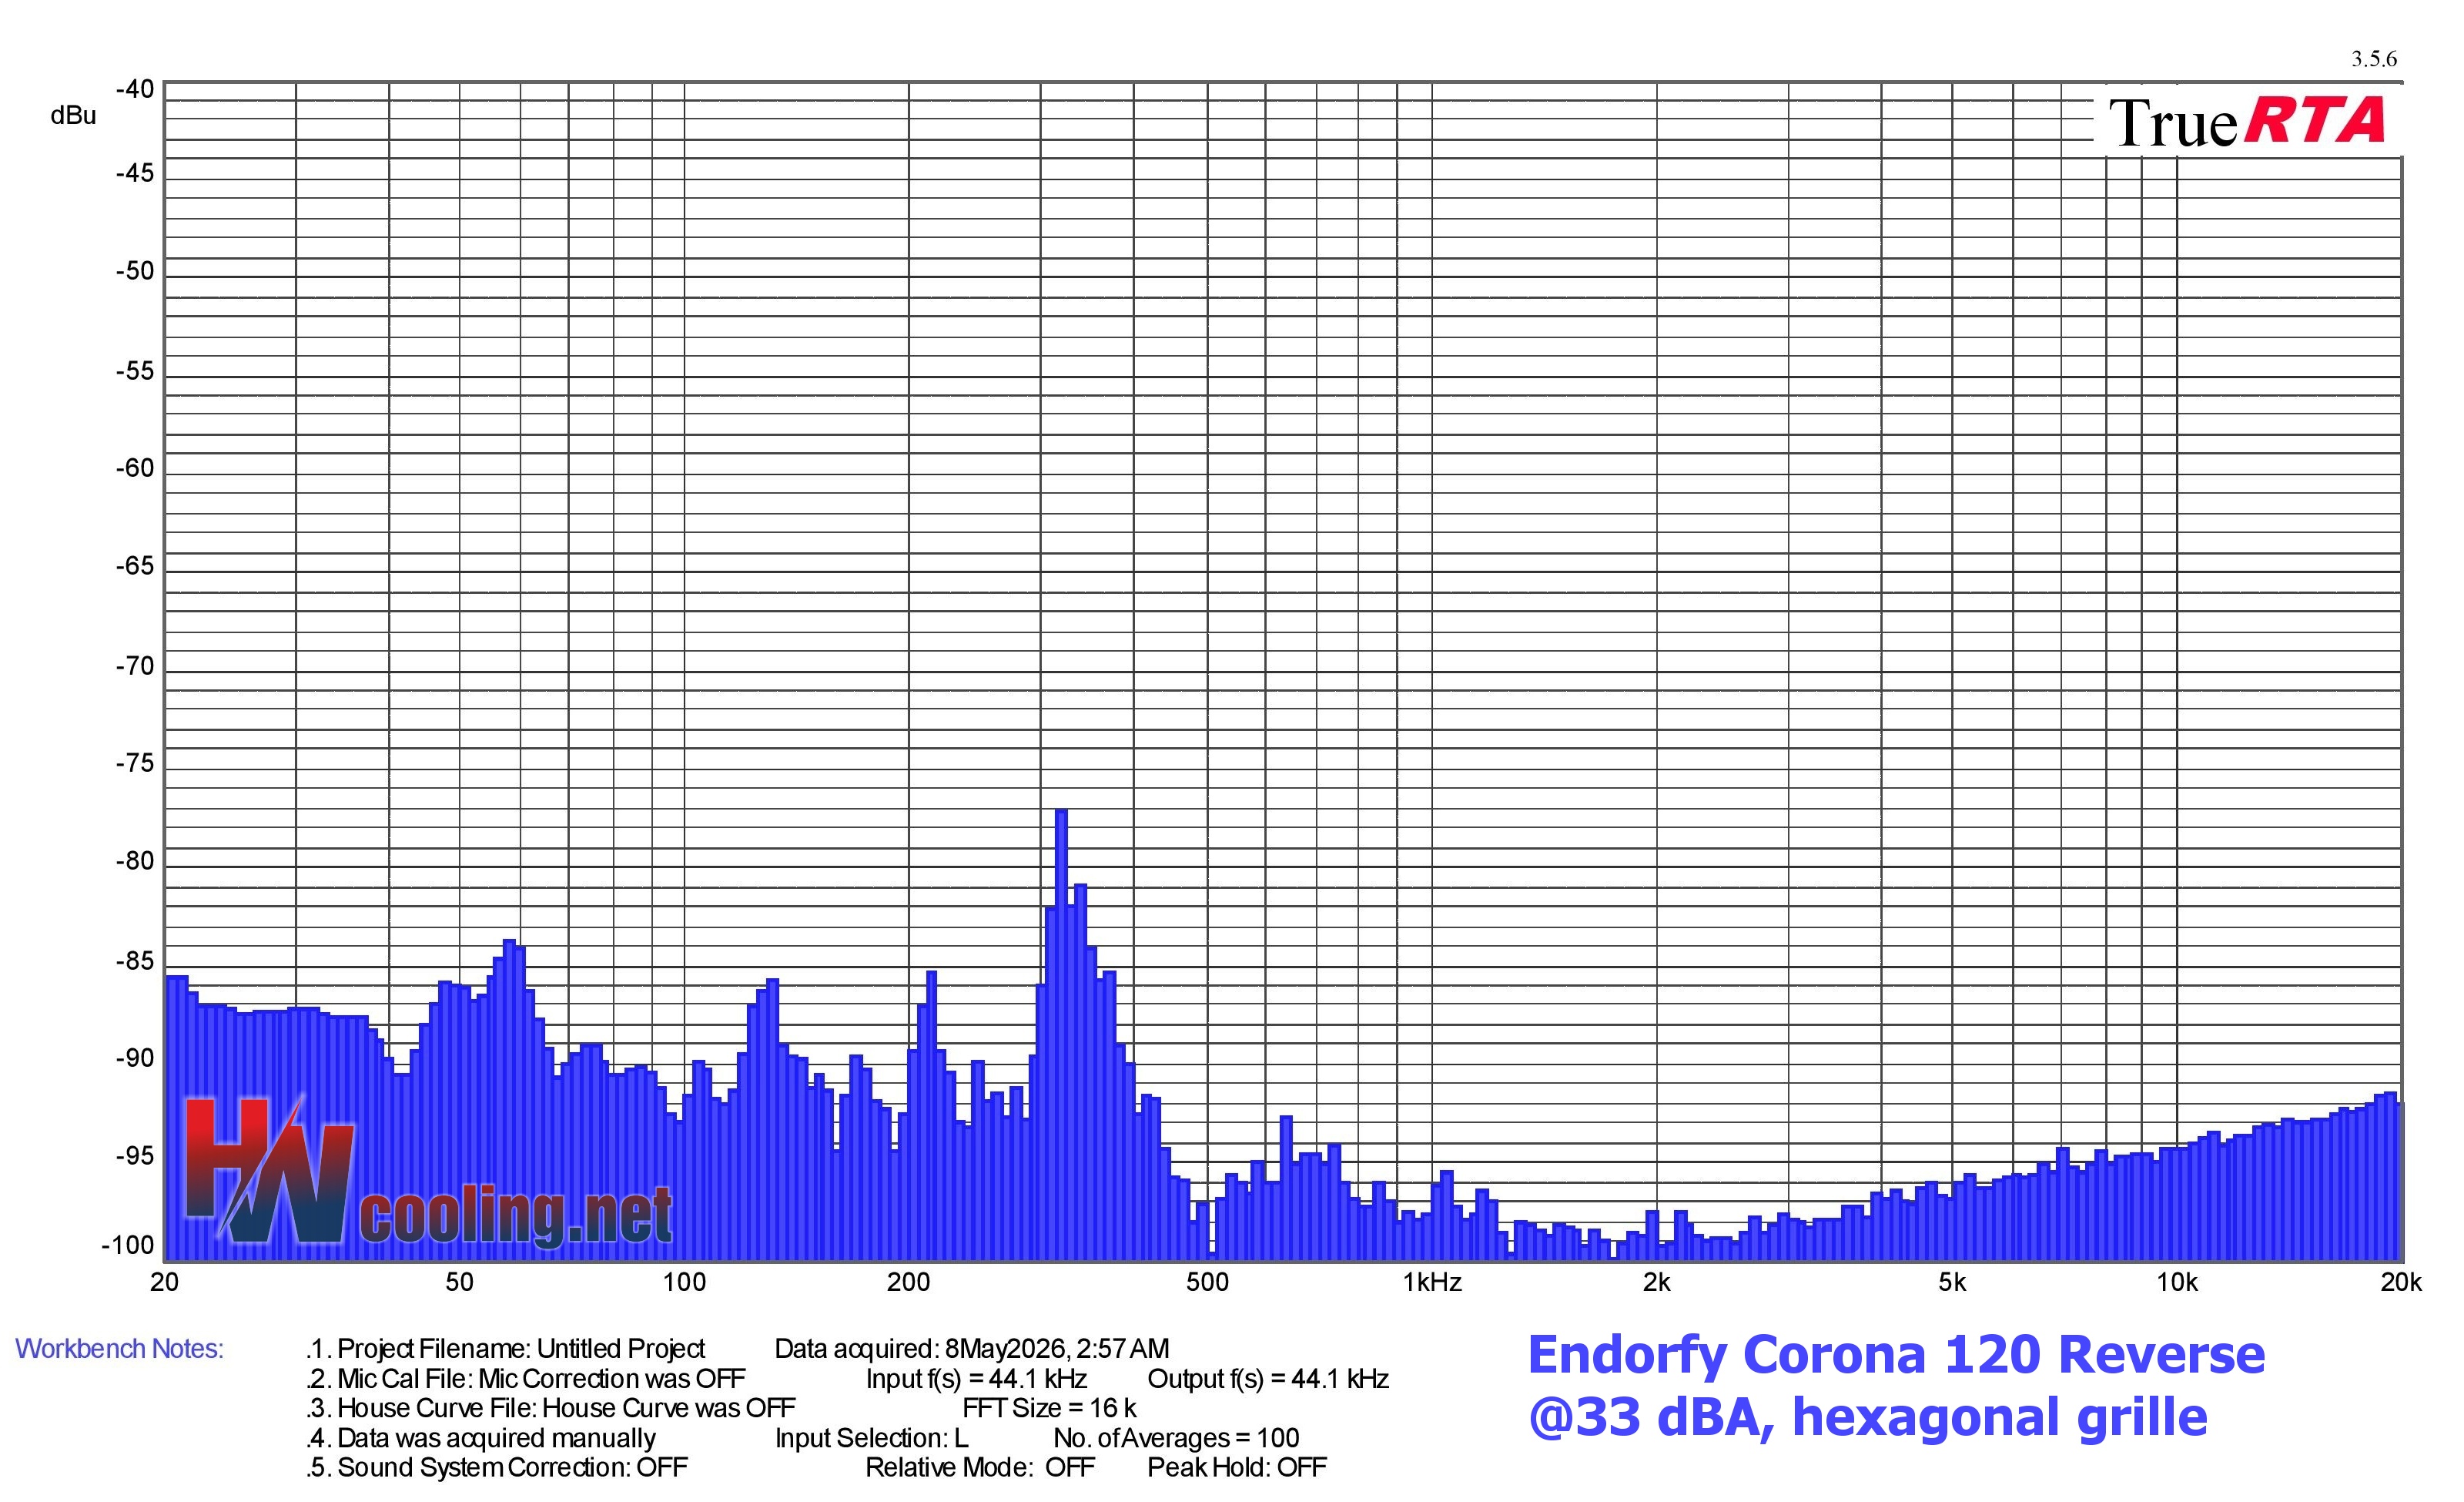
| Fan | Dominant sound freq. and noise level, hexagonal grille@33 dBA | ||||||
| Low range | Mid range | High range | |||||
| Frequency [Hz] | Noise level [dBu] | Frequency [Hz] | Noise level [dBu] | Frequency [Hz] | Noise level [dBu] | ||
| Endorfy Corona 120 Reverse | 58,2 | -83,7 | 320,0 | -77,1 | 19330,5 | -91,5 | |
| Endorfy Corona 120 | 100,8 | -78,5 | 369,7 | -83,0 | 19897,0 | -91,4 | |
| Asus ProArt PF120 | 59,9 | -81,8 | 329,4 | -73,6 | 18245,6 | -91,1 | |
| ID-Cooling AT-120-K | 50,4 | -79,2 | 369,7 | -86,9 | 5424,5 | -87,8 | |
| Antec Storm 120 | 50,4 | -79,4 | 359,2 | -78,1 | 19330,5 | -91,0 | |
| Endorfy Stratus 120 White PWM ARGB | 100,8 | -78,0 | 369,7 | -77,3 | 18780,2 | -91,0 | |
| DeepCool FD12 V2 | 50,4 | -79,1 | 369,7 | -79,8 | 19330,5 | -91,2 | |
| HAVN H12 | 50,4 | -78,1 | 369,7 | -76,3 | 19897,0 | -91,1 | |
| Arctic P12 Pro Reverse A-RGB | 50,4 | -77,7 | 369,7 | -83,6 | 18780,2 | -91,0 | |
| DeepCool FD12 | 50,4 | -76,9 | 329,4 | -77,8 | 19330,5 | -91,1 | |
| Noctua NF-S12A PWM | 50,4 | -78,3 | 369,7 | -79,5 | 19897,0 | -91,1 | |
| Thermaltake Toughfan 12 Pro | 47,6 | -77,6 | 339,0 | -83,7 | 18780,2 | -91,2 | |
| Asus Prime MR120 ARGB | 50,4 | -79,3 | 359,2 | -81,8 | 19330,5 | -91,0 | |
| Sudokoo Mach120 | 50,4 | -77,0 | 339,0 | -81,2 | 3319,9 | -84,8 | |
| Noctua NF-S12B redux-700 | 50,4 | -77,9 | 380,5 | -74,5 | 19330,5 | -90,9 | |
| CPS PCCooler F9 R120 | N/A | N/A | N/A | N/A | N/A | N/A | |
| Noctua NF-A12x15 PWM | 50,4 | -81,6 | 359,2 | -75,2 | 18780,2 | -91,3 | |
| Arctic P12 Pro A-RGB | 47,6 | -81,6 | 329,4 | -71,4 | 19897,0 | -91,3 | |
| Arctic P12 Pro | 50,4 | -81,8 | 329,4 | -72,4 | 19330,5 | -91,9 | |
| Fractal Design Momentum 12 RGB (Black) | 20,6 | -65,2 | 640,0 | -81,3 | 19330,5 | -91,0 | |
| Noctua NF-A12x25 G2 PWM | 25,6 | -79,0 | 369,7 | -79,9 | 19897,0 | -91,9 | |
| Fractal Design Momentum 12 (Black) | 50,4 | -81,2 | 369,7 | -81,5 | 19330,5 | -90,7 | |
| Thermalright TL-C12C | 20,6 | -71,4 | 380,5 | -79,3 | 19897,0 | -91,0 | |
| Adata XPG Vento Pro 120 PWM | 50,4 | -80,3 | 339,0 | -82,9 | 6639,8 | -89,8 | |
| CPS PCCooler F7 X120 | 109,9 | -81,9 | 369,7 | -81,8 | 19330,5 | -91,0 | |
| Arctic P12 Max (Black) rev. 2 | 63,5 | -76,4 | 320,0 | -79,3 | 18780,2 | -91,1 | |
| Arctic S12038-4K | 130,7 | -77,4 | 739,4 | -81,7 | 19897,0 | -91,1 | |
| Gigabyte Aorus EZ Chain Fan 120 Ice | 50,4 | -81,5 | 369,7 | -79,0 | 19330,5 | -91,1 | |
| BeQuiet! Pure Wings 3 (BL105) | 50,4 | -82,9 | 359,2 | -74,4 | 19330,5 | -90,9 | |
| Scythe Grand Tornado 120 | N/A | N/A | N/A | N/A | N/A | N/A | |
| DeepCool FT12 | 50,4 | -79,6 | 369,7 | -79,8 | 3948,1 | -89,9 | |
| Asus TUF Gaming TR120 (Reverse) | N/A | N/A | N/A | N/A | N/A | N/A | |
| PCCooler CPS F5 R120 BK | 130,7 | -73,9 | 369,7 | -71,1 | 18245,6 | -90,9 | |
| Seasonic MagFlow ARGB | 130,7 | -78,3 | 369,7 | -79,8 | 19330,5 | -90,8 | |
| BeQuiet! Pure Wings 3 (BL108) | 50,4 | -80,1 | 380,5 | -78,7 | 19897,0 | -90,8 | |
| Endorfy Stratus 120 PWM | 103,7 | -81,5 | 380,5 | -81,5 | 18780,2 | -90,8 | |
| Phanteks PH-F120T30 | 47,6 | -80,7 | 369,7 | -77,8 | 19330,5 | -90,8 | |
| BeQuiet! Light Wings White (BL101) | 50,4 | -81,7 | 369,7 | -83,0 | 19330,5 | -90,6 | |
| Scythe Kaze Flex II 120 | 50,4 | -80,6 | 369,7 | -82,6 | 19330,5 | -90,6 | |
| Valkyrie X12 | 50,4 | -80,7 | 232,9 | -81,2 | 19330,5 | -90,7 | |
| Arctic P12 PWM PST A-RGB | 50,4 | -79,9 | 329,4 | -73,8 | 19330,5 | -90,8 | |
| Scythe Kaze Flex II 120 Slim | 50,4 | -80,9 | 359,2 | -80,0 | 19330,5 | -90,9 | |
| Seasonic MagFlow 1225 PWM | N/A | N/A | N/A | N/A | N/A | N/A | |
| Arctic P12 PWM PST rev. 1 | 77,7 | -72,1 | 391,7 | -76,8 | 19330,5 | -90,9 | |
| Cooler Master Mobius 120 OC | 41,8 | -74,4 | 1107,9 | -74,8 | 19330,5 | -90,7 | |
| Corsair AF120 RGB Elite | 50,4 | -69,6 | 339,0 | -73,3 | 19330,5 | -90,8 | |
| Enermax SquA RGB White | 123,4 | -82,4 | 369,7 | -74,5 | 19330,5 | -90,8 | |
| Arctic P12 Slim PWM PST | 100,8 | -84,3 | 369,7 | -74,2 | 18780,2 | -90,7 | |
| DeepCool FK120 | N/A | N/A | N/A | N/A | N/A | N/A | |
| Asus TUF Gaming TF120 | 67,3 | -86,0 | 349,0 | -76,6 | 18780,2 | -90,8 | |
| BeQuiet! Light Wings (BL072) | 89,8 | -84,0 | 349,0 | -77,8 | 19330,5 | -90,8 | |
| DeepCool FC120 | 195,8 | -72,9 | 201,6 | -82,1 | 19330,5 | -91,0 | |
| Nidec Servo Gentle Typhoon D1225C (2150/12) | 50,4 | -78,9 | 369,7 | -86,1 | 19897,0 | -90,7 | |
| BeQuiet! Shadow Wings 2 (BL085) | 50,4 | -80,3 | 349,0 | -75,7 | 19330,5 | -90,7 | |
| Noctua NF-A12x25 PWM | 50,4 | -81,2 | 369,7 | -81,0 | 18780,2 | -90,8 | |
| Corsair AF120 Elite (black) | 49,0 | -80,0 | 339,0 | -78,2 | 19330,5 | -90,8 | |
| Cooler Master MasterFan SF120M | 41,8 | -72,3 | 380,5 | -83,1 | 4305,4 | -90,7 | |
| Akasa Alucia SC12 | 41,8 | -80,9 | 369,7 | -80,6 | 19897,0 | -90,9 | |
| BeQuiet! Silent Wings Pro 4 (BL098) | 47,6 | -75,2 | 329,4 | -74,9 | 19330,5 | -90,8 | |
| Thermalright X-Silent 120 | 50,4 | -77,7 | 339 | -76,0 | 18780,2 | -90,9 | |
| Fractal Design Aspect 12 RGB PWM | 59,9 | -78,7 | 349,0 | -69,8 | 19330,5 | -90,7 | |
| BeQuiet! Silent Wings 3 (BL066) | 49,0 | 79,3 | 329,4 | 78,9 | 19897,0 | -90,8 | |
| Gelid Zodiac | 50,4 | -81,0 | 339,0 | -78,7 | 19330,5 | -90,7 | |
| Fractal Design Dynamic X2 GP-12 PWM | 38,9 | -75,4 | 339,0 | -79,5 | 18780,243 | -90,9 | |
| BeQuiet! Pure Wings 2 (BL039) | 47,6 | -79,7 | 380,5 | -81,2 | 19330,5 | -90,9 | |
| Gigabyte Aorus 120 ARGB | 146,7 | -82,0 | 369,7 | -82,0 | 19330,5 | -90,9 | |
| Arctic BioniX P120 A-RGB | 169,5 | -84,7 | 329,4 | -70,5 | 19330,5 | -90,8 | |
| Akasa OTTO SF12 | N/A | N/A | N/A | N/A | N/A | N/A | |
| Cooler Master SickleFlow 120 ARGB | 47,6 | -82,0 | 1076,3 | -81,9 | 18780,2 | -90,9 | |
| Alphacool SL-15 PWM | N/A | N/A | N/A | N/A | N/A | N/A | |
| Arctic BioniX F120 | 169,5 | -84,7 | 329,4 | -70,5 | 19330,5 | -90,8 | |
| SilverStone SST-AP123 | 58,2 | -80,8 | 302,0 | -77,3 | 19897,0 | -90,8 | |
| Noctua NF-P12 redux-1700 PWM | 100,8 | -81,6 | 329,4 | -69,8 | 19897,0 | -90,9 | |
| SilentiumPC Fluctus 120 PWM | 100,8 | -82,7 | 369,7 | -79,9 | 19330,5 | -90,8 | |
| MSI MEG Silent Gale P12 | 100,8 | -81,2 | 369,7 | -80,3 | 19330,5 | -91,0 | |
| Asus ROG Strix XF120 | 38,9 | -79,7 | 349,0 | -72,4 | 19897,0 | -90,9 | |
| Akasa Vegas X7 | 100,8 | -85,3 | 359,2 | -80,3 | 19330,5 | -90,9 | |
| Reeven Coldwing 12 | 92,4 | -79,8 | 369,7 | -79,7 | 19897,0 | -90,9 | |
| Reeven Kiran | 97,9 | -84,4 | 391,7 | -77,8 | 19897,0 | -90,8 | |
| SilentiumPC Sigma Pro 120 PWM | N/A | N/A | N/A | N/A | N/A | N/A | |
| SilentiumPC Sigma Pro Corona RGB 120 | 92,4 | -83,0 | 369,7 | -77,9 | 18780,2 | -90,8 | |
| SilverStone SST-AP121 | 113,1 | -80,9 | 246,8 | -84,0 | 19330,5 | -90,9 | |
| SilverStone SST-FQ121 | 38,9 | -76,9 | 1522,2 | -81,7 | 18780,2 | -90,9 | |
| Xigmatek XLF-F1256 | 63,5 | -83,3 | 380,5 | -78,8 | 19897,0 | -90,9 |
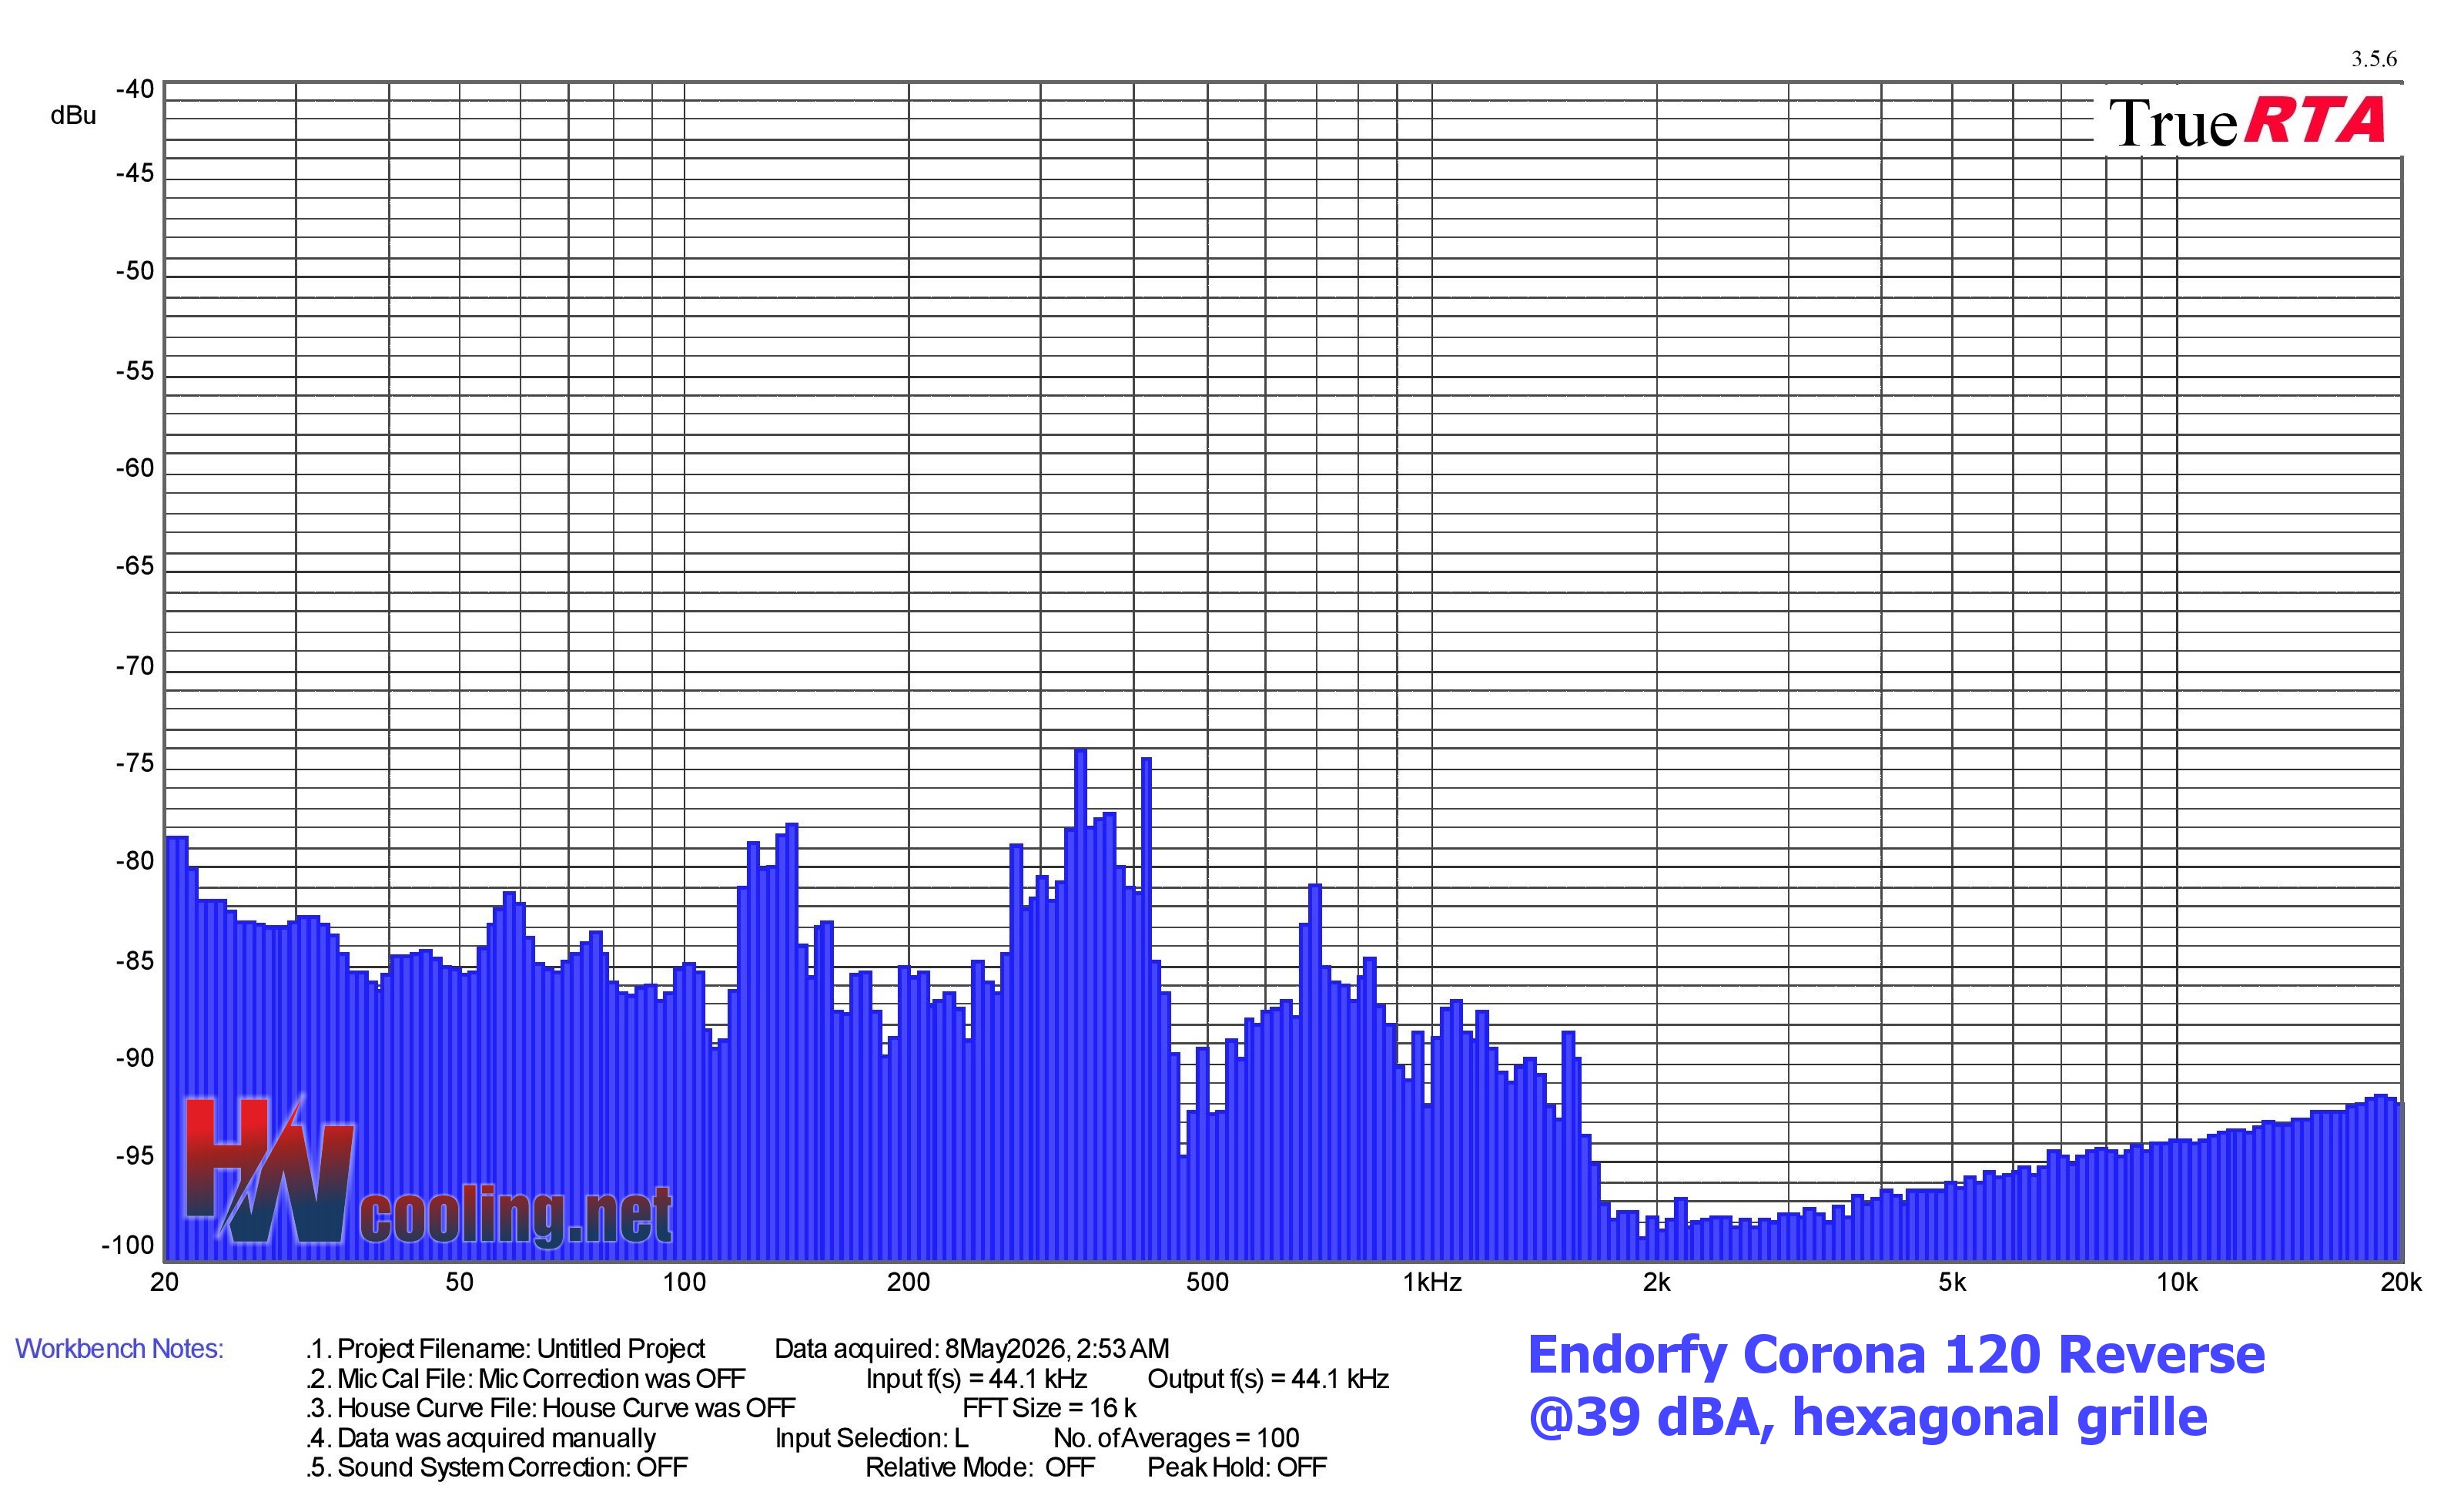
| Fan | Dominant sound freq. and noise level, hexagonal grille@39 dBA | ||||||
| Low range | Mid range | High range | |||||
| Frequency [Hz] | Noise level [dBu] | Frequency [Hz] | Noise level [dBu] | Frequency [Hz] | Noise level [dBu] | ||
| Endorfy Corona 120 Reverse | 138,5 | -77,8 | 339,0 | -74,1 | 18780,2 | -91,6 | |
| Endorfy Corona 120 | 130,7 | -75,0 | 369,7 | -76,8 | 18780,2 | -91,9 | |
| Asus ProArt PF120 | 100,8 | -80,6 | 586,9 | -73,9 | 18245,6 | -91,0 | |
| ID-Cooling AT-120-K | 100,8 | -78,2 | 339,0 | -66,2 | 5424,5 | -87,2 | |
| Antec Storm 120 | 89,8 | -79,5 | 369,7 | -65,2 | 19330,5 | -91,1 | |
| Endorfy Stratus 120 White PWM ARGB | 130,7 | -79,1 | 369,7 | -70,7 | 19330,5 | -91,2 | |
| DeepCool FD12 V2 | 130,7 | -72,9 | 369,7 | -72,9 | 18245,6 | -91,0 | |
| HAVN H12 | 50,4 | -77,4 | 369,7 | -72,9 | 18780,2 | -91,0 | |
| Arctic P12 Pro Reverse A-RGB | 71,3 | -74,6 | 349,0 | -67,2 | 19330,5 | -91,2 | |
| DeepCool FD12 | 50,4 | -77,1 | 369,7 | -73,3 | 18780,2 | -90,9 | |
| Noctua NF-S12A PWM | 50,4 | -77,8 | 369,7 | -70,6 | 18780,2 | -91,0 | |
| Thermaltake Toughfan 12 Pro | 127,0 | -71,9 | 570,2 | -70,5 | 19897,0 | -91,2 | |
| Asus Prime MR120 ARGB | 47,6 | -74,1 | 359,2 | -76,2 | 18780,2 | -91,2 | |
| Sudokoo Mach120 | 50,4 | -78,3 | 369,7 | -72,4 | 3319,9 | -87,0 | |
| Noctua NF-S12B redux-700 | 84,8 | -76,7 | 369,7 | -70,5 | 19897,0 | -91,0 | |
| CPS PCCooler F9 R120 | 84,8 | -72,7 | 369,7 | -74,0 | 19897,0 | -91,1 | |
| Noctua NF-A12x15 PWM | 20,6 | -86,1 | 403,2 | -68,2 | 19330,5 | -91,2 | |
| Arctic P12 Pro A-RGB | 50,4 | -82,6 | 339,0 | -65,9 | 19330,5 | -91,3 | |
| Arctic P12 Pro | 20,6 | -78,7 | 349,0 | -72,6 | 17726,2 | -92,9 | |
| Fractal Design Momentum 12 RGB (Black) | 20,6 | -56,9 | 380,5 | -78,1 | 19897,0 | -92,4 | |
| Noctua NF-A12x25 G2 PWM | 31,3 | -78,4 | 640,0 | -74,0 | 19330,5 | -93,7 | |
| Fractal Design Momentum 12 (Black) | 20,6 | -73,1 | 369,7 | -85,7 | 19330,5 | -91,4 | |
| Thermalright TL-C12C | 49,7 | -80,7 | 380,5 | -72,7 | 18780,2 | -91,7 | |
| Adata XPG Vento Pro 120 PWM | 155,4 | -70,7 | 310,9 | -72,9 | 6639,8 | -87,2 | |
| CPS PCCooler F7 X120 | 20,6 | -62,0 | 369,7 | -75,6 | 19330,5 | -90,8 | |
| Arctic P12 Max (Black) rev. 2 | 20,6 | -64,0 | 369,7 | -74,6 | 19897,0 | -91.0 | |
| Arctic S12038-4K | 151,0 | -75,7 | 239,7 | -82,1 | 19330,5 | -91,0 | |
| Gigabyte Aorus EZ Chain Fan 120 Ice | 138,5 | -76,0 | 369,7 | -72,5 | 19897,0 | -91,1 | |
| BeQuiet! Pure Wings 3 (BL105) | 50,4 | -78,3 | 359,2 | -64,3 | 18245,6 | -90,9 | |
| Scythe Grand Tornado 120 | 59,9 | -82,1 | 339,0 | -71,1 | 19897,0 | -91,3 | |
| DeepCool FT12 | N/A | N/A | N/A | N/A | N/A | N/A | |
| Asus TUF Gaming TR120 (Reverse) | 50,4 | -80,9 | 349,0 | -66,8 | 18780,2 | -90,9 | |
| PCCooler CPS F5 R120 BK | 130,7 | -73,9 | 369,7 | -71,1 | 18245,6 | -90,9 | |
| Thermaltake Toughfan 14 Pro | 50,4 | -77,1 | 380,5 | -71,9 | 19330,5 | -91,0 | |
| Fractal Design Venturi HP-14 PWM | 41,8 | -73,1 | 369,7 | -64,8 | 19897,0 | -91,0 | |
| Seasonic MagFlow ARGB | 20,6 | -74,2 | 369,7 | -72,8 | 18780,2 | -90,9 | |
| BeQuiet! Pure Wings 3 (BL108) | 50,4 | -78,7 | 339,0 | -68,7 | 19330,5 | -90,8 | |
| Endorfy Stratus 120 PWM | 123,4 | -77,7 | 369,7 | -69,7 | 19330,5 | -90,8 | |
| Phanteks PH-F120T30 | 50,4 | -80,4 | 369,7 | -74,0 | 19330,5 | -90,9 | |
| BeQuiet! Light Wings White (BL101) | 151,0 | -80,5 | 339,0 | -68,8 | 19330,5 | -90,7 | |
| Scythe Kaze Flex II 120 | 50,4 | -79,8 | 369,7 | -73,4 | 19330,5 | -90,8 | |
| Valkyrie X12 | 160,0 | -77,3 | 320,0 | -70,4 | 19897,0 | -90,7 | |
| Arctic P12 PWM PST A-RGB | 89,8 | -77,2 | 369,7 | -74,7 | 19330,5 | -90,8 | |
| Scythe Kaze Flex II 120 Slim | 119,9 | -79,9 | 479,5 | -72,9 | 19897,0 | -90,8 | |
| Seasonic MagFlow 1225 PWM | 123,4 | -77,7 | 380,5 | -72,5 | 19897,0 | -90,6 | |
| Arctic P12 PWM PST rev. 1 | 103,7 | -66,5 | 415,0 | -67,8 | 19330,5 | -91,0 | |
| Cooler Master Mobius 120 OC | 55,0 | -78,9 | 369,7 | -74,7 | 18780,2 | -90,7 | |
| Corsair AF120 RGB Elite | 146,7 | -71,6 | 339,0 | -72,7 | 19330,5 | -90,8 | |
| Enermax SquA RGB White | 119,9 | -78,9 | 369,7 | -68,4 | 19330,5 | -90,8 | |
| Arctic P12 Slim PWM PST | 89,8 | -81,7 | 380,5 | -67,4 | 18780,2 | -90,7 | |
| DeepCool FK120 | 130,7 | -76,5 | 293,4 | -73,4 | 18780,2 | -91,1 | |
| Asus TUF Gaming TF120 | 50,4 | -81,1 | 349,0 | -67,8 | 19330,5 | -90,9 | |
| BeQuiet! Light Wings (BL072) | 130,7 | -78,6 | 697,9 | -72,4 | 19330,5 | -90,9 | |
| DeepCool FC120 | 190,3 | -75,8 | 570,2 | -74,8 | 19330,5 | -90,7 | |
| Nidec Servo Gentle Typhoon D1225C (2150/12) | 151,0 | -72,5 | 302,0 | -64,7 | 18780,2 | -90,9 | |
| BeQuiet! Shadow Wings 2 (BL085) | 71,3 | -85,6 | 339,0 | -72,8 | 19330,5 | -90,8 | |
| Noctua NF-A12x25 PWM | 20,3 | -78,4 | 369,7 | -72,3 | 19330,5 | -90,9 | |
| Corsair AF120 Elite (black) | 138,5 | -73,2 | 369,7 | -73,5 | 19897,0 | -90,8 | |
| Cooler Master MasterFan SF120M | 95,1 | -79,1 | 380,5 | -72,7 | 4305,4 | -89,6 | |
| Akasa Alucia SC12 | 50,4 | -80,5 | 369,7 | -72,6 | 19897,0 | -90,9 | |
| BeQuiet! Silent Wings Pro 4 (BL098) | 155,4 | -78,6 | 339,0 | -71,3 | 2712,2 | -87,9 | |
| Thermalright X-Silent | 89,8 | -77,8 | 359,2 | -68,8 | 18780,2 | -91,0 | |
| Fractal Design Aspect 12 RGB PWM | 50,4 | -82,7 | 380,5 | -68,7 | 19330,5 | -90,8 | |
| BeQuiet! Silent Wings 3 (BL066) | 58,2 | -78,5 | 339,0 | -73,2 | 18780,2 | -90,9 | |
| Gelid Zodiac | 50,4 | -80,5 | 380,5 | -73,2 | 19330,5 | -91,0 | |
| Fractal Design Dynamic X2 GP-12 PWM | 50,4 | -80,4 | 320,0 | -65,3 | 19330,5 | -90,8 | |
| BeQuiet! Pure Wings 2 (BL039) | 59,9 | -79,0 | 369,7 | -73,3 | 18780,2 | -90,8 | |
| Gigabyte Aorus 120 ARGB | 138,5 | -81,5 | 369,7 | -73,2 | 18780,2 | -90,9 | |
| Arctic BioniX P120 A-RGB | 151,0 | -82,0 | 219,8 | -62,2 | 19330,5 | -90,9 | |
| Akasa OTTO SF12 | N/A | N/A | N/A | N/A | N/A | N/A | |
| Cooler Master SickleFlow 120 ARGB | 130,7 | -81,8 | 369,7 | -75,4 | 2152,7 | -90,4 | |
| Alphacool SL-15 PWM | 146,7 | -76,8 | 369,7 | -73,2 | 18780,2 | -91,0 | |
| Arctic BioniX F120 | 47,6 | -82,0 | 369,7 | -72,0 | 19330,5 | -90,9 | |
| SilverStone SST-AP123 | 100,8 | -80,7 | 339,0 | -73,4 | 18780,2 | -90,9 | |
| Noctua NF-P12 redux-1700 PWM | 116,5 | -76,8 | 339,0 | -69,4 | 19330,5 | -90,8 | |
| SilentiumPC Fluctus 120 PWM | 146,7 | -78,0 | 586,9 | -72,7 | 18780,2 | -91,0 | |
| MSI MEG Silent Gale P12 | 164,7 | -80,6 | 339,0 | -71,1 | 19330,5 | -91,0 | |
| Asus ROG Strix XF120 | 92,4 | -77,5 | 369,7 | -70,1 | 19330,5 | -91,2 | |
| Akasa Vegas X7 | 31,3 | -84,3 | 369,7 | -74,3 | 18780,2 | -90,8 | |
| Reeven Coldwing 12 | 123,4 | -71,2 | 380,5 | -71,3 | 18780,2 | -90,9 | |
| Reeven Kiran | 127,0 | -77,7 | 380,5 | -73,4 | 19330,5 | -90,8 | |
| SilentiumPC Sigma Pro 120 PWM | 63,5 | -83,4 | 380,5 | -74,0 | 2347,5 | -83,8 | |
| SilentiumPC Sigma Pro Corona RGB 120 | 134,5 | -72,0 | 369,7 | -75,1 | 19897,0 | -90,8 | |
| SilverStone SST-AP121 | 53,4 | -81,9 | 380,5 | -70,8 | 19330,5 | -91,0 | |
| SilverStone SST-FQ121 | 41,8 | -78,9 | 369,7 | -75,0 | 19330,5 | -91,1 | |
| Xigmatek XLF-F1256 | 50,4 | -70,3 | 246,8 | -72,7 | 19897,0 | -90,9 |
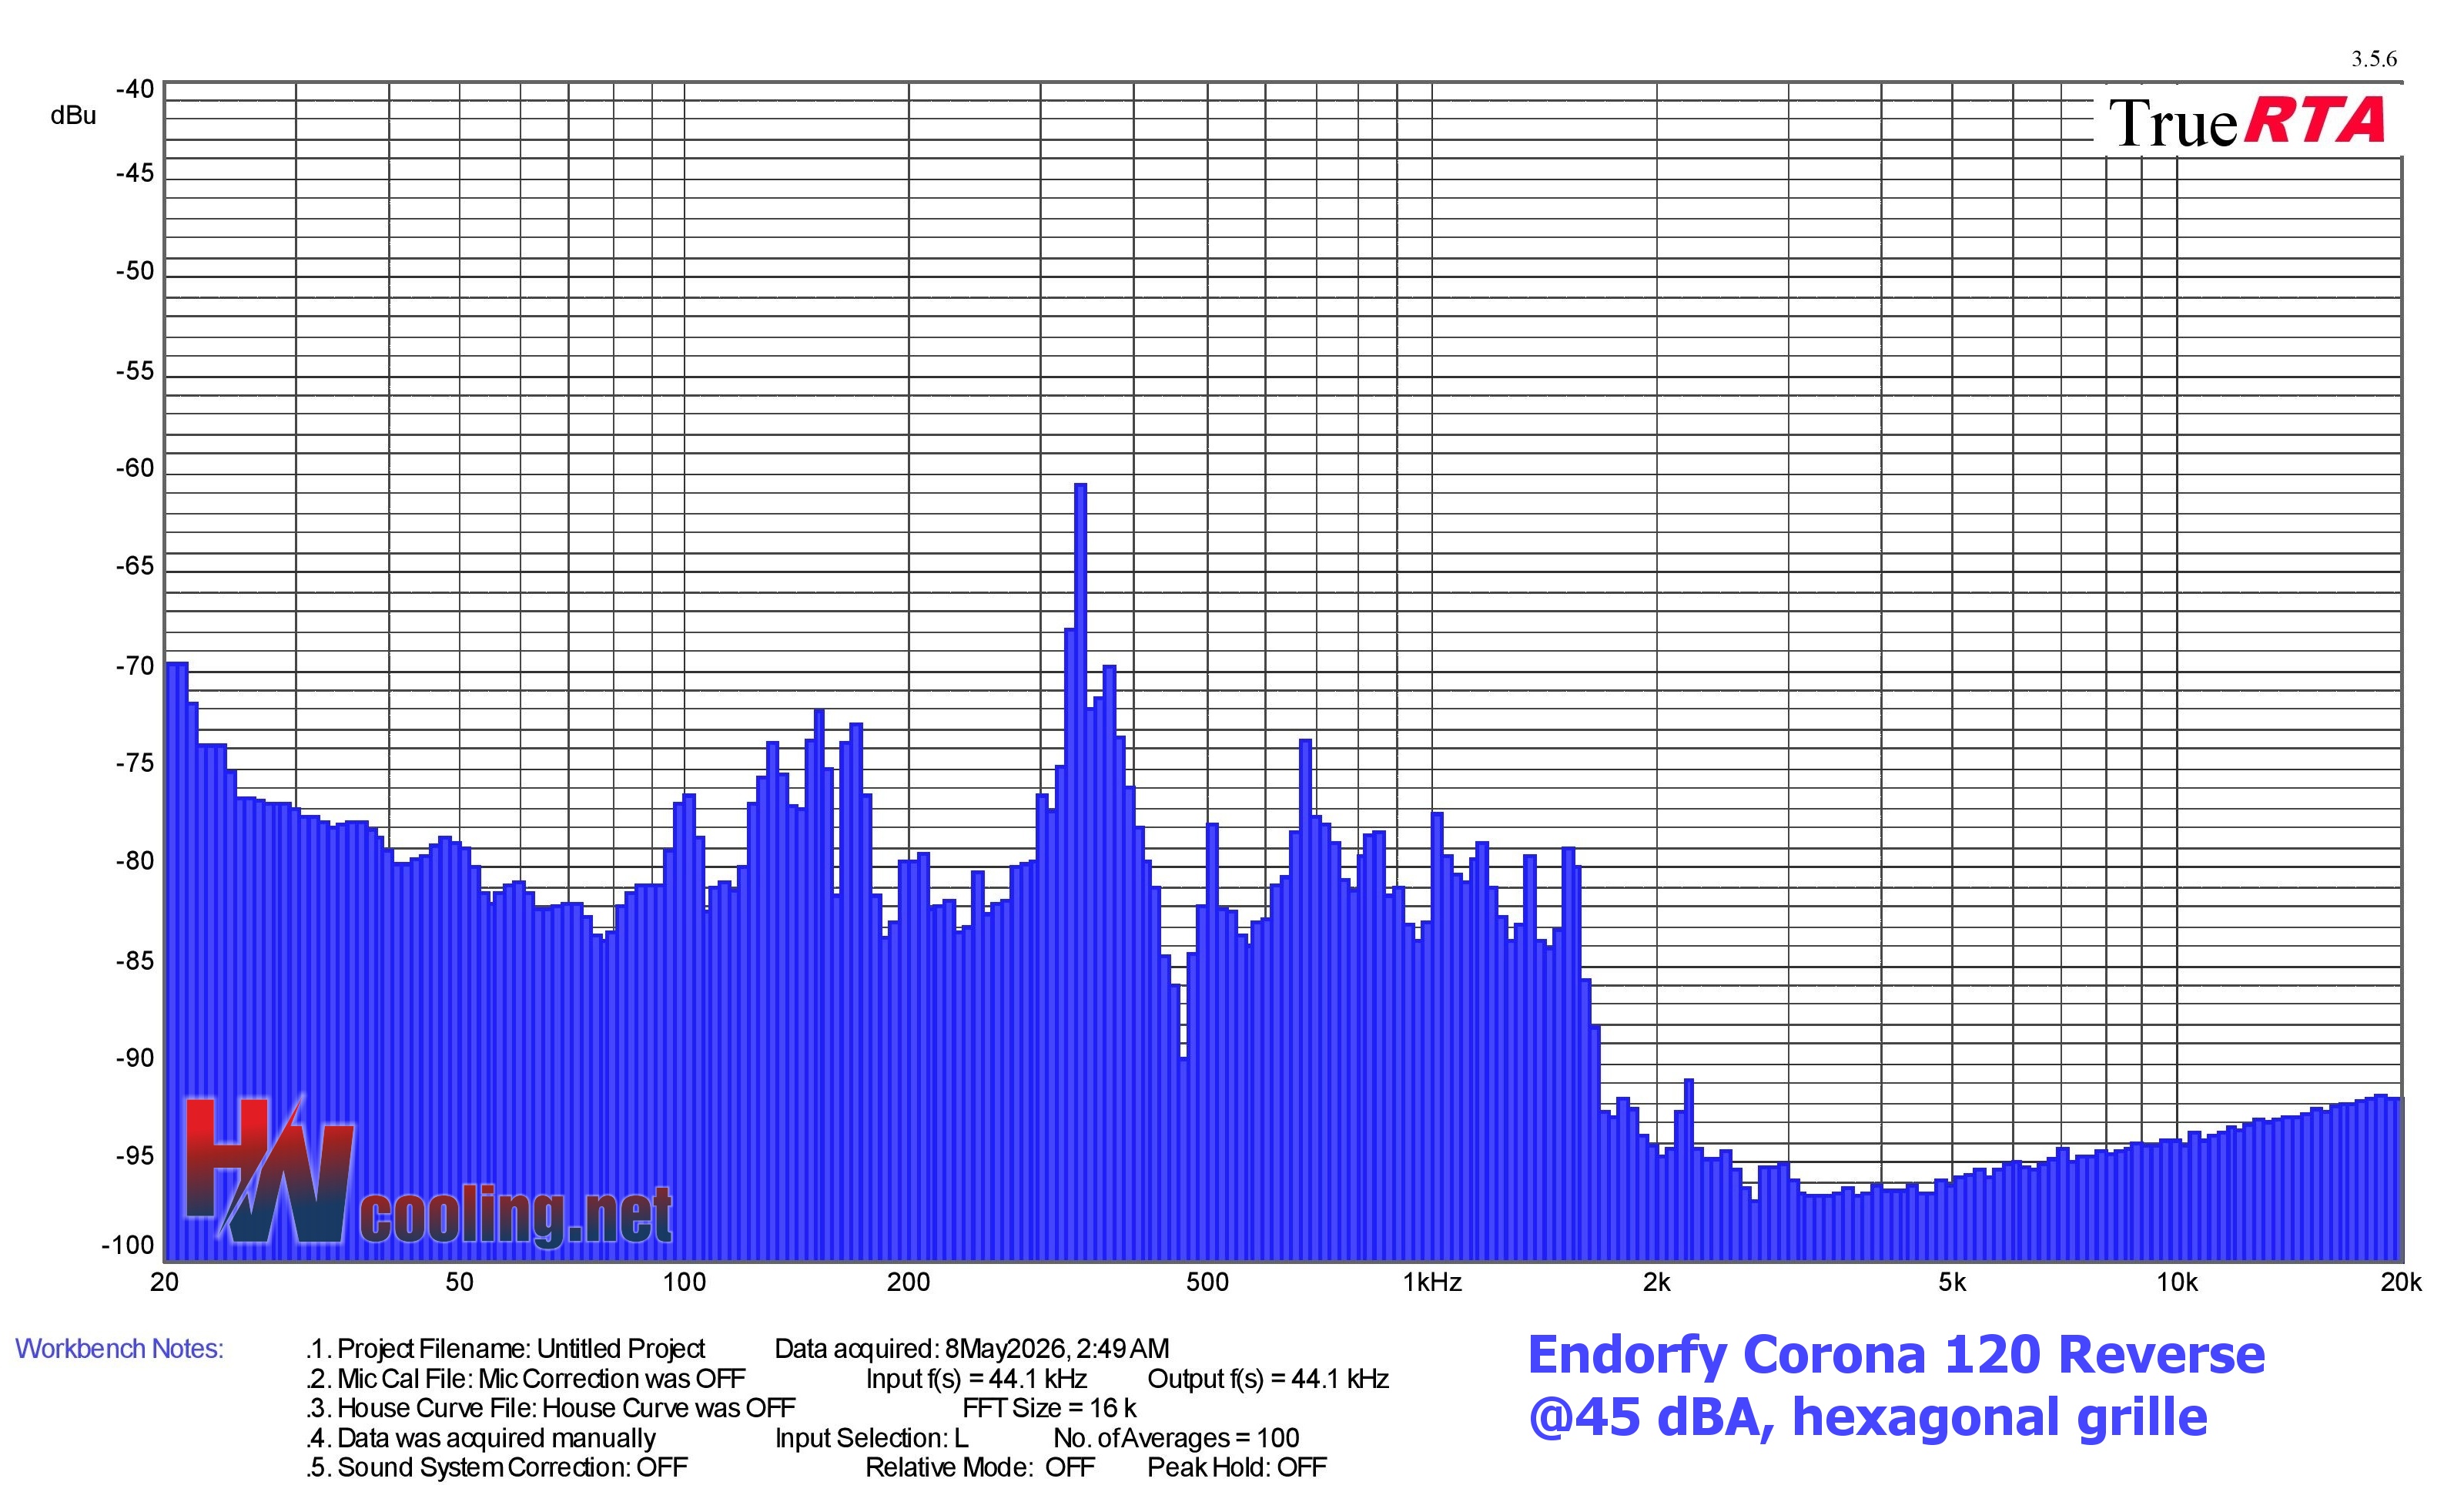
| Fan | Dominant sound freq. and noise level, hexagonal grille@45 dBA | ||||||
| Low range | Mid range | High range | |||||
| Frequency [Hz] | Noise level [dBu] | Frequency [Hz] | Noise level [dBu] | Frequency [Hz] | Noise level [dBu] | ||
| Endorfy Corona 120 Reverse | 20,6 | -69,6 | 339,0 | -60,5 | 2215,8 | -90,8 | |
| Endorfy Corona 120 | 130,7 | -73,0 | 369,7 | -70,1 | 18780,2 | -91,4 | |
| Asus ProArt PF120 | 130,7 | -77,9 | 538,2 | -72,9 | 19330,5 | -91,1 | |
| ID-Cooling AT-120-K | 155,4 | -67,2 | 761,1 | -69,1 | 5583,4 | -84,1 | |
| Antec Storm 120 | 116,5 | -78,1 | 369,7 | -66,3 | 19330,5 | -91,1 | |
| Endorfy Stratus 120 White PWM ARGB | 164,7 | -72,7 | 380,5 | -63,7 | 18780,2 | -91,1 | |
| DeepCool FD12 V2 | 164,7 | -67,5 | 380,5 | -69,1 | 19897,0 | -91,1 | |
| HAVN H12 | 23,1 | -75,5 | 369,7 | -68,4 | 19897,0 | -91,4 | |
| Arctic P12 Pro Reverse A-RGB | 92,4 | -69,5 | 553,9 | -66,9 | 19330,5 | -90,9 | |
| DeepCool FD12 | 174,5 | -71,3 | 522,9 | -75,4 | 4305,4 | -89,6 | |
| Noctua NF-S12A PWM | 97,9 | -75,7 | 369,7 | -67,0 | 19897,0 | -91,1 | |
| Thermaltake Toughfan 12 Pro | 20,6 | -74,4 | 678,1 | -65,3 | 2031,9 | -88,2 | |
| Asus Prime MR120 ARGB | 127,0 | -74,2 | 640,0 | -66,2 | 18780,2 | -91,2 | |
| Sudokoo Mach120 | 50,4 | -76,7 | 369,7 | -71,4 | 19897,0 | -91,0 | |
| Noctua NF-S12B redux-700 | N/A | N/A | N/A | N/A | N/A | N/A | |
| CPS PCCooler F9 R120 | 109,9 | -67,9 | 369,7 | -68,3 | 18780,2 | -91,3 | |
| Noctua NF-A12x15 PWM | 123,4 | -74,4 | 380,5 | -67,7 | 2215,8 | -90,7 | |
| Arctic P12 Pro A-RGB | 146,7 | -78,9 | 586,9 | -67,2 | 18245,6 | -91,5 | |
| Arctic P12 Pro | 50,4 | -80,4 | 570,2 | -69,9 | 19330,5 | -92,2 | |
| Fractal Design Momentum 12 RGB (Black) | 25,6 | -62,6 | 369,7 | -70,6 | 2091,4 | -90,8 | |
| Noctua NF-A12x25 G2 PWM | 25,6 | -70,8 | 806,3 | -71,3 | 19897,0 | -92,4 | |
| Fractal Design Momentum 12 (Black) | 130,7 | -78,3 | 369,7 | -69,7 | 2873,5 | -86,2 | |
| Thermalright TL-C12C | 50,4 | -76,1 | 380,5 | -66,0 | 17726,2 | -91,8 | |
| Adata XPG Vento Pro 120 PWM | 195,8 | -65,1 | 391,7 | -70,8 | 6639,8 | -87,6 | |
| CPS PCCooler F7 X120 | 130,7 | -77,1 | 369,7 | -84,9 | 19897,0 | -91,0 | |
| Arctic P12 Max (Black) rev. 2 | 20,6 | -58,9 | 329,4 | -78,3 | 19897,0 | -90,9 | |
| Arctic S12038-4K | 89,8 | -76,9 | 640,0 | -59,3 | 19897,0 | -91,1 | |
| Gigabyte Aorus EZ Chain Fan 120 Ice | 123,4 | -74,1 | 369,7 | -62,3 | 18245,6 | -91,3 | |
| BeQuiet! Pure Wings 3 (BL105) | 123,4 | -75,2 | 369,7 | -68,9 | 19897,0 | -91,2 | |
| Scythe Grand Tornado 120 | 20,6 | -76,0 | 329,4 | -65,5 | 18245,6 | -91,2 | |
| DeepCool FT12 | 151,0 | -72,1 | 369,7 | -67,3 | 18780,2 | -90,9 | |
| Asus TUF Gaming TR120 (Reverse) | 116,5 | -76,2 | 586,9 | -70,9 | 19330,5 | -90,6 | |
| PCCooler CPS F5 R120 BK | 169,5 | -72,8 | 339,0 | -62,6 | 18780,2 | -91,0 | |
| Seasonic MagFlow ARGB | 130,7 | -61,2 | 219,8 | -67,8 | 19897,0 | -90,9 | |
| BeQuiet! Pure Wings 3 (BL108) | 109,9 | -77,1 | 380,5 | -67,5 | 18780,2 | -91,0 | |
| Endorfy Stratus 120 PWM | 164,7 | -71,4 | 380,5 | -68.1 | 19897,0 | -90,8 | |
| Phanteks PH-F120T30 | 151,0 | -69,4 | 302,0 | -72,7 | 2873,5 | -88,8 | |
| BeQuiet! Light Wings White (BL101) | 138,5 | -79,0 | 854,3 | -67,9 | 19897,0 | -90,7 | |
| Scythe Kaze Flex II 120 | 130,7 | -75,7 | 369,7 | -69,4 | 18780,2 | -90,9 | |
| Valkyrie X12 | 20,9 | -74,9 | 359,2 | -65,3 | 18780,2 | -90,7 | |
| Arctic P12 PWM PST A-RGB | 116,5 | -71,1 | 465,8 | -70,9 | 19330,5 | -90,9 | |
| Scythe Kaze Flex II 120 Slim | 146,7 | -72,5 | 586,9 | -63,6 | 19330,5 | -90,8 | |
| Seasonic MagFlow 1225 PWM | 151,0 | -72,4 | 403,2 | -69,5 | 19897,0 | -90,6 | |
| Arctic P12 PWM PST rev. 1 | 123,4 | -59,6 | 380,5 | -67,8 | 19897,0 | -90,8 | |
| Cooler Master Mobius 120 OC | 151,0 | -75,5 | 349,0 | -65,1 | 18245,6 | -91,0 | |
| Corsair AF120 RGB Elite | 179,6 | -65,2 | 359,2 | -65,9 | 19330,5 | -91,0 | |
| Enermax SquA RGB White | 134,5 | -72,6 | 621,8 | -68,8 | 19897,0 | -90,8 | |
| Arctic P12 Slim PWM PST | 22,8 | -65,6 | 369,7 | -69,3 | 19330,5 | -90,8 | |
| DeepCool FK120 | 127,0 | -78,1 | 718,4 | -66,0 | 19897,0 | -90,8 | |
| Asus TUF Gaming TF120 | 106,8 | -78,0 | 369,7 | -66,8 | 19897,0 | -91,1 | |
| BeQuiet! Light Wings (BL072) | 142,5 | -69,8 | 718,4 | -65,6 | 18780,2 | -90,9 | |
| DeepCool FC120 | 169,5 | -75,0 | 339,0 | -67,4 | 2215,8 | -87,1 | |
| Nidec Servo Gentle Typhoon D1225C (2150/12) | 179,6 | -69,3 | 359,2 | -64,5 | 6267,2 | -90,2 | |
| BeQuiet! Shadow Wings 2 (BL085) | 130,7 | -77,6 | 369,7 | -69,3 | 19330,5 | -90,9 | |
| Noctua NF-A12x25 PWM | 23,1 | -72,6 | 640,0 | -66,1 | 18780,2 | -90,8 | |
| Corsair AF120 Elite (black) | 179,6 | -69,1 | 369,7 | -67,5 | 19330,5 | -91,0 | |
| Cooler Master MasterFan SF120M | 119,9 | -74,3 | 380,5 | -67,9 | 4182,8 | -87,8 | |
| Akasa Alucia SC12 | 151,0 | -76,6 | 369,7 | -67,2 | 19330,5 | -90,7 | |
| BeQuiet! Silent Wings Pro 4 (BL098) | 190,3 | -74,5 | 339,0 | -62,4 | 2791,7 | -83,7 | |
| Thermalright X-Silent 120 | 119,9 | -73,4 | 369,7 | -69,5 | 4974,2 | -88,6 | |
| Fractal Design Aspect 12 RGB PWM | 119,9 | -78,5 | 586,9 | -69,3 | 19897,0 | -90,7 | |
| BeQuiet! Silent Wings 3 (BL066) | 127,0 | -68,7 | 391,7 | -67,2 | 19897,0 | -90,9 | |
| Gelid Zodiac | 127,0 | -71,9 | 380,5 | -64,3 | 19330,5 | -91,1 | |
| Fractal Design Dynamic X2 GP-12 PWM | 123,4 | -75,0 | 1566,8 | -76,7 | 2215,8 | -89,6 | |
| BeQuiet! Pure Wings 2 (BL039) | 75,5 | -78,2 | 369,7 | -69,9 | 19330,5 | -90,9 | |
| Gigabyte Aorus 120 ARGB | 164,7 | -78,7 | 678,1 | -66,8 | 19897,0 | -90,7 | |
| Arctic BioniX P120 A-RGB | 130,7 | -70,6 | 219,8 | -62,2 | 18780,2 | -90,7 | |
| Akasa OTTO SF12 | 160,0 | -72,4 | 369,7 | -66,4 | 4431,5 | -88,3 | |
| Cooler Master SickleFlow 120 ARGB | 127,0 | -74,1 | 380,5 | -66,0 | 6267,2 | -90,8 | |
| Alphacool SL-15 PWM | 134,5 | -72,2 | 369,7 | -66,7 | 19330,5 | -90,8 | |
| Arctic BioniX F120 | 58,2 | -78,7 | 369,7 | -68,3 | 18780,2 | -90,7 | |
| SilverStone SST-AP123 | 130,7 | -79,2 | 339,0 | -69,6 | 18780,2 | -90,9 | |
| Noctua NF-P12 redux-1700 PWM | 142,5 | -72,8 | 586,9 | -65,0 | 18780,2 | -90,8 | |
| SilentiumPC Fluctus 120 PWM | 174,5 | -75,1 | 349,0 | -62,1 | 2957,7 | -90,3 | |
| MSI MEG Silent Gale P12 | 130,7 | -72,7 | 415,0 | -67,2 | 2487,1 | -89,3 | |
| Asus ROG Strix XF120 | 119,9 | -73,4 | 604,1 | -69,6 | 19330,5 | -90,9 | |
| Akasa Vegas X7 | 33,6 | -81,5 | 427,1 | -70,2 | 18780,2 | -90,9 | |
| Reeven Coldwing 12 | 160,0 | -64,7 | 369,7 | -67,7 | 19897,0 | -91,0 | |
| Reeven Kiran | 155,4 | -73,7 | 369,7 | -69,7 | 19330,5 | -90,8 | |
| SilentiumPC Sigma Pro 120 PWM | 130,7 | -77,8 | 369,7 | -68,1 | 4431,5 | -90,1 | |
| SilentiumPC Sigma Pro Corona RGB 120 | 20,3 | -64,8 | 369,7 | -73,0 | 3044,4 | -89,2 | |
| SilverStone SST-AP121 | 130,7 | -78,0 | 570,2 | -64,9 | 18780,2 | -91,2 | |
| SilverStone SST-FQ121 | 169,5 | -64,4 | 246,8 | -77,4 | 19330,5 | -91,0 | |
| Xigmatek XLF-F1256 | 58,2 | -74,2 | 678,0 | -63,8 | 19330,5 | -90,9 |

Spectrograms of „45 dBA“ without obstacles:
The reverse model is already “acting up” here too (on some obstacles, those tonal peaks are even higher), but the standard variant, in exchange, has more noise distributed across other sound frequencies. 🙂
Could you also note the RPMs alongside the sound normalization tests? That would be helpful so we can determine whether if fans reached the RPMs where vibration increases.
First of all, thank you for the suggestion. Logging fan speeds on obstacles would certainly be useful, but I have to repeat what I mentioned somewhere before: due to capacity constraints, we simply can’t manage it. At this point, it’s beyond our means to further increase the time demands of the testing process. Sorry about that. :/