


... and sound color (frequency characteristic)
Low-profile fans are a special category, but sometimes they are unavoidable in more confined spaces. For technical reasons, it’s always about compromises compared to more respectable fans of normal thickness, but their weight can vary. If the Arctic P12 Slim and Alphacool SL-15 don’t fit your needs, the Scythe Kaze Flex II 120 Slim may be the closest thing to what you’re looking for.
33 dBA or 33 dBA
The noise level, given as a single dBA value, is good for quick reference, but it doesn’t give you an idea of exactly what the sound sounds like. That’s because it averages a mix of noise levels of all frequencies of sound. One fan may disturb you more than the other, even though they both reach exactly the same dBA, yet each is characterized by different dominant (louder) frequencies. To analyze thoroughly with an idea of the “color” of the sound, it is essential to record and assess noise levels across the entire spectrum of frequencies that we perceive.

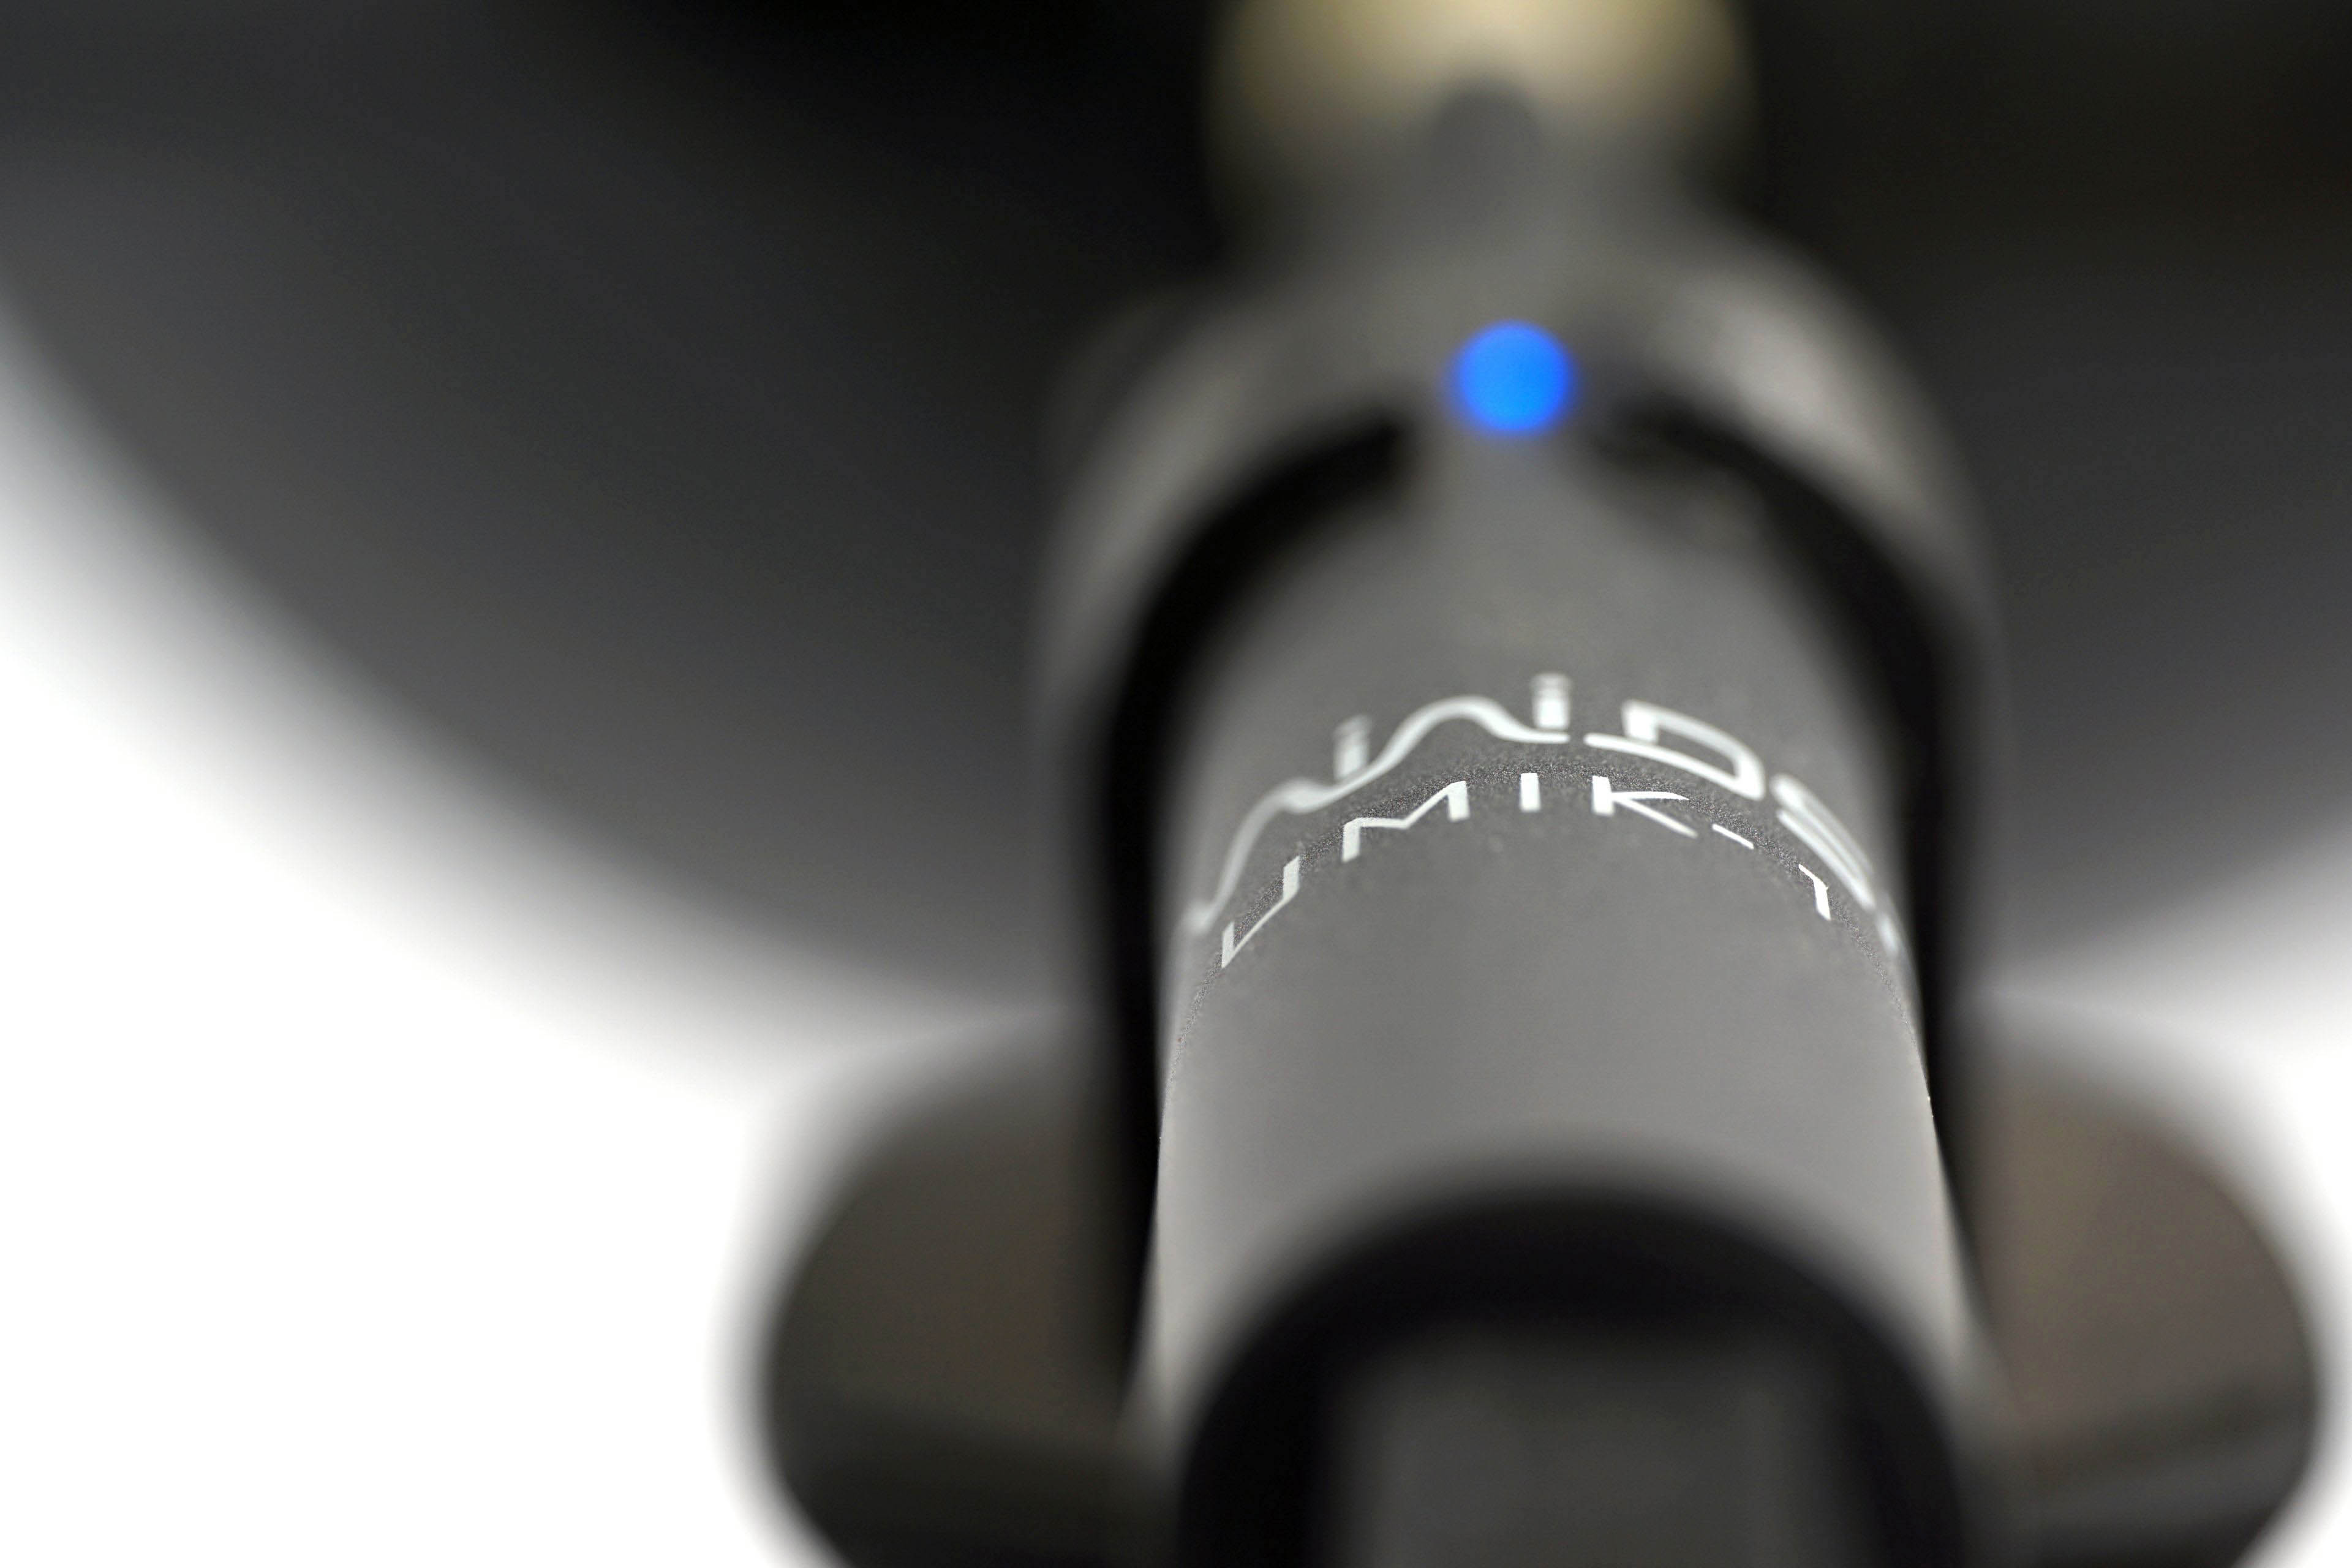
We already do this in graphics card tests, and we’ll do it for fans too, where it makes even more sense. Using the UMIK-1 miniDSP microphone and TrueRTA’s mode-specific, fixed dBA application, we also measure which frequencies contribute more and which contribute less to the sound. The monitored frequency range is 20-20,000 Hz, which we’ll work with at a fine resolution of 1/24 octave. In it, noise levels from 20 Hz to 20 000 Hz are captured at up to 240 frequencies.
The information captured in the spectrograph is a bit more than we will need for clear fan comparisons. While you’ll always find a complete spectrograph in the tests, we’ll only work with the dominant frequencies (and their noise intensities) in the low, mid, and high bands in the comparison tables and charts. The low frequency band is represented by 20–200 Hz, the medium by 201–2000 Hz and the high by 2001–20 000 Hz. From each of these three bands, we select the dominant frequency, i.e. the loudest one, which contributes most to the composition of the sound.
To the dominant frequency we also give the intensity of its noise. However, in this case it is in a different decibel scale than those you are used to from noise meter measurements. Instead of dBA, we have dBu. This is a finer scale, which is additionally expressed negatively. Be careful of this when studying the results – a noise intensity of -70 dBu is higher than -75 dBu. We discussed this in more detail in the article Get familiar with measuring the frequency response of sound.
Strict acoustic safeguards are required to ensure that these measurements can be carried out with satisfactory repeatability at all. We use acoustic panels to measure the same values at all frequencies across repeated measurements. These ensure that the sound is always reflected equally to the microphone regardless of the distribution of other objects we have in the testlab. The baseline noise level before each measurement is also naturally the same. The room in which we measure is soundproofed.
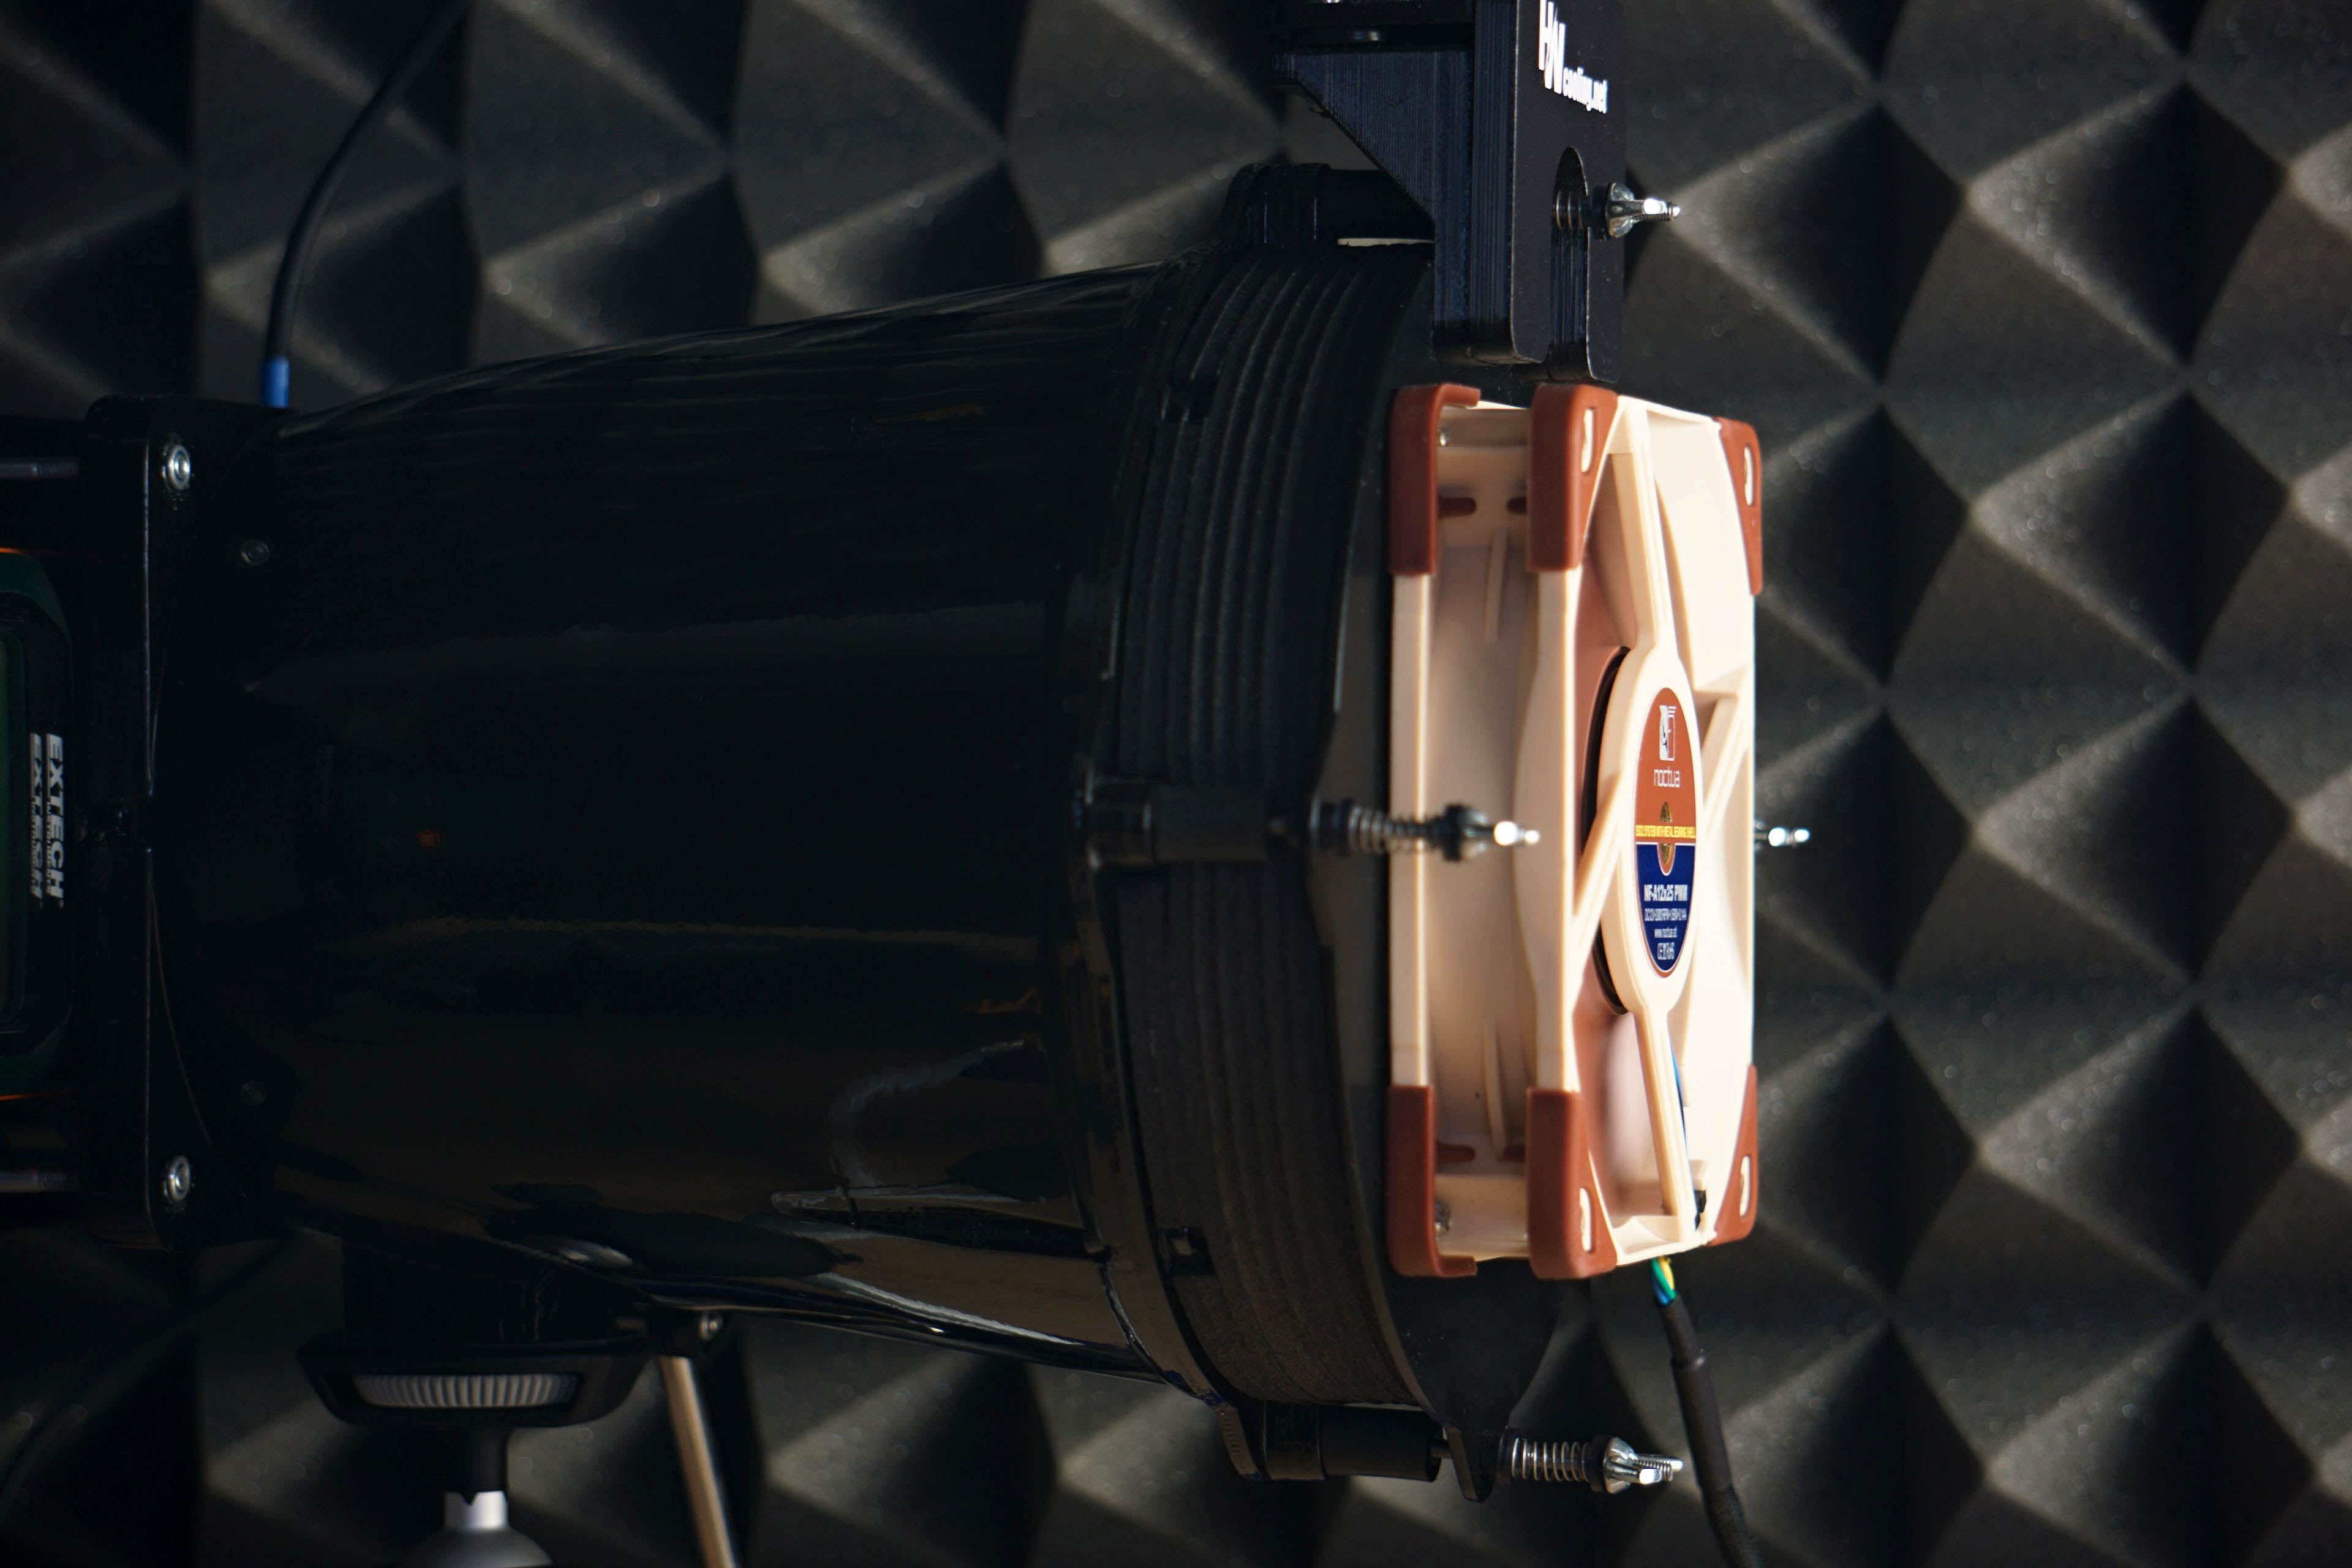
Like the noise meter, the microphone has a parabolic collar to increase resolution. The latter is specially in this case not only to amplify but also to filter out the noises that occur whether we want them or not behind the microphone. We are talking about the physical activity of the user (tester). Without this addition, human breathing, for example, would also be picked up by the spectrograph. However, this is successfully reflected off the microphone sensor by the back (convex) side of the collar. As a result, the spectrogram only contains information about the sound emitted by the fan itself.
- Contents
- Scythe Kaze Flex II 120 Slim in detail
- Overview of manufacturer specifications
- Basis of the methodology, the wind tunnel
- Mounting and vibration measurement
- Initial warm-up and speed recording
- Base 6 equal noise levels…
- ... and sound color (frequency characteristic)
- Static pressure measurement…
- … and airflow
- Everything changes with obstacles
- How we measure power draw and motor power
- Measuring the intensity (and power draw) of lighting
- Results: Speed
- Results: Airlow w/o obstacles
- Results: Airflow through a nylon filter
- Results: Airflow through a plastic filter
- Results: Airflow through a hexagonal grille
- Results: Airflow through a thinner radiator
- Results: Airflow through a thicker radiator
- Results: Static pressure w/o obstacles
- Results: Static pressure through a nylon filter
- Results: Static pressure through a plastic filter
- Results: Static pressure through a hexagonal grille
- Results: Static pressure through a thinner radiator
- Results: Static pressure through a thicker radiator
- Results: Static pressure, efficiency by orientation
- Reality vs. specifications
- Results: Frequency response of sound w/o obstacles
- Results: Frequency response of sound with a dust filter
- Results: Frequency response of sound with a hexagonal grill
- Results: Frequency response of sound with a radiator
- Results: Vibration, in total (3D vector length)
- Results: Vibration, X-axis
- Results: Vibration, Y-axis
- Results: Vibration, Z-axis
- Results: Power draw (and motor power)
- Results: Cooling performance per watt, airflow
- Results: Cooling performance per watt, static pressure
- Airflow per euro
- Static pressure per euro
- Results: Lighting – LED luminance and power draw
- Results: LED to motor power draw ratio
- Evaluation


On the evaluation page, the link to frequency analysis on plastic filters was wrong (39 instead of 29). Also, the summary was wrongly replaced by the spec table.
On your evaluation of frequency, you say thay the weakness of the fan only shows when it runs above 1100 RPM (that is 45 dBA). But from reading the charts, there seems to be strong peaks that appear in 39 dBA mode (959 RPM) as well. Did I interpret the data incorrectly?
Thank you for the heads up. Corrected. Including the charts that were really messed up. I was already in advanced stages of exhaustion when I released it yesterday…
… you read the spectrographs well. Yes, you are right, even the 39 dBA (~959 rpm) mode is characterized by more pronounced tonal peaks, so I’ve modified that statement a bit. Below 850 rpm it’s fine in that respect. Approximately such speeds at 39 dBA correspond to tests with a plastic filter and on a grille, which increase the noise level, so when tuned to the same level the fan speeds will always be a bit slower than in a use case without an obstacle.
So thanks for this observation and apologies for the inaccurate interpretation of the results. I wrote the article a bit under pressure and at the same time on the verge of complete exhaustion. I hope that similar mistakes will be avoided in the future.
You don’t have to apologize, it does not take away from the fact that the overall analysis is great work.
Health is very important. I hope you’ll find time to take a good rest and don’t push yourself too hard 🙂. Take care.
Guys, please test 120 and 140x25mm Kaze Flex – they were highly praised by other (but not as advanced as you) reviewiers, especially as case fans. I generally really like them from my own experience for being solid performers; sounding well; having quiet motor and bearing and representing nice quality additionally proven by few years of using them in my own pc.
Sure, the 120 and 140 mm Kaze Flex II will be next in line as far as Scythe fans are concerned. I mean, maybe the Grand Tornado model, which is close to release, will fit in between them.