


The lowest “K” model of the Intel Arrow Lake CPU family benefits, like its predecessors, from a large number of cores. Unlike them, it doesn’t have Hyper Threading, but it doesn’t lag behind compute-wise, and the Core Ultra 5 245K is more efficient. However, it’s not enough to rival the Ryzen 9000s. Not at high performance. In medium workloads, typical of gaming PCs, however, the situation turns around.
Methodology: how we measure power draw
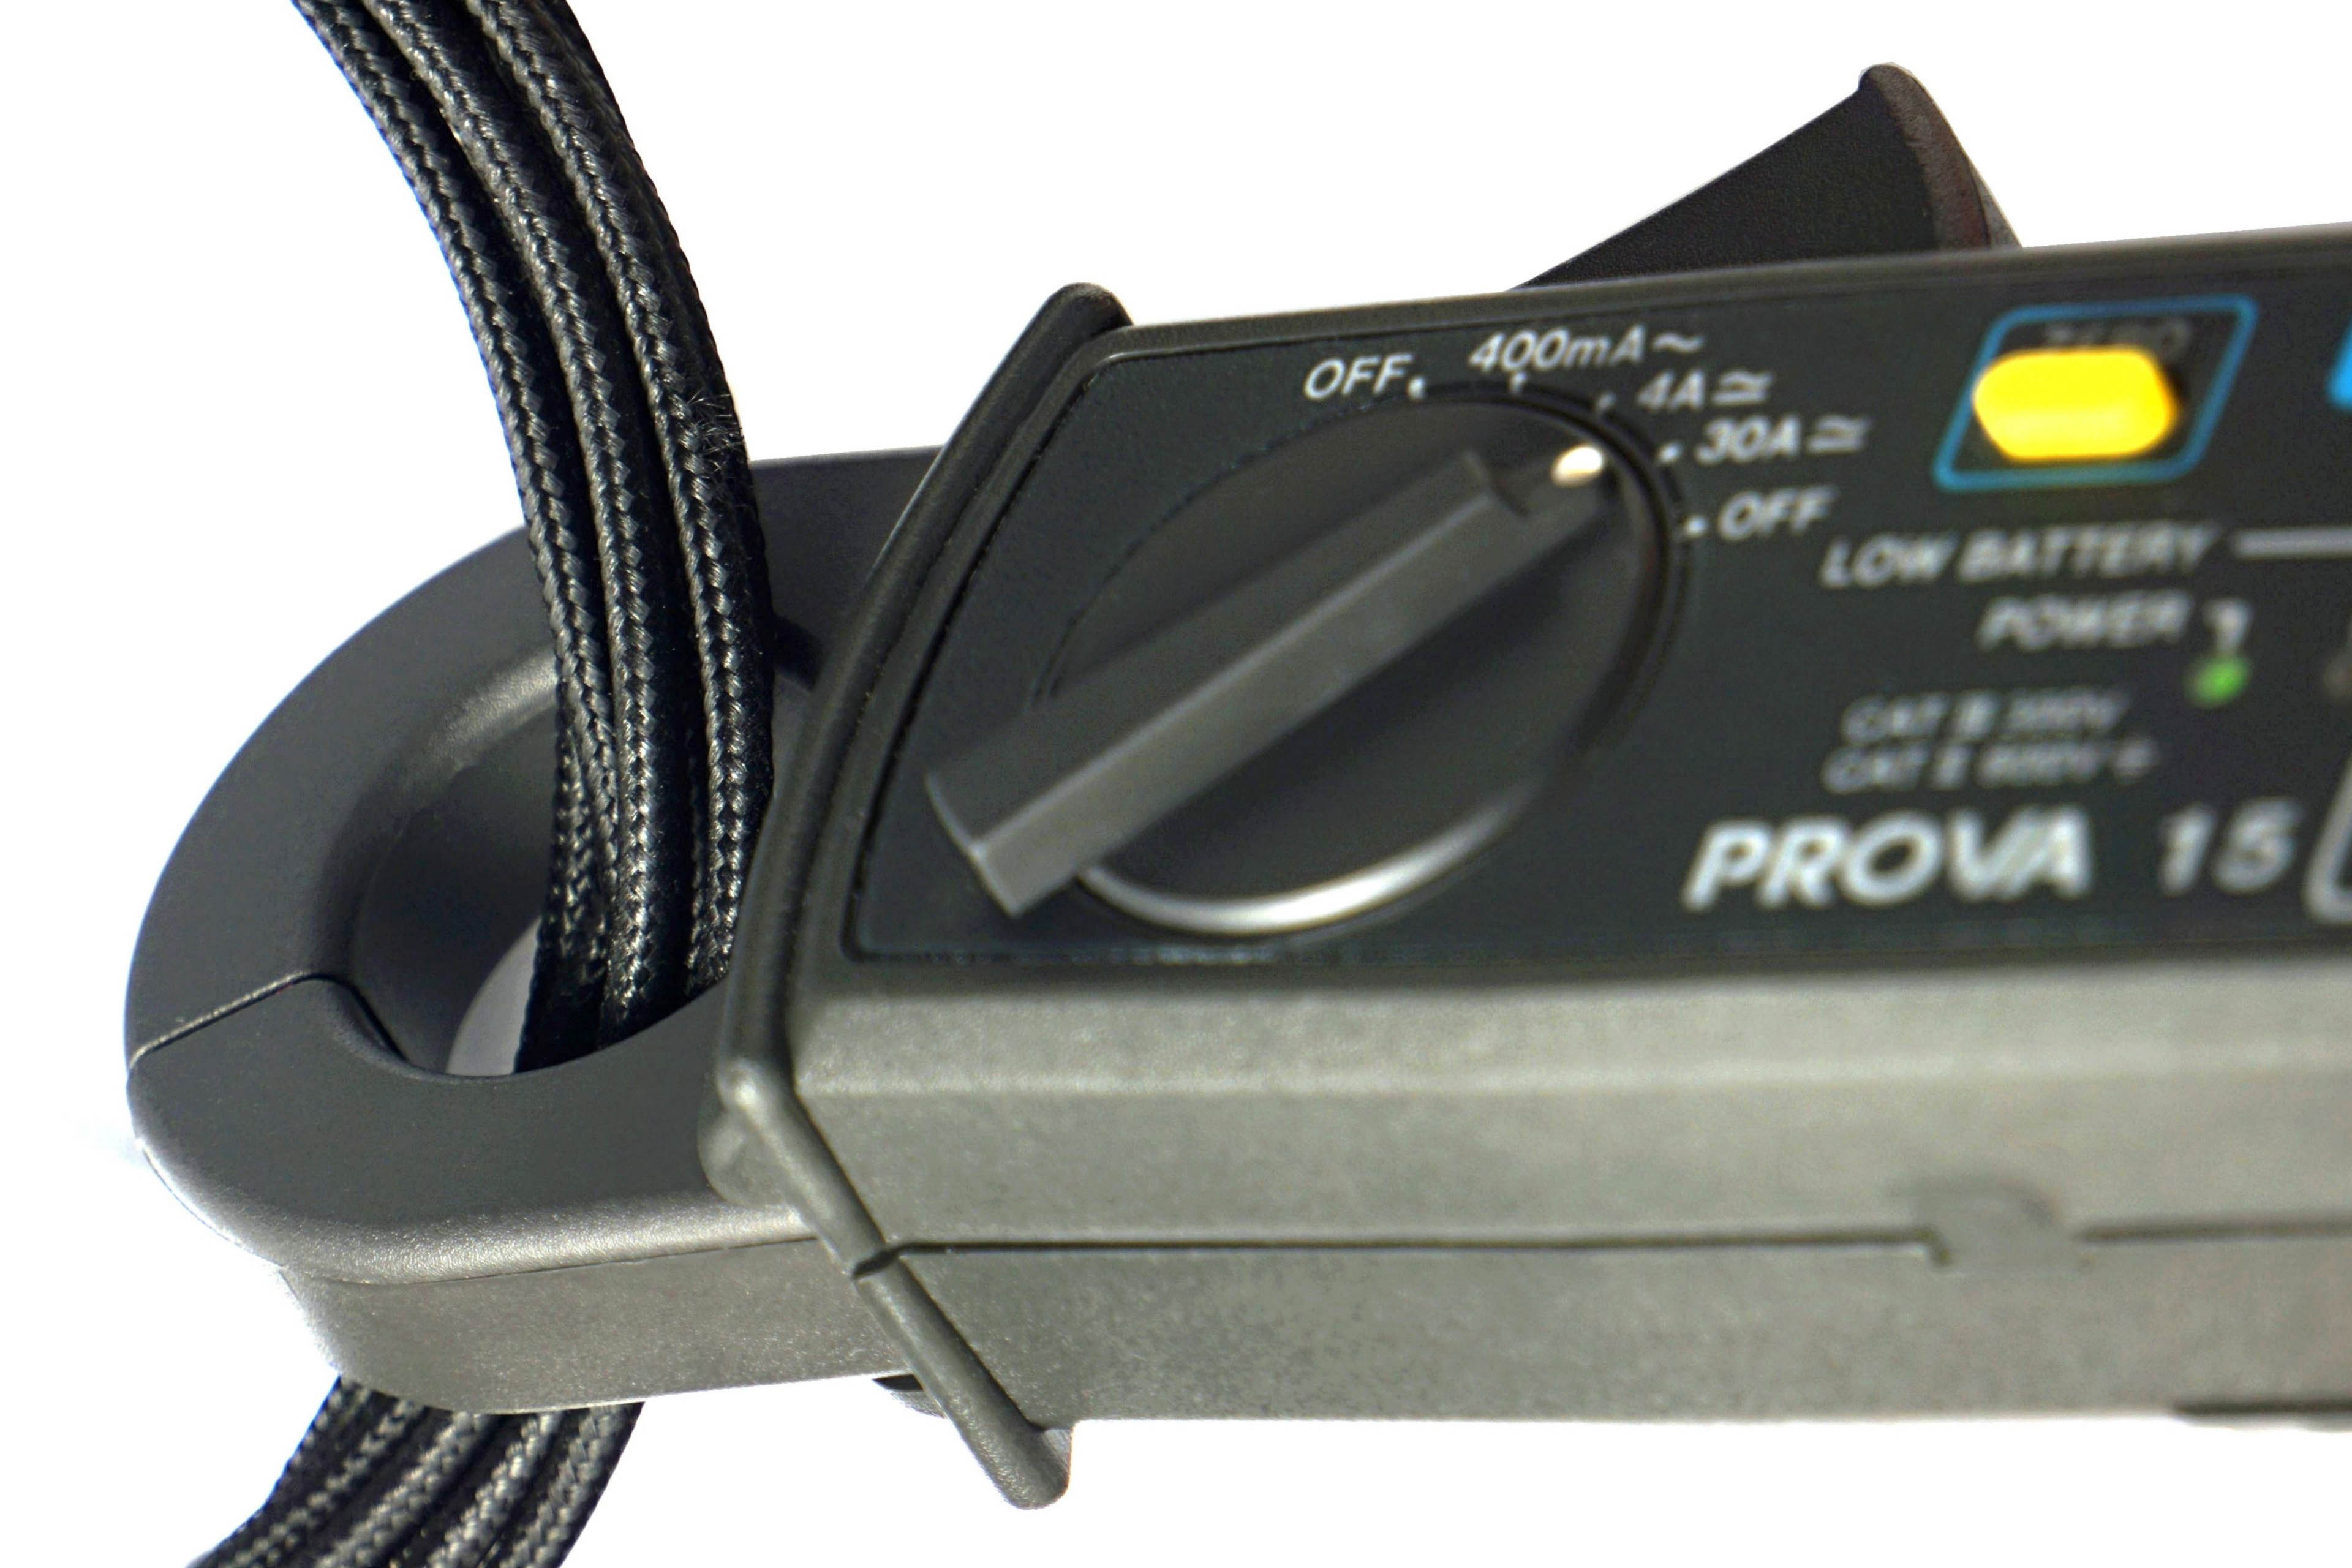
Measuring CPU power consumption is relatively simple, much easier than with graphics cards. All power goes through one or two EPS cables. We also use two to increase the cross-section, which is suitable for high performance AMD processors up to sTR(X)4 or for Intel HEDT, and in fact almost for mainstream processors as well. We have Prova 15 current probes to measure current directly on the wires. This is a much more accurate and reliable way of measuring than relying on internal sensors.
The only limitation of our current probes may be when testing the most powerful processors. These already exceed the maximum range of 30 A, at which high accuracy is guaranteed. For most processors, the range is optimal (even for measuring a lower load, when the probes can be switched to a lower and more accurate range of 4 A), but we will test models with power consumption over 360 W on our own device, a prototype of which we have already built. Its measuring range will no longer be limiting, but for the time being we will be using the Prova probes in the near future.
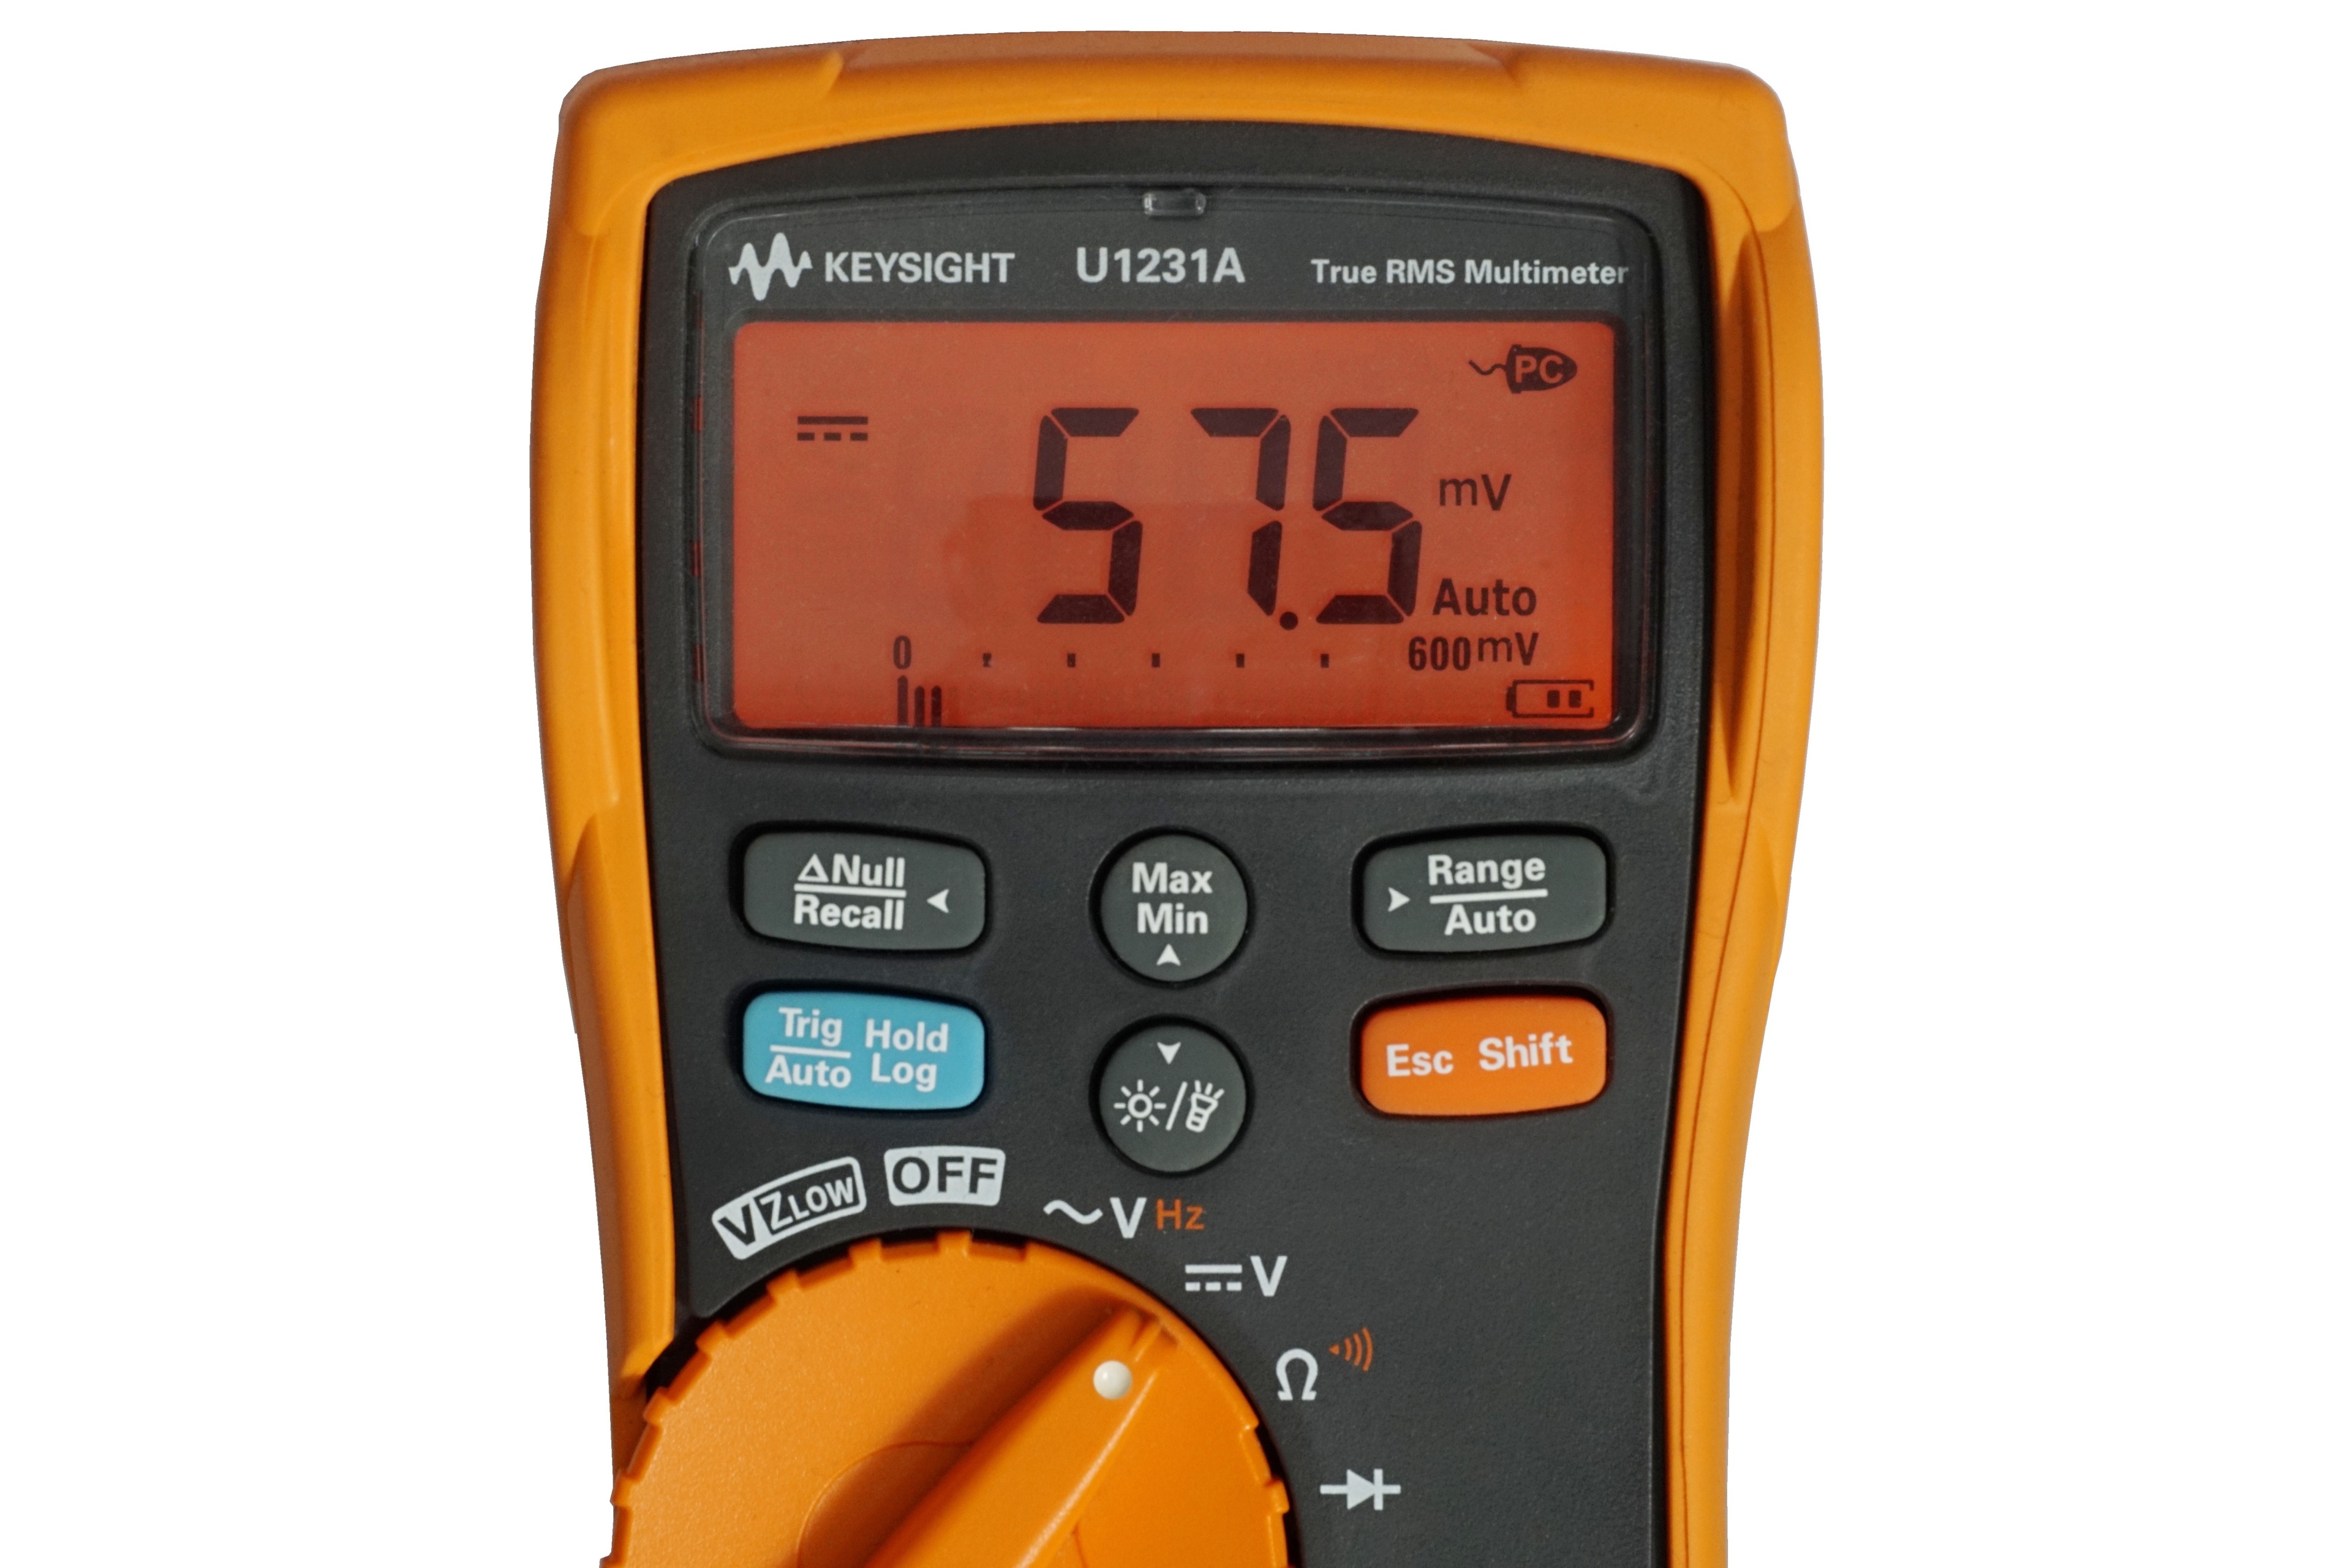
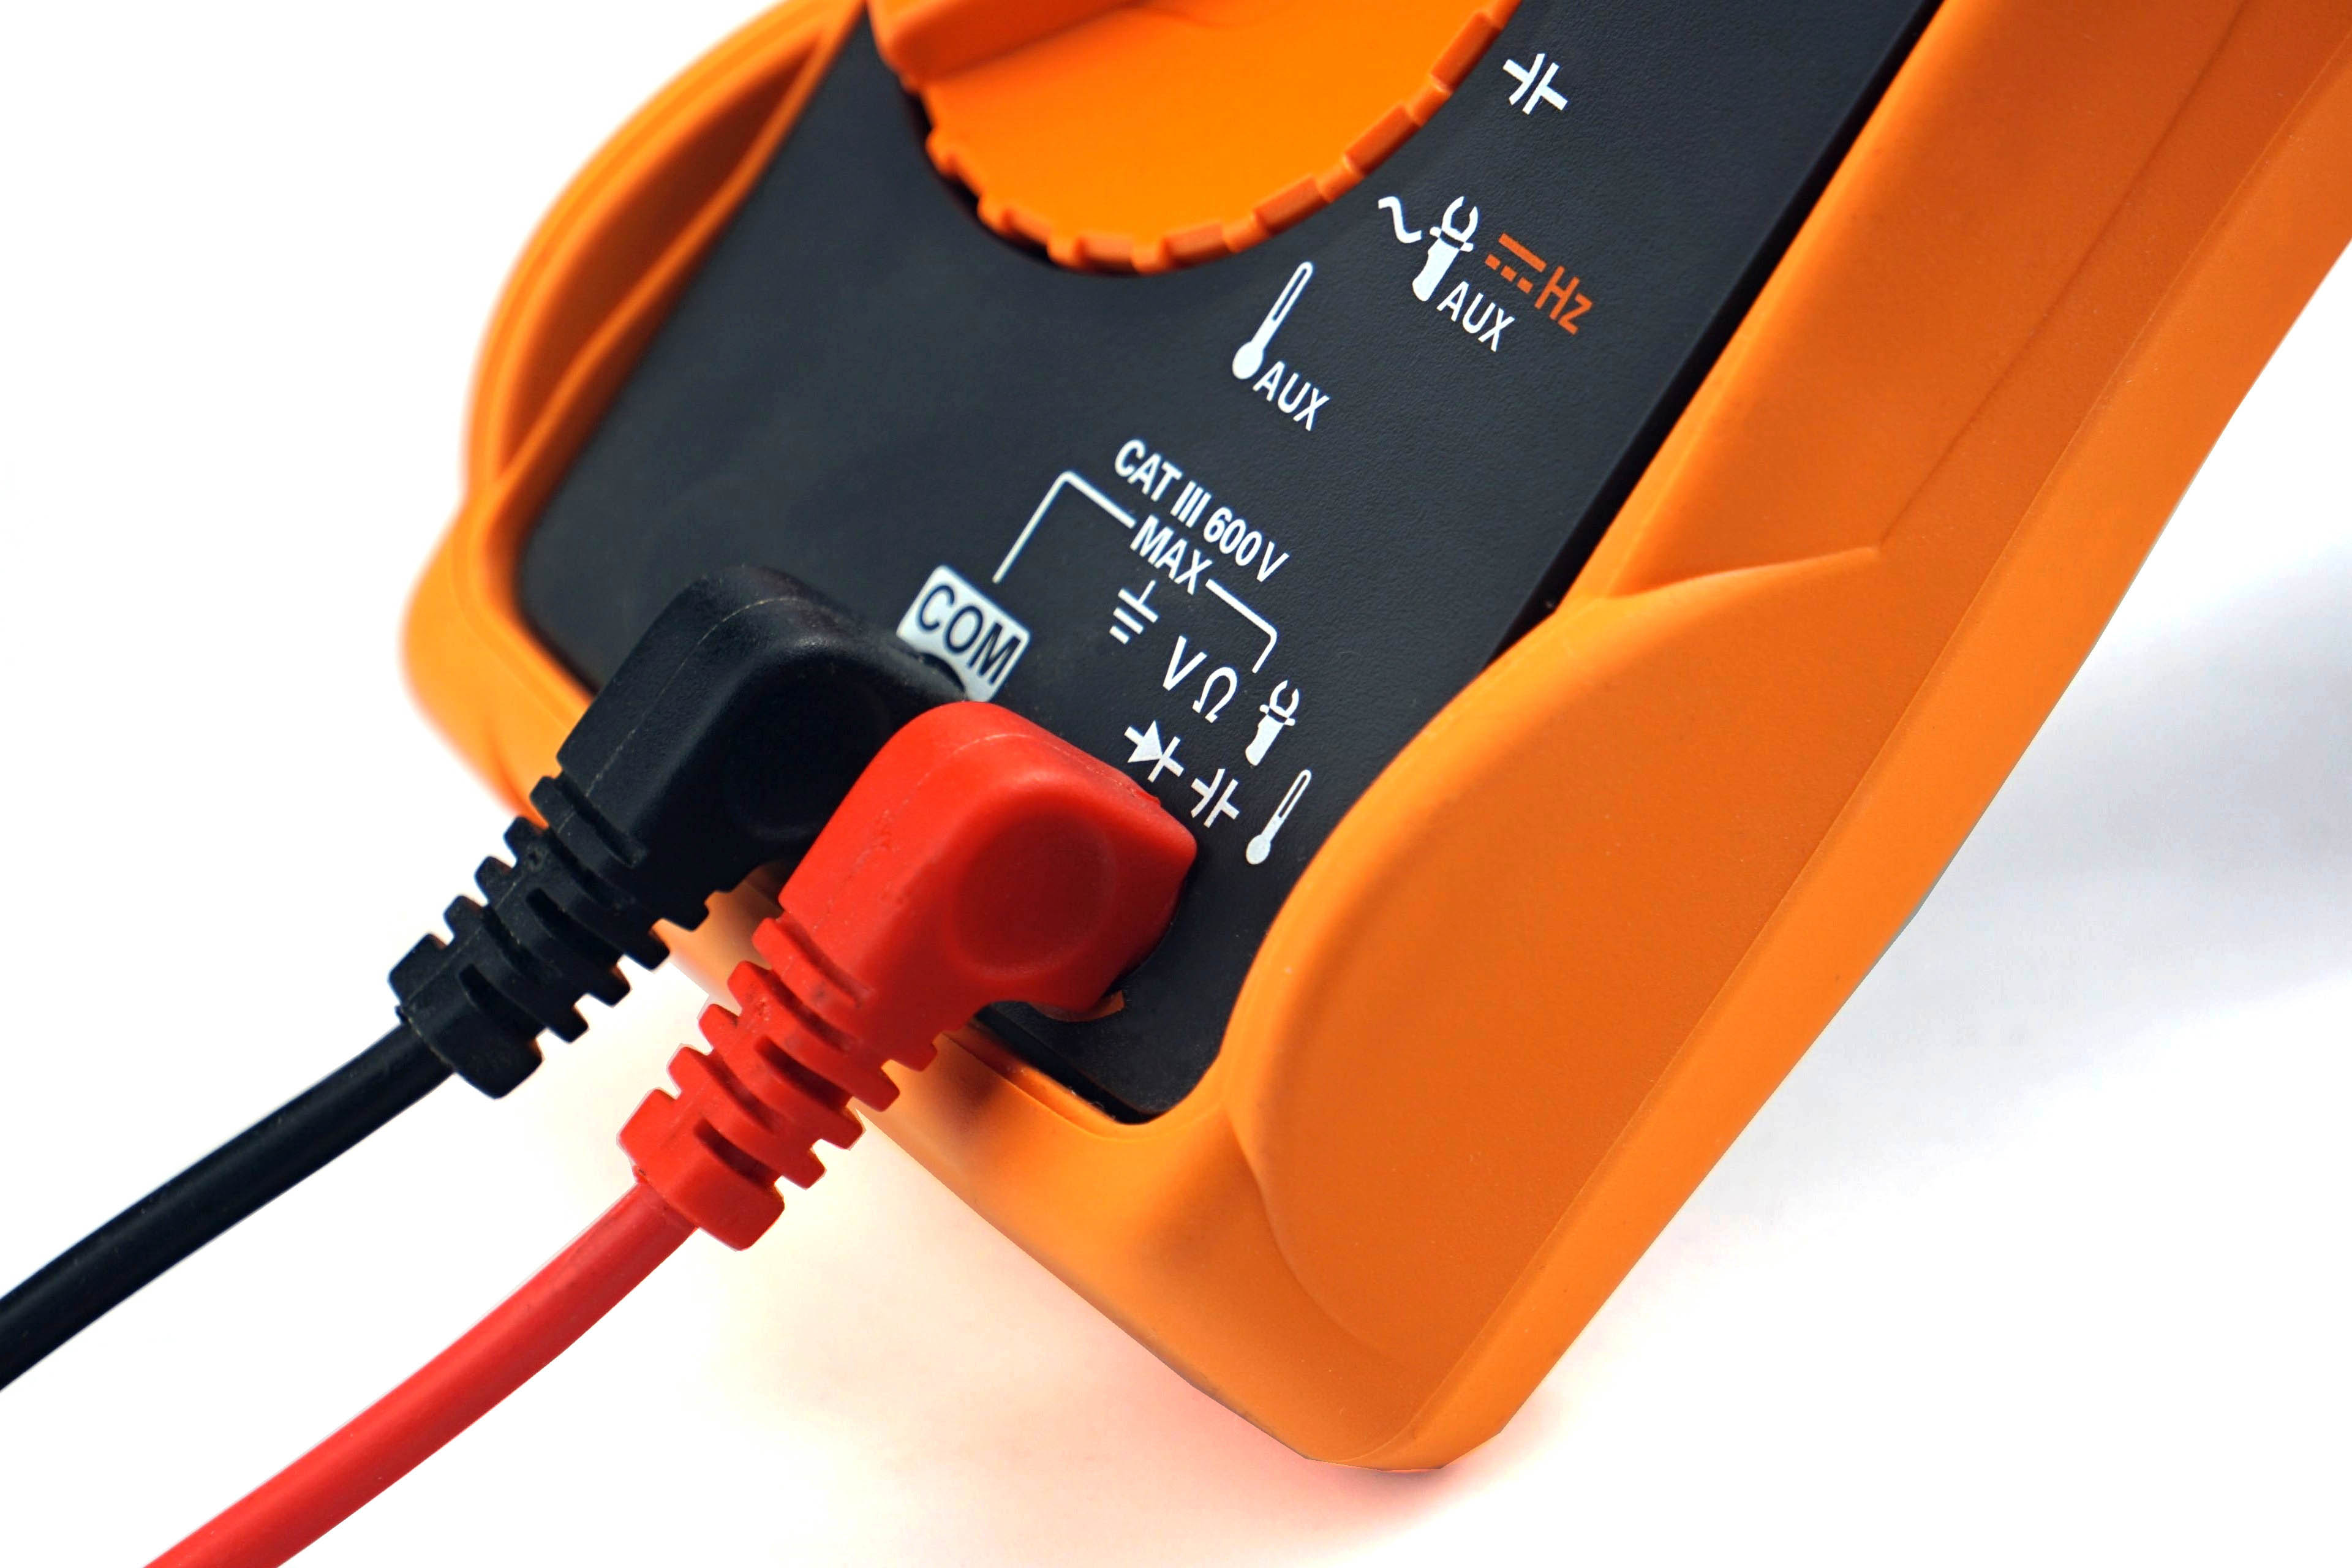
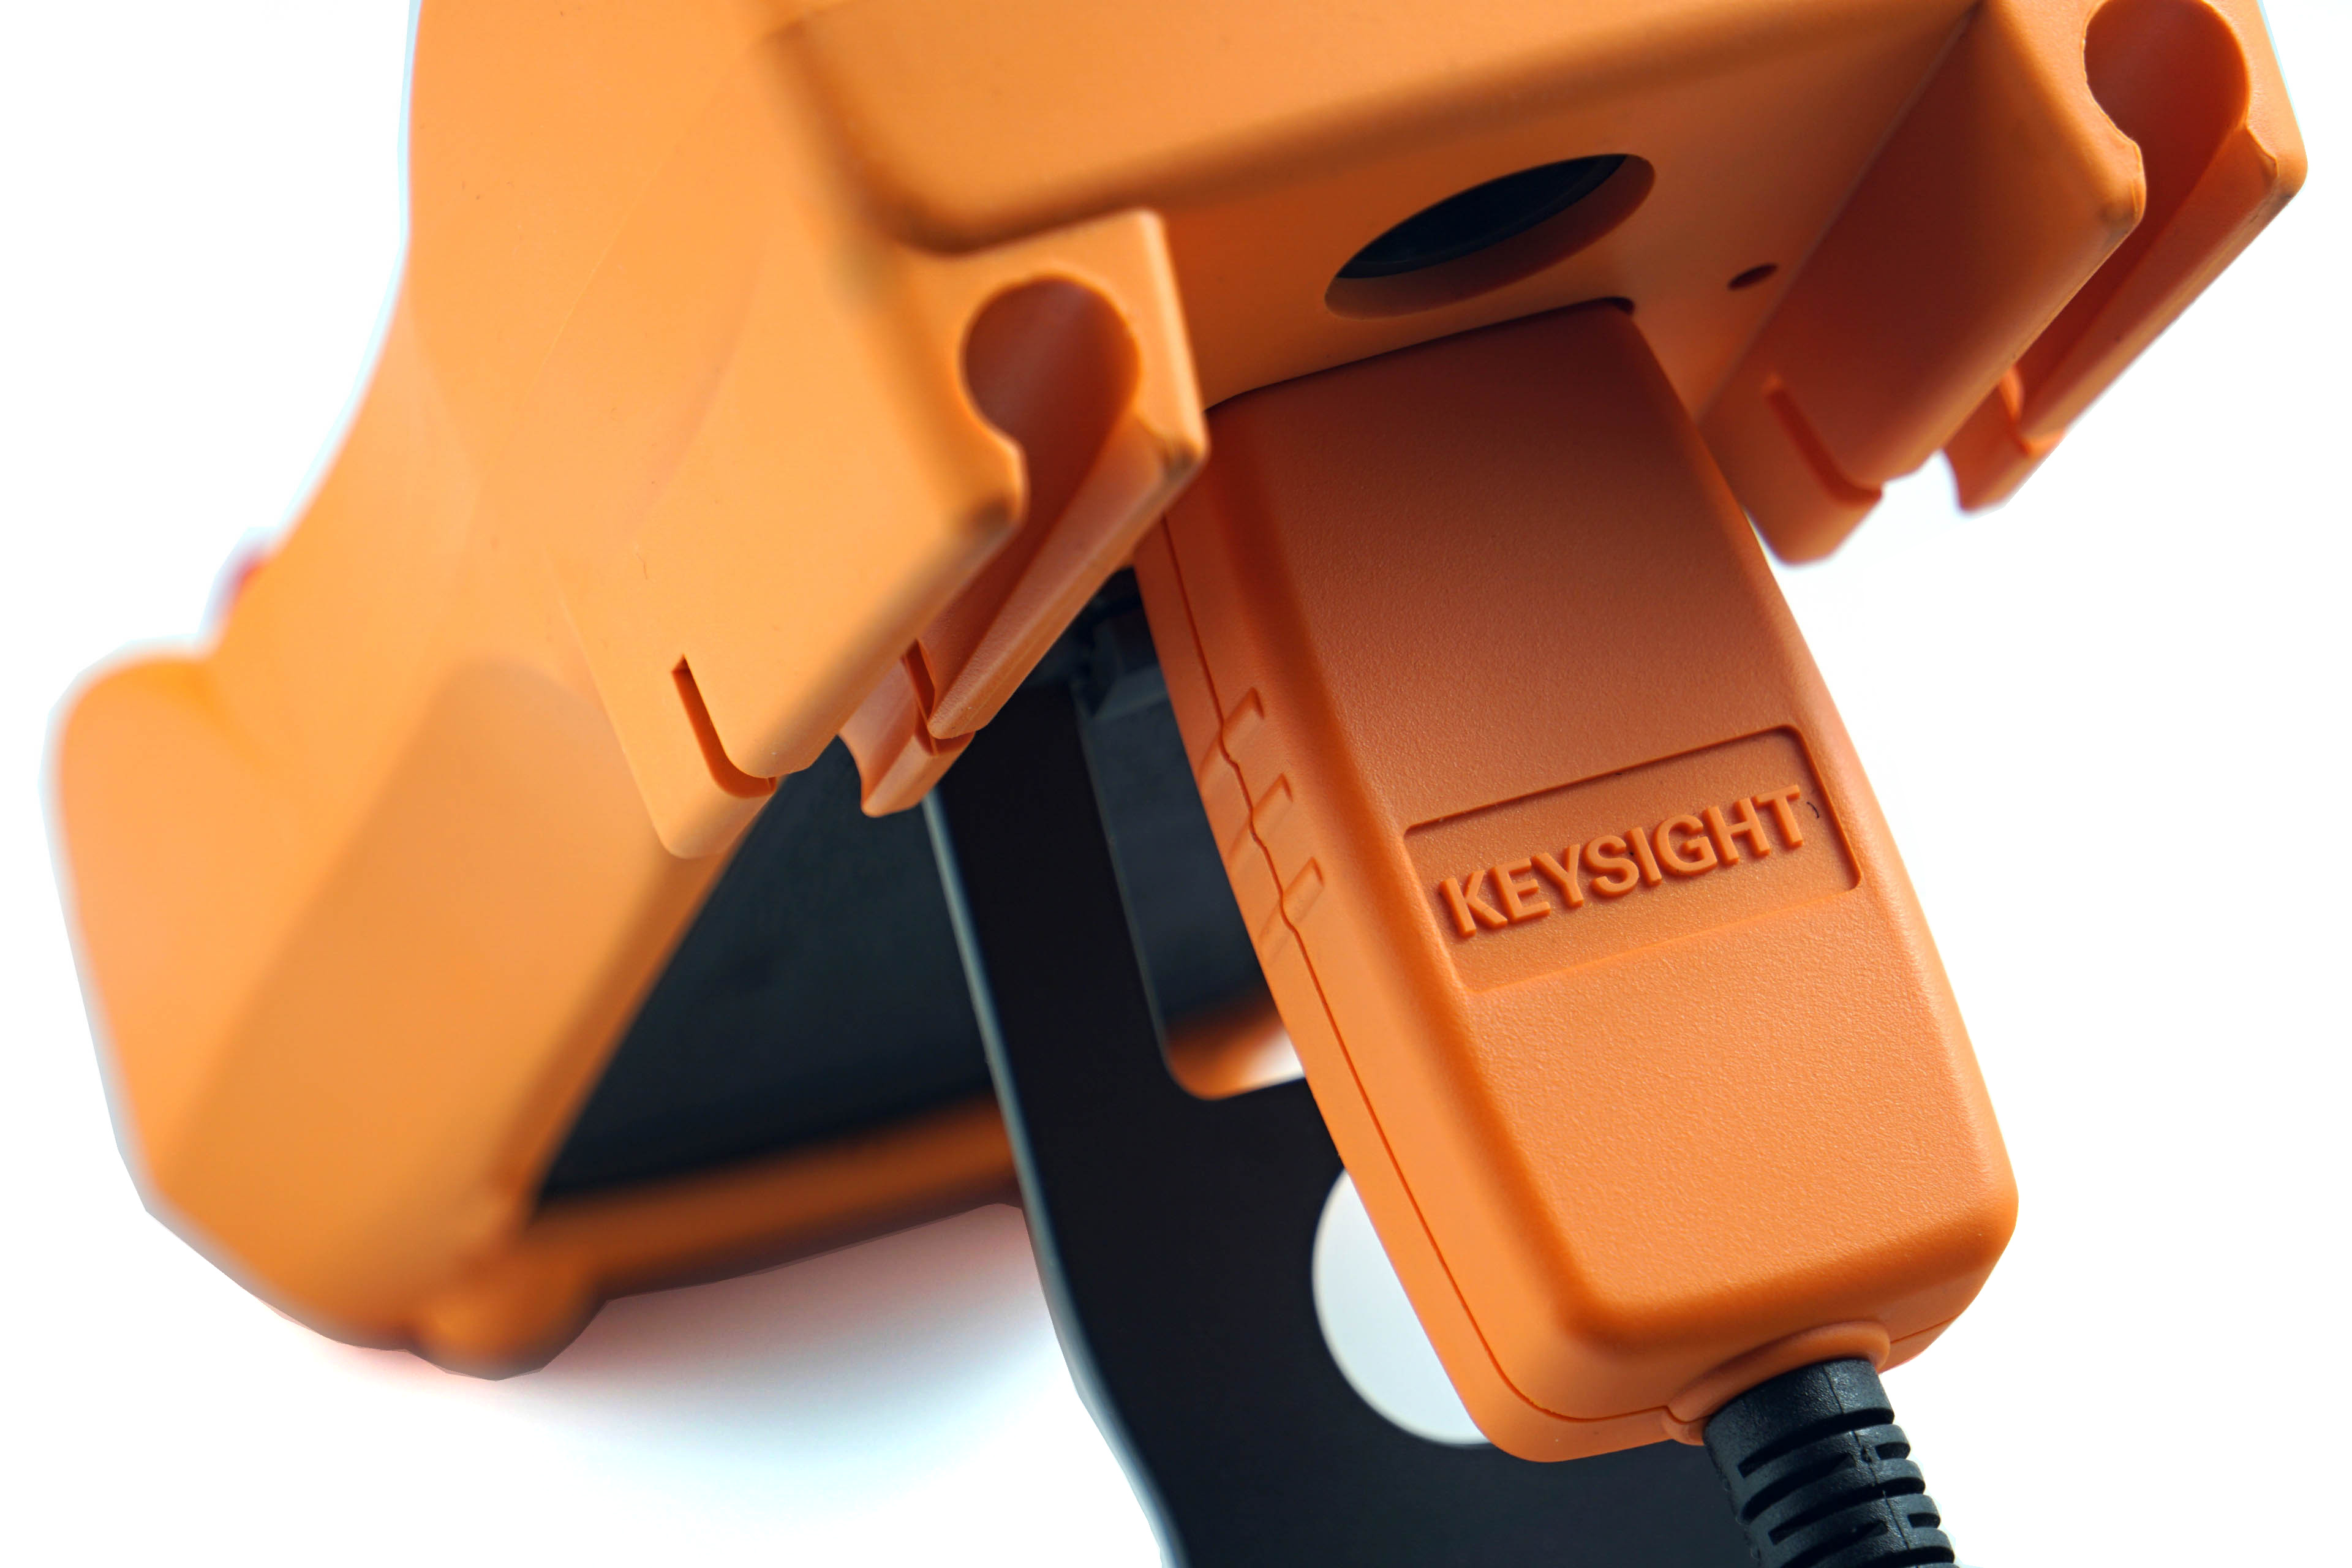
The probes are properly set to zero and connected to a Keysight U1231A multimeter before each measurement. It records samples of current values during the tests via the IR-USB interface and writes them in a table at one-second intervals. We can then create bar graphs with power consumption patterns. But we always write average values in bar graphs. Measurements take place in various load modes. The lowest represents an idle Windows 10 desktop. This measurement takes place on a system that had been idle for quite some time.
Audio encoding (FLAC) represents a higher load, but processors use only one core or one thread for this. Higher loads, where more cores are involved, are games. We test power consumption in F1 2020, Shadow of the Tomb Raider and Total War Saga: Troy in 1920 × 1080 px. In this resolution, the power consumption is usually the highest or at least similar to that in lower or higher resolutions, where in most cases the CPU power draw rather decreases due to its lower utilization.
Power limits are disabled for both Intel and AMD processors, unlocked at the PL2/PPT level. This is also the default setting for most motherboards. This means that the “Tau” timeout after 56 seconds does not reduce power consumption and clock speeds even under higher load, and performance is stable. We considered whether or not to accept the lower-power settings. In the end, we won’t, on the grounds that the vast majority of users don’t do it either and thus the results and comparisons would be rather uninteresting. The solution would indeed be to test with and without power limits, but this is already impossible time-wise in the context of processor tests. However, we won’t ignore this issue and it will be given space in motherboard tests where it makes more sense to us.
We always use motherboards with extremely robust, efficient VRM, so that the losses on MOSFETs distort the measured results as little as possible and the test setups are powered by a high-end 1200 W BeQuiet! Dark Power Pro 12 power supply. It is strong enough to supply every processor, even with a fully loaded GeForce RTX 3080, and at the same time achieves above-standard efficiency even at lower load. For a complete overview of test setup components, see Chapter 5 of this article.


Any thoughts why the idle power consumption of ryzen 9600 and 9700 is so different? I’d expect these to be essentially the same–both contain the same chiplets, and when idling, I’d expect only 1-2 cores to be active…
Something to do with silicon lottery?
Very good logical reasoning. The difference in power consumption between the Ryzen 7 9700X and Ryzen 5 9600X should be really minimal taking into account the structure of both processors. Especially when they are tested on the same motherboard with the same power management setup. For more details, we went to the HWiNFO log, where the 9700X is even shaping up to be the lower-power CPU (~22.1 vs. ~23.9 W). This also makes sense considering the slightly higher core clock speeds and their power supply voltages in the R5 9600X, for example. However, we do not consider software monitoring to be relevant and transparent enough in CPU tests. Hence those measurements on EPS cables, where the results already fundamentally diverge. I can’t tell you the reason, it’s hard to say. Considering that both processors have only one chiplet with cores active and the difference is on the level of activity of two cores, I would also expect the values of the power consumption results to be close to each other.
It’s the same with other processors.
Intel Core i5-13400F (C0): 2.1W
Intel Core i5-14400F (C0): 10.97W
Pretty much same CPU, 5x~ difference?
Intel Core i3-13100F: 2.57W
Intel Core i3-12100F: 16.75W
Same as above
Intel Core Ultra 9 285K: 17.37W
Intel Core Ultra 5 245K: 22.42W
Same generation, but the one with more cores uses less power in idle?
12400F higher than 12900K and same as 7800X3D which famously has high idle power?
Something doesn’t seem right with any of the numbers in the idle power tests. Were the conditions identical?
There may be more reasons, but I don’t want to speculate too much. It’s too complicated for that. Anyway, in the specified idle load the multiplier of the Core i5-13400F on P cores drops down to 4, while the Core i5-14400F’s is, I think, at 8. And I guess the management of the cores can be different, where only in one case the OS runs on the efficient (E) ones. I don’t know, I wouldn’t dig too much into it like this, we don’t like to speculate and we like to have clarity on things. With processors you can’t always do that, because we can’t see inside them well enough. It simply works out this way in this particular situation, and it is certainly correct.
I certainly wouldn’t blame it on silicon lottery. Most people may be inclined to do so, but it is important to know that with the extremely low power consumption claimed for the Ci5-13400F (C0), the measurements of another sample of this processor – the Ci5-13400F (B0) – also scale well.