Today, we’ll focus on what happens inside a case when a CPU is under heavy load. We’ll run a Cinebench 2024 rendering on a Ryzen R9 7950X cooled by a Noctua NH-D15 G2 air cooler with AM5 offset mounting bars and see how it affects the temperatures and how all the values change with different settings of the system fans’ performance across their entire operating speed range.
When choosing a case, I didn’t want to choose from the best options available for a high-performance gaming rig, instead I deliberately went for a case of an older concept with the most common interior layout at the moment. Precisely because most of us probably have something similar at home: a case with a pair or trio of fans in the front, a perforated ceiling, a full glass side panel and a tunnel for a PSU on the bottom.
Fractal Design, which provided the case for our test build, also offers more modern solutions that can cool powerful gaming components better – for example, the Torrent model. The advantage of the Meshify 2 for this type of articles is that thanks to its variability and large number of fan positions, we can experiment more with the interior configuration and cooling.

I could have gone for the ultimate setup with the most powerful graphics card and the most power-hungry processor and inside a premium big tower filled with fans, but I didn’t want to go to such extremes. So I put it together with components that are not quite at the top of the range. They’re still in the high end category and don’t have the lowest power consumption either, but they’re not as far from mainstream builds as the RTX 4090 or CPUs that you have to cool with a 360mm liquid cooler.
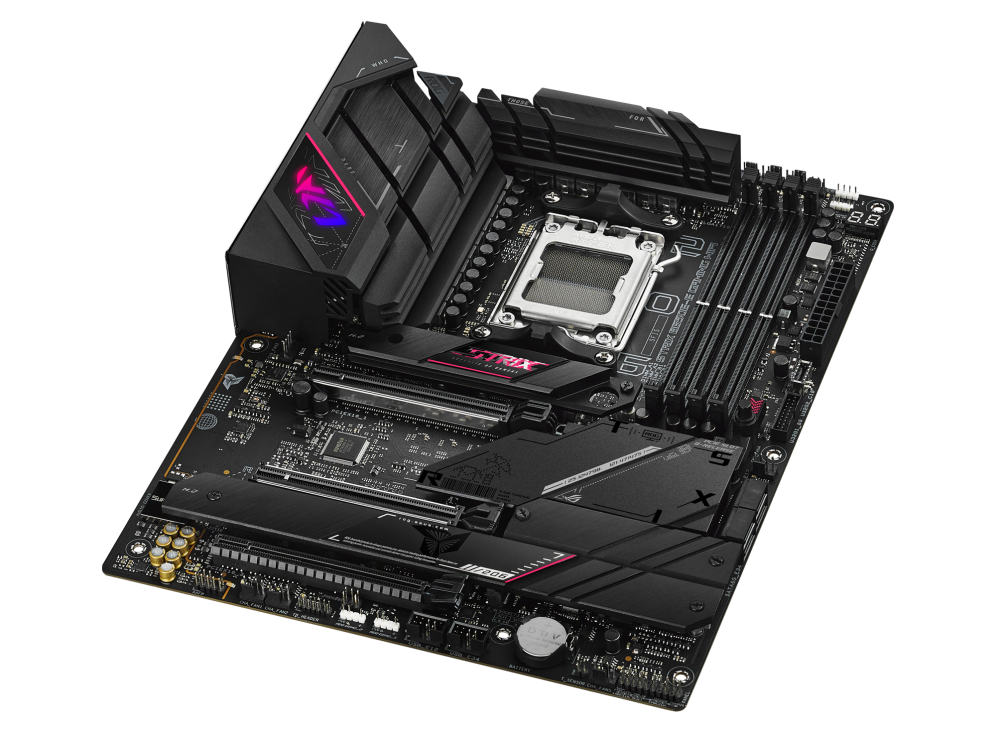
The components are mounted in an ROG Strix B650E-E Gaming WiFi motherboard from Asus. It is a motherboard for the AMD AM5 platform, suitable for demanding gamers and consumers. It offers PCIe 5.0 support, a wealth of connectors, support for fast DDR5 memory and WiFi 6E with Bluetooth. It also has an oversized power supply and large coolers for sufficient cooling of the power delivery and hard drives.
It’s equipped with an AMD Ryzen 9 7950X processor. Compared to the board’s default settings, I only made minor changes in the BIOS like disabling virtualization. It is a powerful desktop processor with 16 cores and 32 threads based on the Zen 4 architecture. Its base clock speed is 4.5GHz with an option to boost up to 5.7GHz. The processor supports DDR5 memory and the PCIe 5.0 interface. Its TDP is 170 W, which is not low, but it is not an extreme like Intel processors.
The processor is cooled by the new Noctua NH-D15 G2 (standard version) with an offset for AM5. We had a test of it here recently. The fans are connected to the CPU Fan and CPU Fan optional headers with control based on a manually set curve in the BIOS.

The system is complemented by regular Corsair Vengeance 32GB DDR5 DRAM 5600MT/s CL36 with AMD EXPO and Intel XMP profiles, I increased the clock speed to 6000 MT/s. There is also an SPD Hub Temperature sensor on the modules.
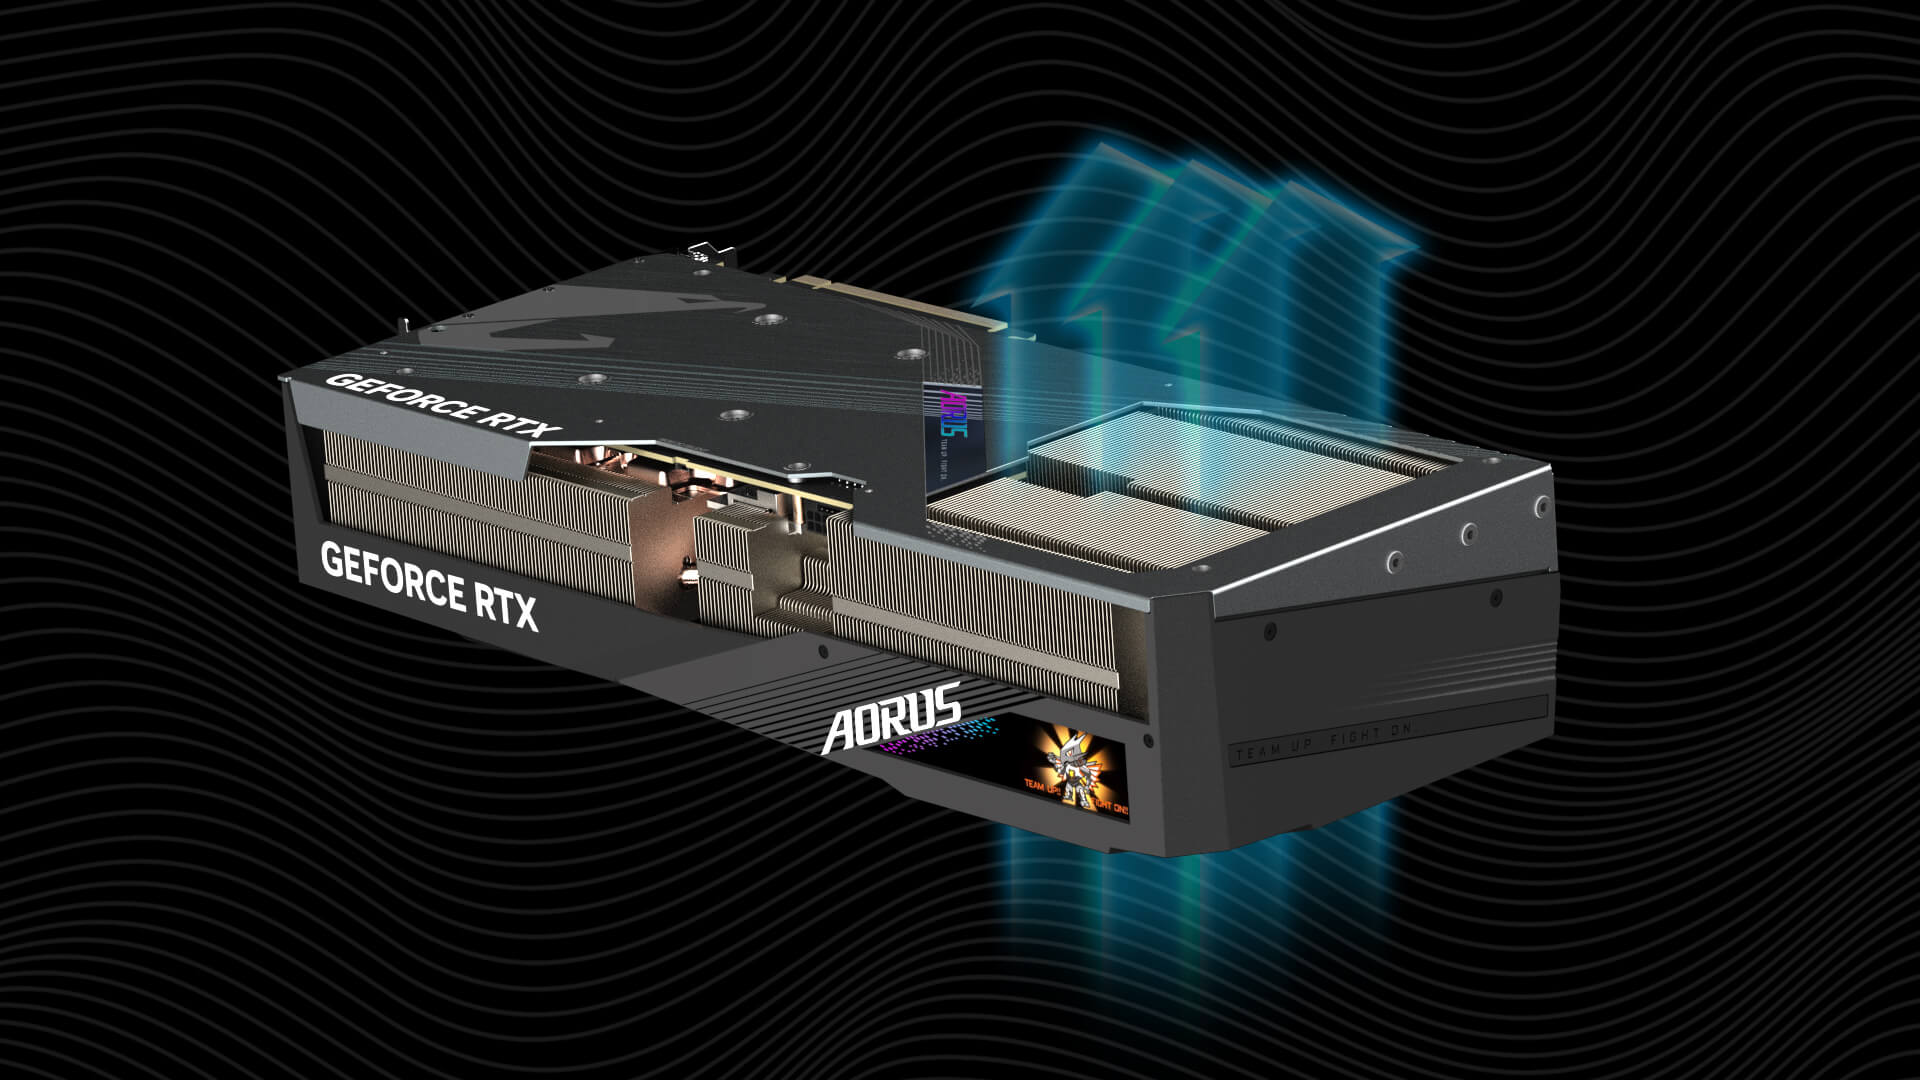
Just below the CPU cooler is a Gigabyte Aorus RTX 4080 Super Master 16G graphics card with a huge 36cm cooler. It has a pass-through cooler in the back that blows some of the heated air over the card into the space in front of the CPU cooler.
The software is installed on a 1TB Kingston SNV2S1000G drive. It is installed in the slot between the graphics card and the processor. We’ll replace it with something bigger later.
The build is powered by a powerful 1300W be quiet! Dark Power Pro 13 PSU. It is basically isolated from the rest of the system, it draws air for cooling from the bottom of the case and blows it straight out through the back panel.
The build runs Windows 11 64b 24H2 (build 26100.2314).
Today we will be looking at the basics in the default configuration. We’ll measure how the entire build behaves with the supplied fans in their pre-installed positions, what temperatures the components will be at different fan performance modes, and what effect this will have on CPU and graphics card clock speeds and cooling. We will then discuss the noise levels of the build in the individual tests in a future article.
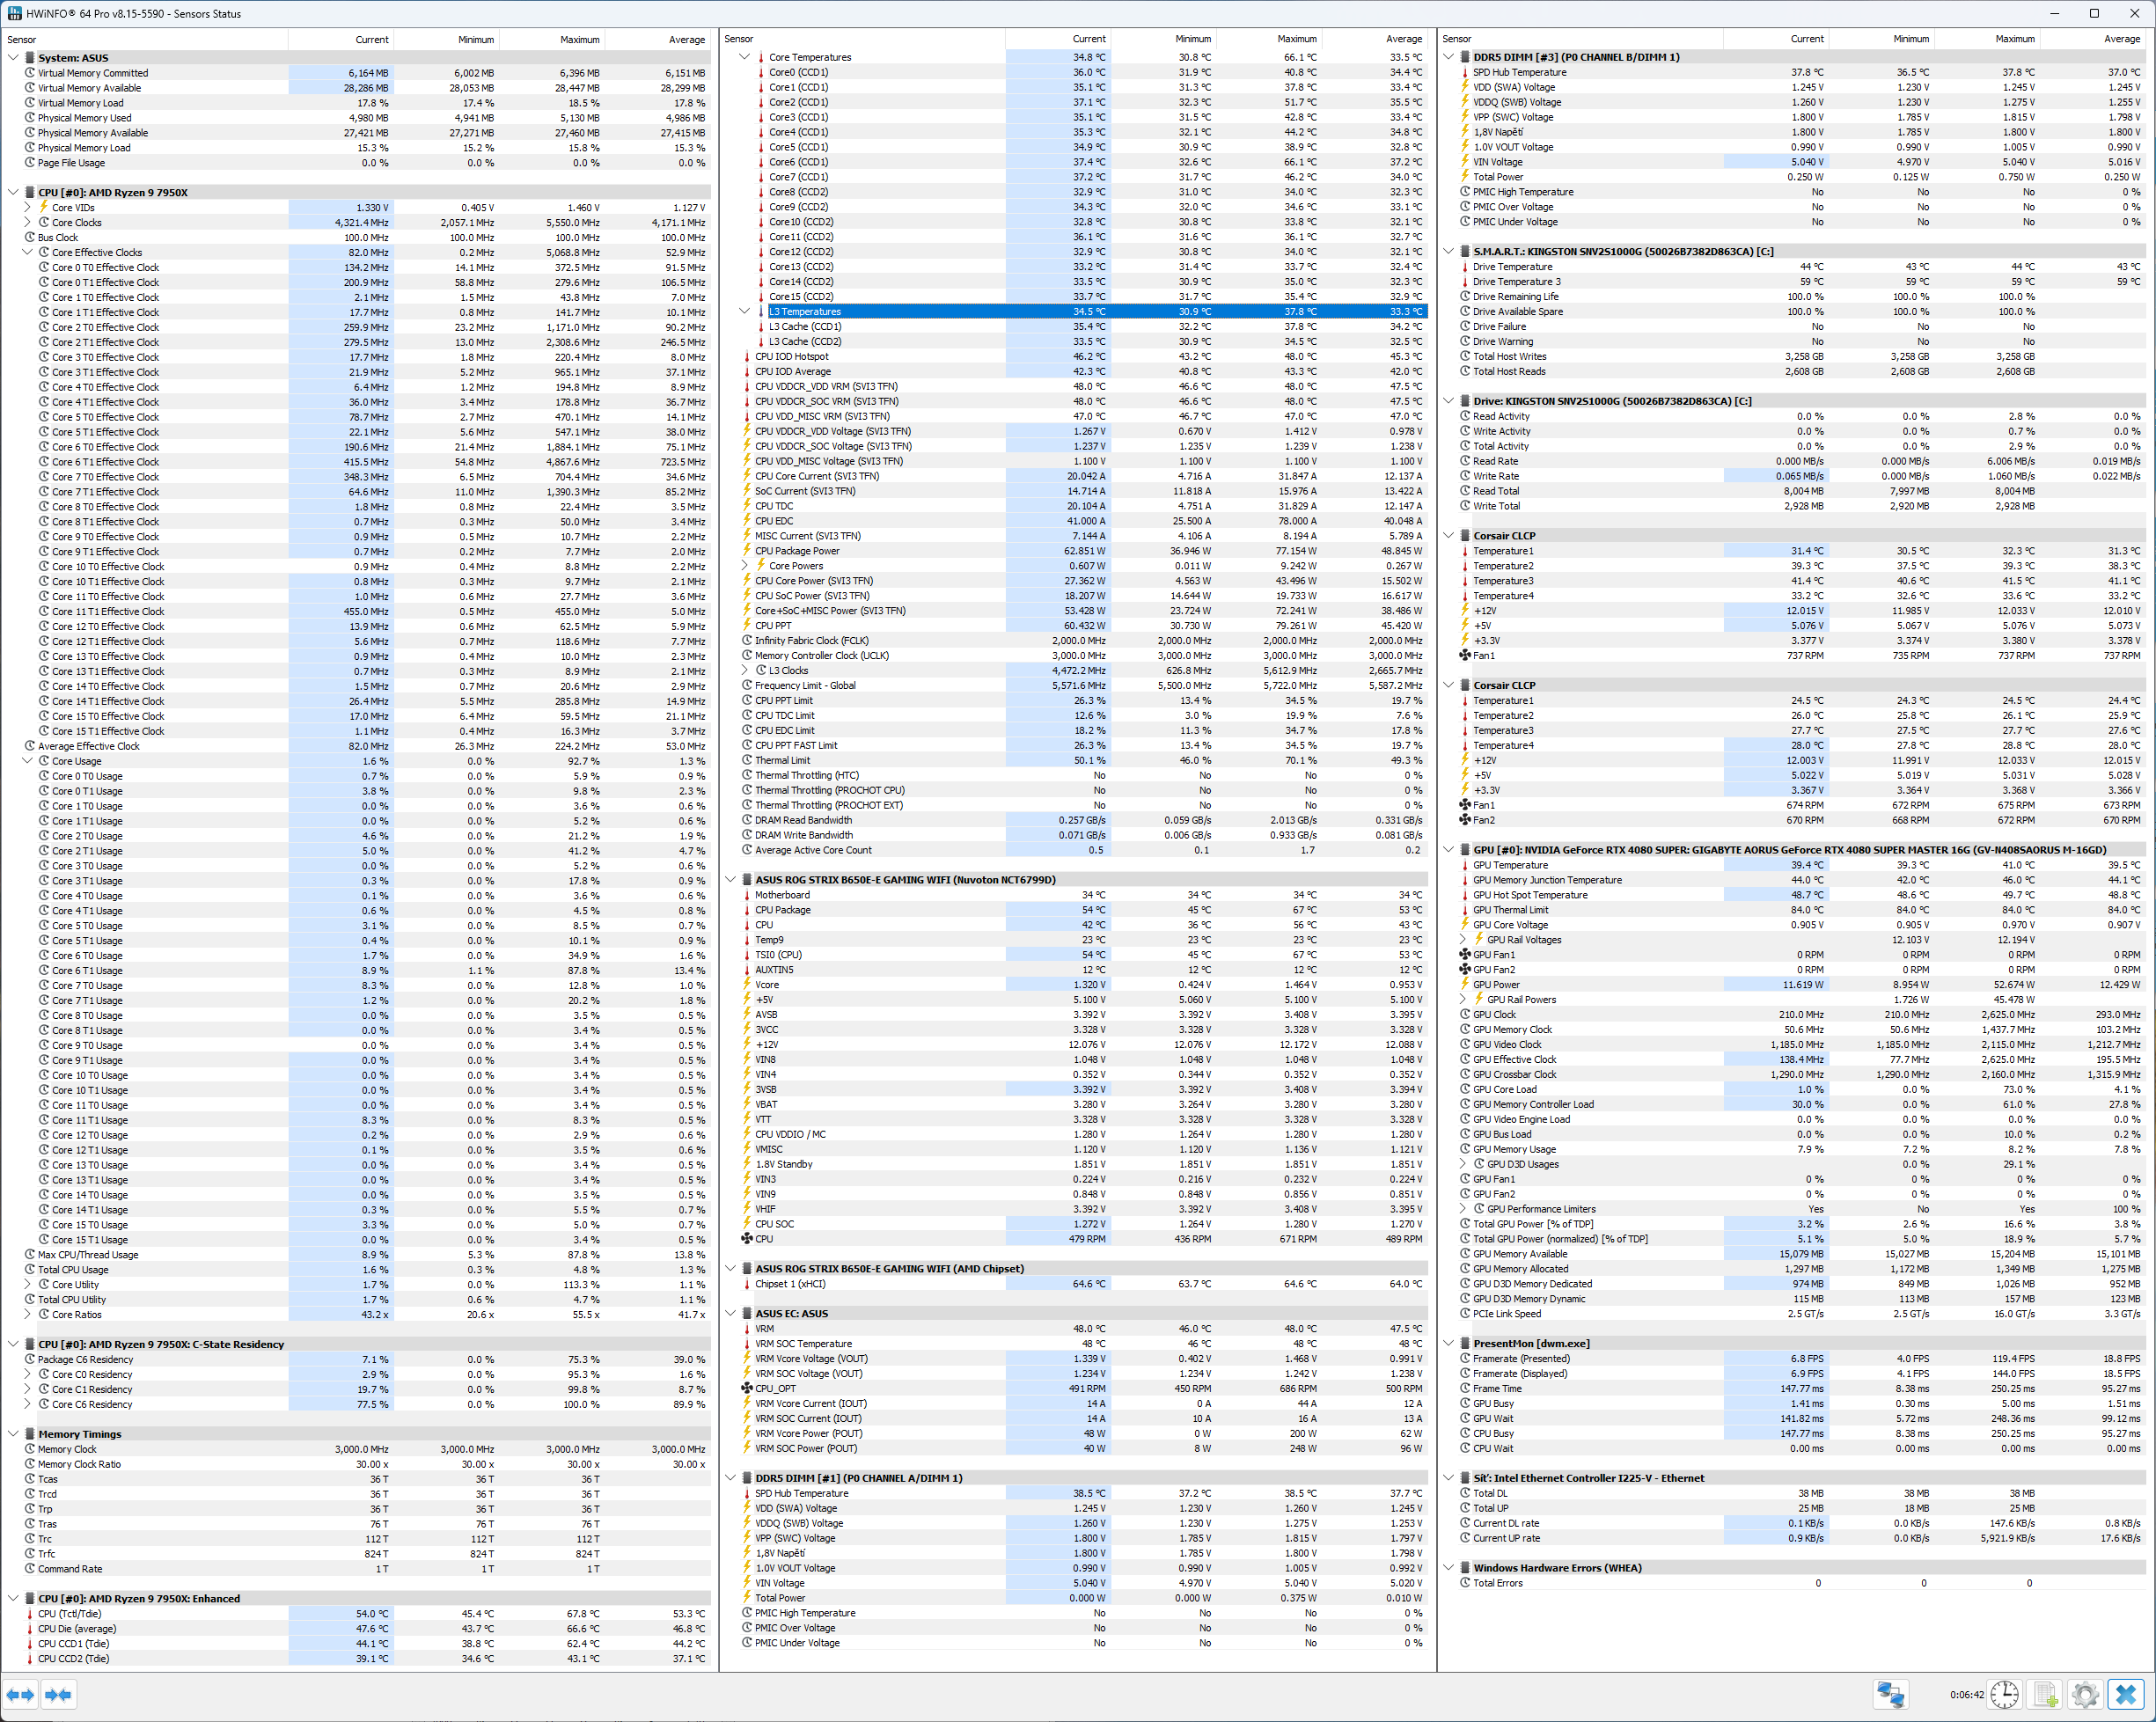
The status of the sensors will be logged in one second intervals using HWiNFO 64. The list of values we can monitor is shown in the slides below. I’m not going to make graphs for all of them, if you miss a variable too much in the results, let me know in the discussion.
We will also add the measurement of the power consumption of the whole build using a UNI-T UT71E multimeter.
⠀