Today, we’ll focus on what happens inside a case when a CPU is under heavy load. We’ll run a Cinebench 2024 rendering on a Ryzen R9 7950X cooled by a Noctua NH-D15 G2 air cooler with AM5 offset mounting bars and see how it affects the temperatures and how all the values change with different settings of the system fans’ performance across their entire operating speed range.
I had the curve for the CPU cooler fan control set roughly so that in games where the CPU load is not so high, the CPU cooler is kept at a lower speed, but in case the temperature starts to rise, the maximum speed quickly kicks in, because under intense CPU load one of the CCDs gets to 95 °C in a few seconds.
The points on the curve are at the following values:
- 20 °C – 20% performance
- 45 °C – 40% performance
- 65 °C – 70% performance
- 70 °C – 100% performance

Although the control is set very aggressively and the fans on the CPU cooler are already spinning at quite low temperatures, just a few seconds after starting the load, they reach full speed and stay there until the end of the test.
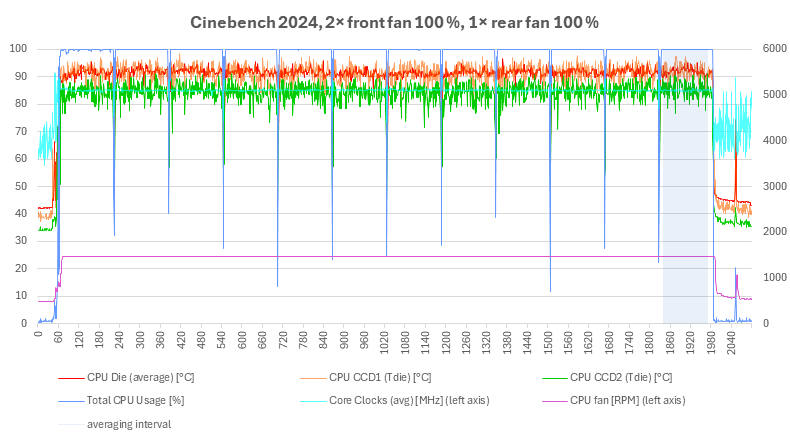
On the graph, the brown curve corresponds to the speed of a fan on the cooler. For simplicity, this is the reading of one of the two fans on the cooler, the speed of the other differs by about 30 rpm. You can see that with this setting, the fans on the cooler are spinning at maximum, but even this is not enough to keep the temperatures of some cores from climbing to 95 °C.
CPU cooler, system fans 100 % – 0 %
The first graph shows the average speed of the system fans (Front Fan 1 and 2, Rear Fan) and one of the two fans on the NH-D15 G2 cooler. In all graphs, these will be the values measured after warming up, during the last run of the test.

The entire test run
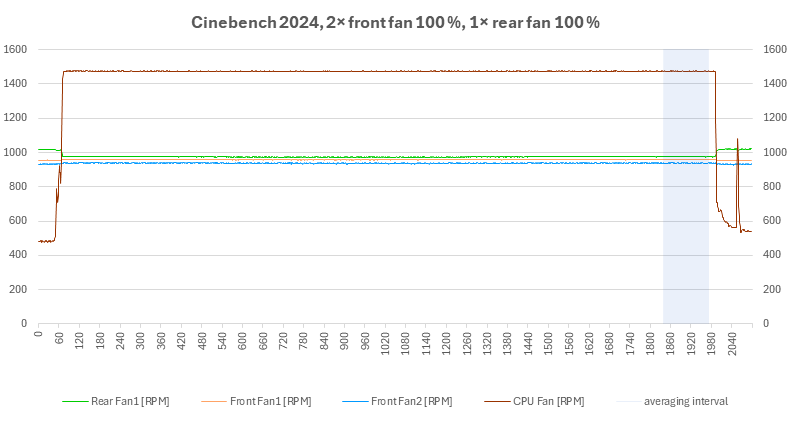

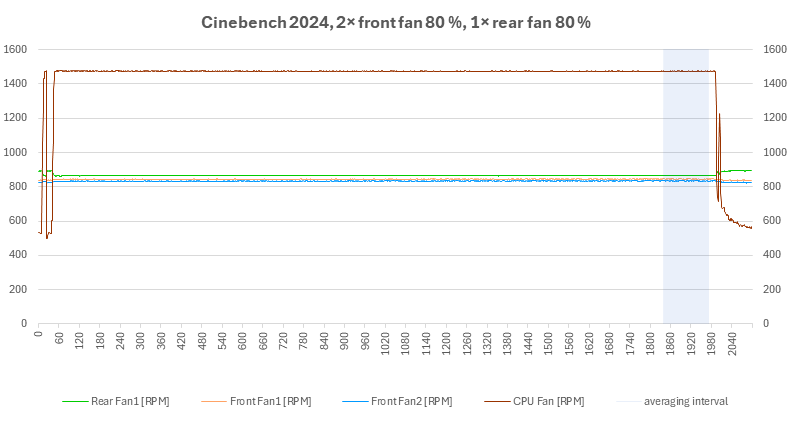
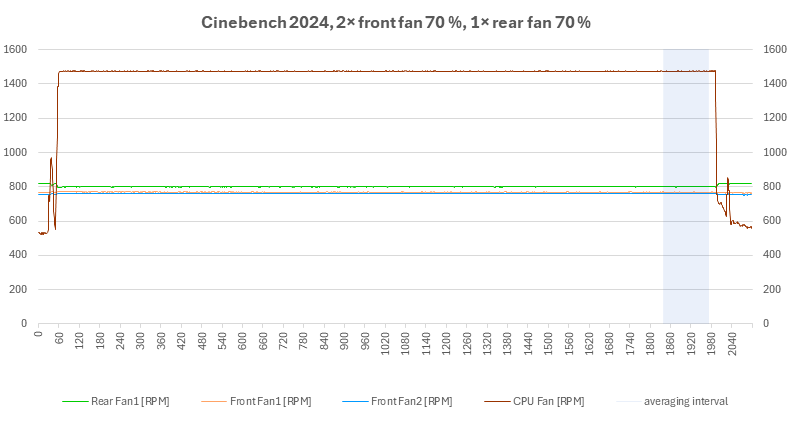
System fan performance at 100%, 90%, 80%, 70%
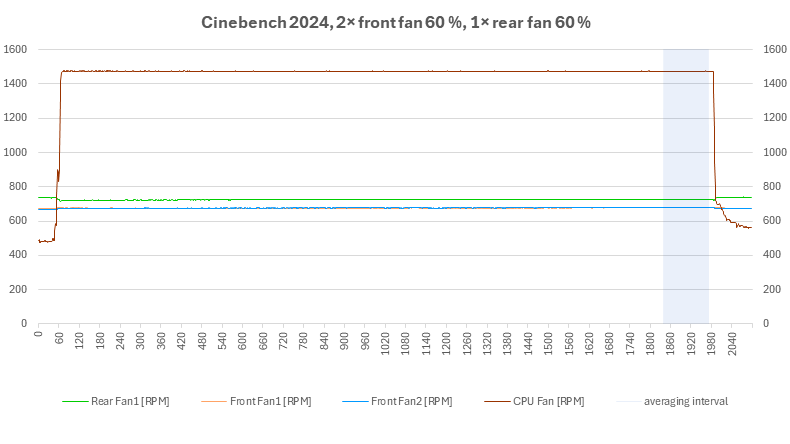

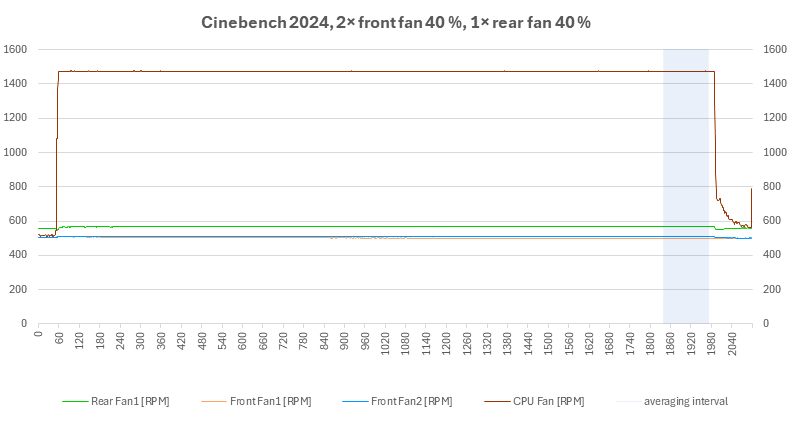

System fan performance at 60%, 50%, 40%, 0%
CPU temperatures and clock speeds, system fans 100% – 0%
The following graph shows the average CCD temperatures and overall CPU utilization.


The entire test run
Below are the value curves from the individual sensors.

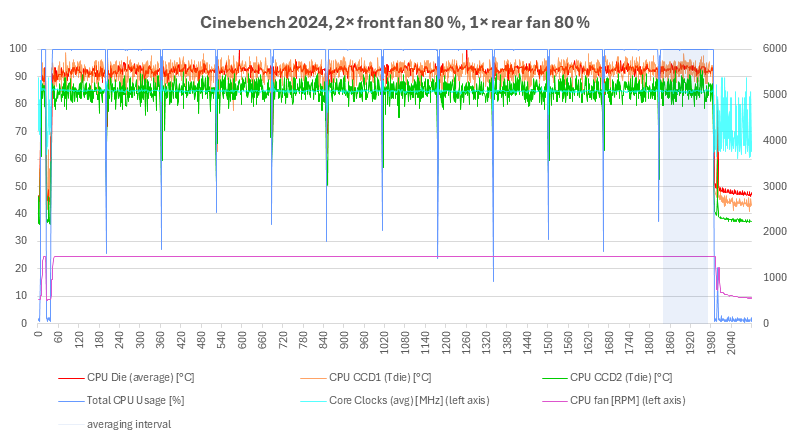
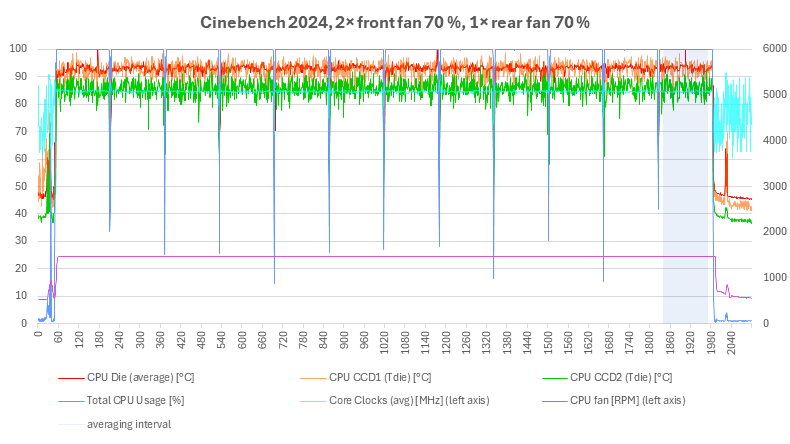
System fan performance at 100%, 90%, 80%, 70%
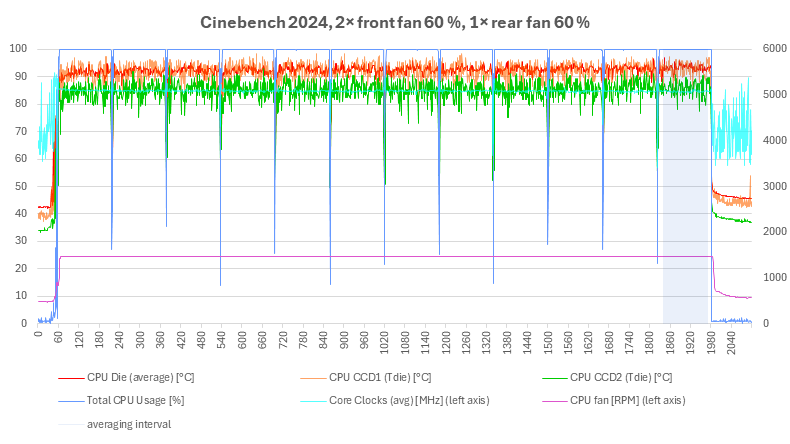
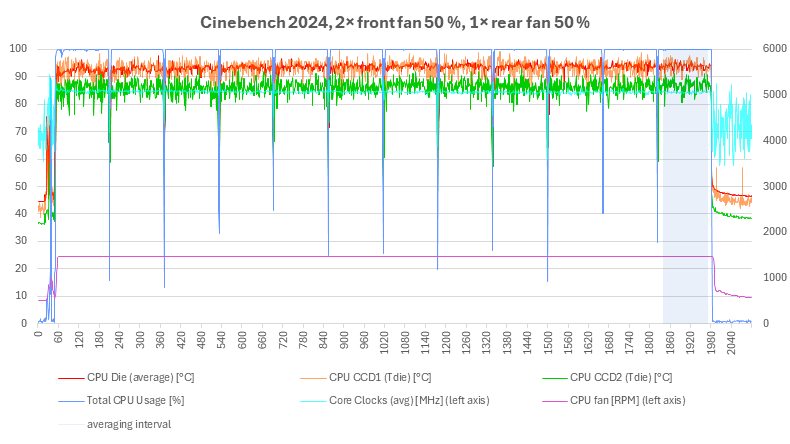

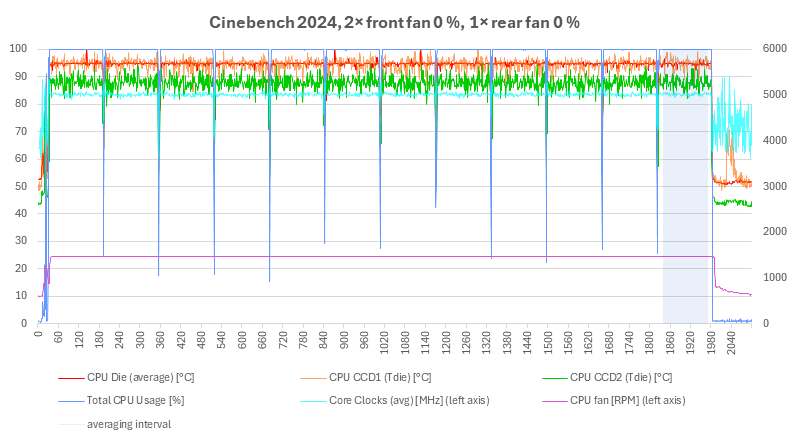
System fan performance at 60 %, 50 %, 40 %, 0 %
Detail, last run
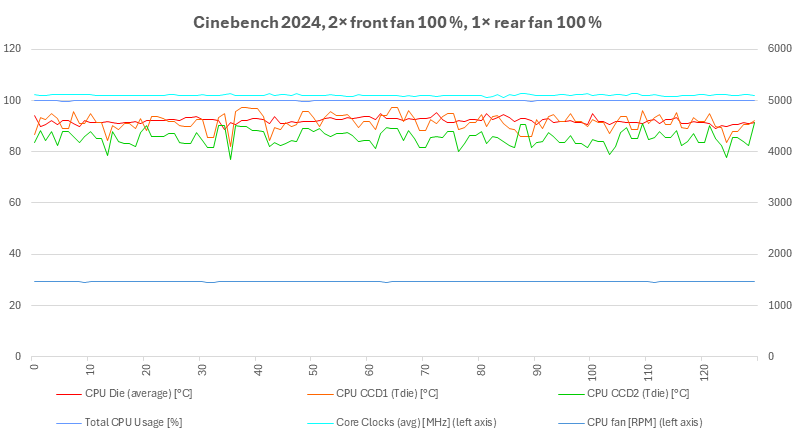
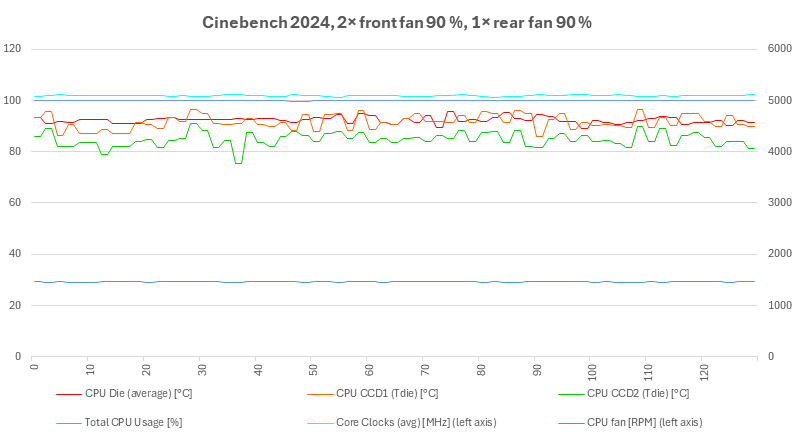

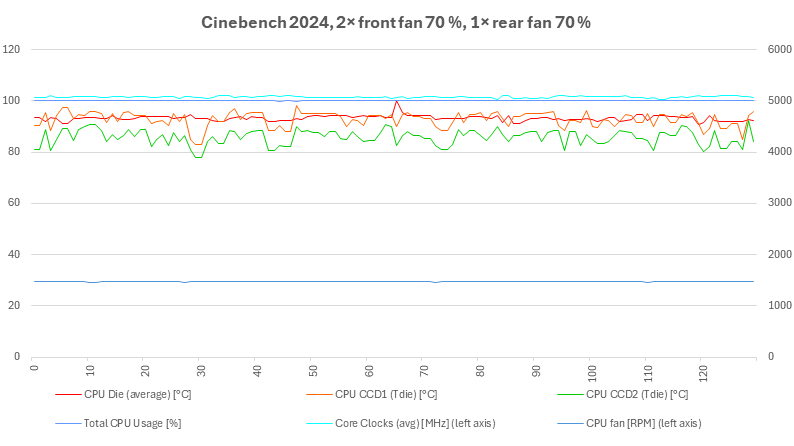
System fan performance at 100 %, 90 %, 80 %, 70 %

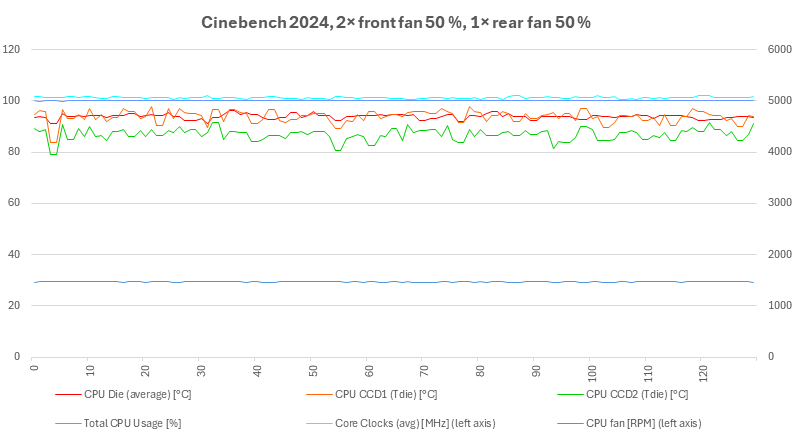

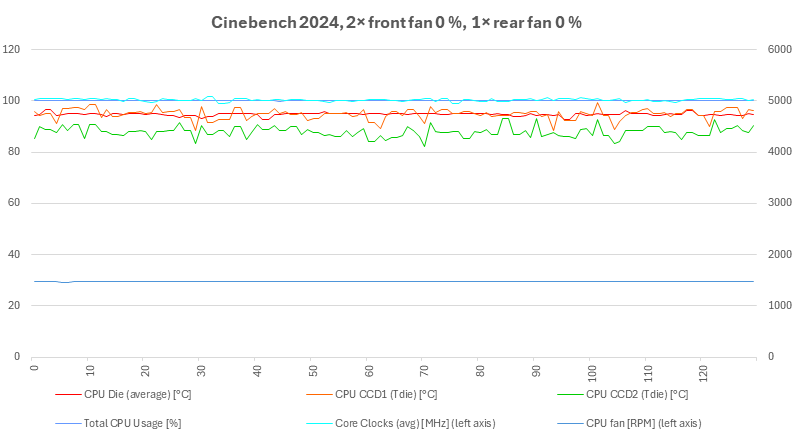
System fan performance at 60 %, 50 %, 40 %, 0 %
Graphics card, system fans 100 % – 0 %
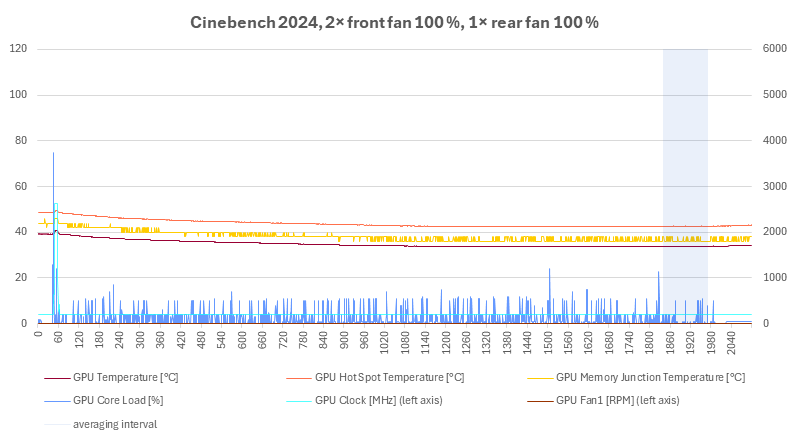
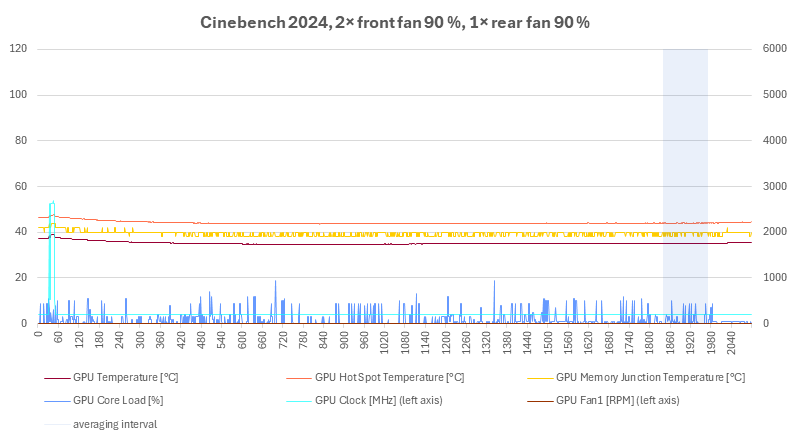
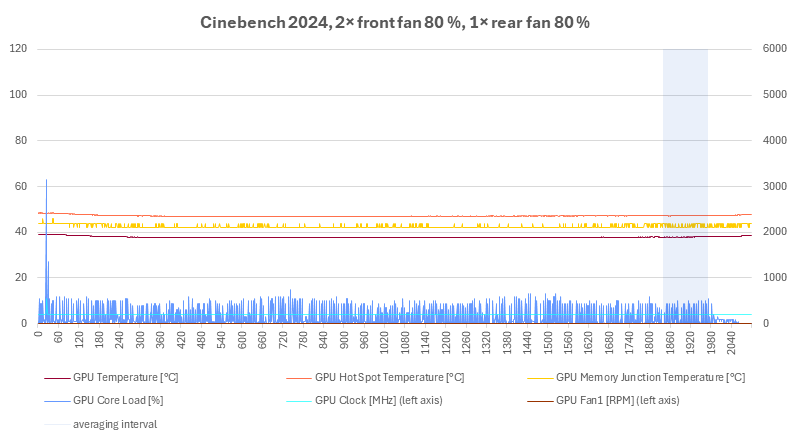
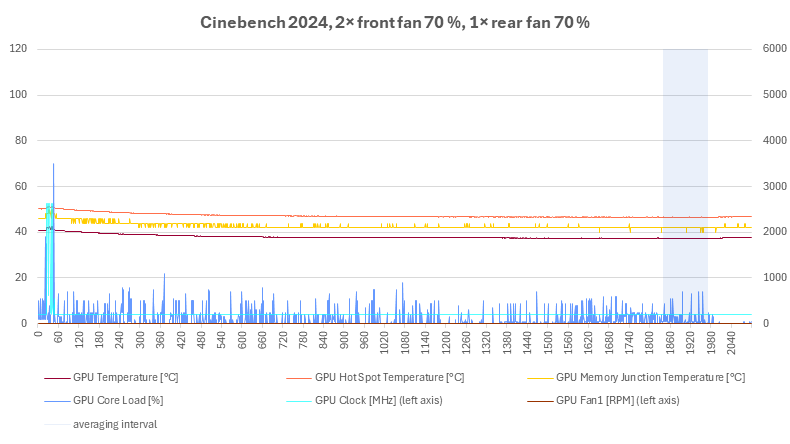
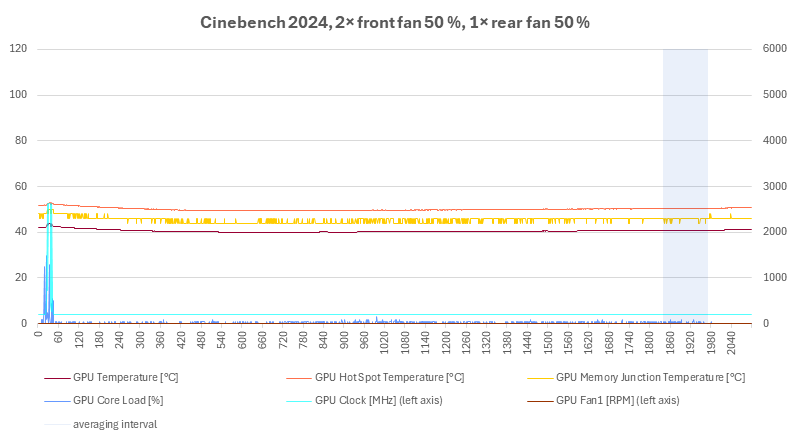
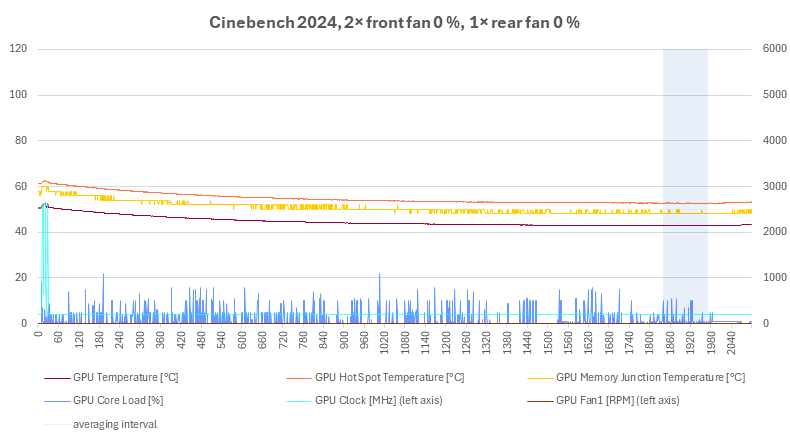
The first graph shows the average temperatures from the last run and the overall GPU utilization. The graphics card is not under load, yet it is clear that when the CPU heats up in the case, the temperatures increase as the performance of the system fans decreases.

The second chart shows the average GPU clock speed, fan speed and GPU utilization. During the entire time the CPU is under load, the cooler on the graphics card manages to cool the GPU passively. In the penultimate run of the test the average GPU clock speed is higher, for some reason during the test the chip ran at 3D clock speeds for a while, which raised the overall average. This can also be seen in the runs where there is a brief spike in clock speeds in the very last run, from which the average is calculated.
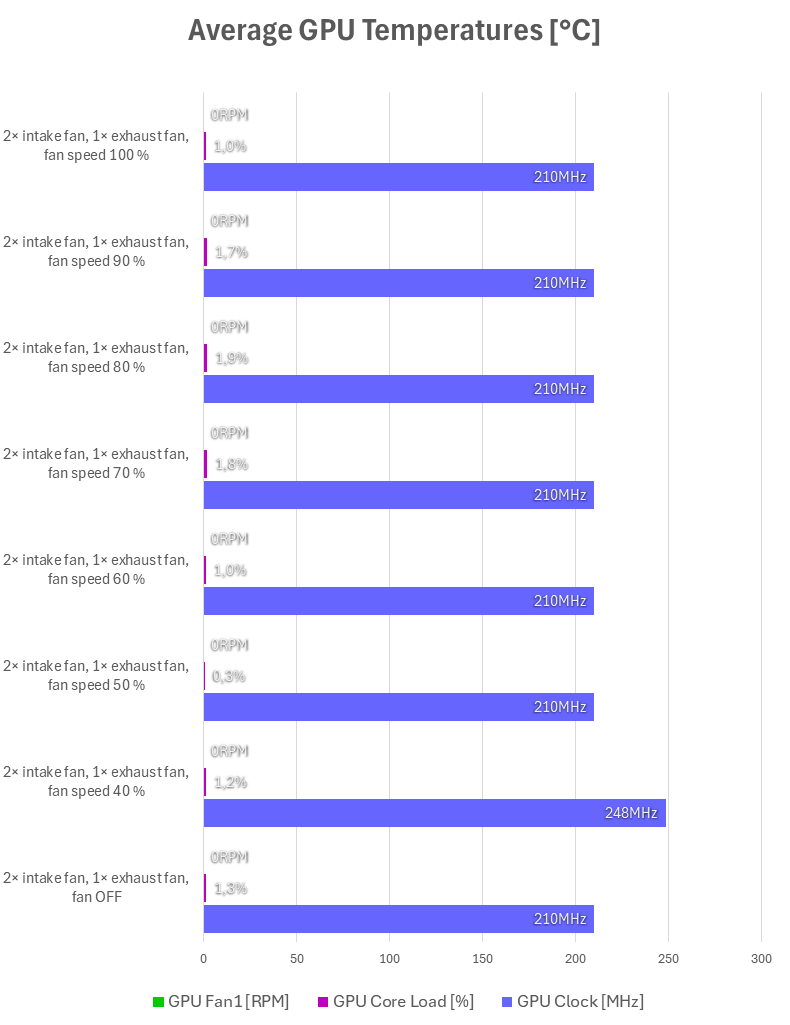
The entire test run


⠀