

Methodology: how we measure power draw
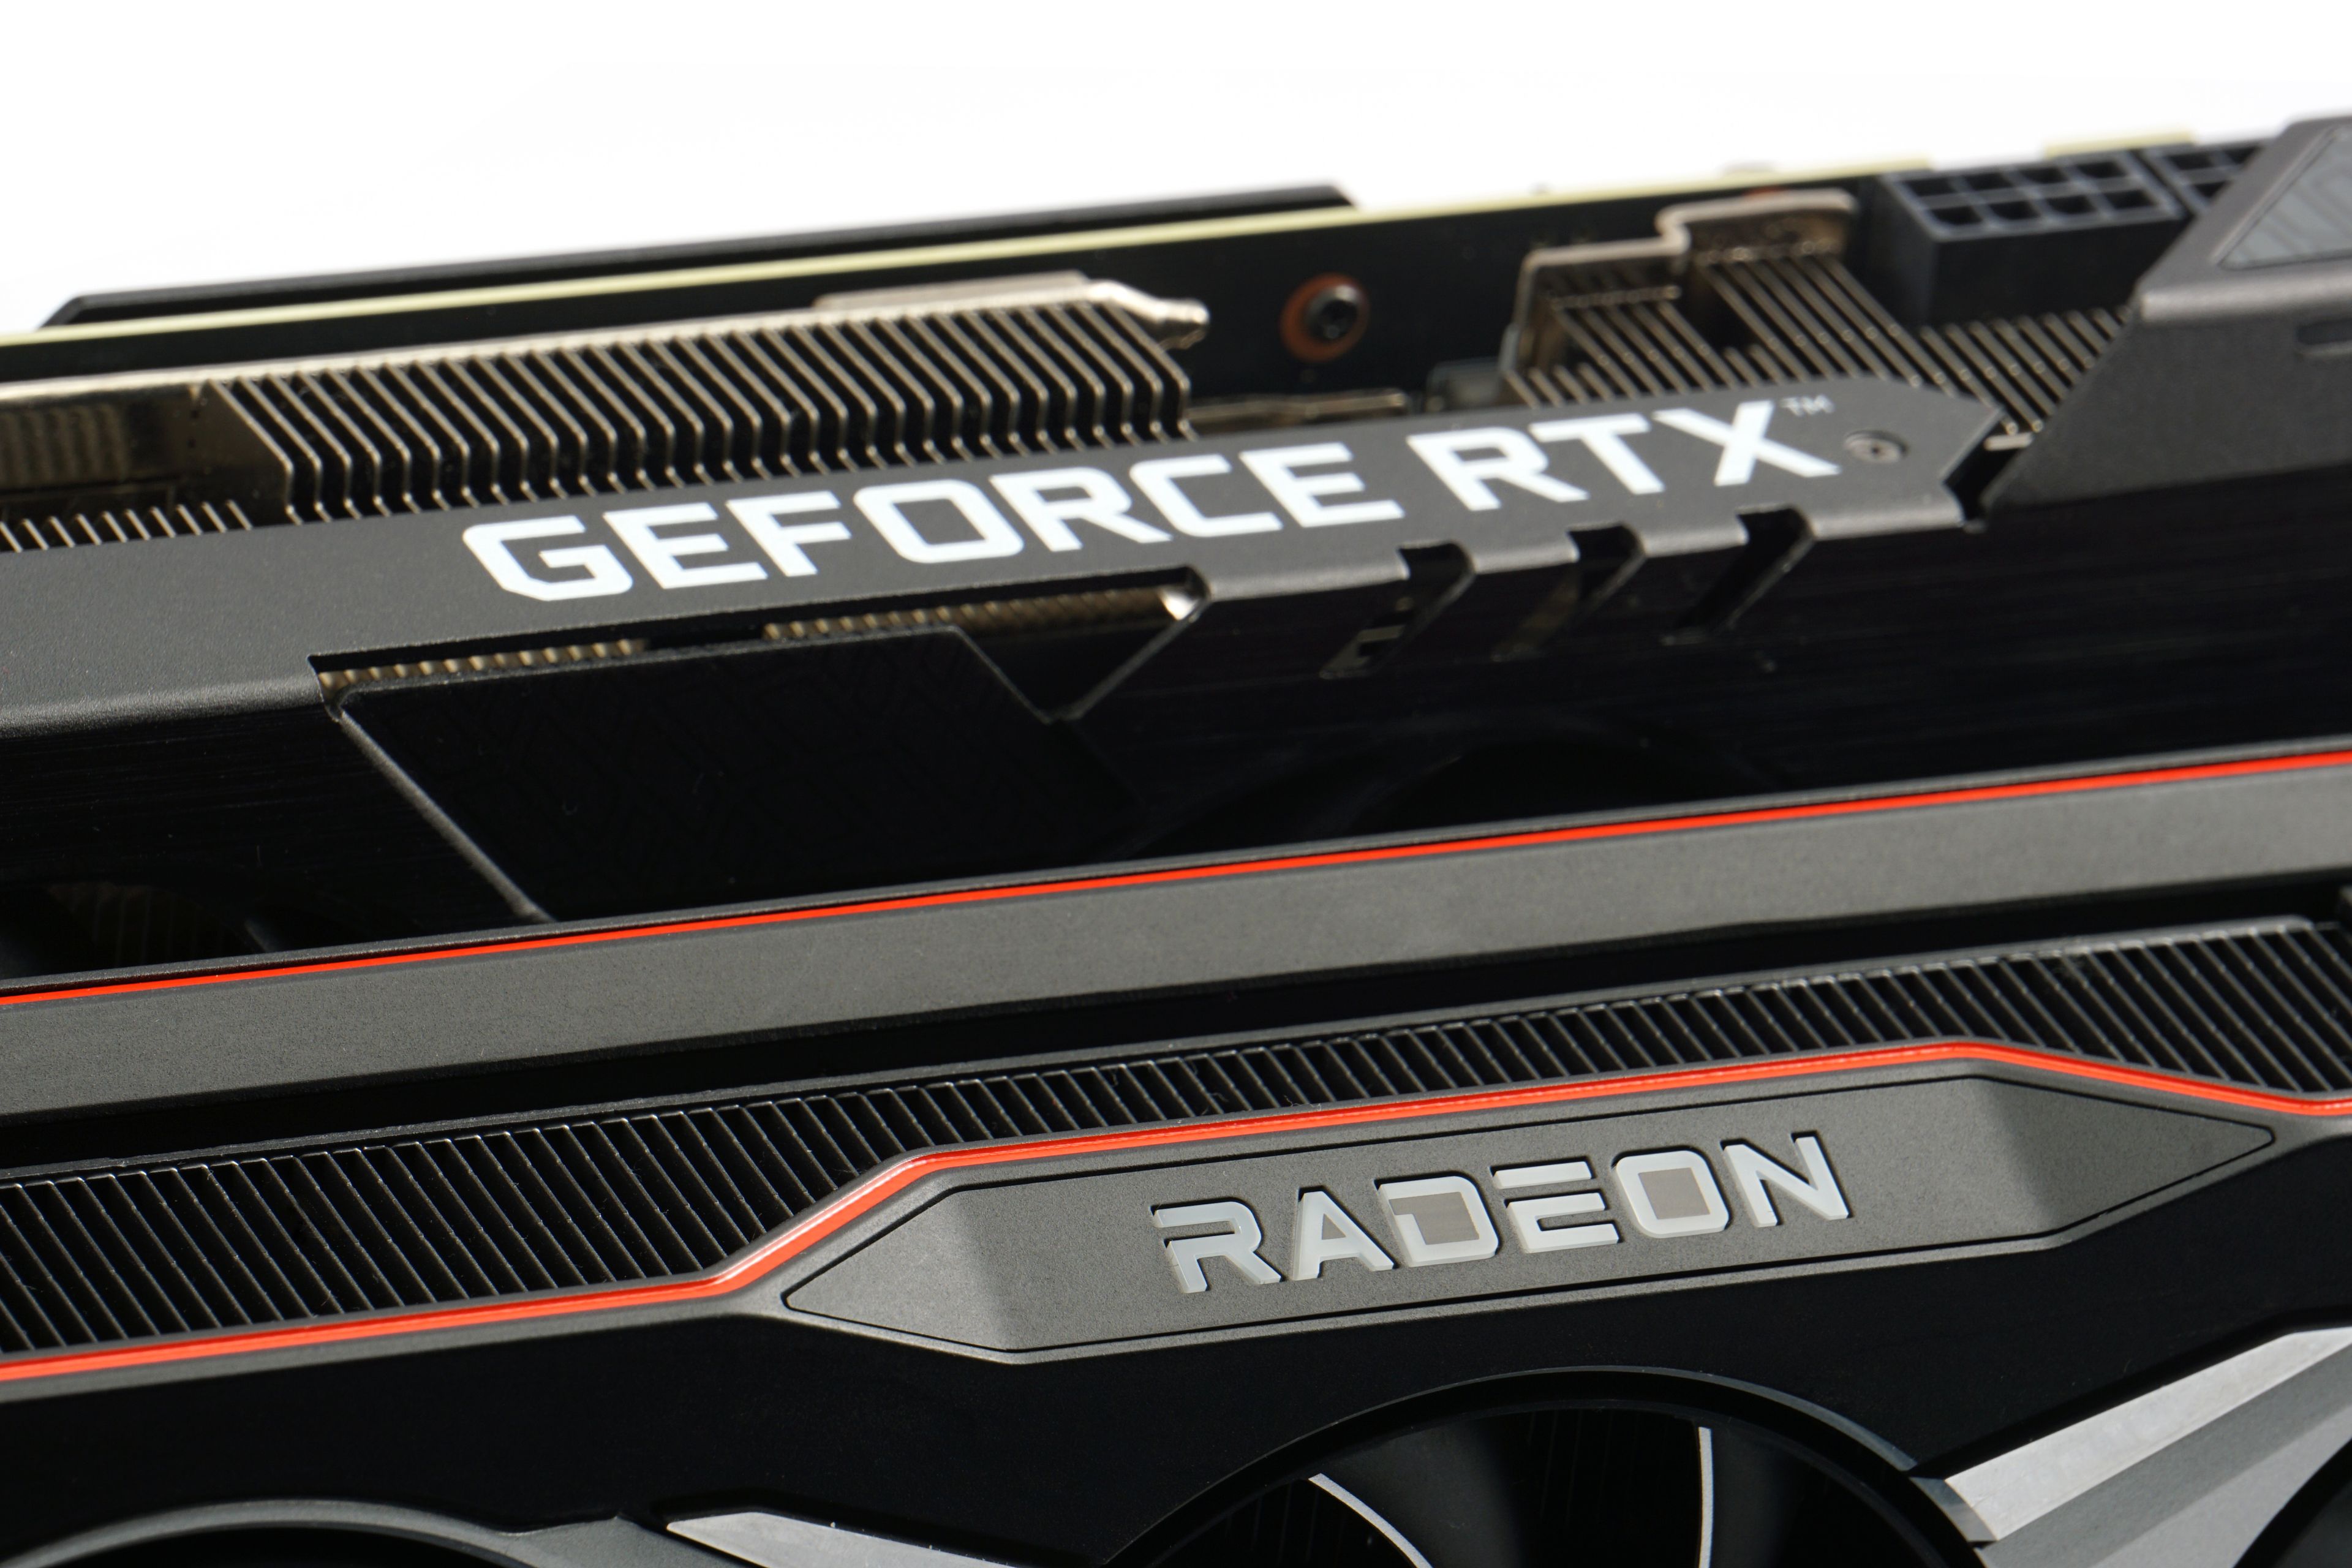
Eighteen selection games in various resolutions and settings, performance tests in computing applications, detailed analysis of power draw and generated sound, in which we go up to the level of frequency responses. This captures the new robust methodology for graphics card testing. And right at the beginning, popular high-end models from both camps are going to undergo the tests.
Methodology: how we measure power draw
We have been tuning the method of measuring power draw for quite a long time and we will also be tuning it for some time. But we already have gimmicks that we can work with happily.
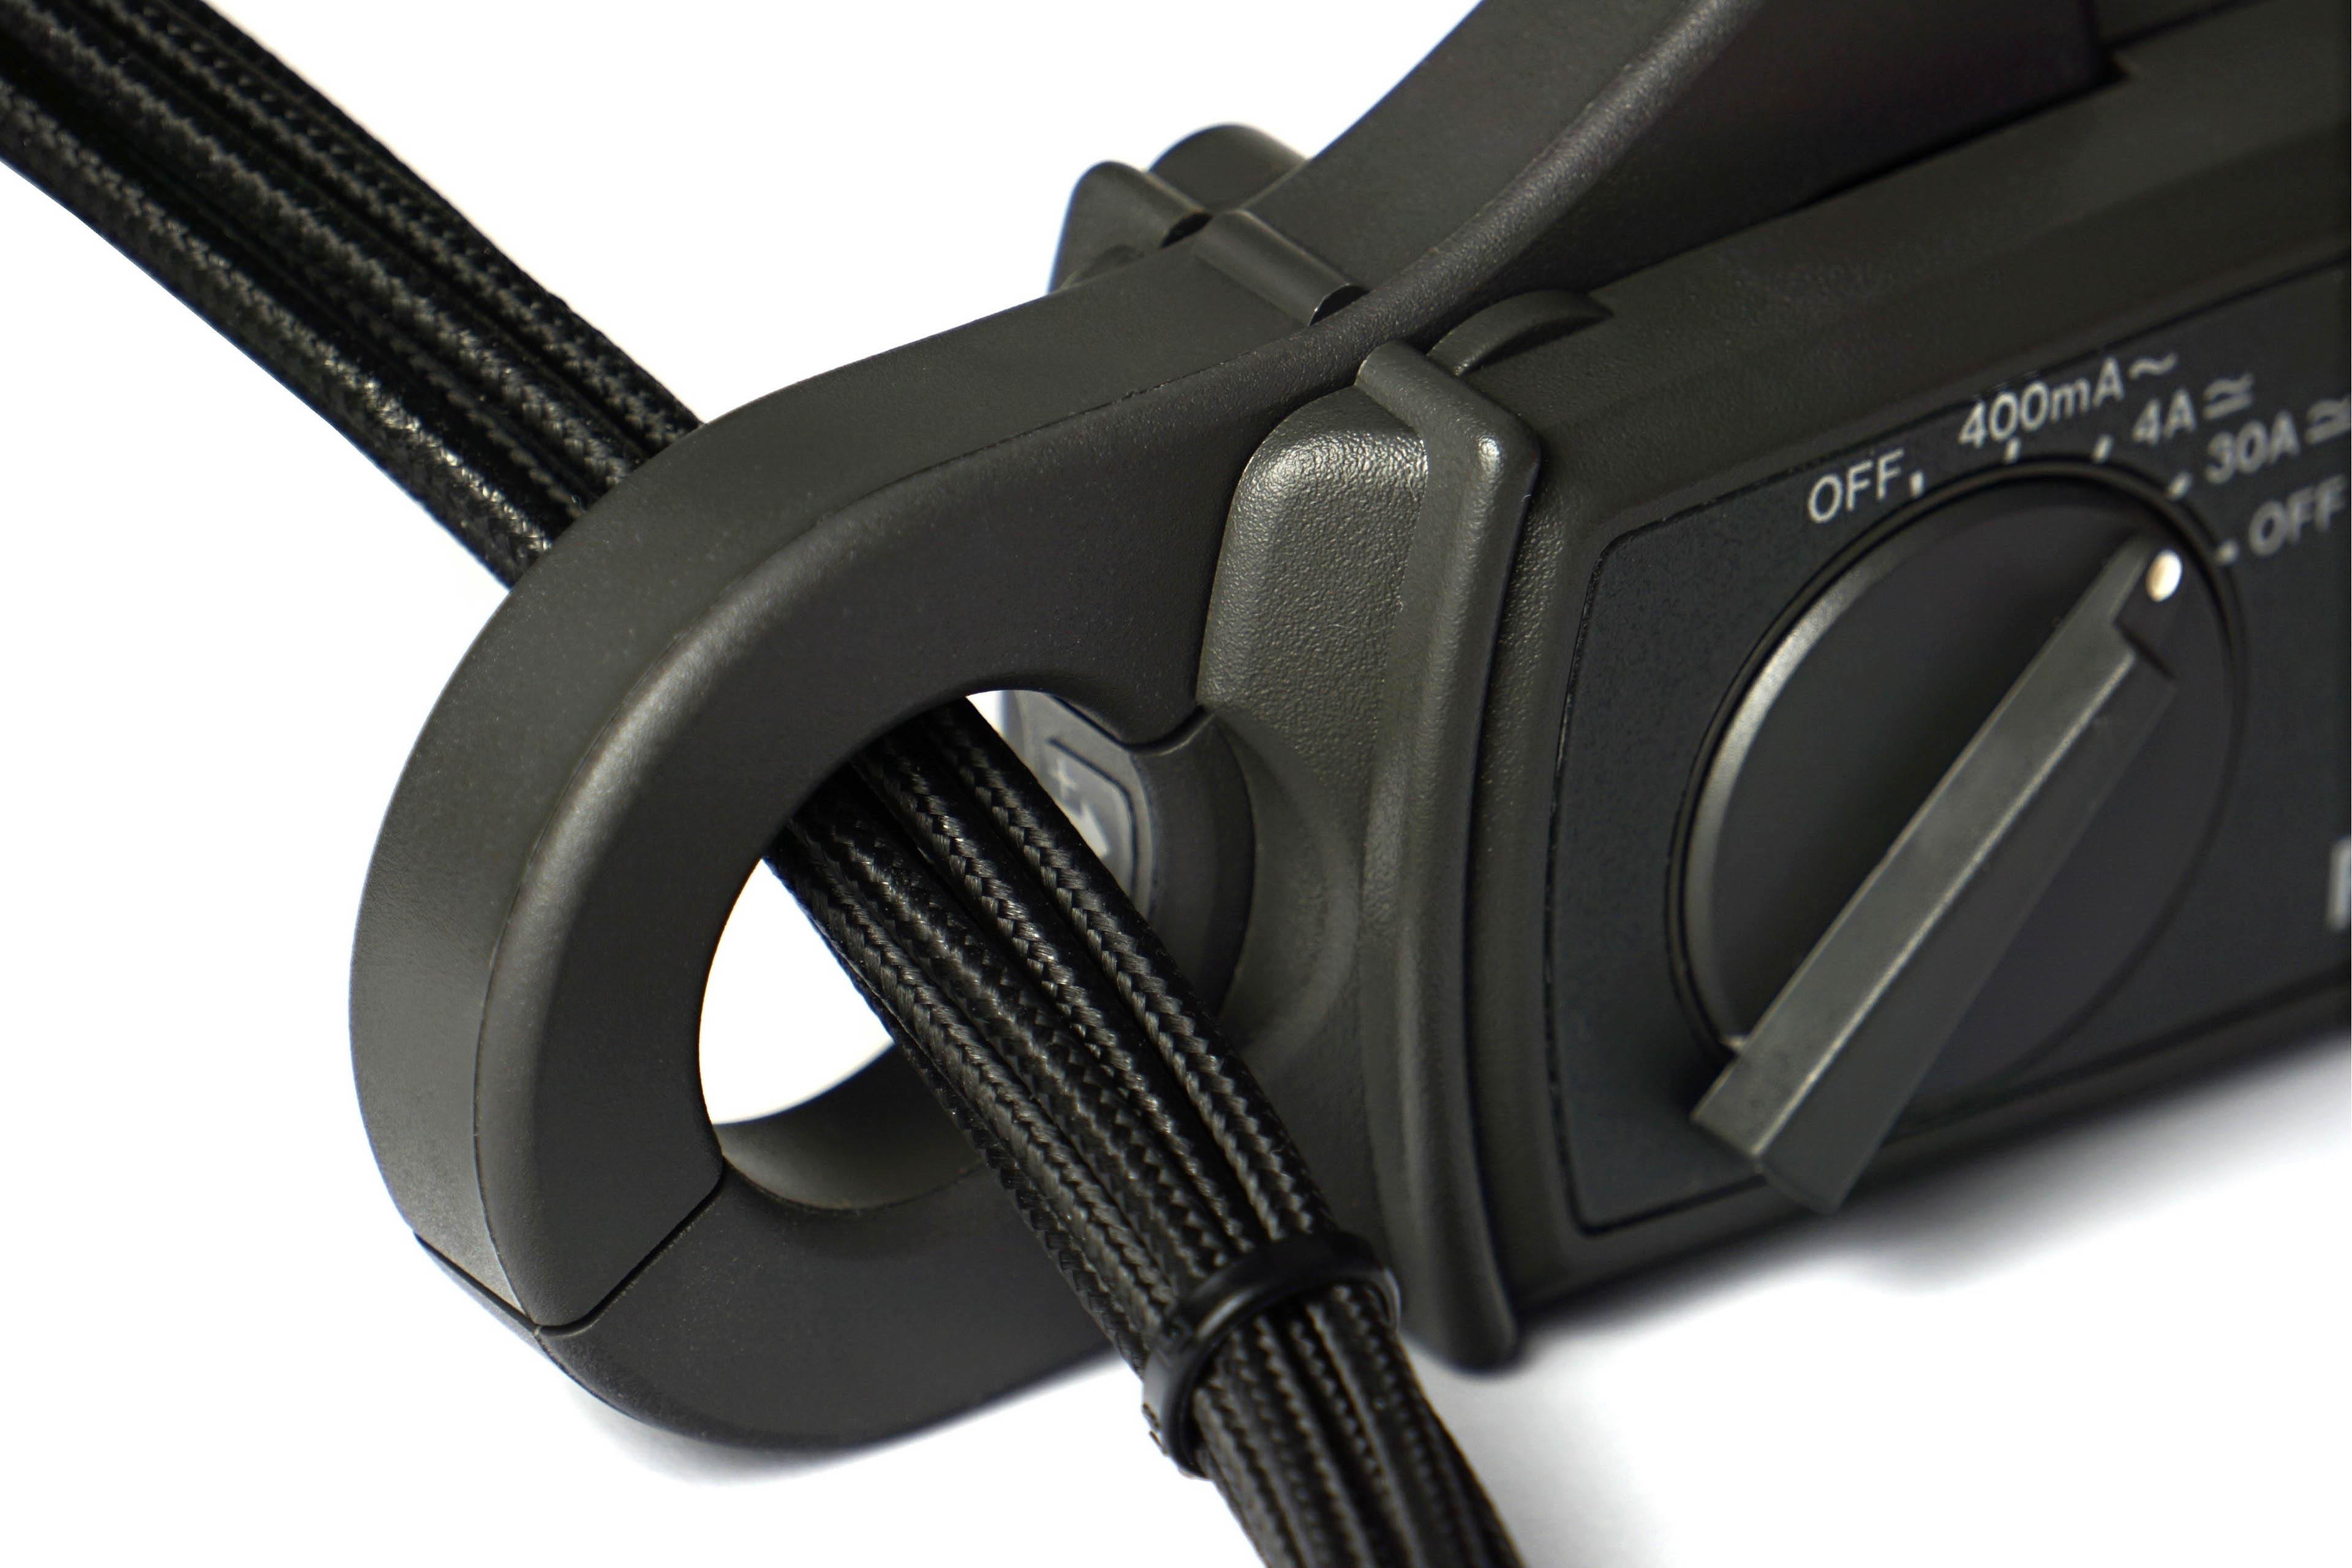
To get the exact value of the total power draw of the graphics card, it is necessary to map the internal power draw on the PCI Express slot and the external one on the additional power supply. For the analysis of the PCIe slot, it was necessary to construct an in-between card on which the power draw measurement takes place. Its basis is resistors calibrated to the exact value (0.1 Ω) and according to the amount of their voltage drop we can calculate the current. We then substitute it into the formula for the corresponding value of the output voltage ~ 12 V and ~ 3.3 V. The voltage drop is so low that it doesn’t make the VRM of the graphics card unstable and the output is still more than 12/3.3 V.

We are also working on a similar device for external power supply. However, significantly higher currents are achieved there, longer cabling and more passages between connectors are necessary, which means that the voltage drop will have to be read on an even smaller resistance of 0.01 Ω, the current state (with 0.1 Ω) is unstable for now. Until we fine-tune it, we will use Prova 15 current clamp for cable measurements, which also measures with good accuracy, they just have a range of up to 30 A. But that is also enough for the OC version of the RTX 3090 Gaming X Trio. If a card is over the range, it is always possible to split the consumption measurement (first into one half and then into the other half of the conductors for +12 V).
And why bother with such devices at all when Nvidia has a PCAT power draw analyzer? For complete control over the measurements. While our devices are transparent, the Nvidia’s tool uses the processor that can (but of course does not have to) affect the measurements. After testing the AMD graphics card on the Nvidia’s tool, we probably wouldn’t sleep well.
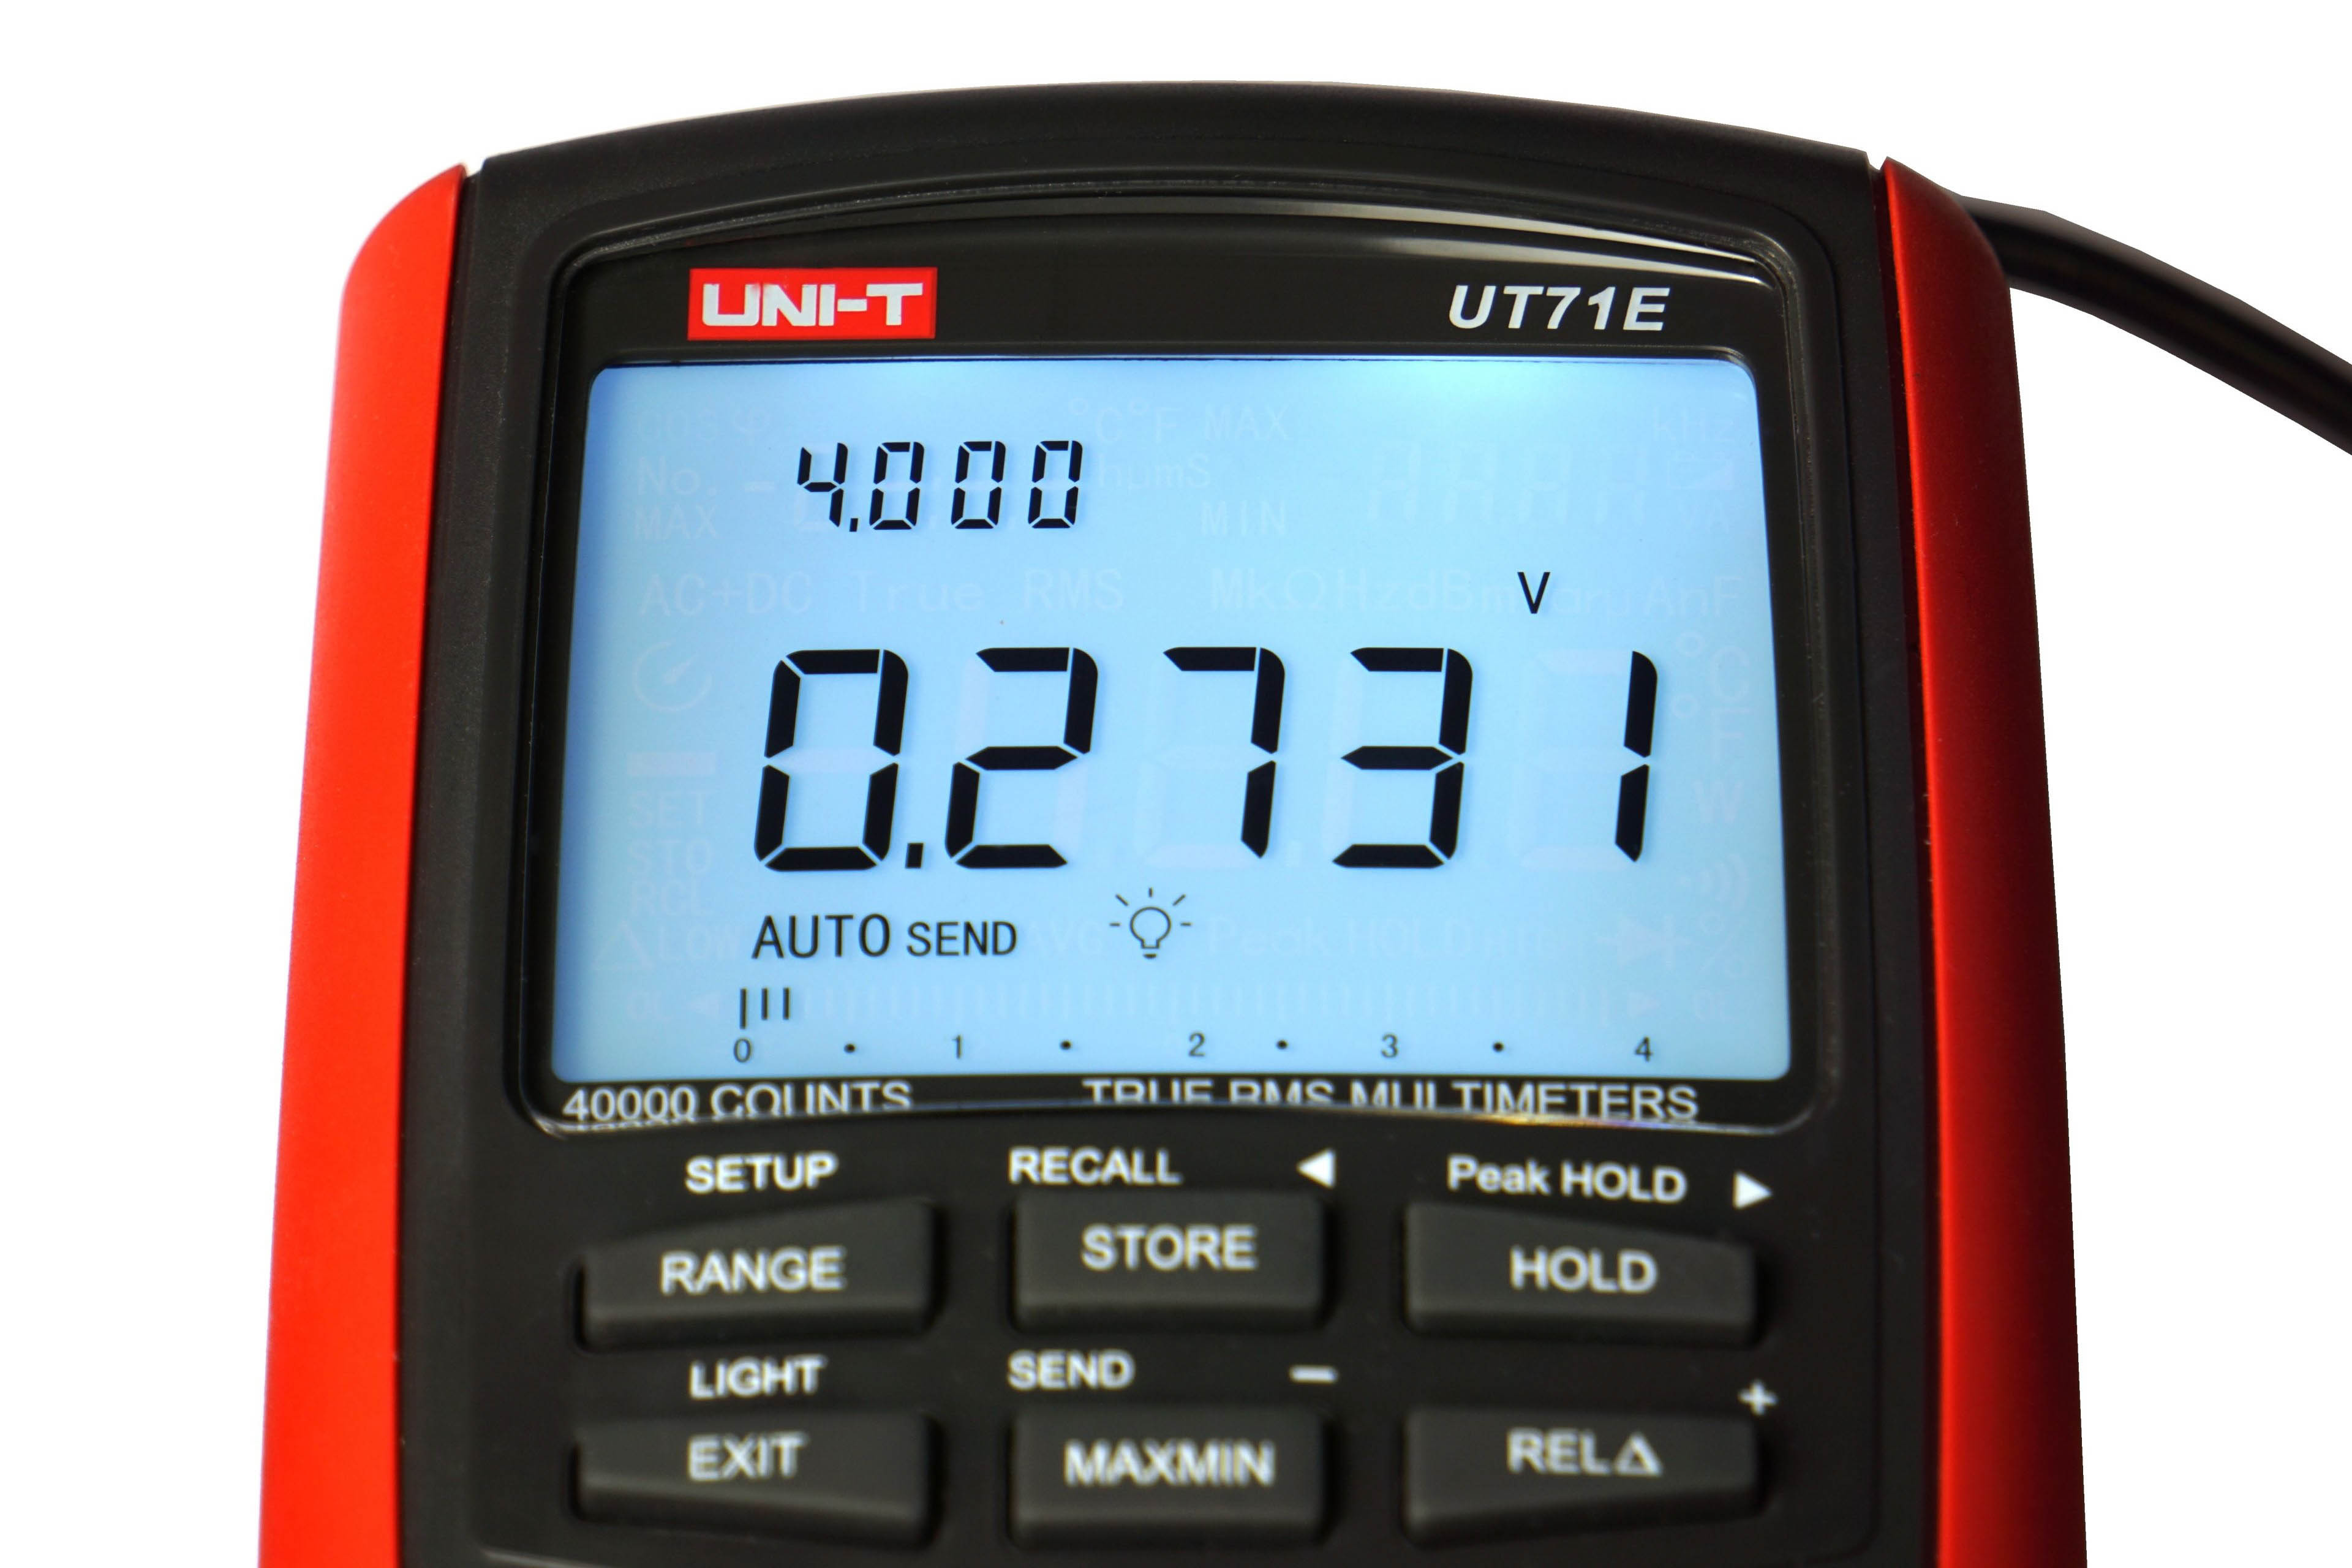
To read and record measurements, we use a properly calibrated multimeter UNI-T UT71E, which exports samples to XLS. From it we obtain the average value and by substituting into the formula with the exact value of the sub-circuit output voltages we obtain the data for the graphs.


We will analyze the line graphs with the waveforms for each part of the power supply separately. Although the 3.3 V value is usually negligible, it needs to be monitored. It is difficult to say what exactly this branch powers, but usually the consumption on it is constant and when it changes only with regard to whether a static or dynamic image is rendered. We will measure the consumption in this article in a demanding game (Shadow of the Tomb Raider) and less demanding (CS:GO) with the highest graphic settings and UHD resolution (3840 × 2560 px) and out of load on the idle Windows 10 desktop. But measurements from work environment, which is well presented by LuxMark, will also be added, and in less power-thirsty 4K@60 fps video (Jellyfish) decoding modes with a data rate of 120 Mbps in online format VP9 (Google Chrome) and HEVC (VLC). And you might also be interested in how much the power draw will increase when you connect a second high-resolution monitor? 🙂
- Contents
- Graphics cards in details
- Table of specs
- Methodology: performance tests
- Methodology: how we measure power draw
- Methodology: noise and sound measurement
- Methodology: heat tests
- Test rig
- 3DMark
- Age of Empires II: DE
- Assassin’s Creed: Valhalla
- Battlefield V
- Battlefield V with DXR
- Borderlands 3
- Control
- Control with DXR and DLSS
- Counter Strike: GO
- Cyberpunk 2077
- Cyberpunk 2077 with DLSS and FidelityFX
- Cyberpunk 2077 with DXR, DLSS and FidelityFX
- DOOM Eternal
- F1 2020
- FIFA 21
- Forza Horizon 4
- Mafia: DE
- Metro Exodus
- Metro Exodus with DXR and DLSS
- Microsoft Flight Simulator 2020
- Red Dead Redemption 2 (Vulkan)
- Red Dead Redemption 2 (Dx12)
- Shadow of the Tomb Raider
- Shadow of the Tomb Raider with DXR
- Total War Saga: Troy
- Wasteland 3
- Overall gaming performance and performance per euro
- GPU clock speed
- Heating of the GPU and VRAM
- Net graphics power draw and performance per watt
- Analysis of 12 V sub-circuit power supply
- Analysis of 3.3 V sub-circuit power supply
- Noise level
- Frequency response of sound
- Conclusion