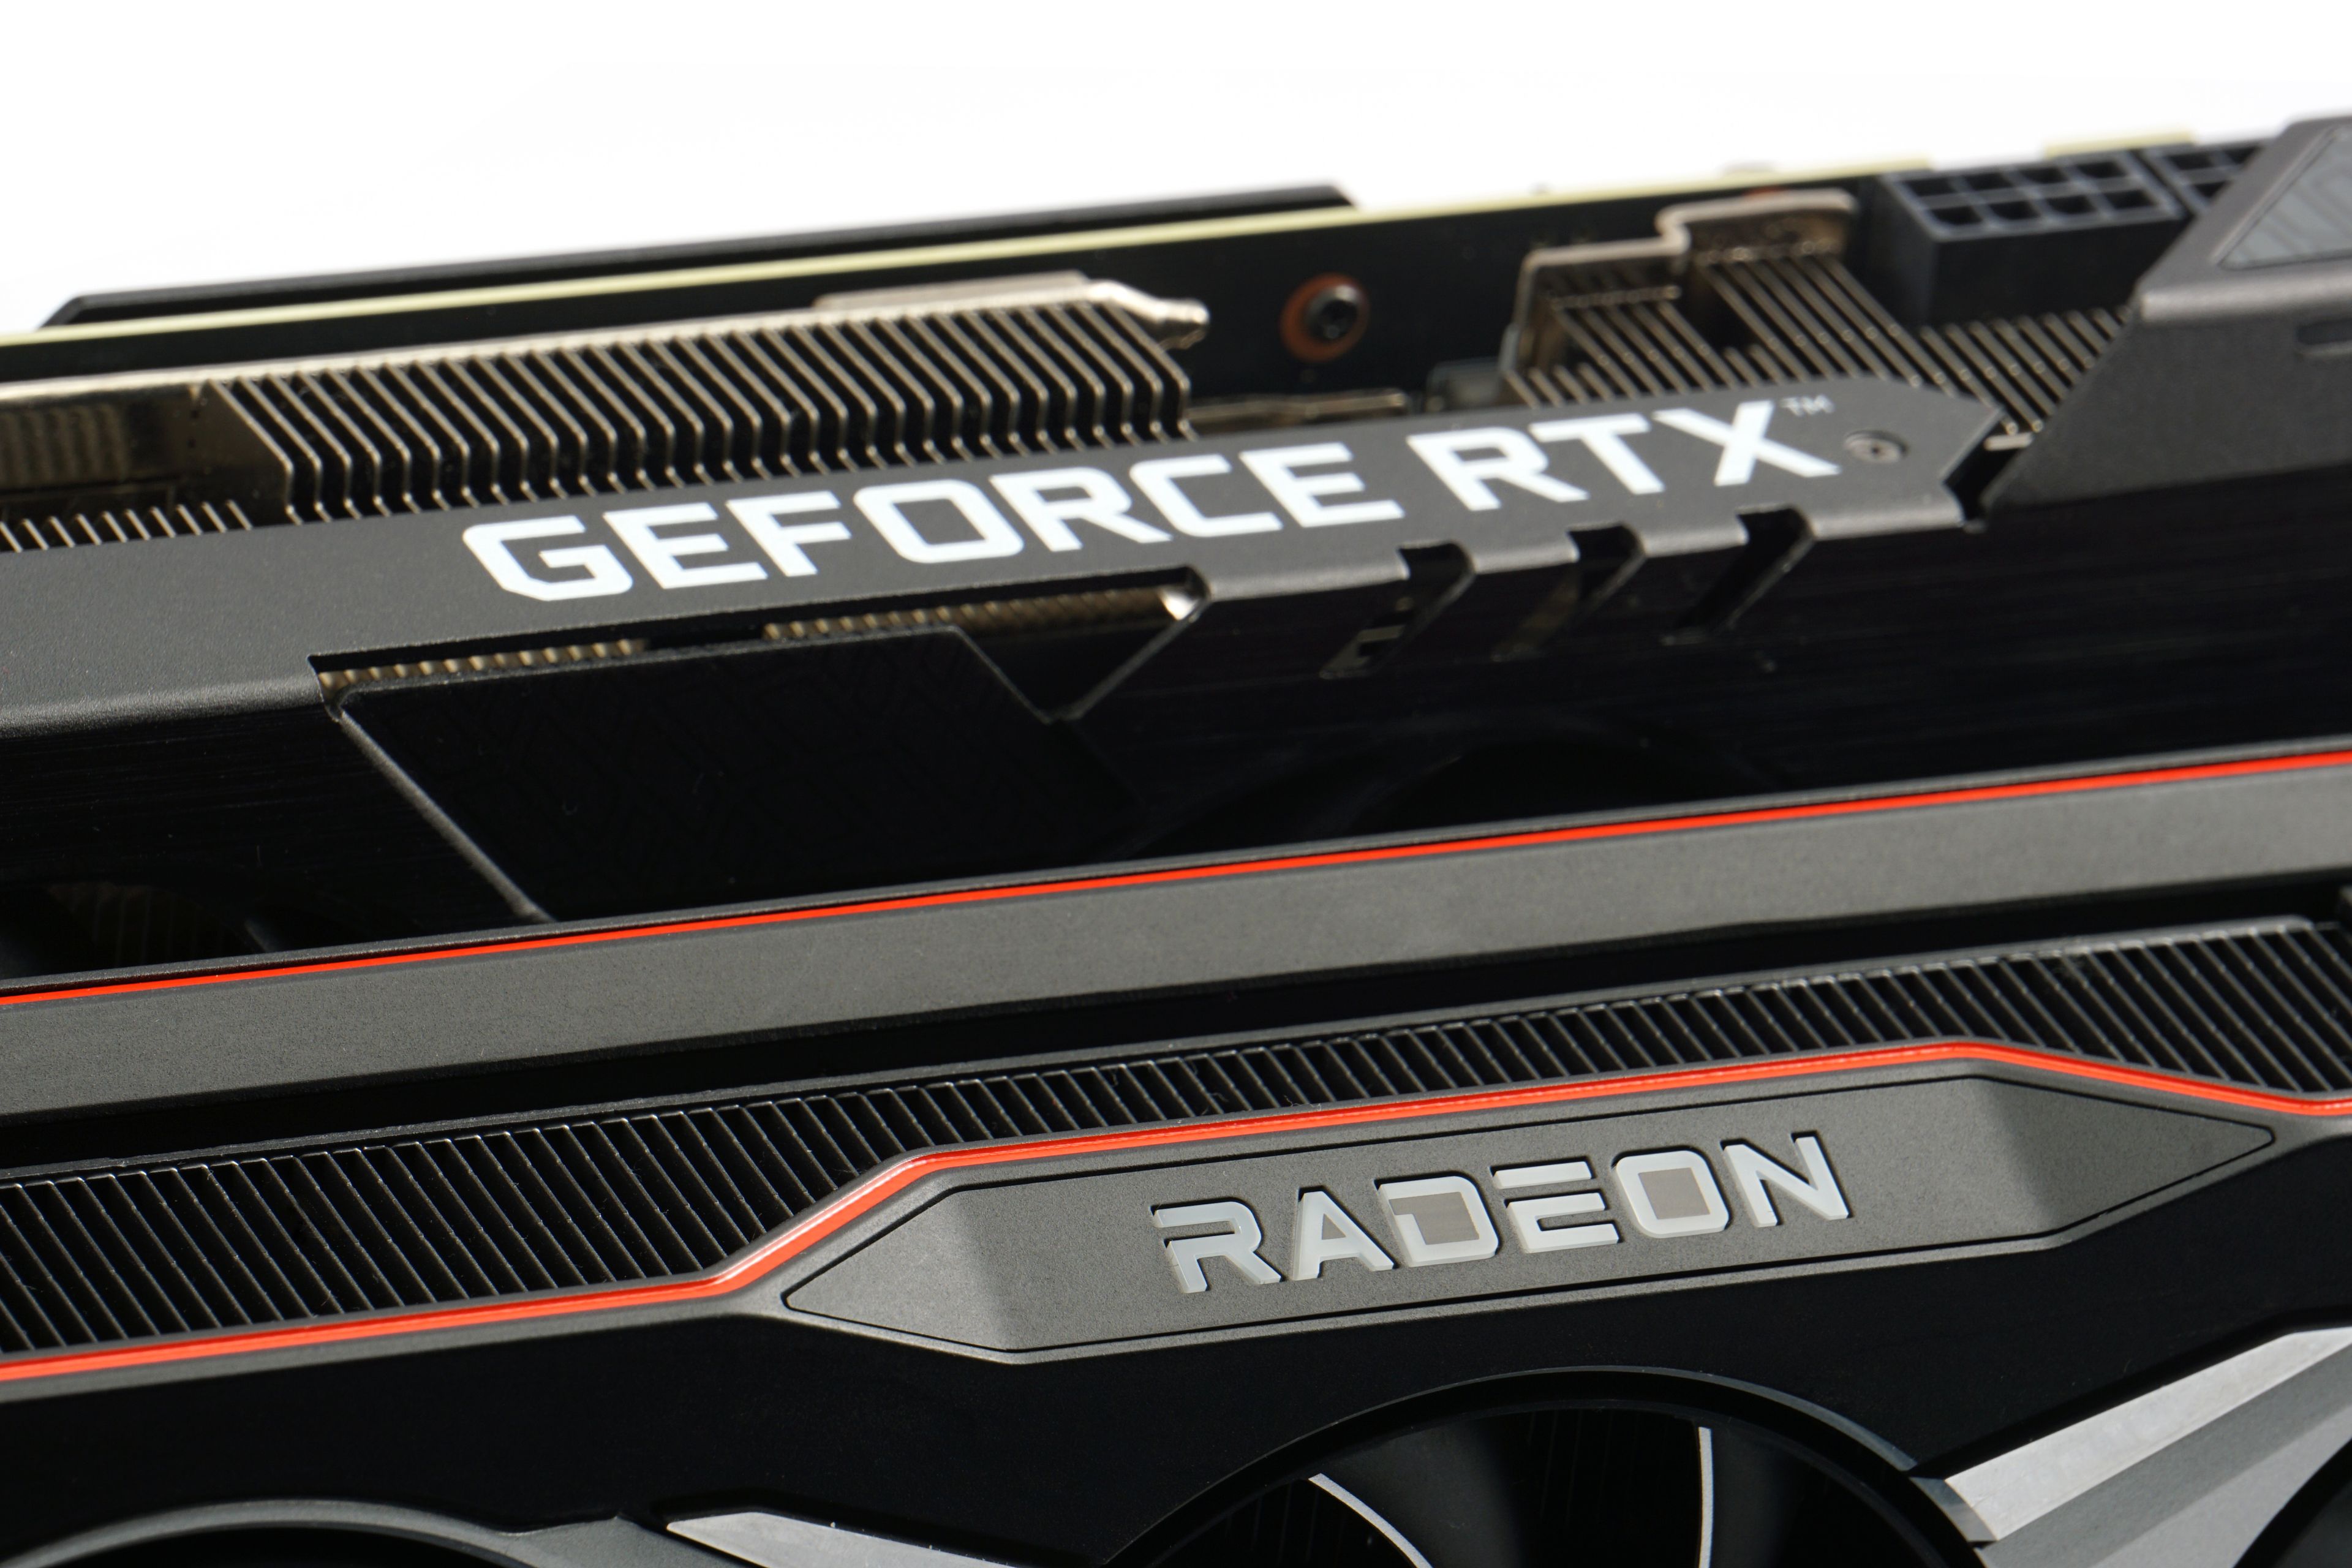
Eighteen selection games in various resolutions and settings, performance tests in computing applications, detailed analysis of power draw and generated sound, in which we go up to the level of frequency responses. This captures the new robust methodology for graphics card testing. And right at the beginning, popular high-end models from both camps are going to undergo the tests.
Frequency response of sound
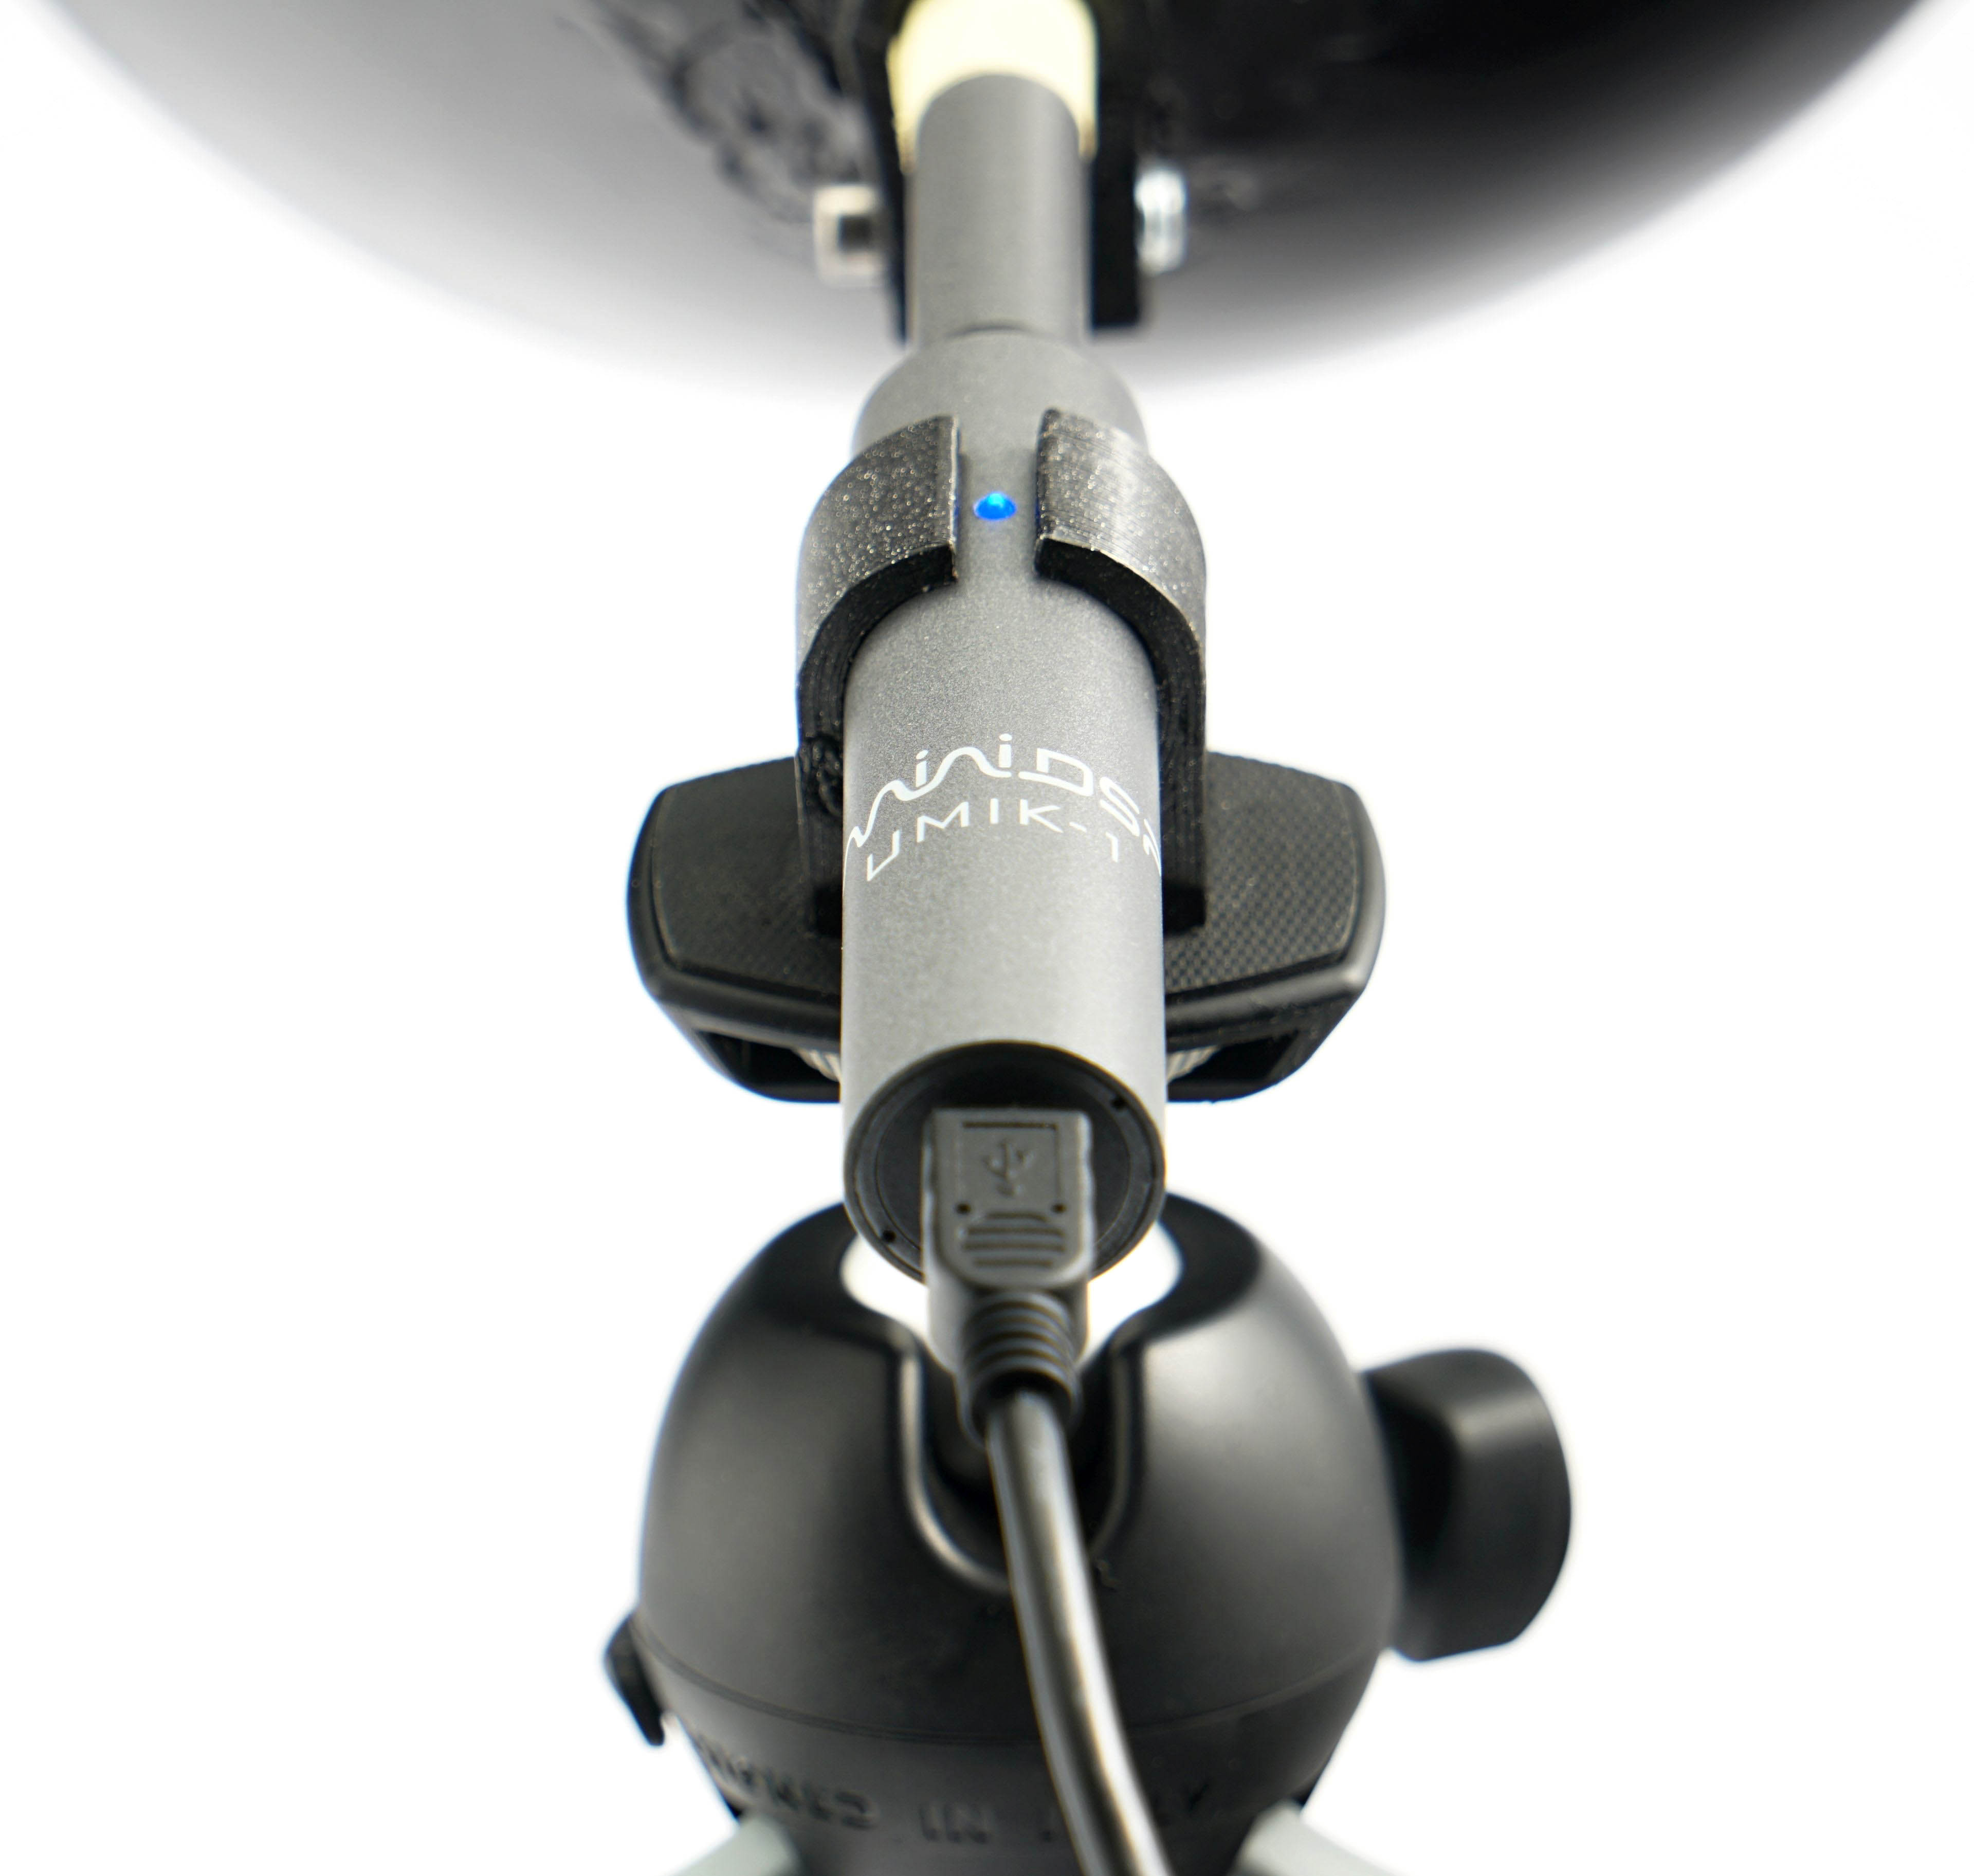
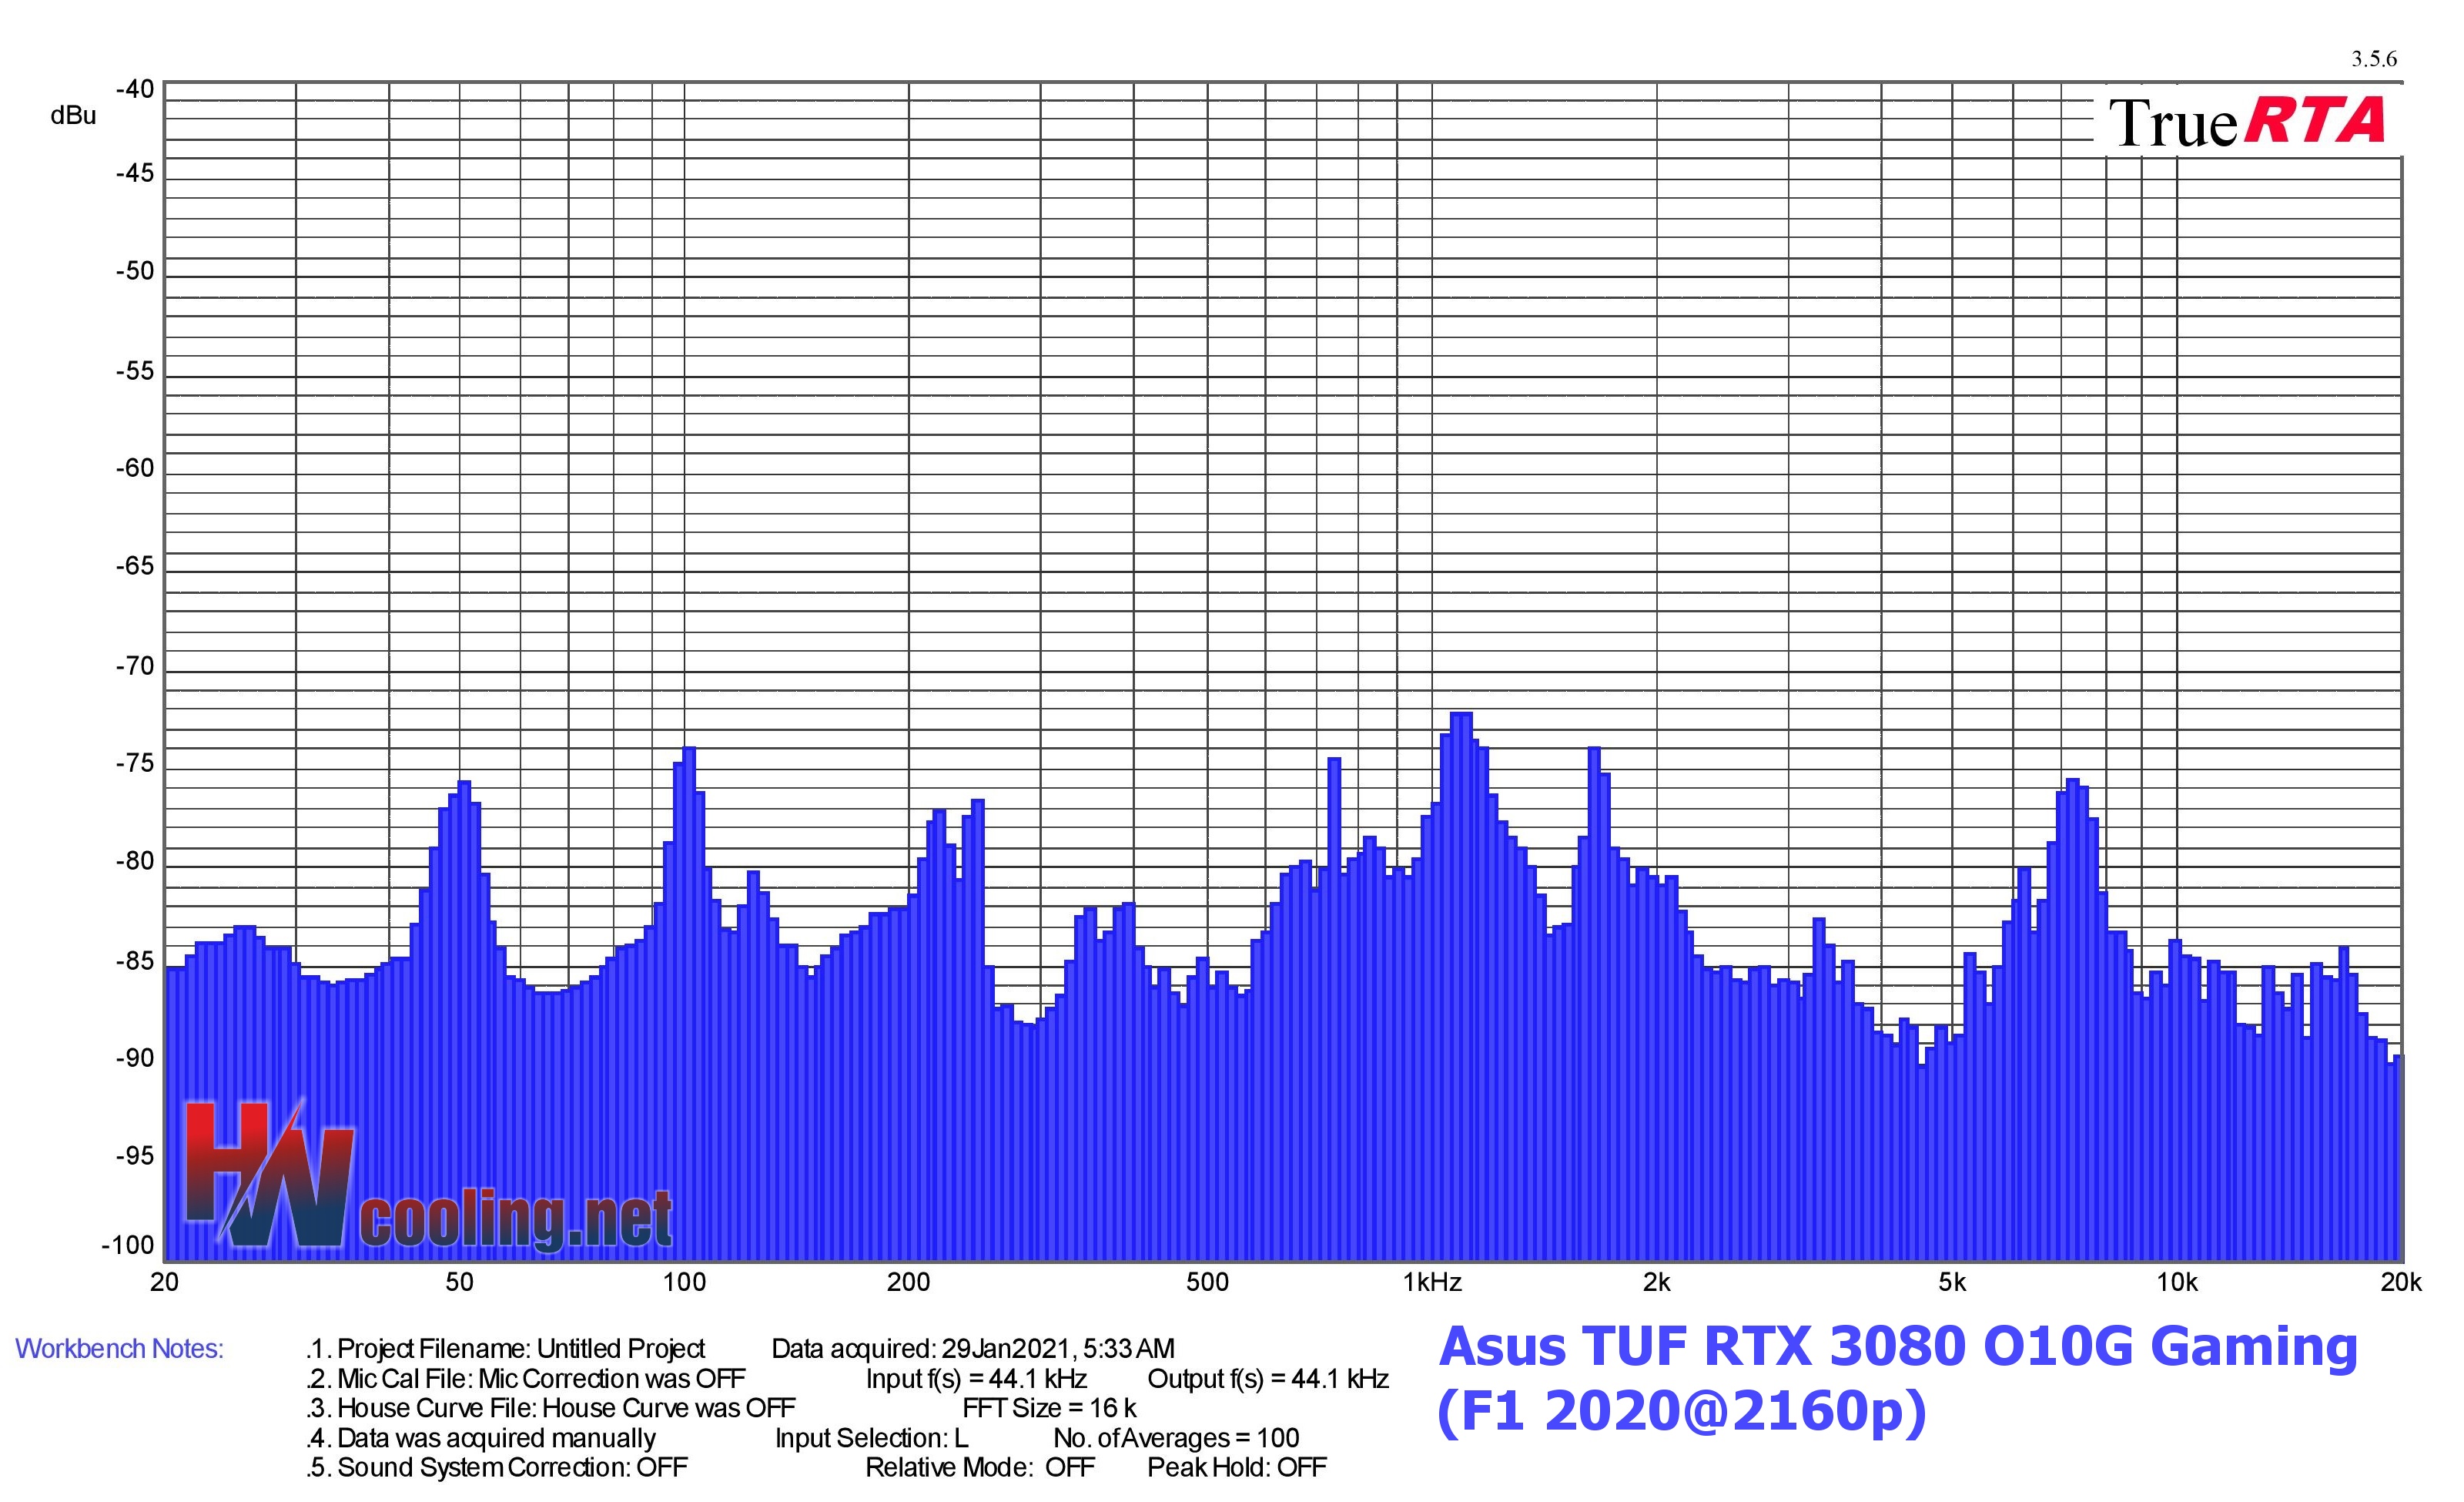
Measurements are performed in the TrueRTA application, which records sound in a range of 240 frequencies in the recorded range of 20–20,000 Hz. For the possibility of comparison across articles, we export the dominant frequency from the low (20–200 Hz), medium (201–2000 Hz) and high (2001–20,000 Hz) range to standard bar graphs. However, for an even more detailed analysis of the sound expression, it is important to perceive the overall shape of the graph and the intensity of all frequencies/tones.