We’re kicking off a round of Z890 motherboard tests loaded with the most powerful CPU for the LGA 1851 platform – the Core Ultra 9 285K. We’re doing this with Gigabyte – the Z890 Aorus Elite WiFi7 from the mid-range, or the upper mid-range, if you like… There will be competing models in a similar category later on, but now to the motherboard, which has undergone many changes from the Z790 Aorus Elite AX of the previous generation.
Herné testy…
The vast majority of tests is based on the methodology for processors and graphics cards. The choice of games is narrower with motherboards, but for this purpose there is no need for more of them. The processor we use is the Intel Core Ultra 9 285K or Core Ultra 7 265K (with the MSI MAG Z890 Tomahawk WiFi), then Core i9-13900K or on AMD platforms it’s the AMD Ryzen 9 9950X and then on older boards it’s the Ryzen 9 7950X. These processors highlight both the strengths and weaknesses of any motherboard well. In the past we have tested with two processors, including a cheaper, more low-power model, but we don’t do that anymore. The hypothesis that more expensive motherboards might give an “advantage” to cheaper processors in performance has not been confirmed, so it’s rather pointless.
We’ve selected five titles from games we’re testing in two resolutions. There are significantly fewer games than in the CPU or graphics card tests, but these are just enough for the motherboard tests. Few people consider performance in a particular game when choosing a motherboard. But an indicative overview of which motherboard shapes gaming performance in what way (compared to another motherboard) is necessary. To avoid significant discrepancies over time, we’ve reached for relatively older titles that no longer receive significant updates.

These are Borderlands 3, F1 2020, Metro Exodus, Shadow of the Tomb Raider and Total War Saga: Troy. With newer games, there might be some performance changes over time (updates) and especially in high resolutions with high details. This is one of the test setups (2160p and Ultra, or the highest visual detail but without ray-tracing graphics) that focuses on comparing performance, for which the bottleneck is the graphics card. In other words, it will be clear from these tests which motherboard can affect the performance of which graphics card to what extent for any reason. In contrast, a setup with Full HD resolution and with graphical details reduced to “High” will also reflect the CPU’s contribution to the final gaming performance.
We use OCAT to record fps, or the times of individual frames, which are then used to calculate fps, and FLAT to analyze the CSV. The developer and author of articles (and videos) for the GPUreport.cz website is behind both.
For the highest accuracy, all runs are repeated three times and average values of average and minimum fps are displayed in the graphs. These multiple repetitions also apply to non-game tests.
… Computing tests, SSD tests, USB ports and network tests
We test application performance in a very similar way to the processor tests. Almost all tests are included, from the easier ones (such as those in a web environment) to those that push the CPU or graphics card to the limit. These are typically tests such as 3D rendering, video encoding (x264, x265, SVT-AV1) or other performance-intensive computing tasks. As with processors or graphics cards, we have a wide range of applications – users editing video (Adobe Premiere Pro, DaVinci Resolve Studio), graphic effects creators (Adobe Premiere Pro), graphic designers or photographers (Adobe Photoshop and Lightroom, Affinity Photo, AI applications Topaz Labs, …) will find their own in the results, and there are also tests of (de)encryption, (de)compression, numerical calculations, simulations and, of course, tests of memory.

SSD performance tests are also important for motherboards. Therefore we test the maximum sequential read and write speeds on an empty Samsung 980 Pro SSD (1 TB) in the well distributed CrystalDiskMark, in all slots. We approach the USB port tests in the same way. We use a WD Black P50 external SSD to test them. It supports fast USB 3.2 gen. 2×2, so it won’t be a bottleneck for even the fastest USB controllers. We report only one result for each USB standard. This is calculated from the average of all available ports.
We won’t deprive you of network bandwidth tests either. We move large files in both directions within a local network between the motherboard network adapters and the Sonnet Solo10G 10-gigabit PCIe card. This from the aforementioned Samsung 980 Pro SSD to the Patriot Hellfire (480 GB), which is still fast enough to not slow down even the 10 Gb adapter.
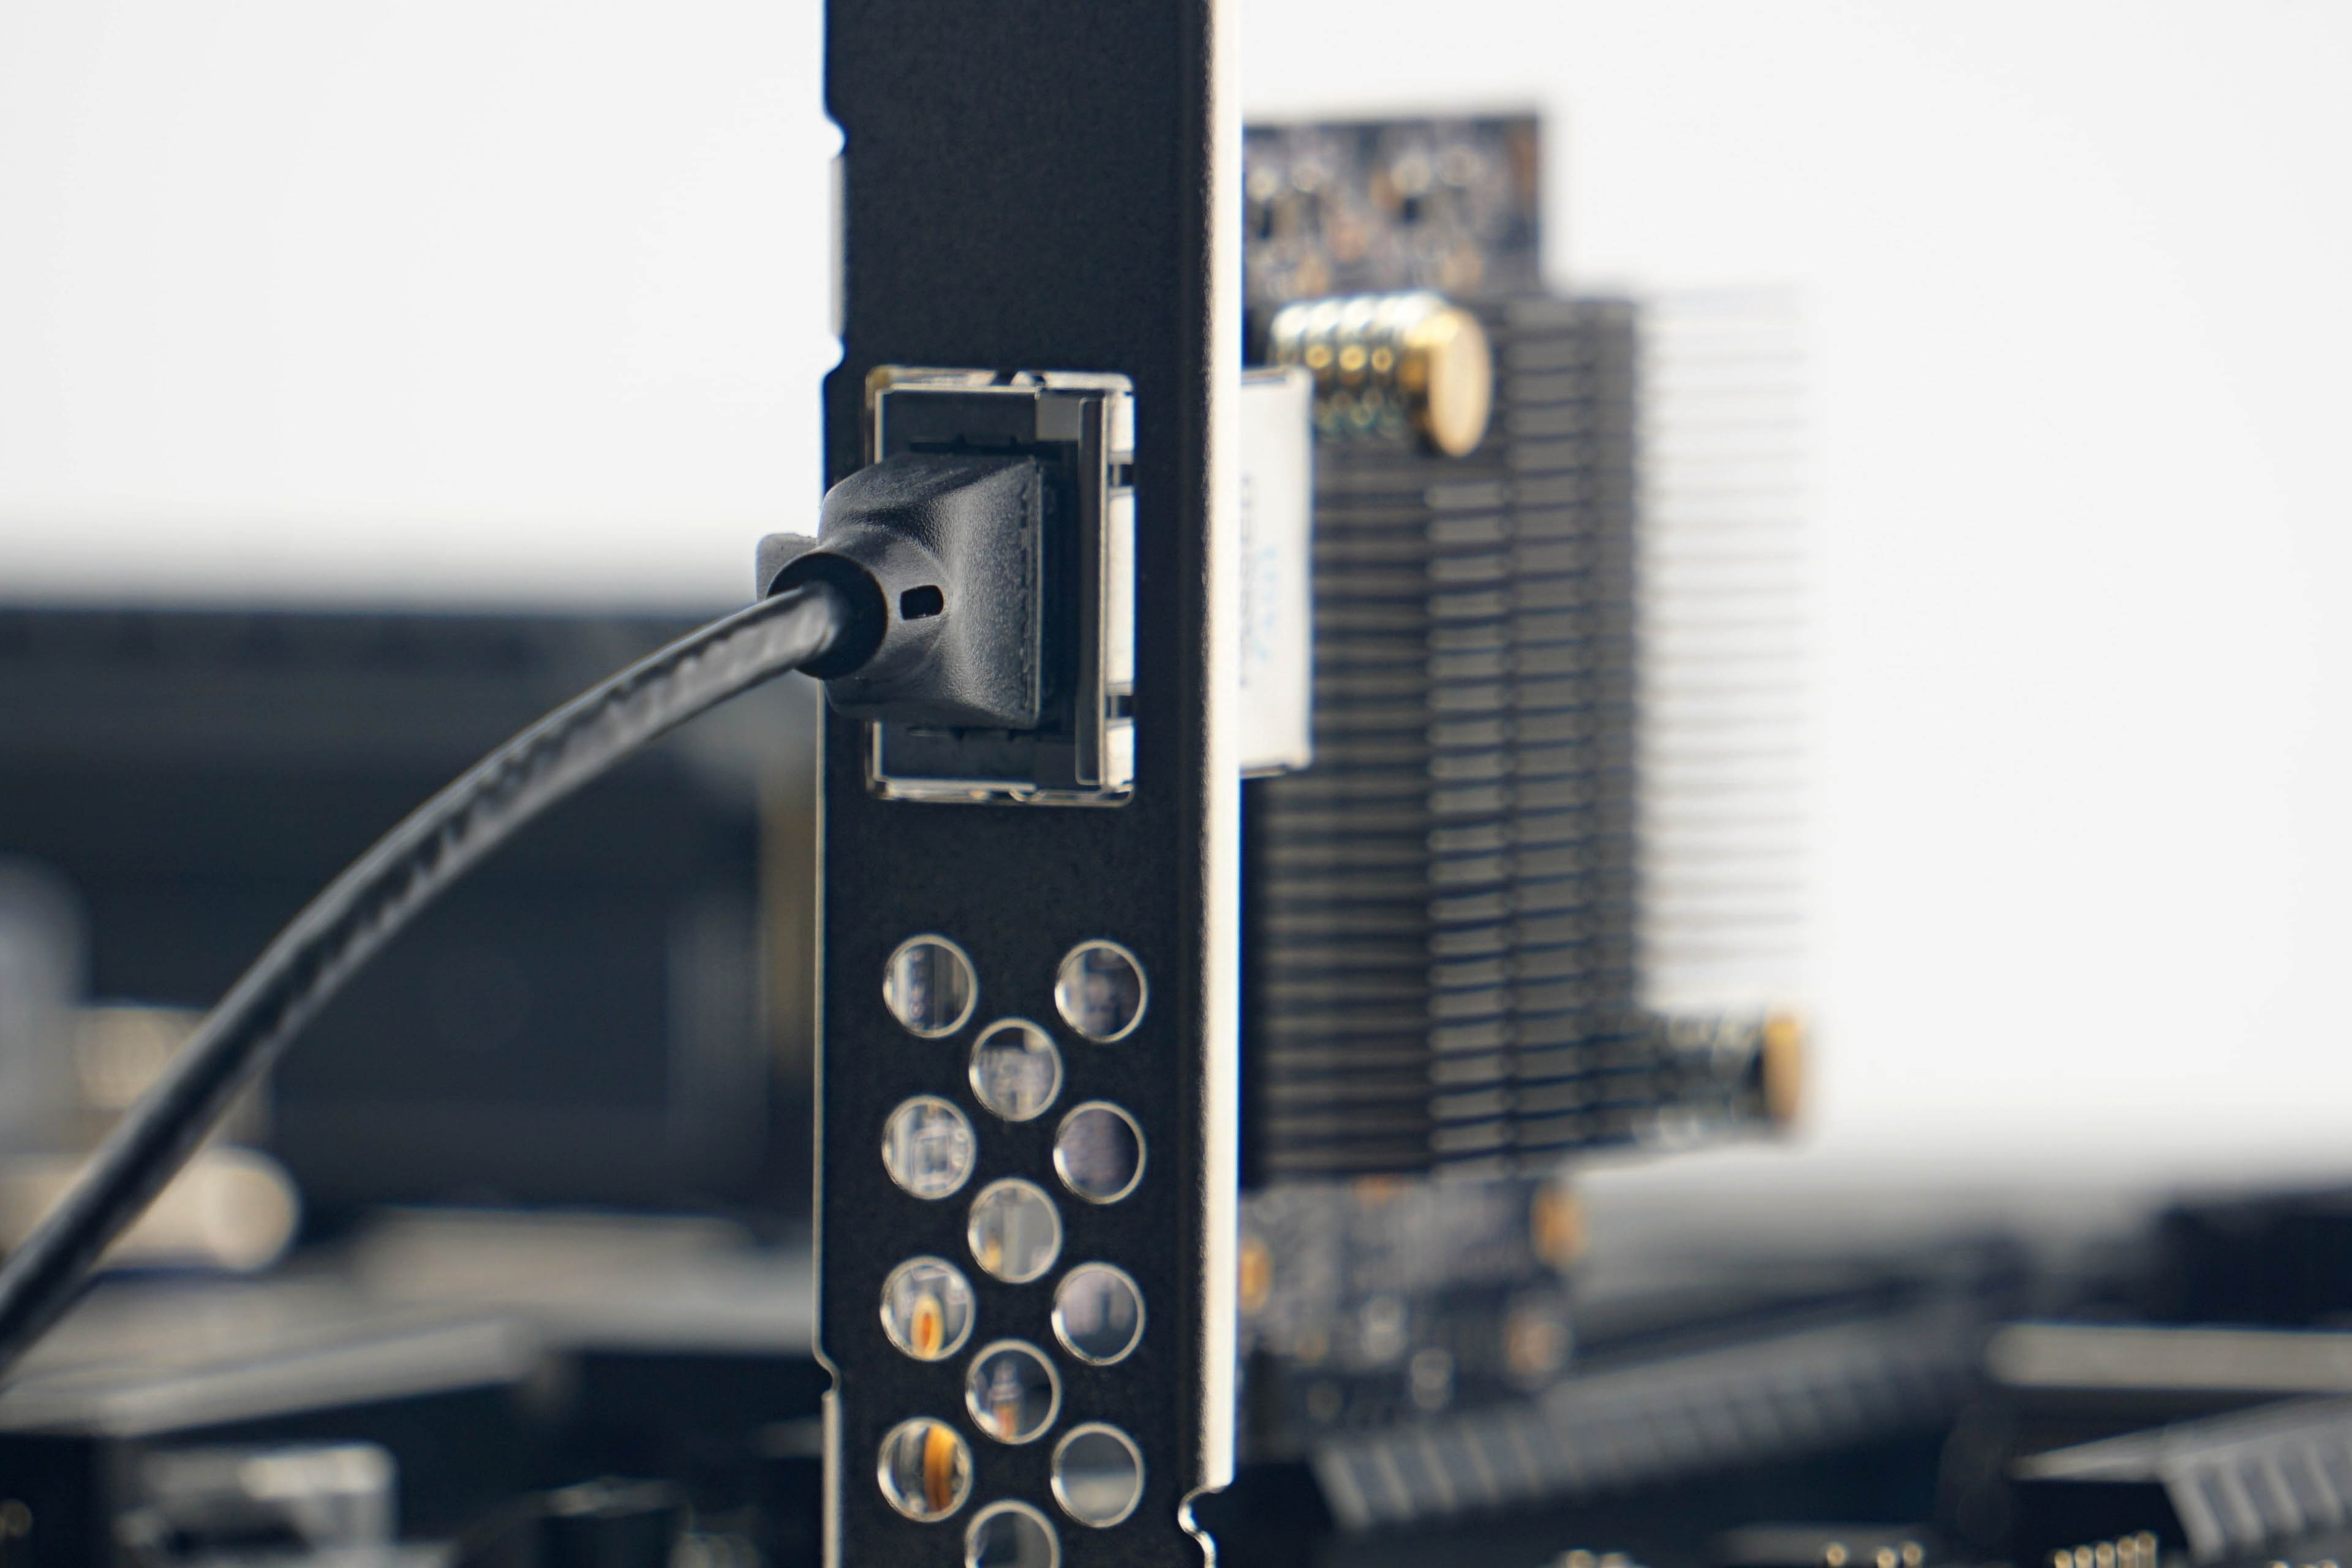
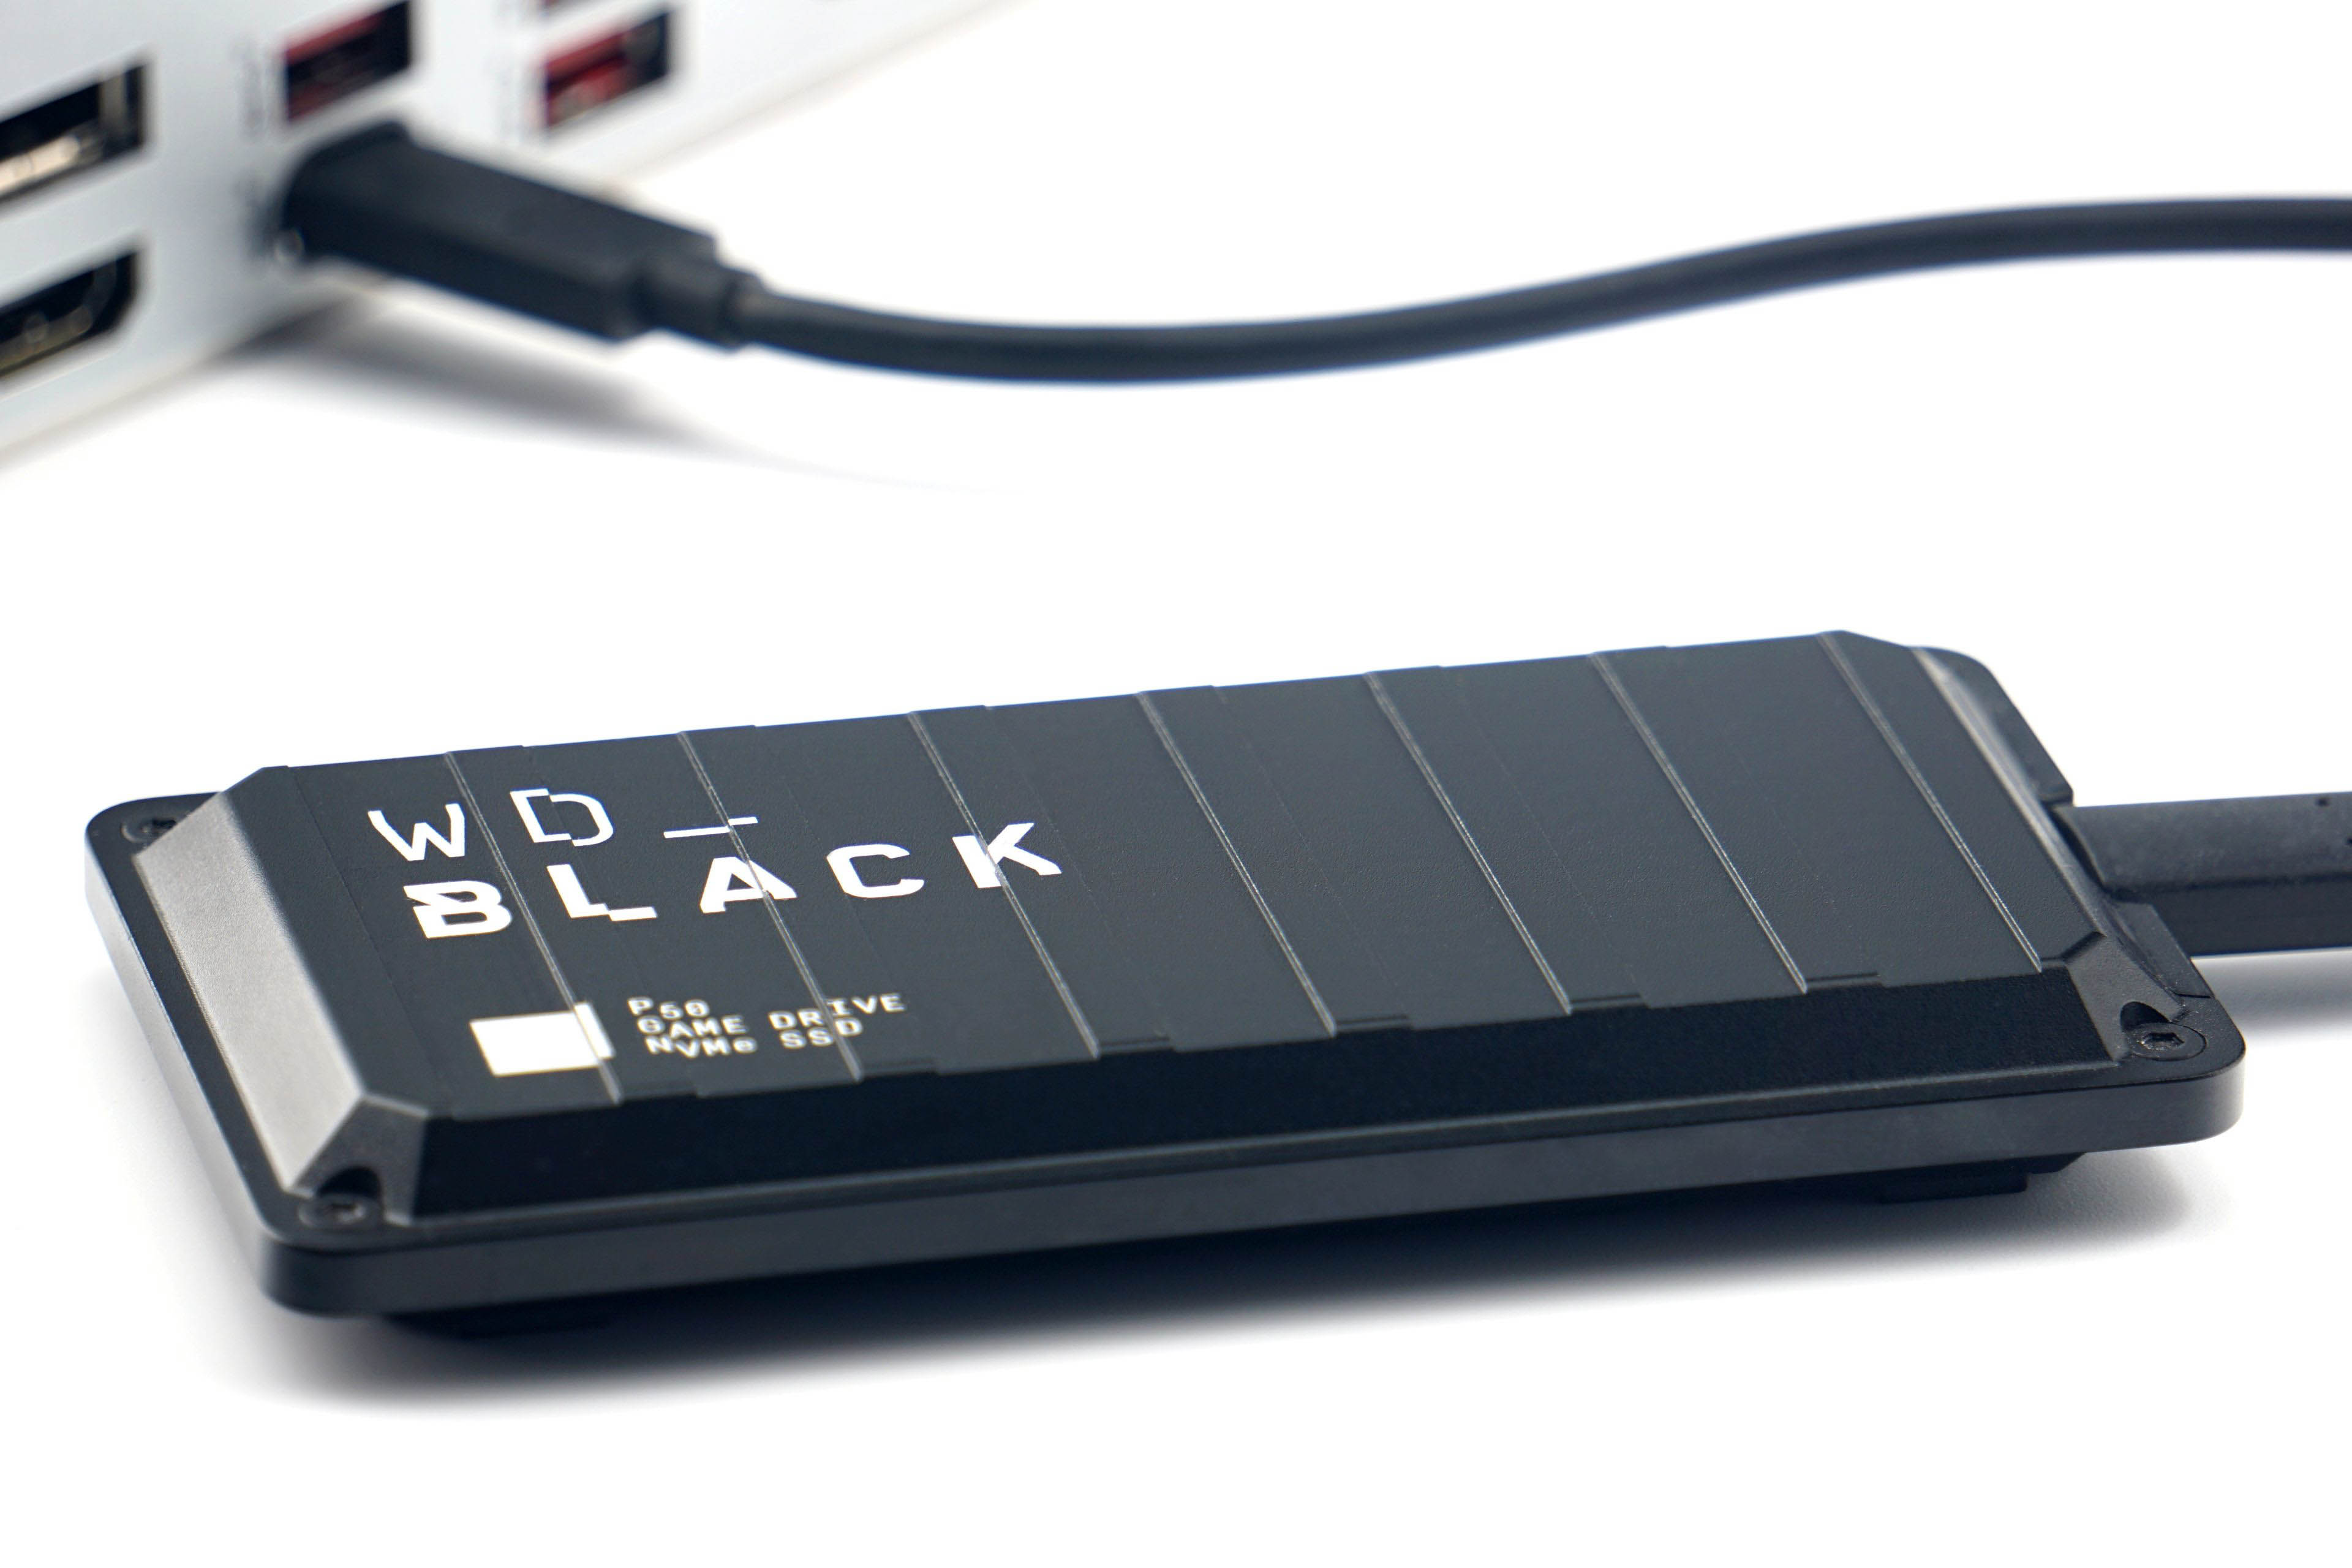
The results of all performance tests are averaged over three repeated measurements for high accuracy.
CPU settings…
We primarily test processors without power limits, the way most motherboards have it in factory settings. For tests that have an overlap with power, temperature and CPU clock speed measurements, we also observe the behavior of boards with a power limit according to Intel’s recommendations, where we set PL1 to the TDP level (125 W) while respecting the Tau timeout (56 s). The upper limit of the power supply (PL2/PPT) is set in the BIOS according to the official values. For the Core i9-13900K it is 253 W, for the Core i9-12900K it is 241 W. Aggressive overclocking technologies such as PBO2 (AMD) or MCE (Asus) and similar are not covered in standard motherboard tests.
… and application updates
Tests should also take into account that over time, individual updates may skew performance comparisons. Some applications we use in portable versions that do not update or can be kept on a stable version, but for some this is not the case. Typically games get updated over time, which is natural, and keeping them on old versions out of reality would also be questionable.
In short, just count on the fact that the accuracy of the results you are comparing with each other decreases a bit as time goes on. To make this analysis easier, we’ve listed when each board was tested. You can find this out in the dialog box, where you can find information about the date of testing. This dialog is displayed in the interactive graphs, next to any result bar. Just hover over it.