We recently looked at different profiles in AMD Software, and today we’ll dive deeper into adjusting the fan control settings in more detail. First, we’ll test how fan performance affects the card’s behavior across the entire working range of fan speeds. Then we’ll focus on how fan control behavior differs between automatic and manual fan-speed settings, and on how to set the fan-control curve settings for the card.
As an introduction, let’s recap how the Fan Speed setting, which is on the horizontal axis in the graph below, affects the card’s noise level (orange data series and left axis) and the fan speed (blue data series and secondary right axis).

To see how fan performance influences the card’s operational characteristics, I will first try to measure it across the entire configurable range of their performance.
Due to time constraints, I will use short loops of the Cyberpunk benchmark with the RT Medium profile and a resolution of 3840 × 2160 with DLAA. Before the entire batch, one warm-up loop runs with four passes and the fan performance set to 45%. This is not in the graphs; they start with the first actual measurement.
I had to start from the opposite end than I usually do with GeForce cards. The test system would hard-shut down with the Radeon at low fan speeds and insufficient chip cooling under load. So I’m starting at 100% fan performance and will gradually reduce their performance by 5% until it shuts down. The fan performance can be lowered to 20%, but that’s already insufficient for cooling, so we’ll stop a bit higher.
I will read the measured values from the fourth loop.
In this chapter, we will only look at simple graphs showing the overall progression with the change in fan performance; in the next chapter, you will find detailed interactive graphs for each measured setting and the specific measured values.
The first graph shows the measured temperatures. In red is the average temperature from selected GPU sensors, yellow is the memory chip temperature, and the highest orange is the GPU hotspot temperature (the highest value measured by the sensors on the GPU).

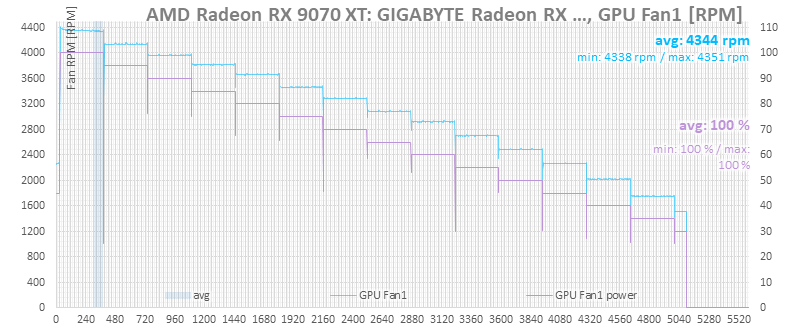
The next graph shows the fan speed on the light blue data series. The fans were controlled by the card, with their performance set manually via the Fan Control application.
At 100% performance, the fans run at nearly 4400 RPM; at 30% performance, they run around 1400 RPM and are no longer sufficient to cool the card. Detailed values for each setting are in the graphs in the next chapter.
The next graph shows temperatures (in red) and overall CPU utilization (in blue). The fans on the graphics card also affect airflow within the case. With their higher performance, airflow in the case is more intense; as their speed decreases, the CPU temperature gradually increases slightly.

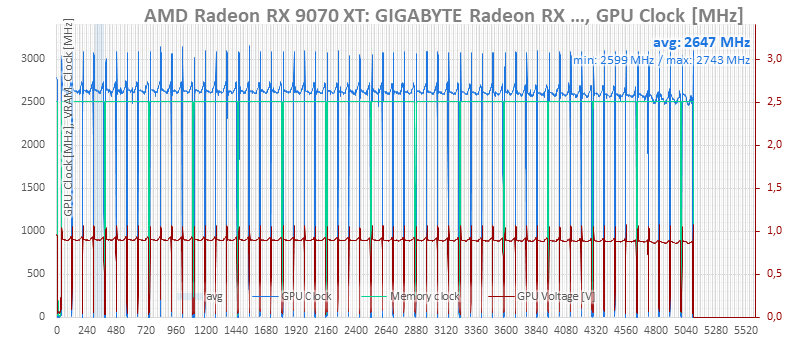
Frame rates in games don’t change dramatically until the point where the card starts to significantly throttle the GPU clock due to overheating towards the end. But this will be better visible in the next chapter.

The drop is more visible on the GPU clock than on the performance. At the beginning, where the card was already starting to overheat, more significant clock drops are visible. Between 100% and around 40% fan performance, the difference in clocks is only small.
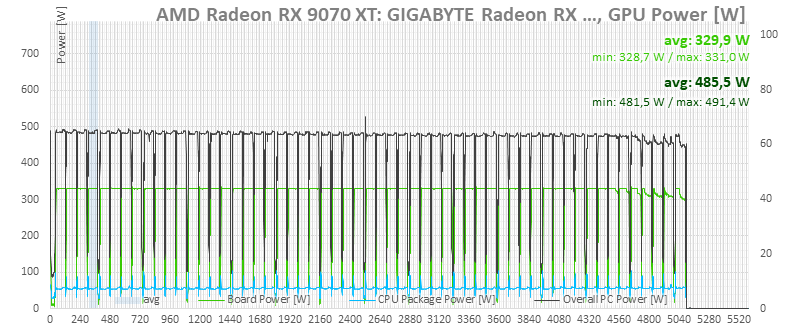
For reference, we also have graphs of power consumption for the entire system and for the card itself according to monitoring. On the light green line indicating the card’s total power draw according to monitoring, it’s visible for a long time that the card is running at its power limit; only in the final three test loops does the power consumption start to be throttled due to high hotspot temperatures.
⠀